Friday, July 24, 2026
Home Blog Page 23

ES Morning Update March 27th 2024

2

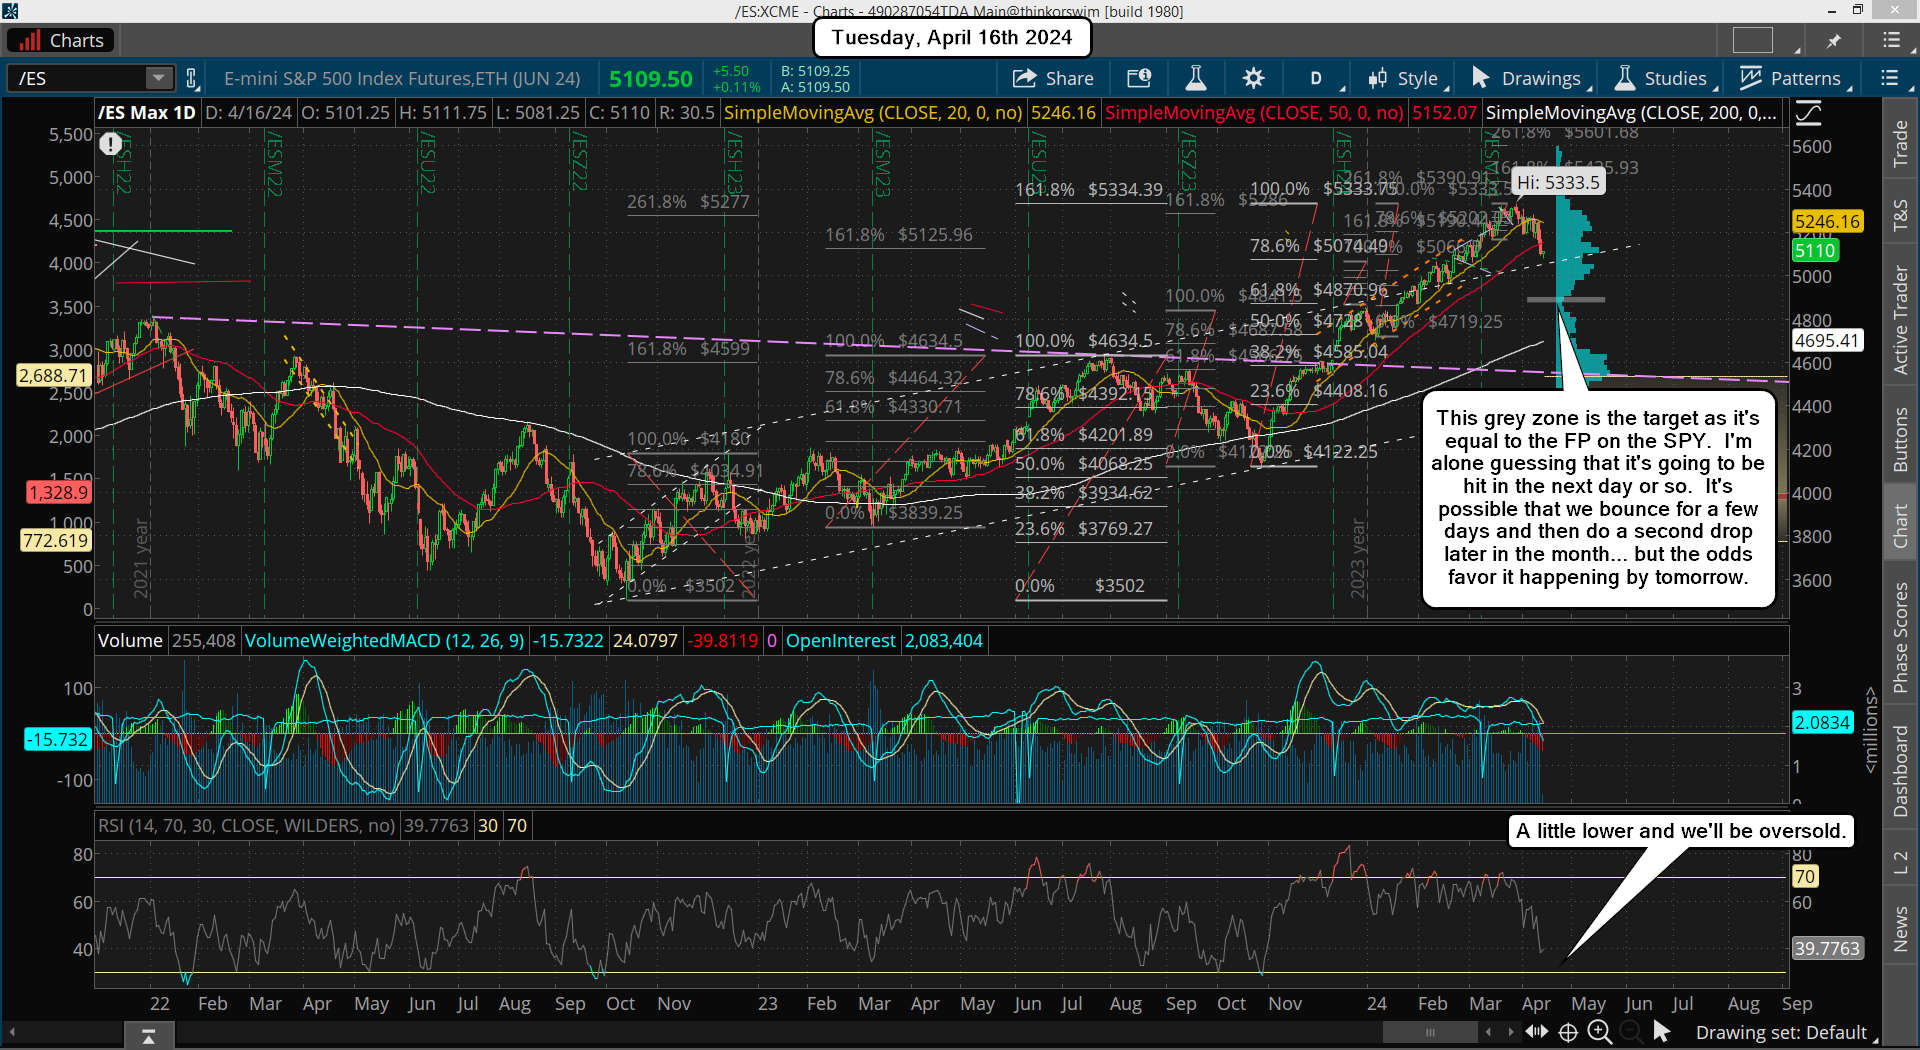
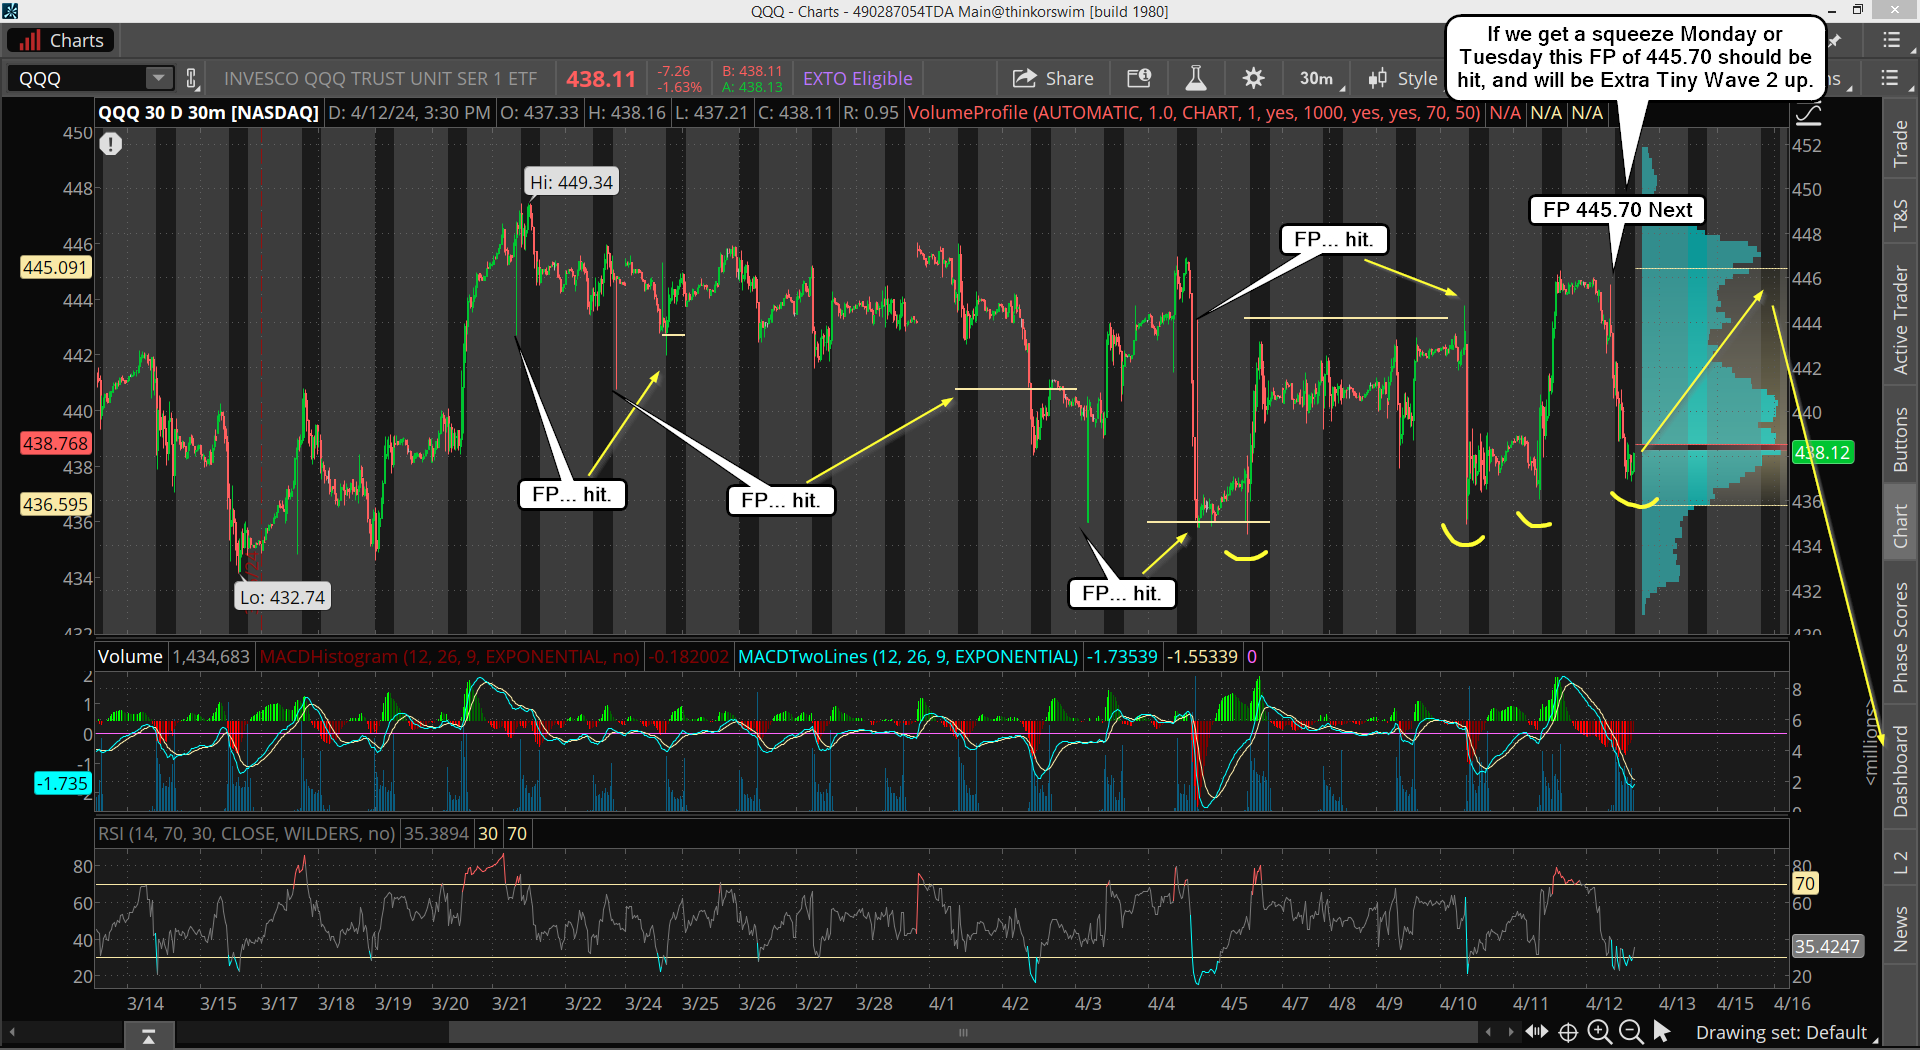
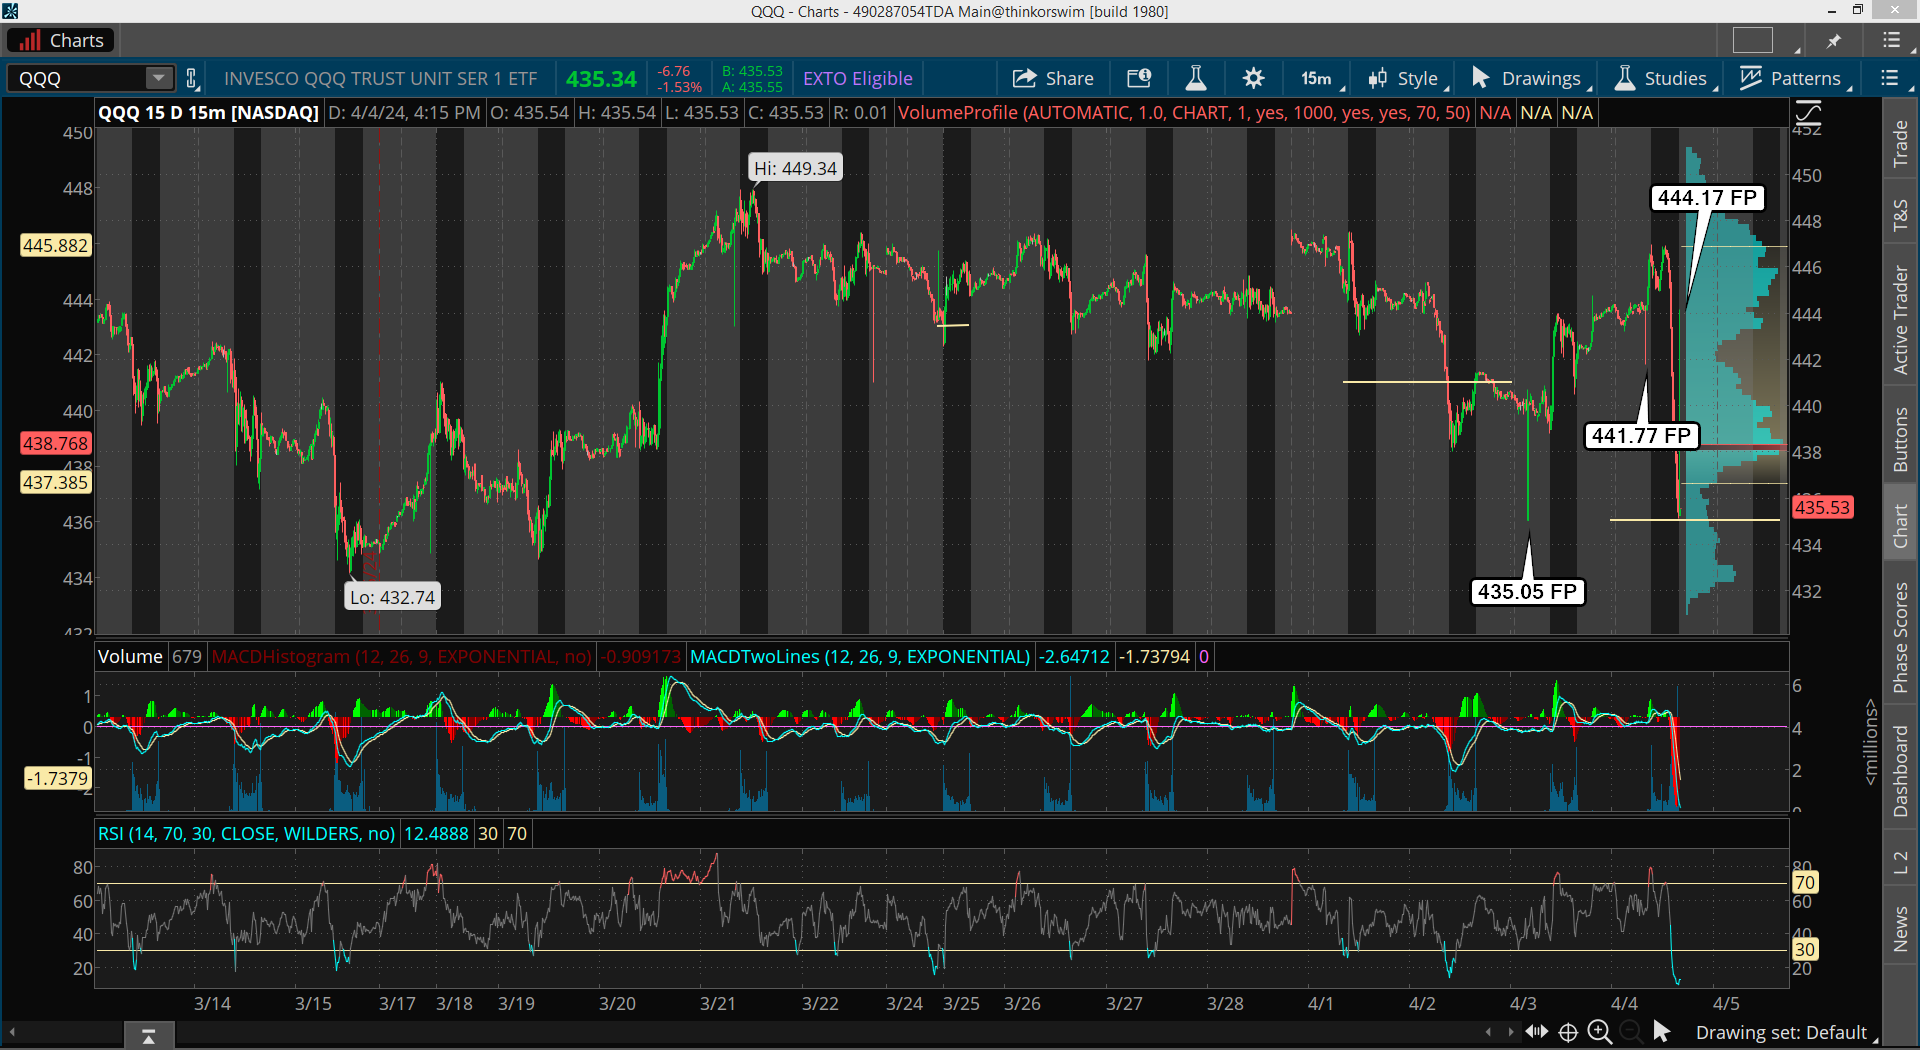
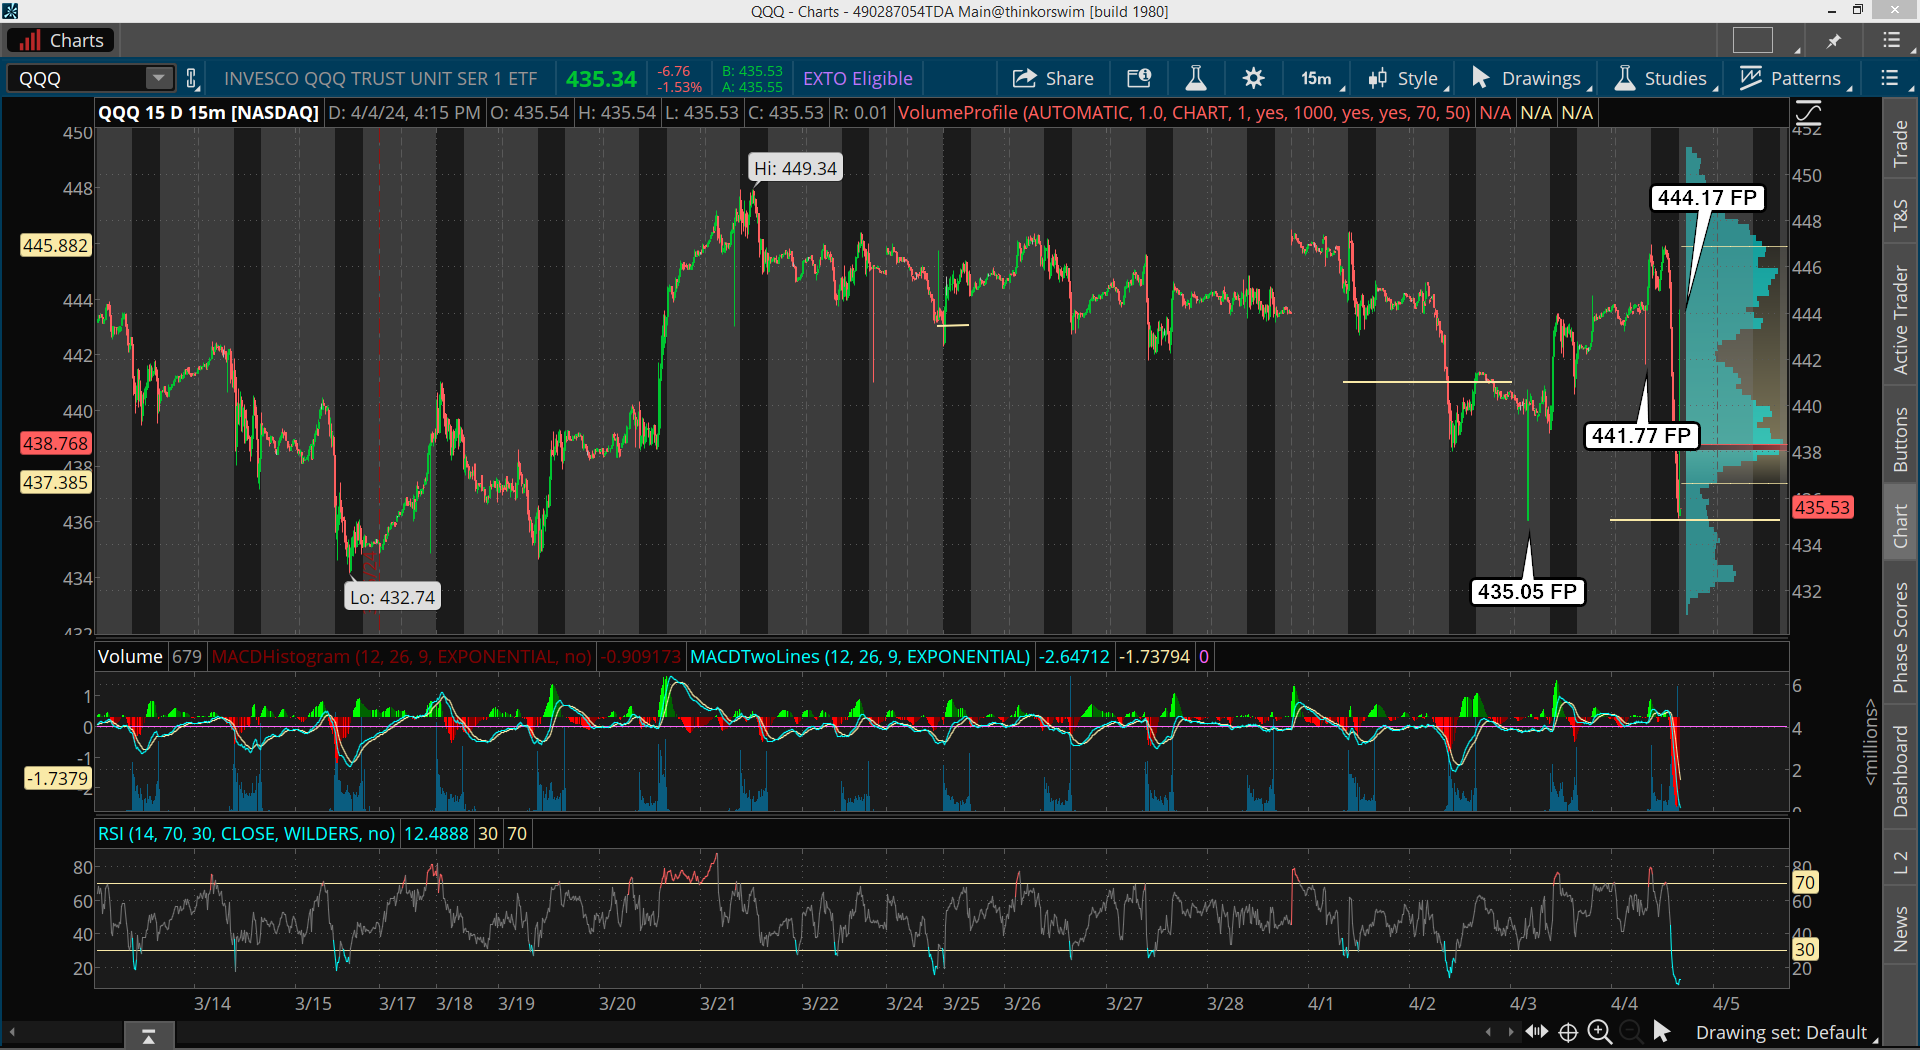
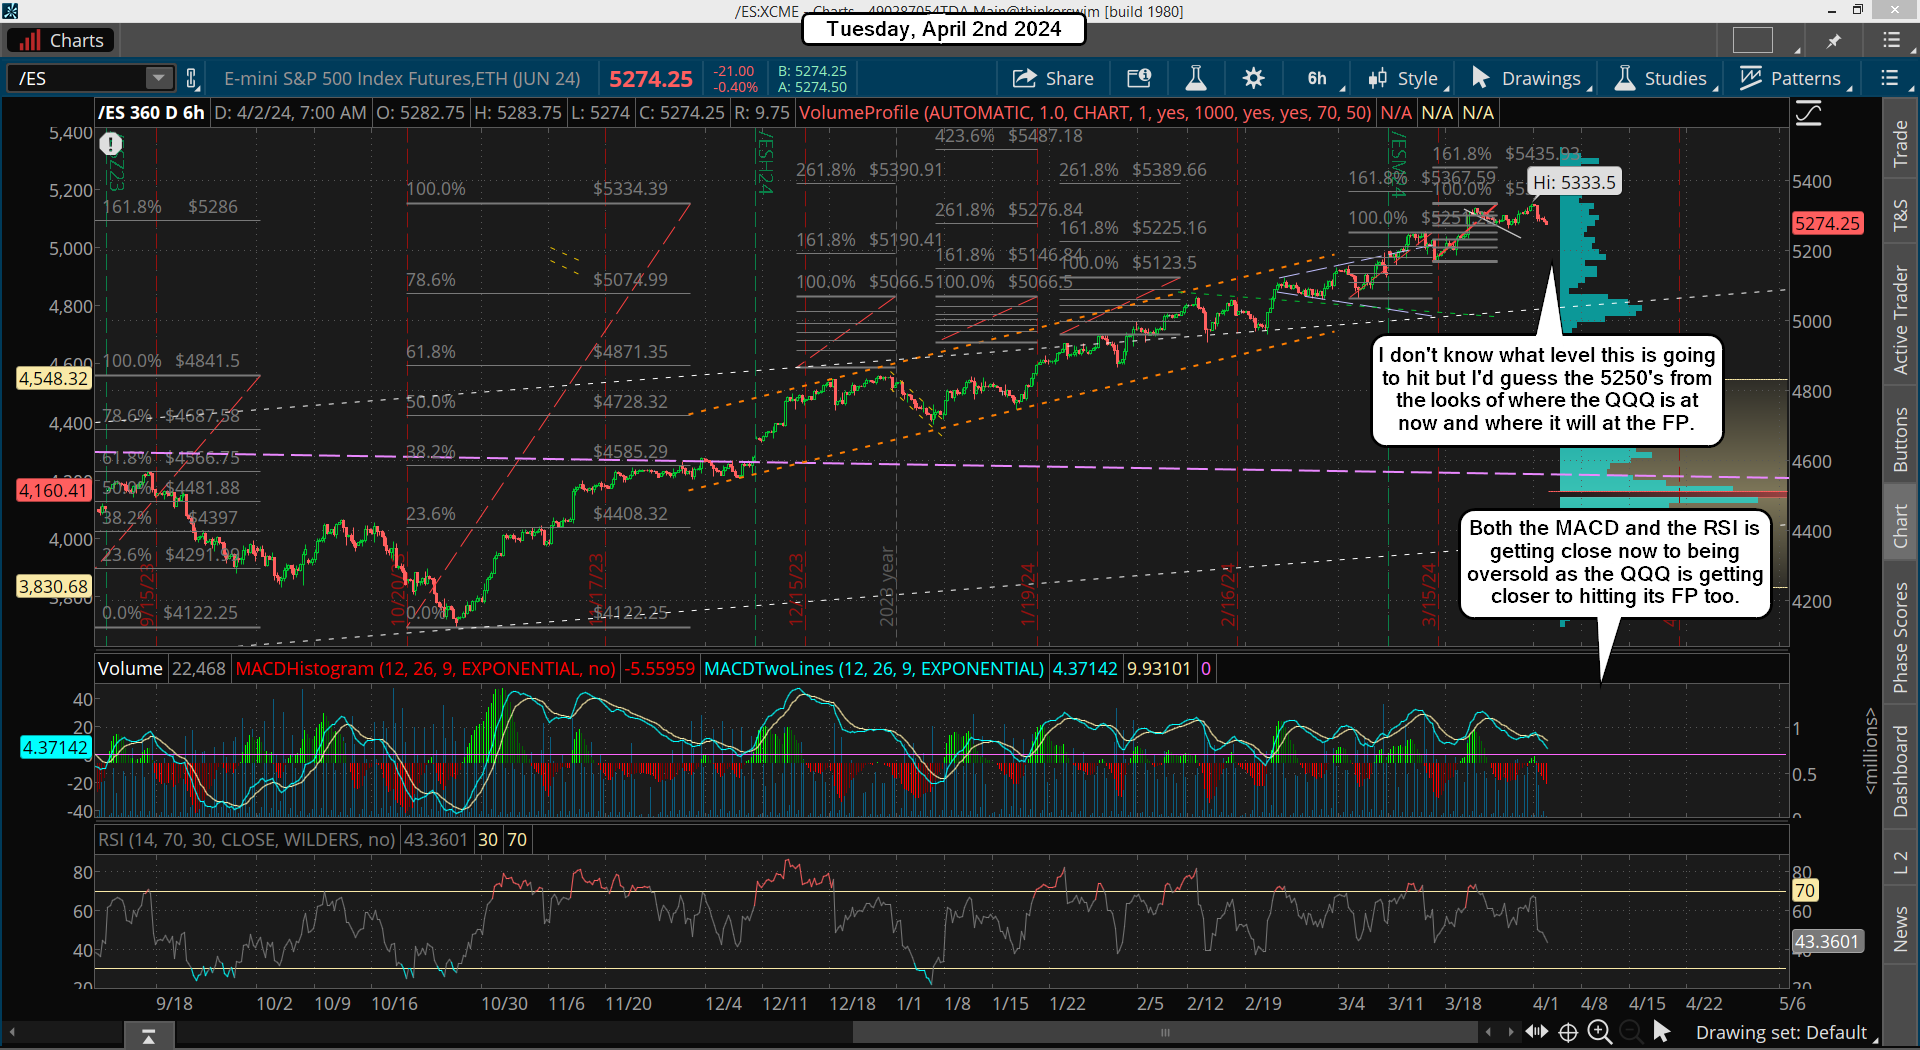
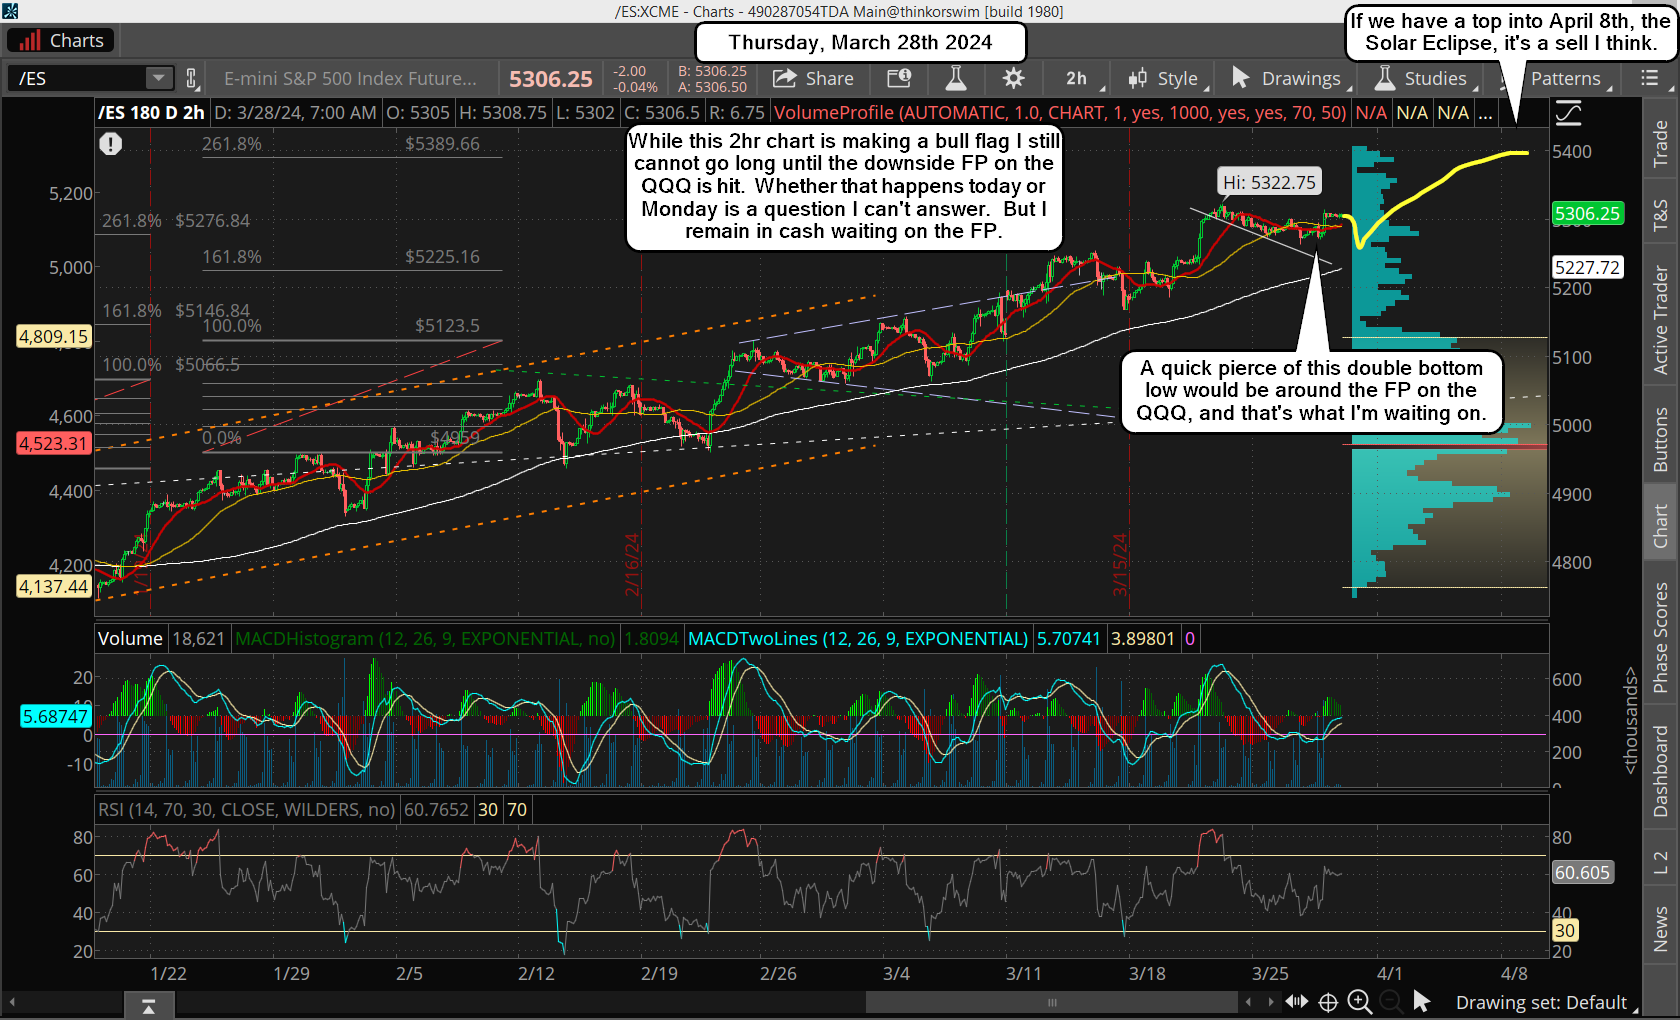
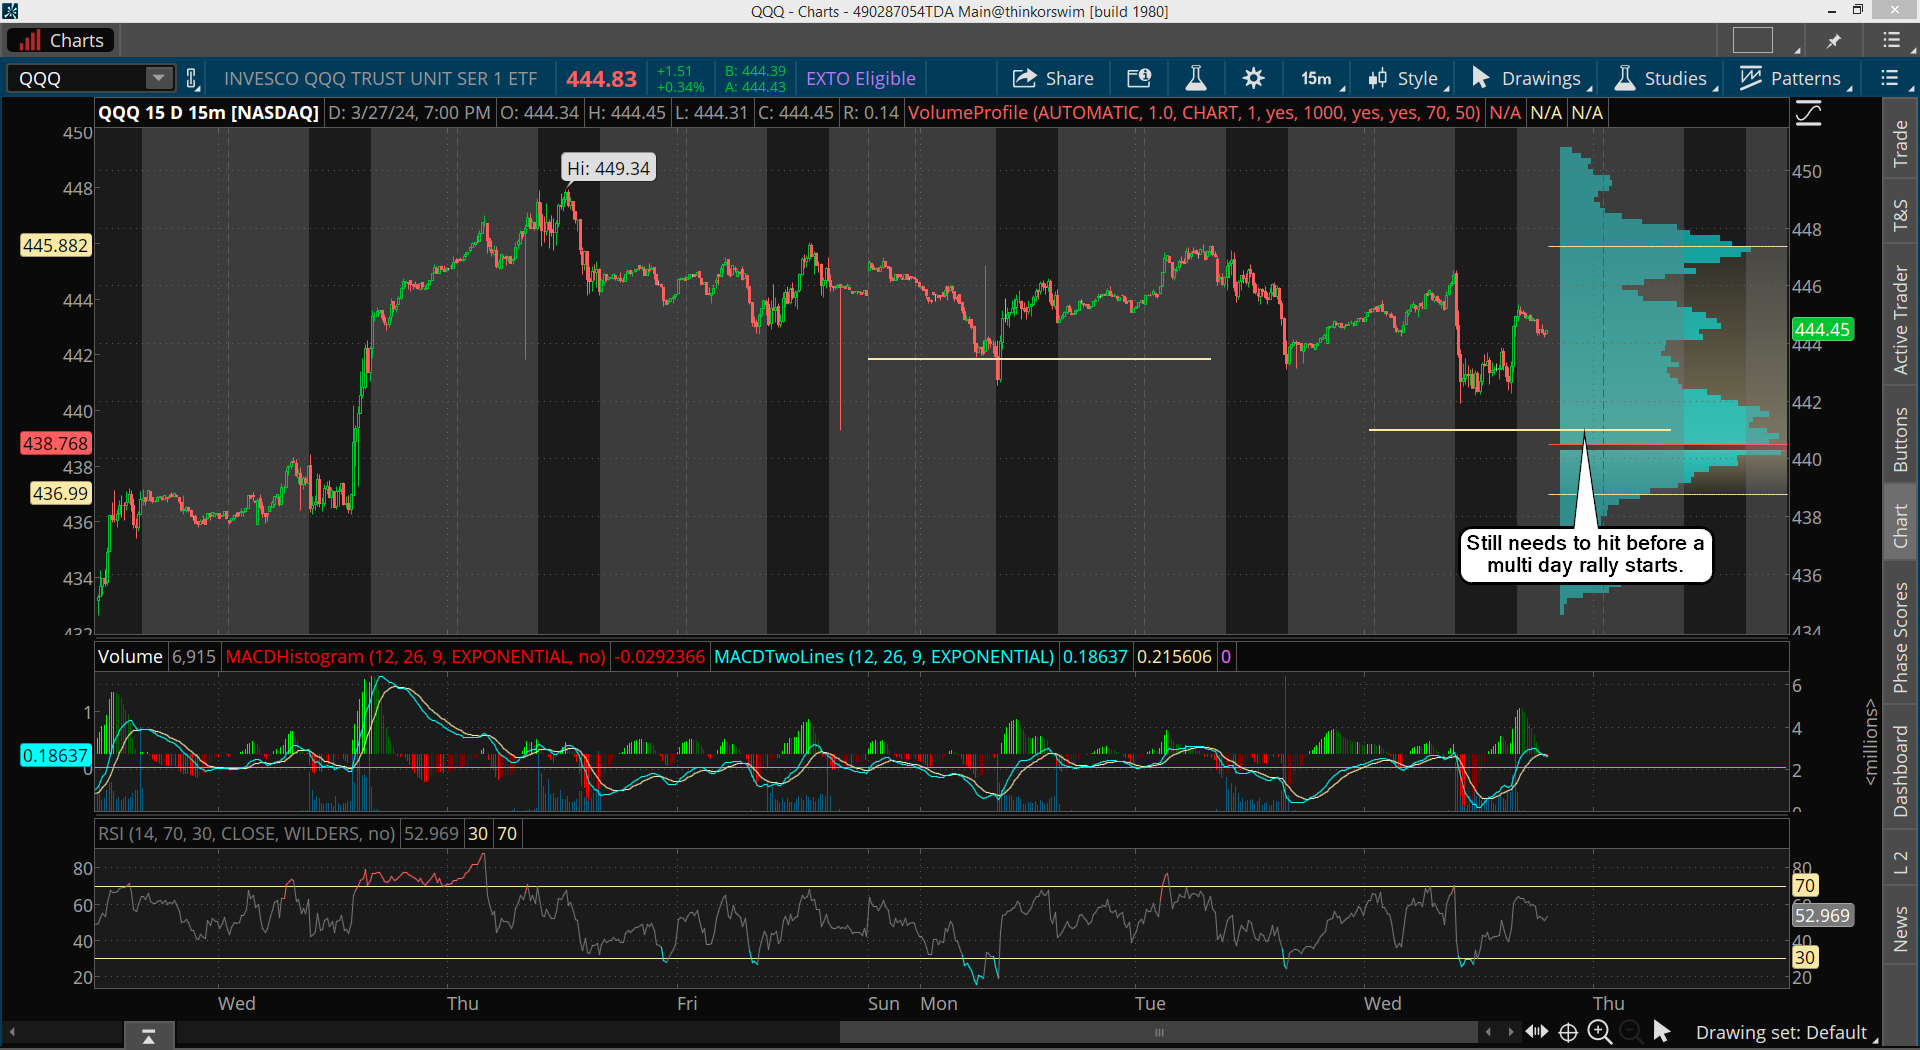
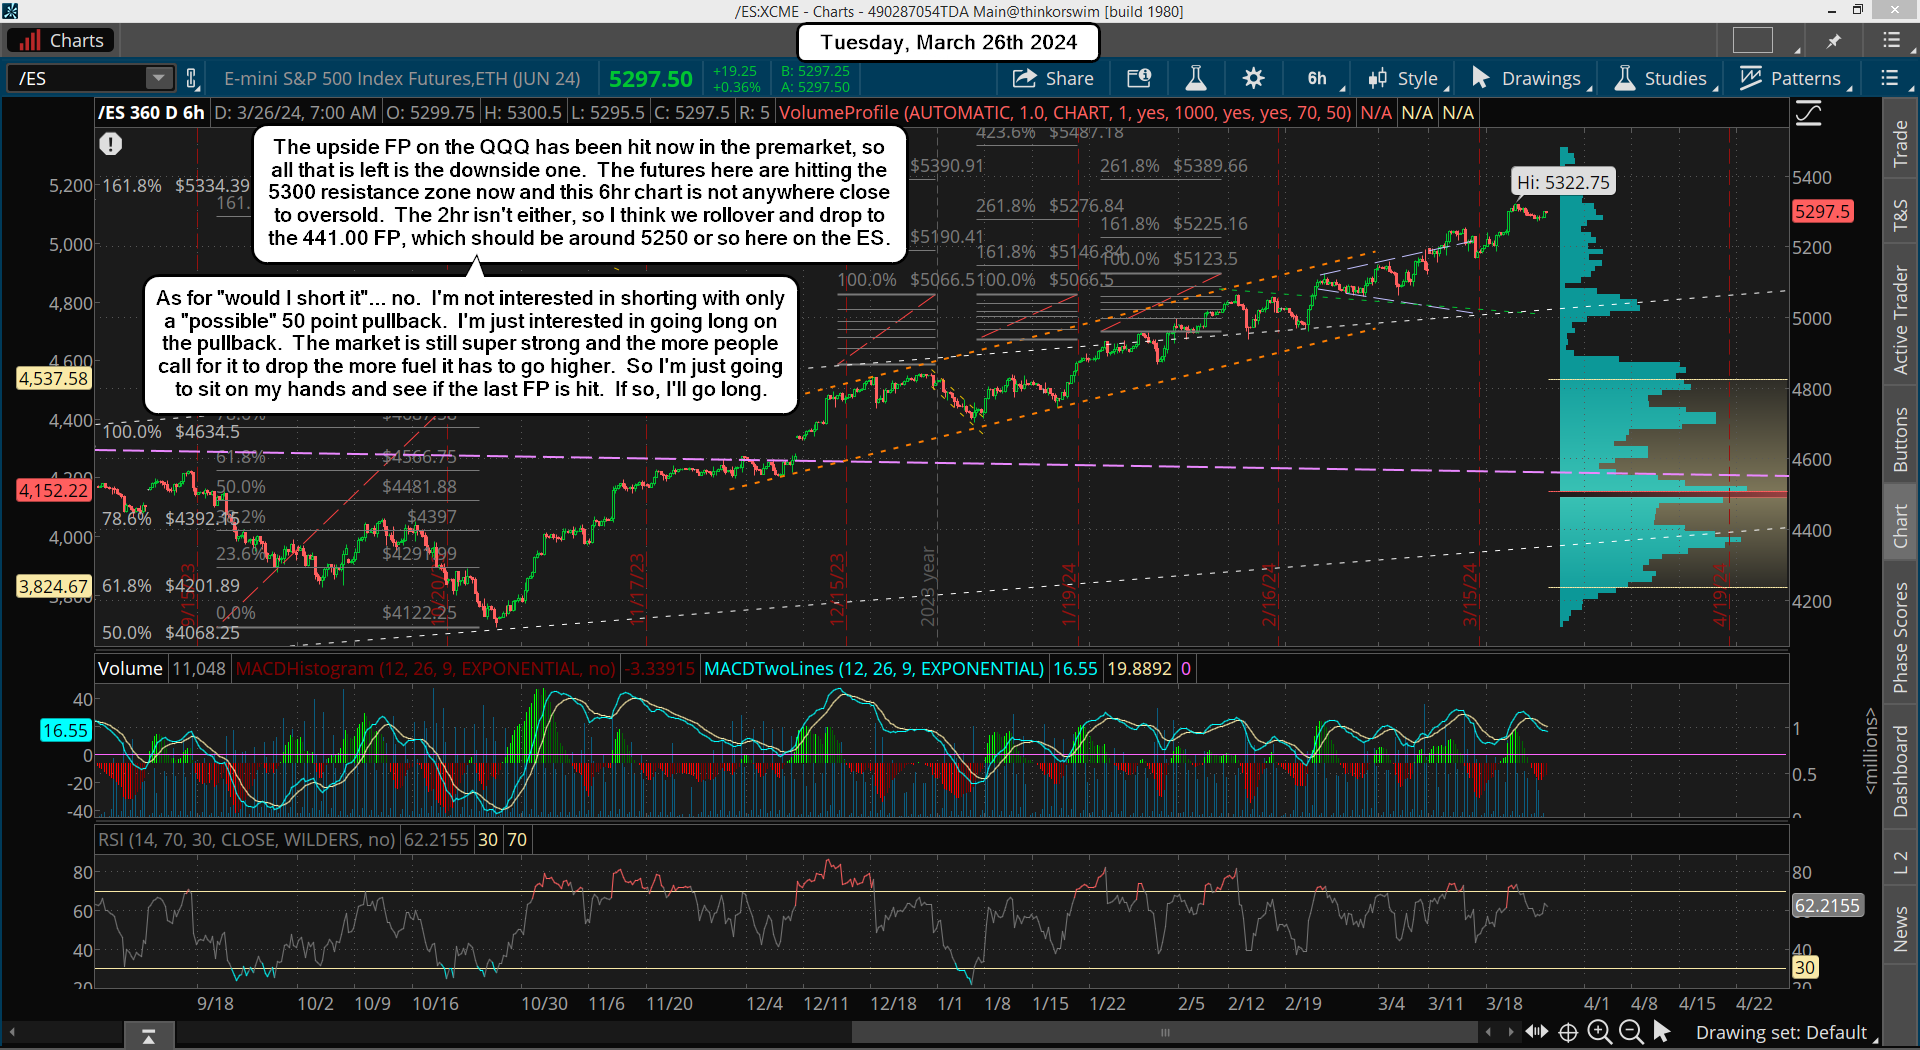
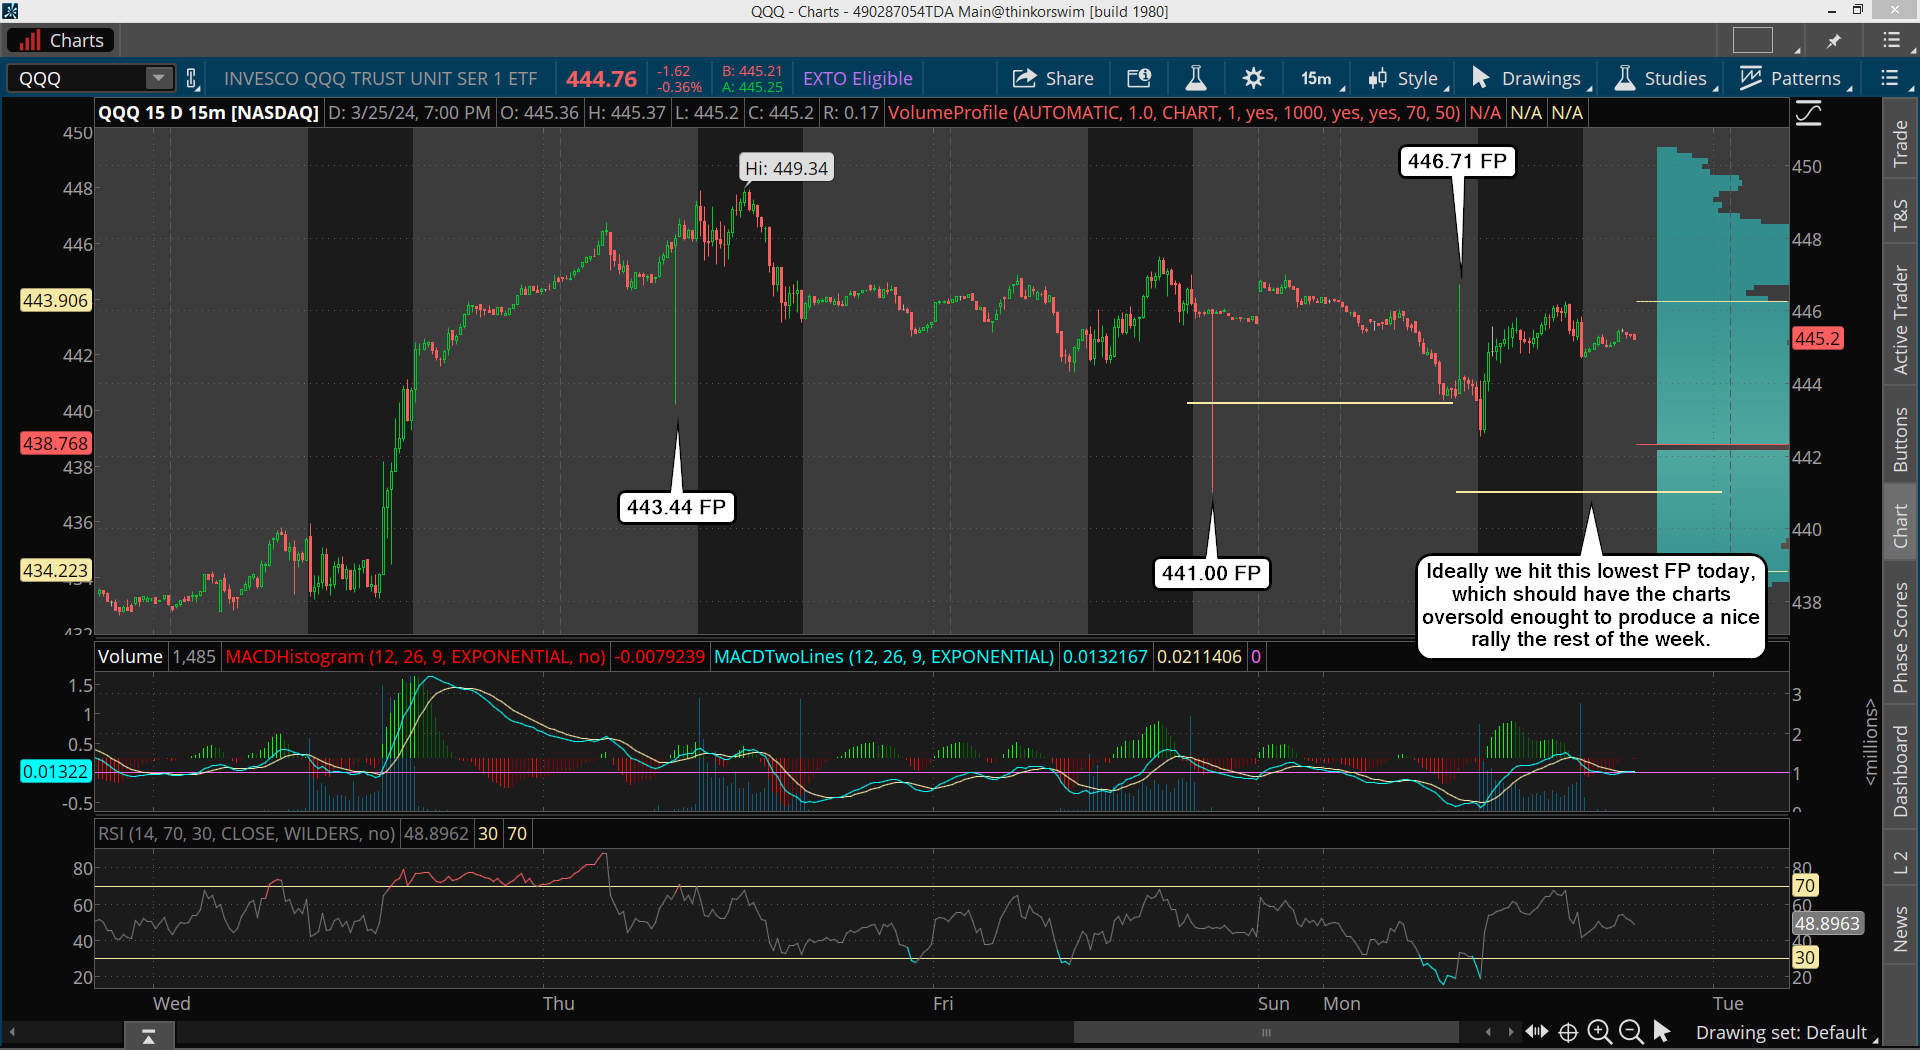
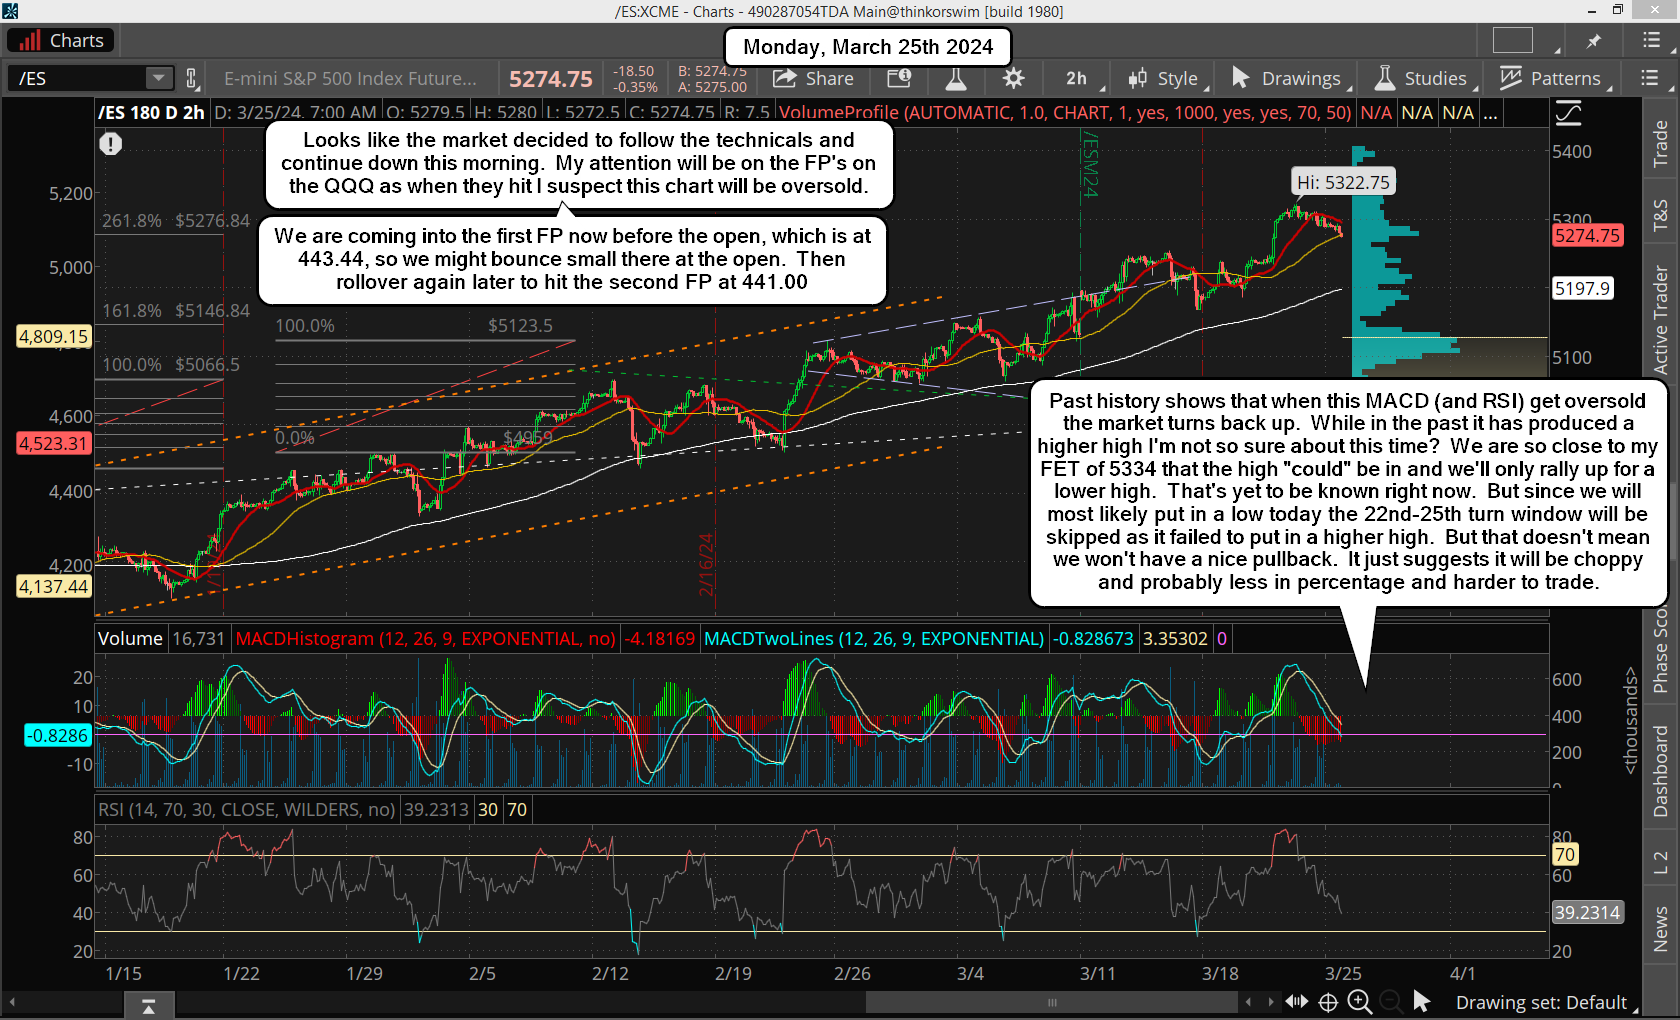
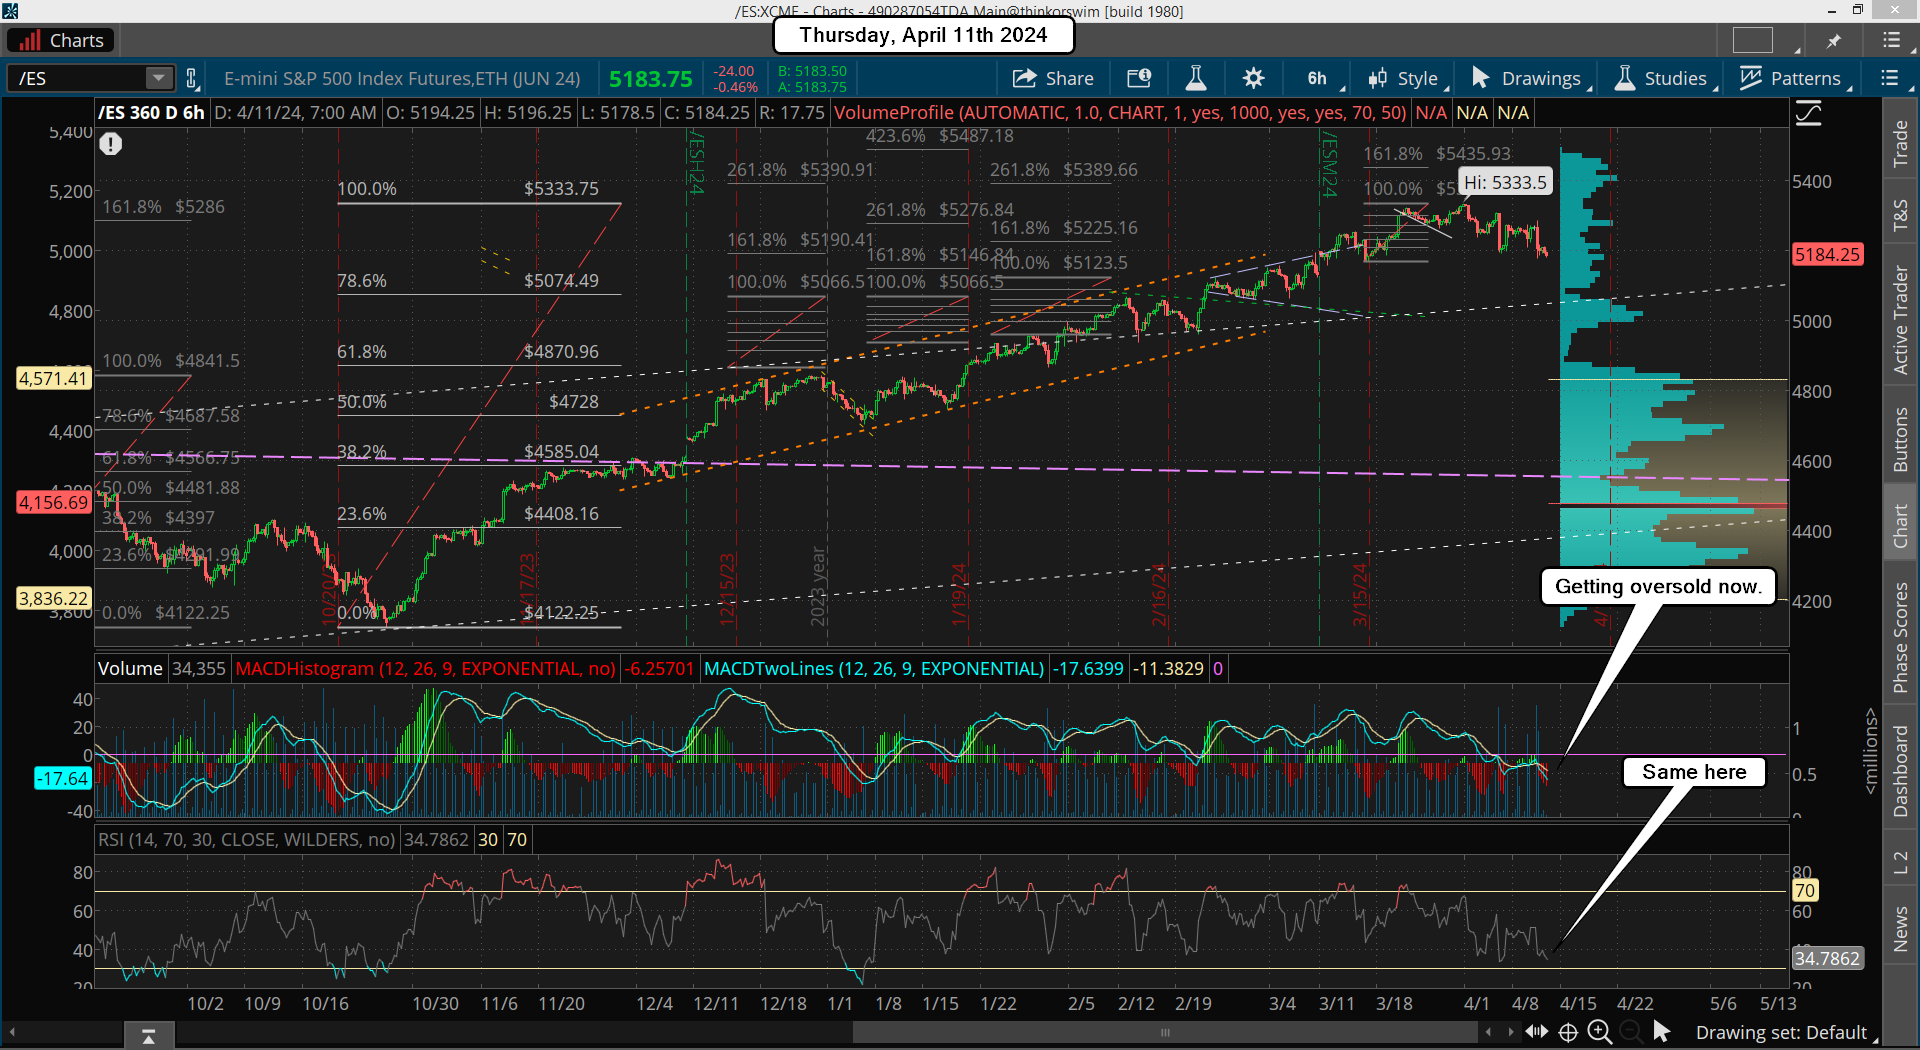
We now have closed red 3 days in a row... will today be the fourth? I doubt it as we are getting close now to the downside target of 441.00 from the fake print on the QQQ, which again is roughly around 5250 or so on the ES.

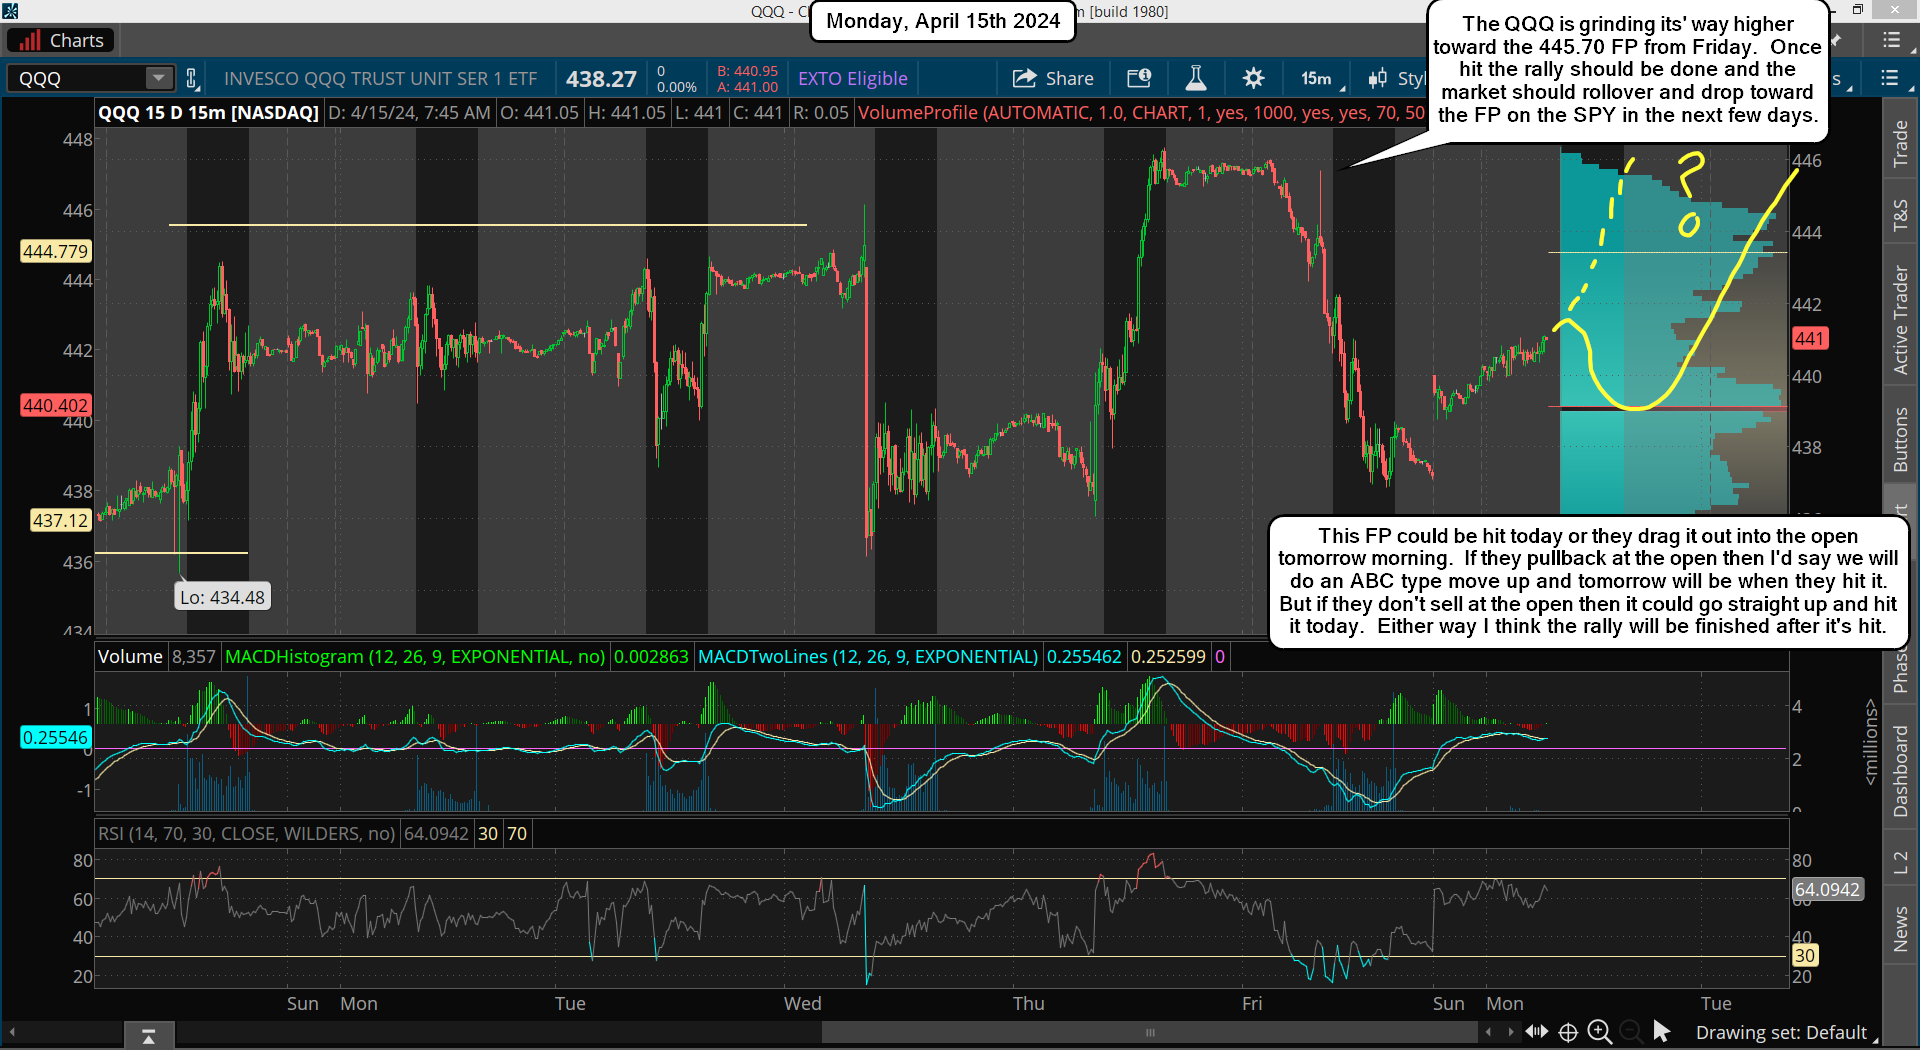
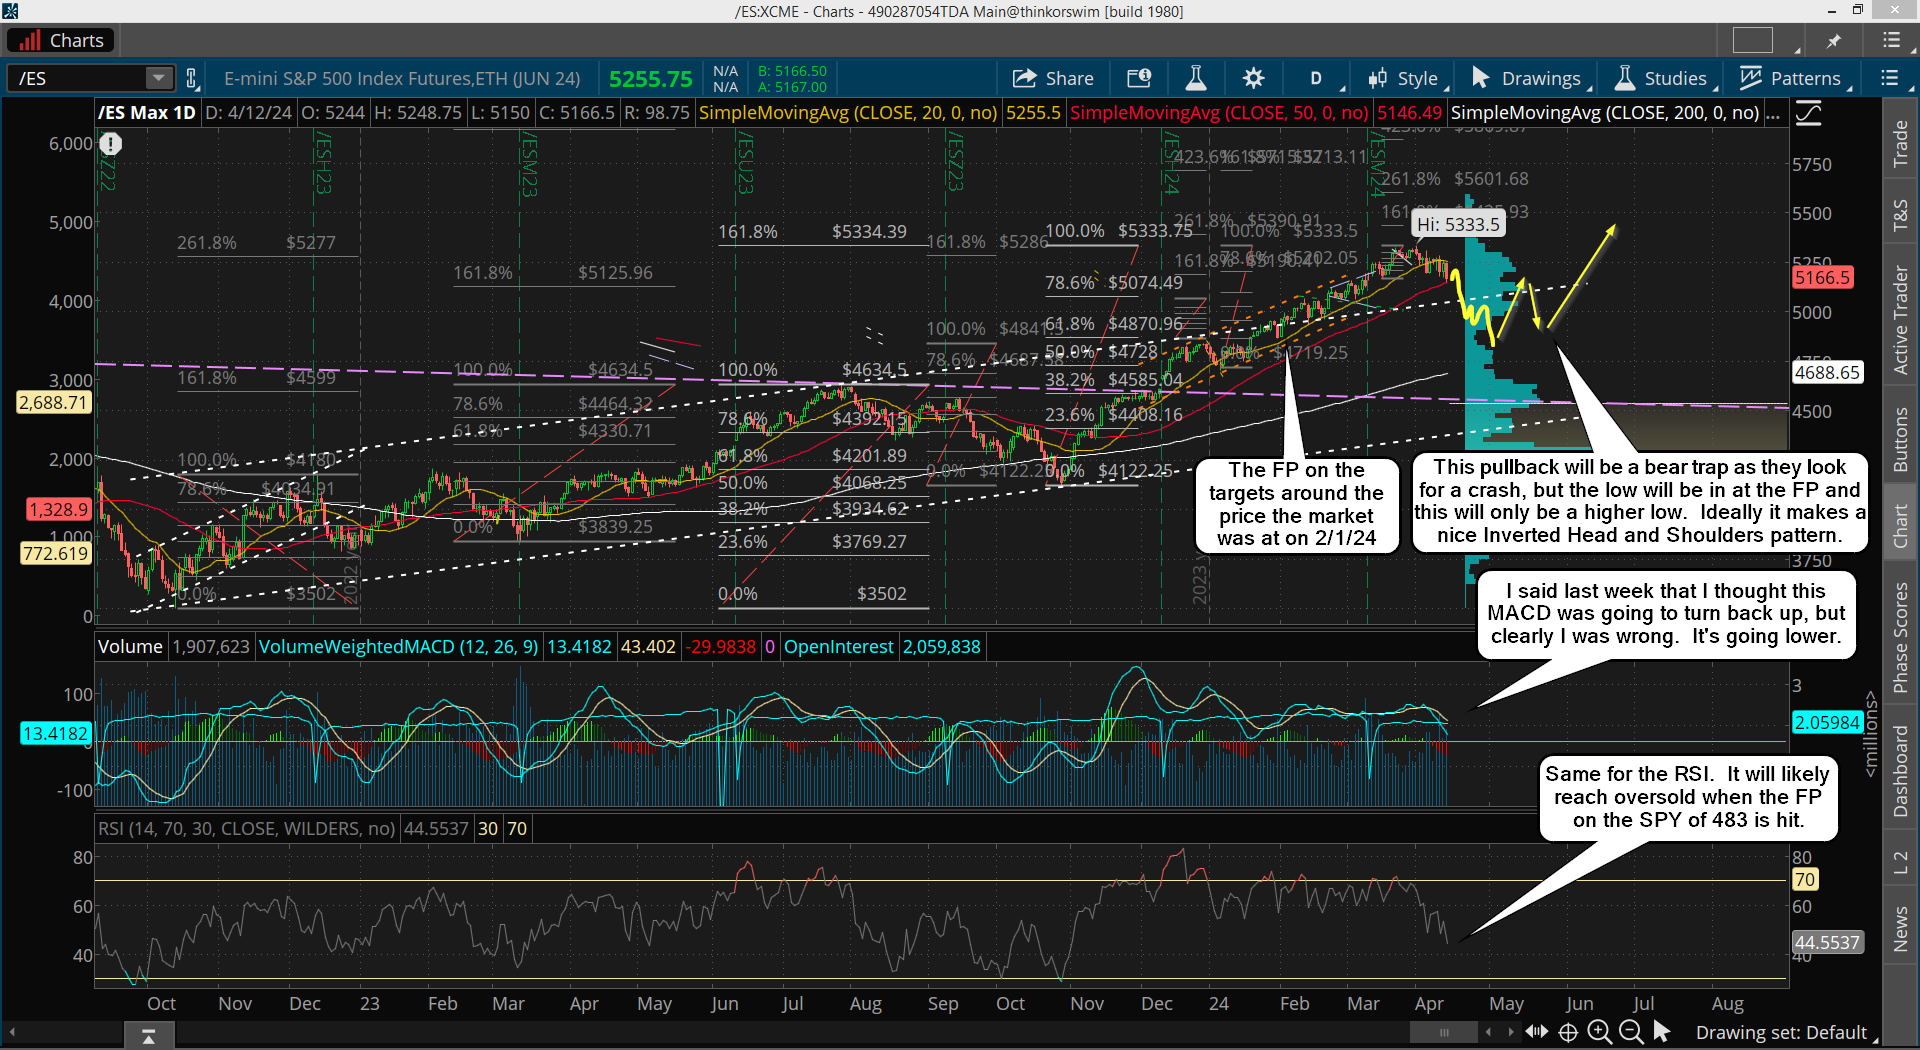
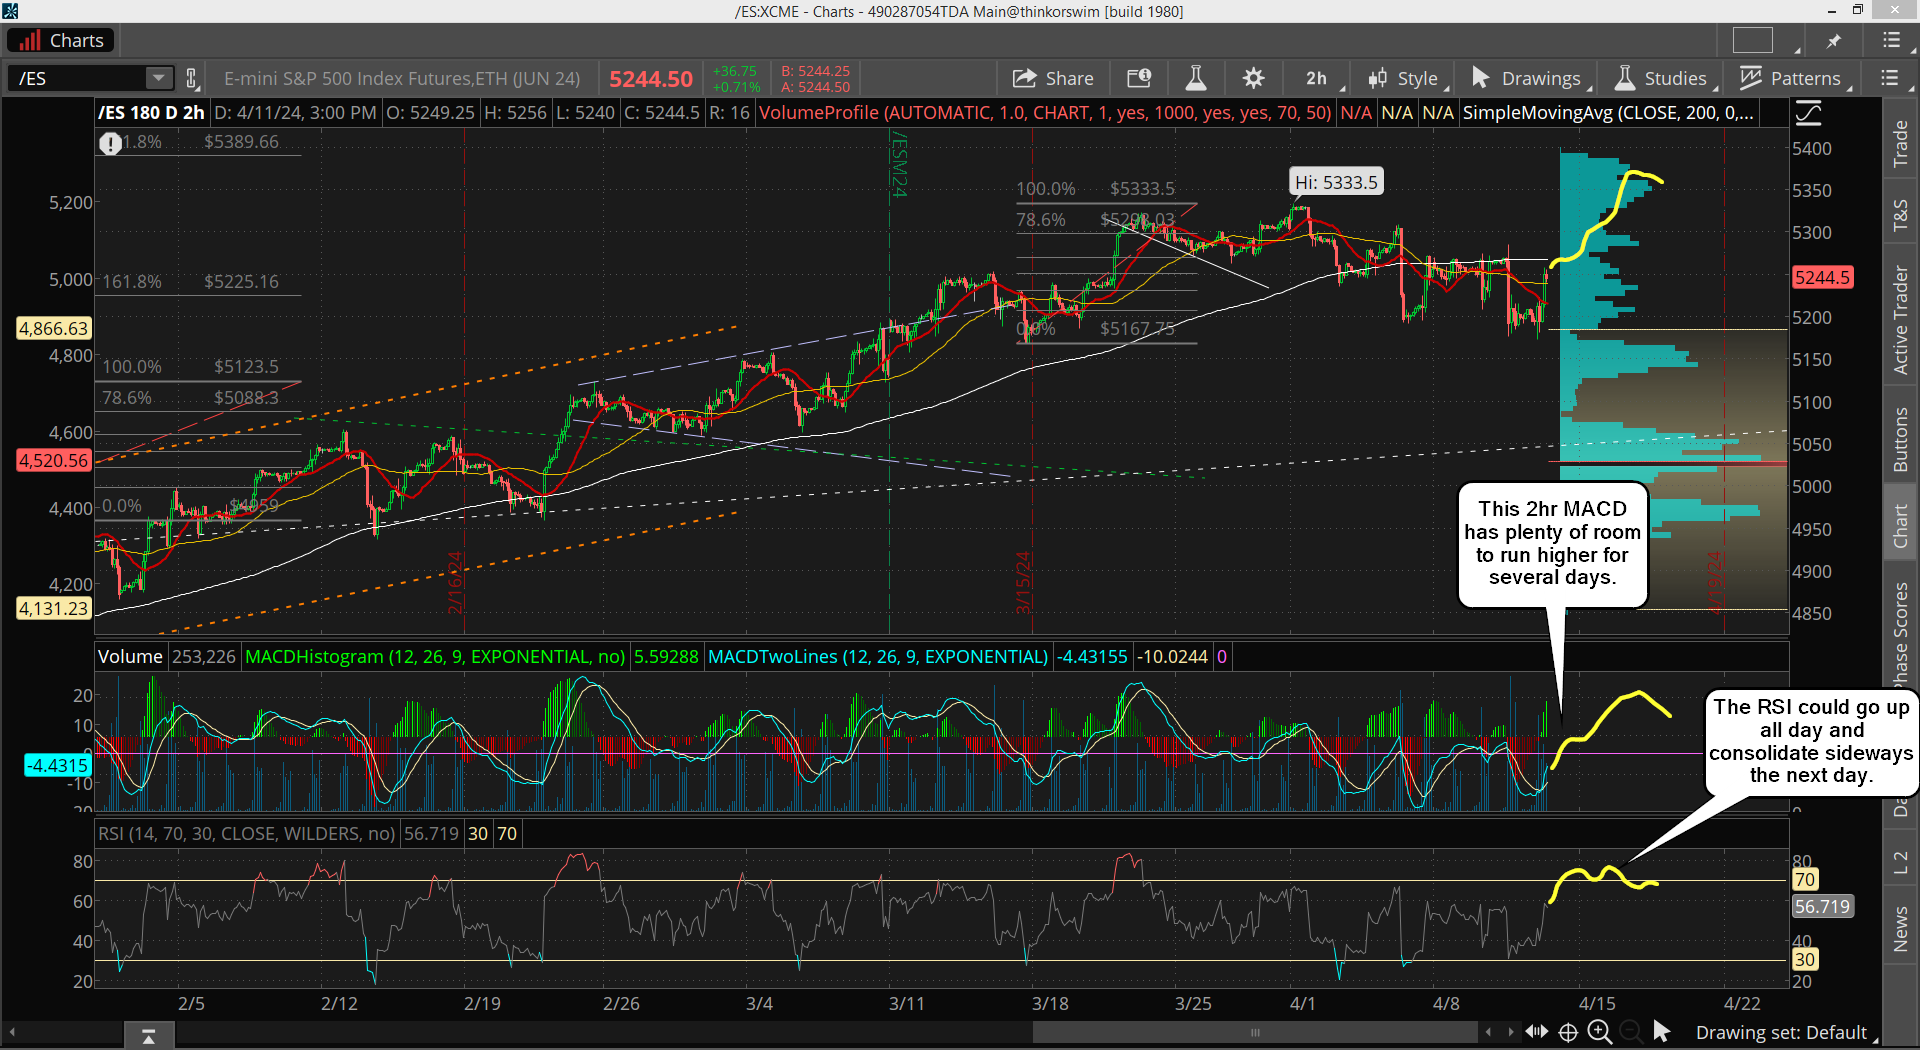
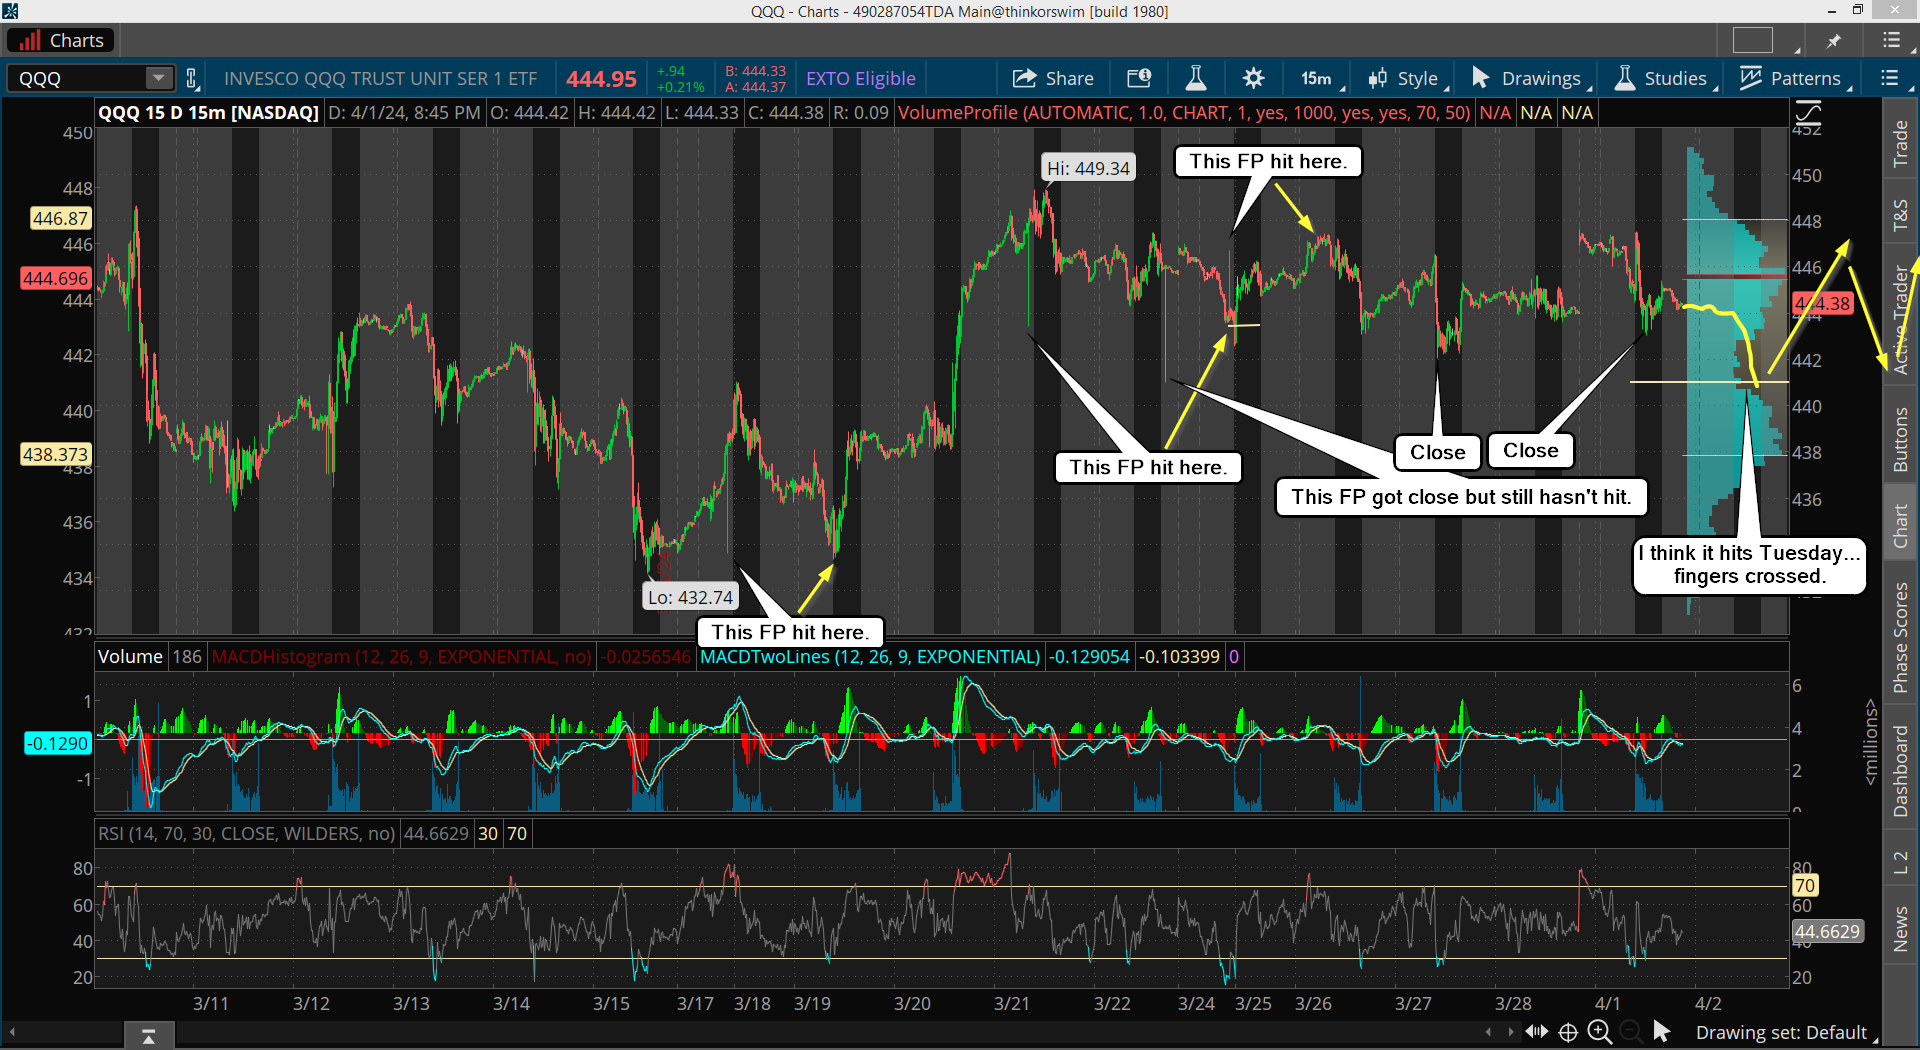
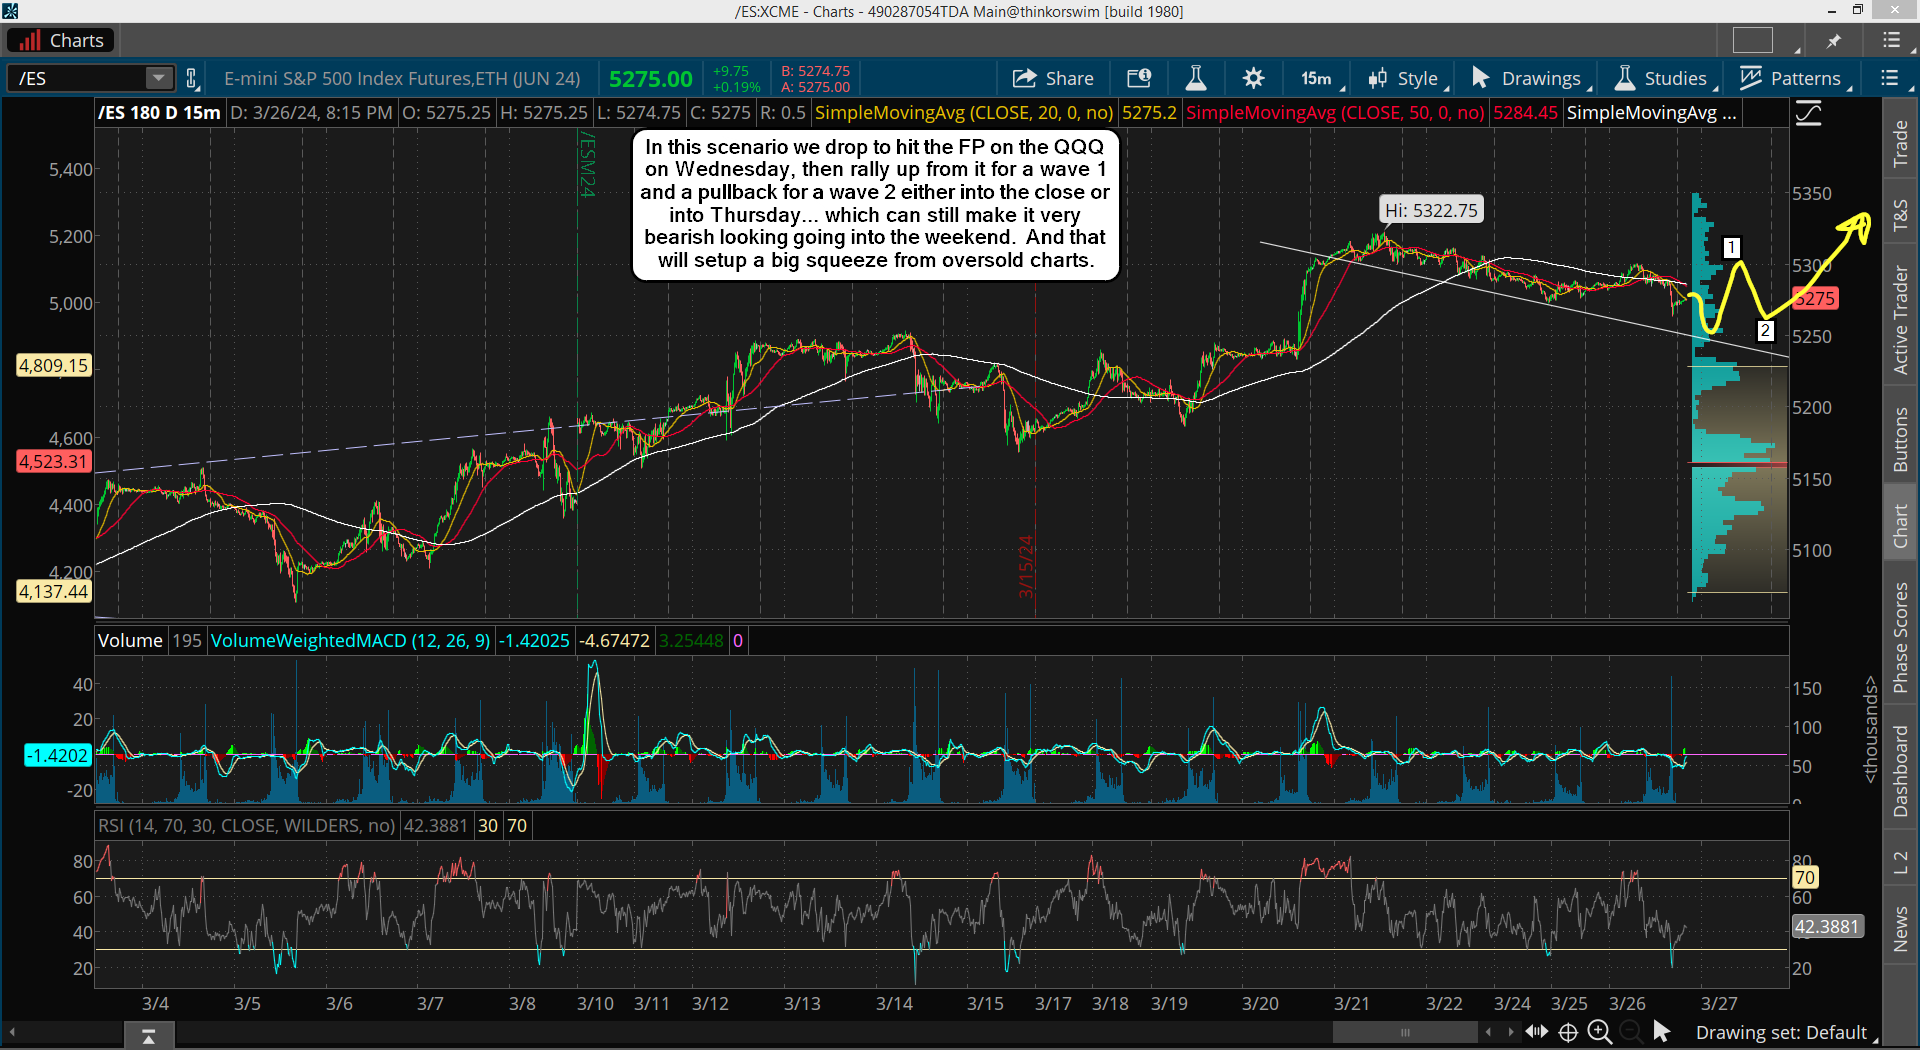
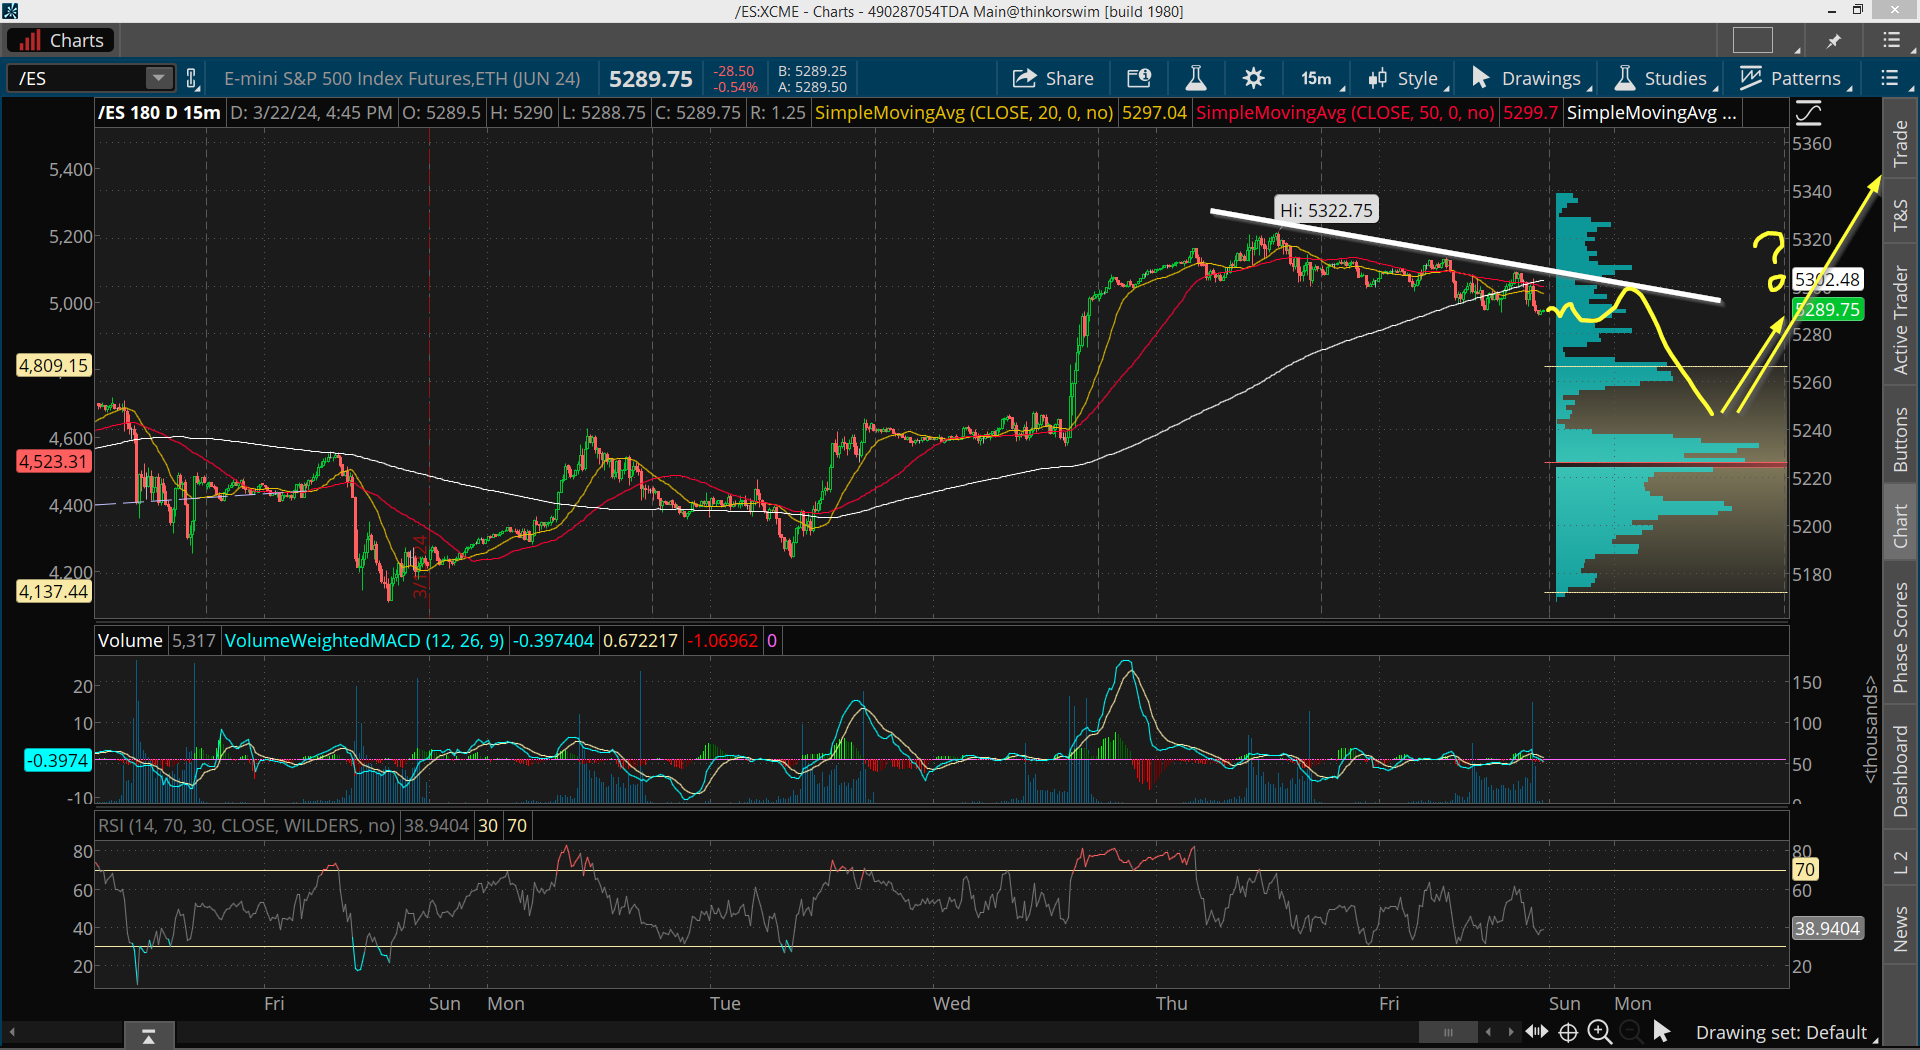
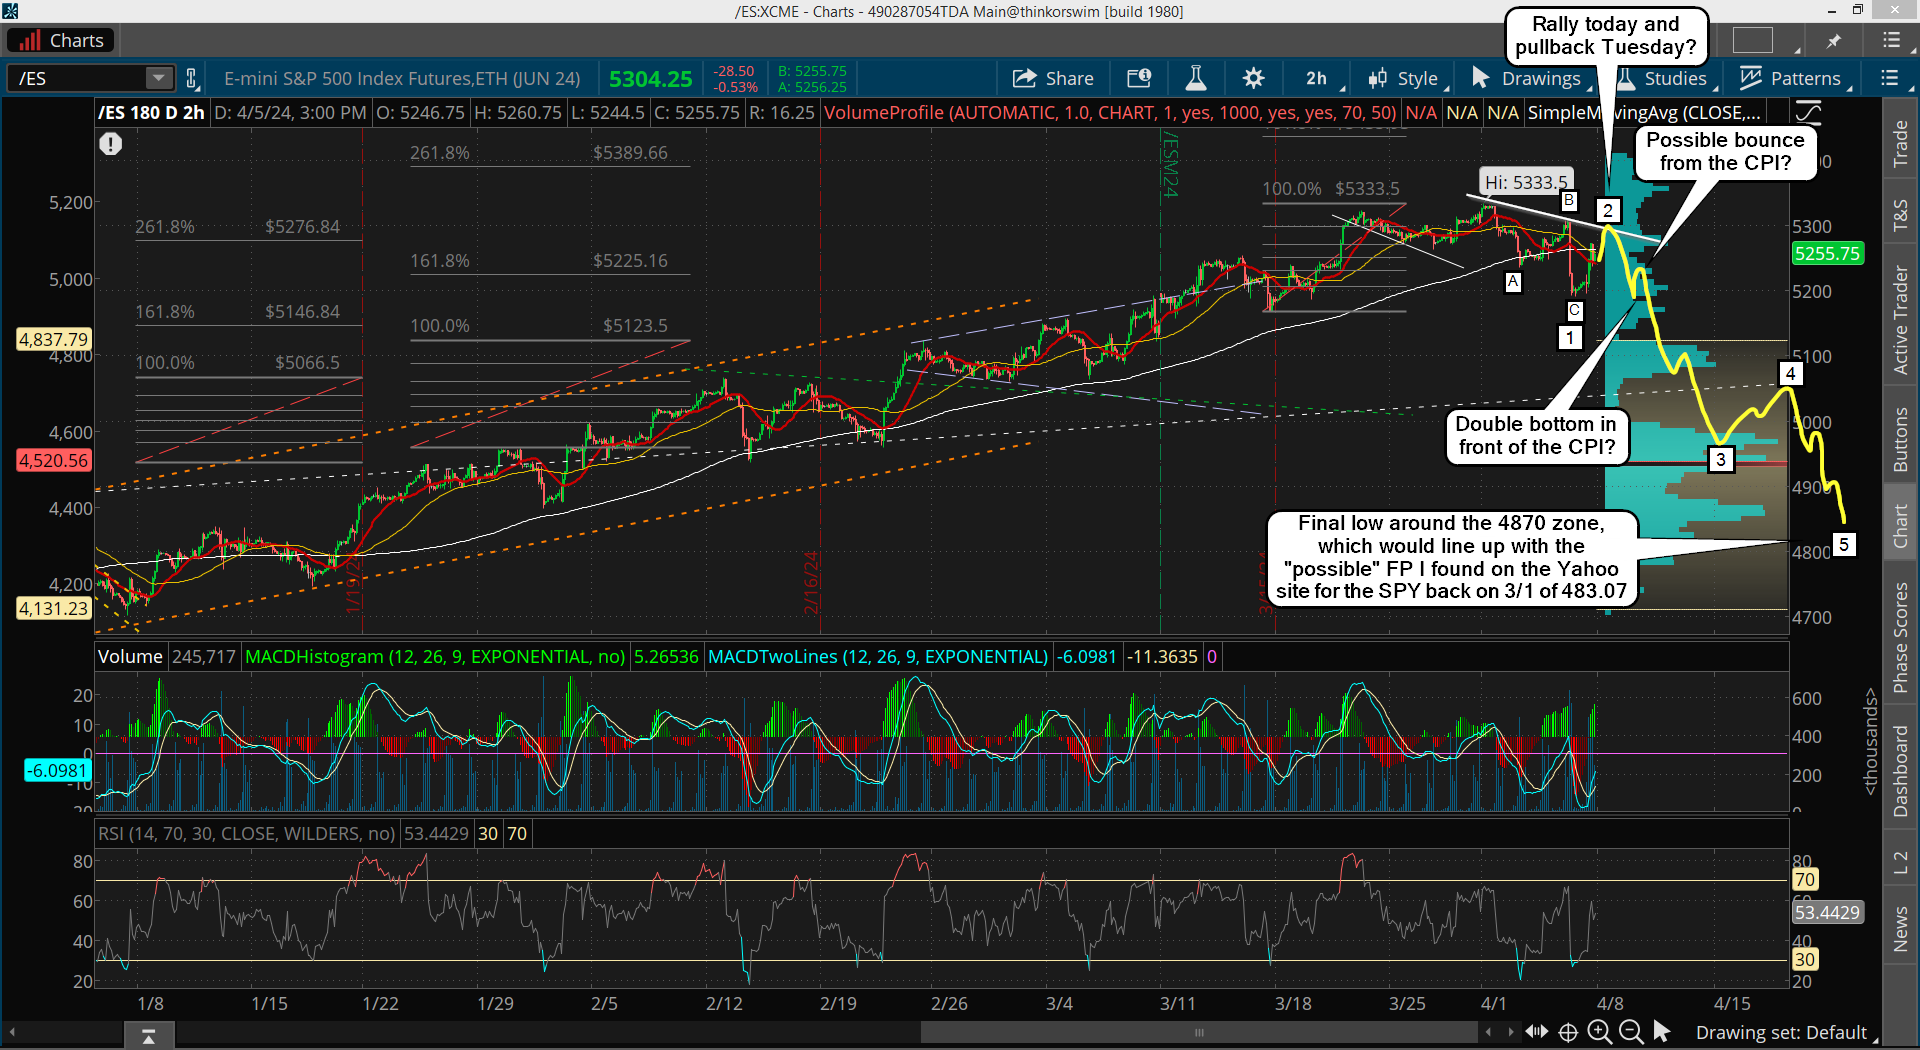
If it's hit in the morning session then I think we put in a bottom and turn back up the rest of the day. It might just go up for some wave 1 and pullback for a wave 2 (higher low) into the close, or that pullback happens on Thursday like in the chart below...

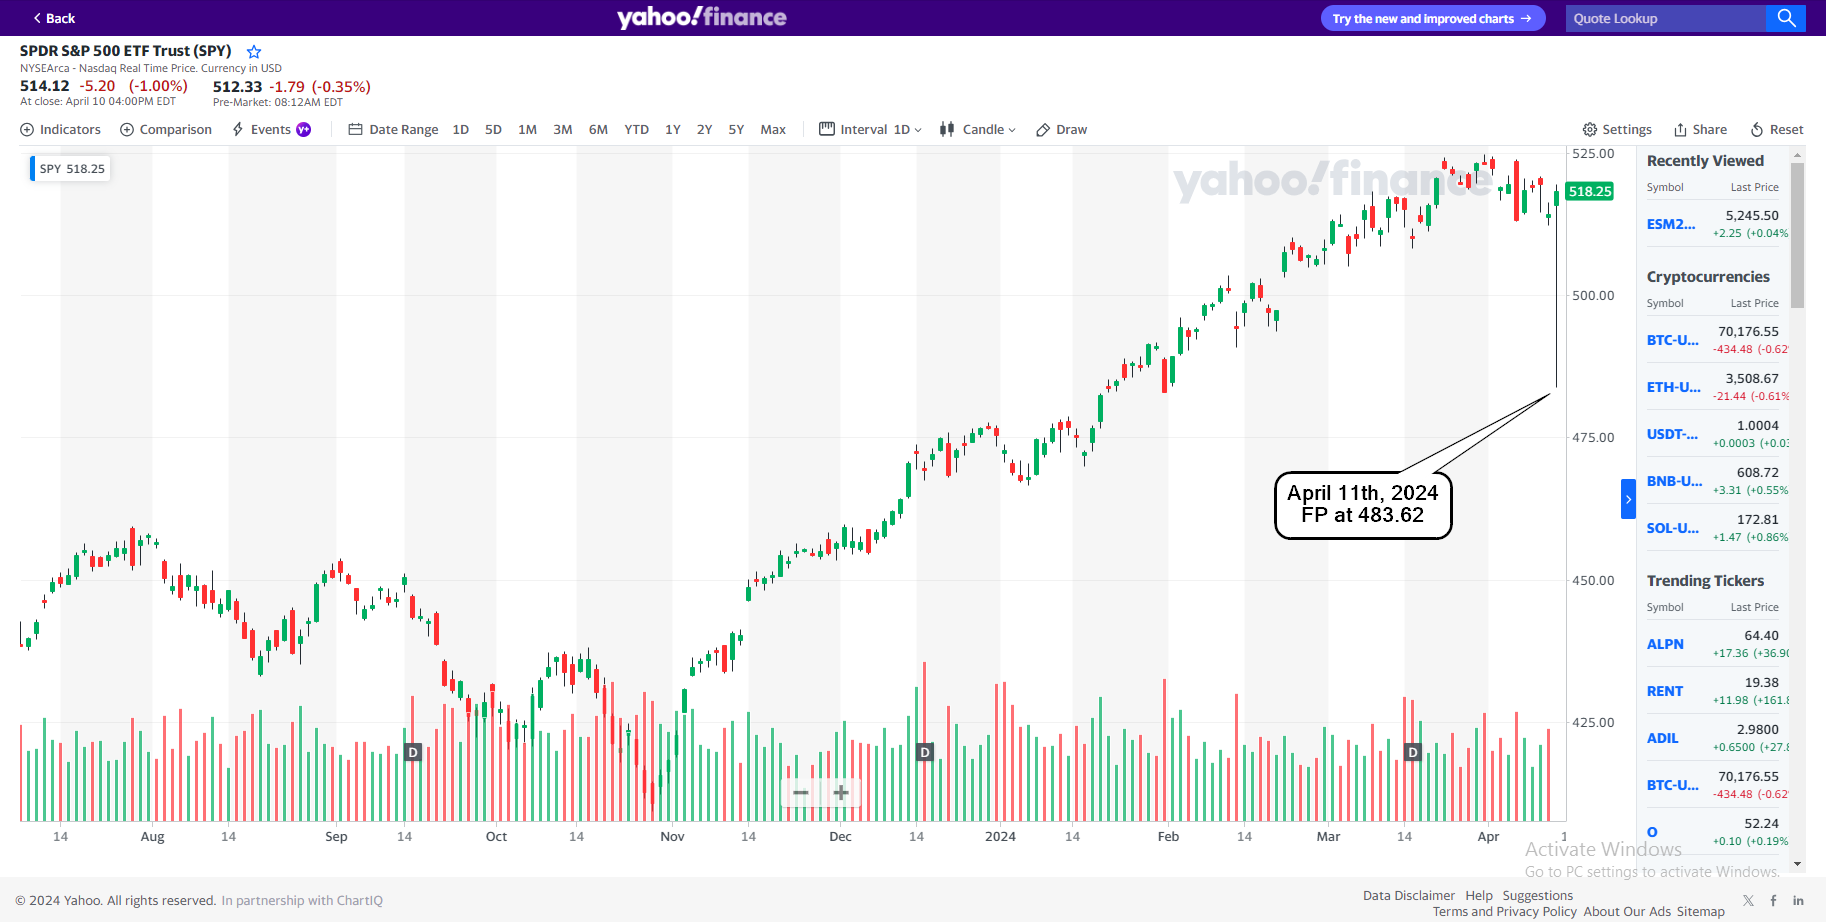
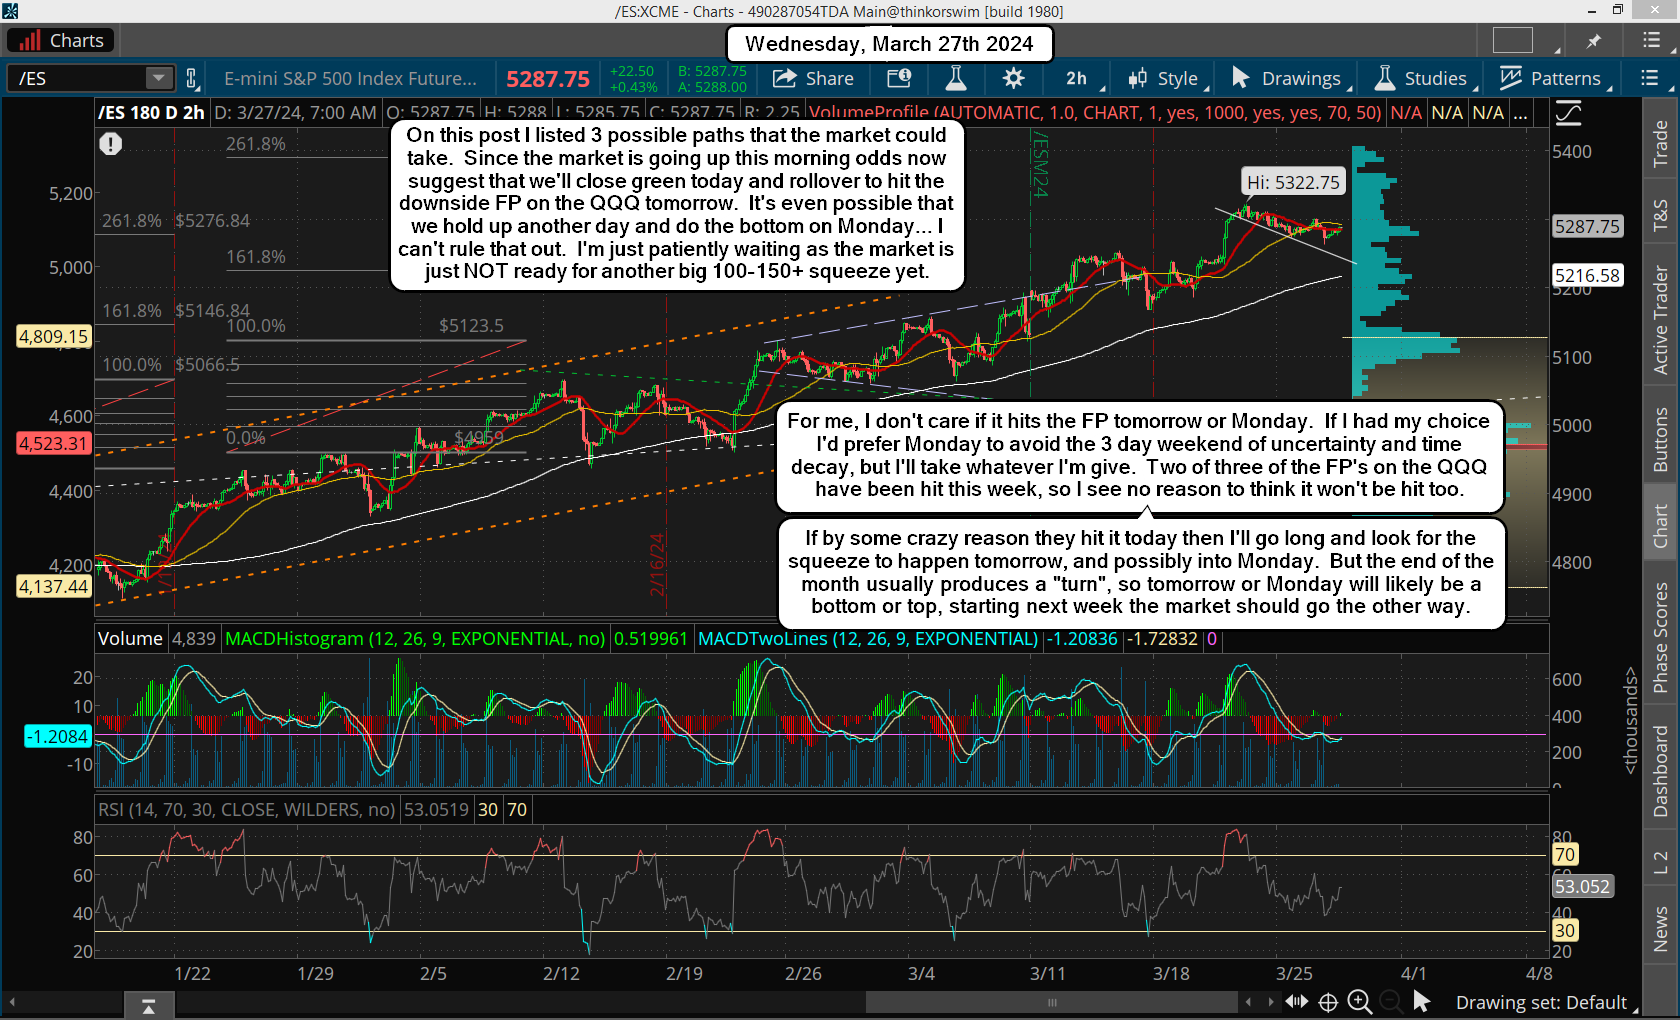
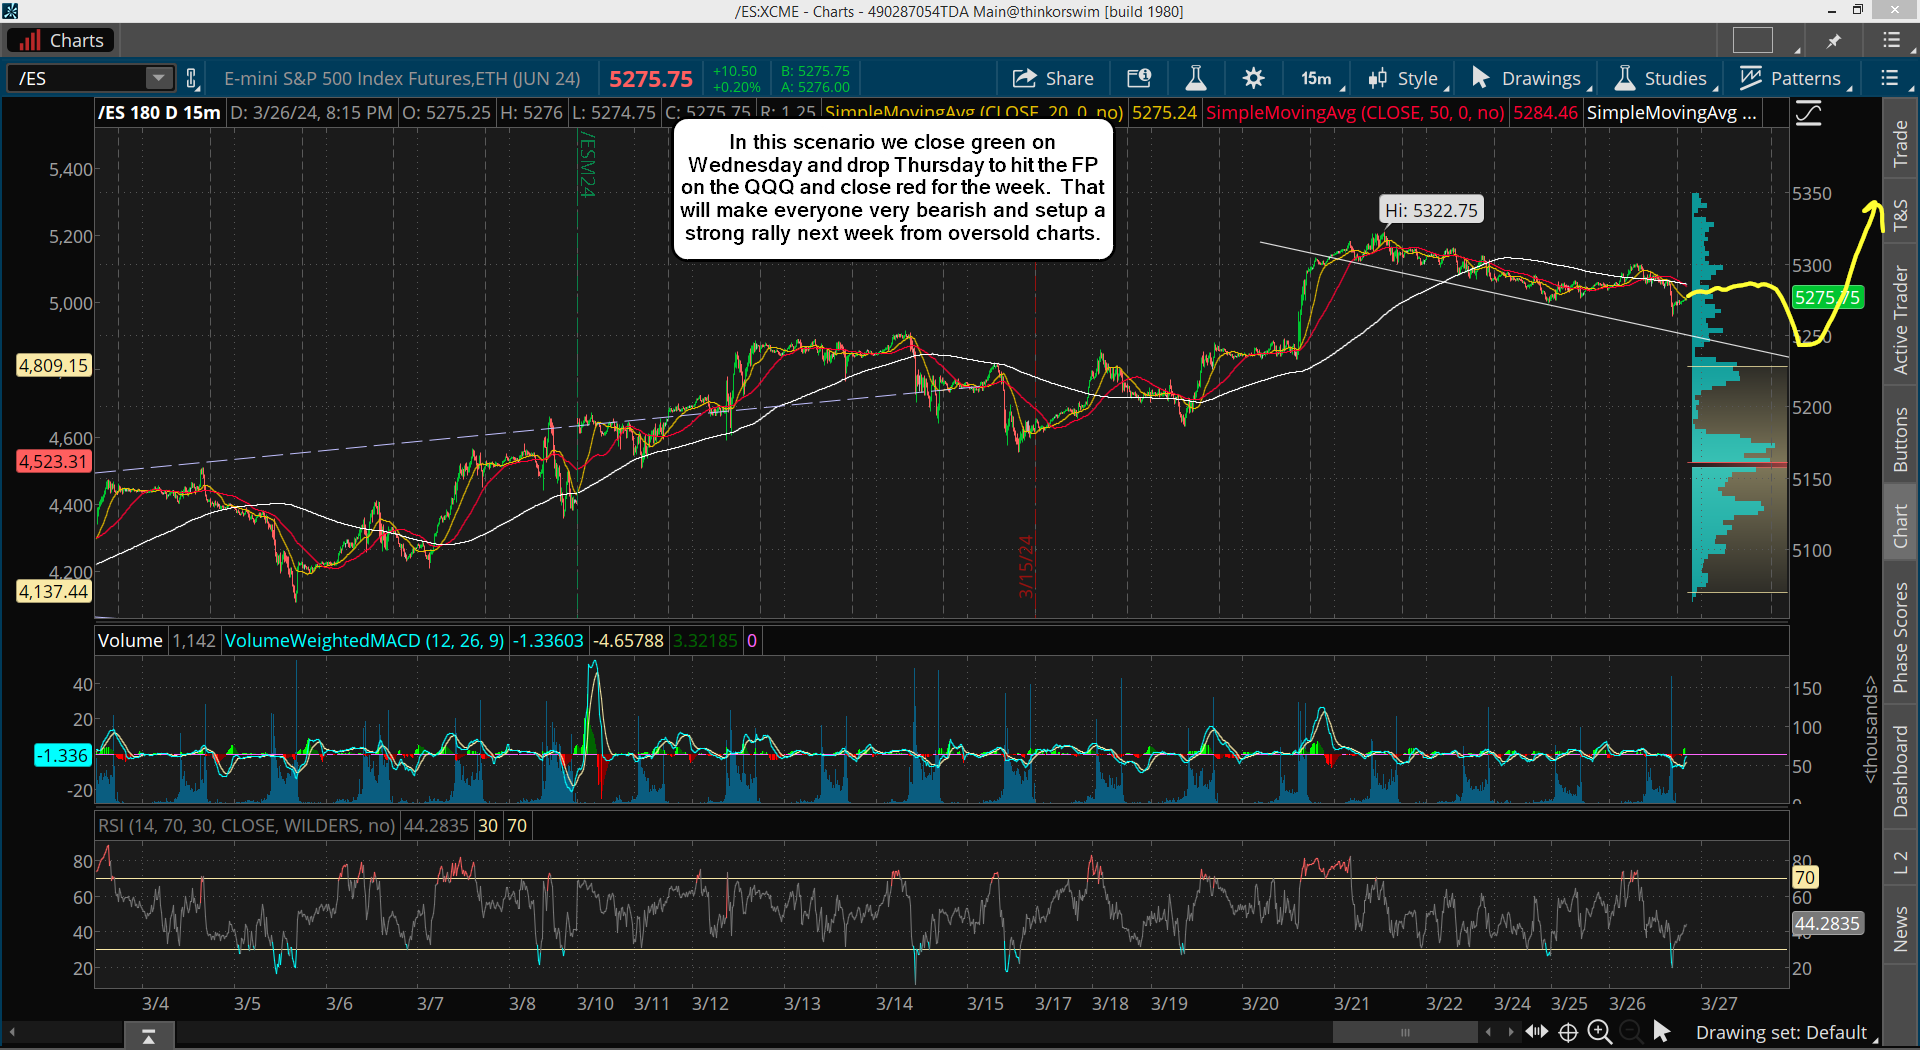
That's my thought on what could happen from looking at the technicals, but the other scenario is that we don't hit it today and close green with some small bounce. Then tomorrow we drop to the FP to close out the week negative It could hit into the close Thursday to make everything look very bearish over the 3 day weekend, which if we get oversold (and we should be), I think we'll rally hard next week with everyone short.

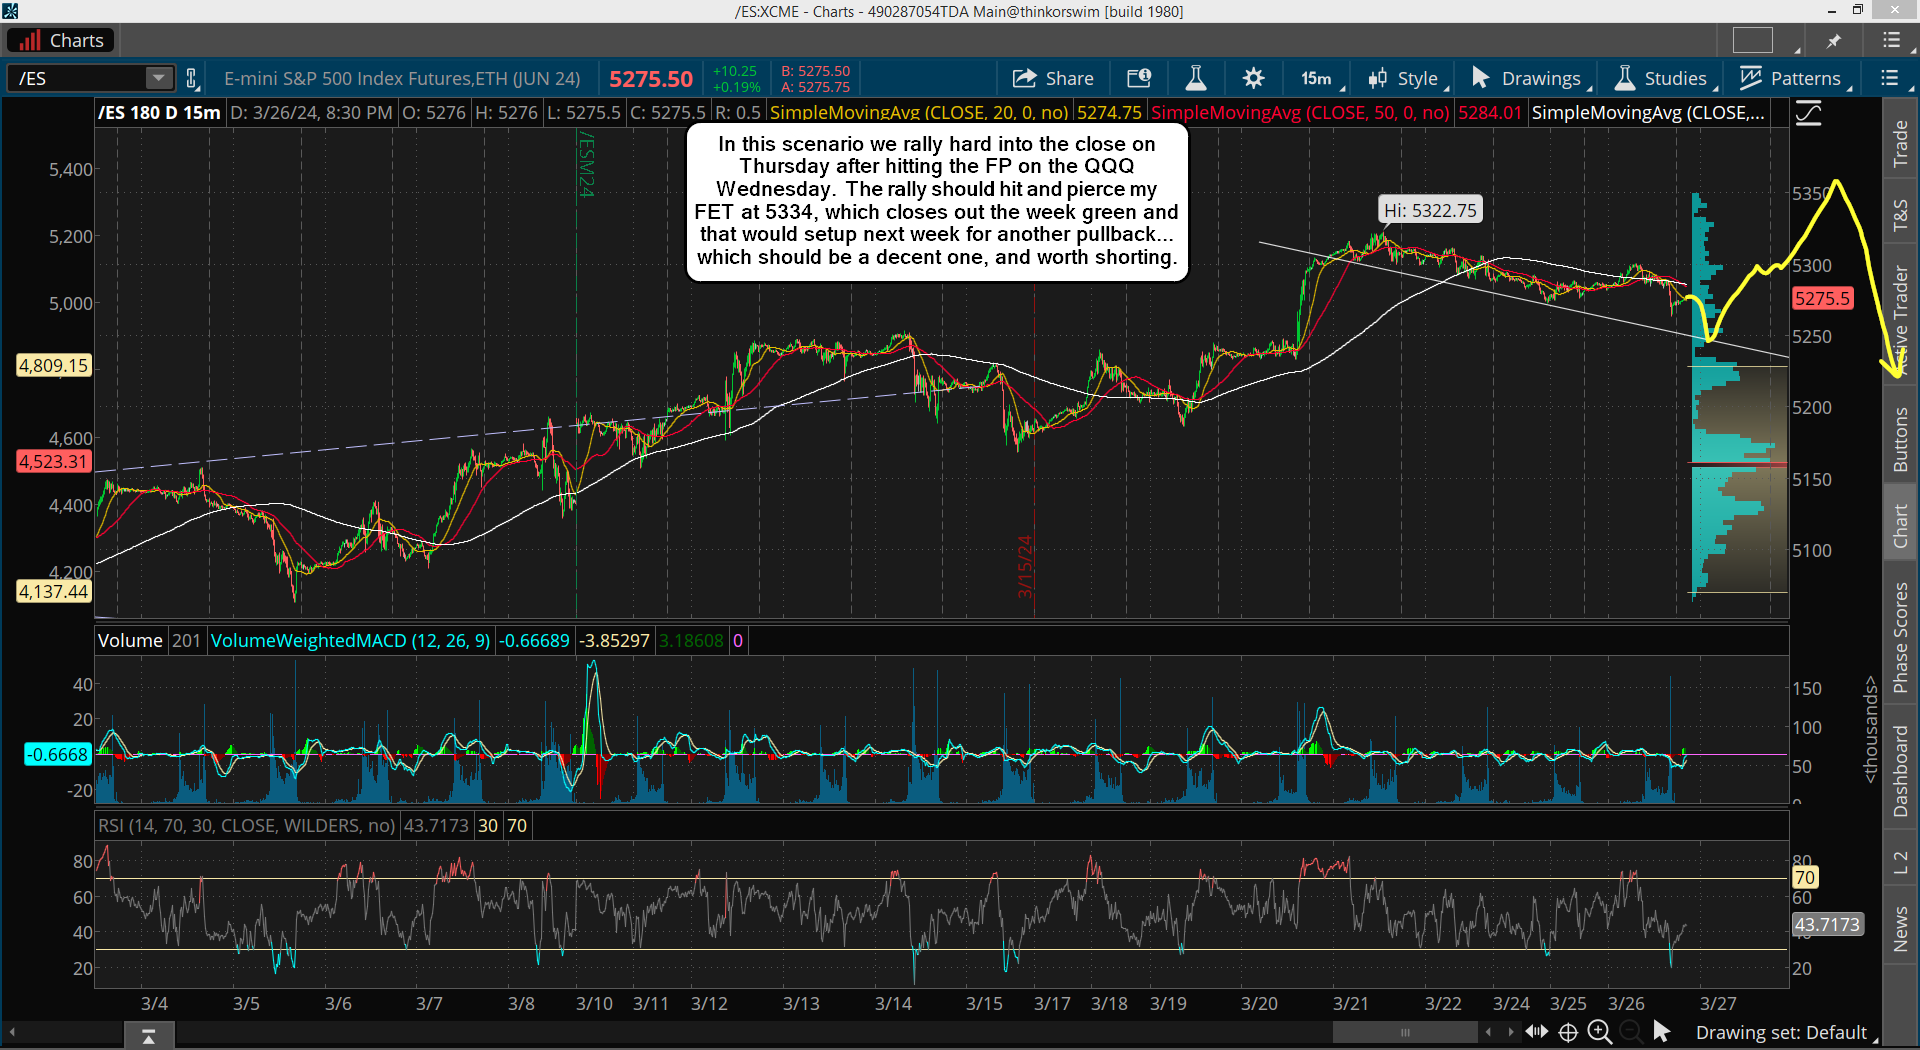
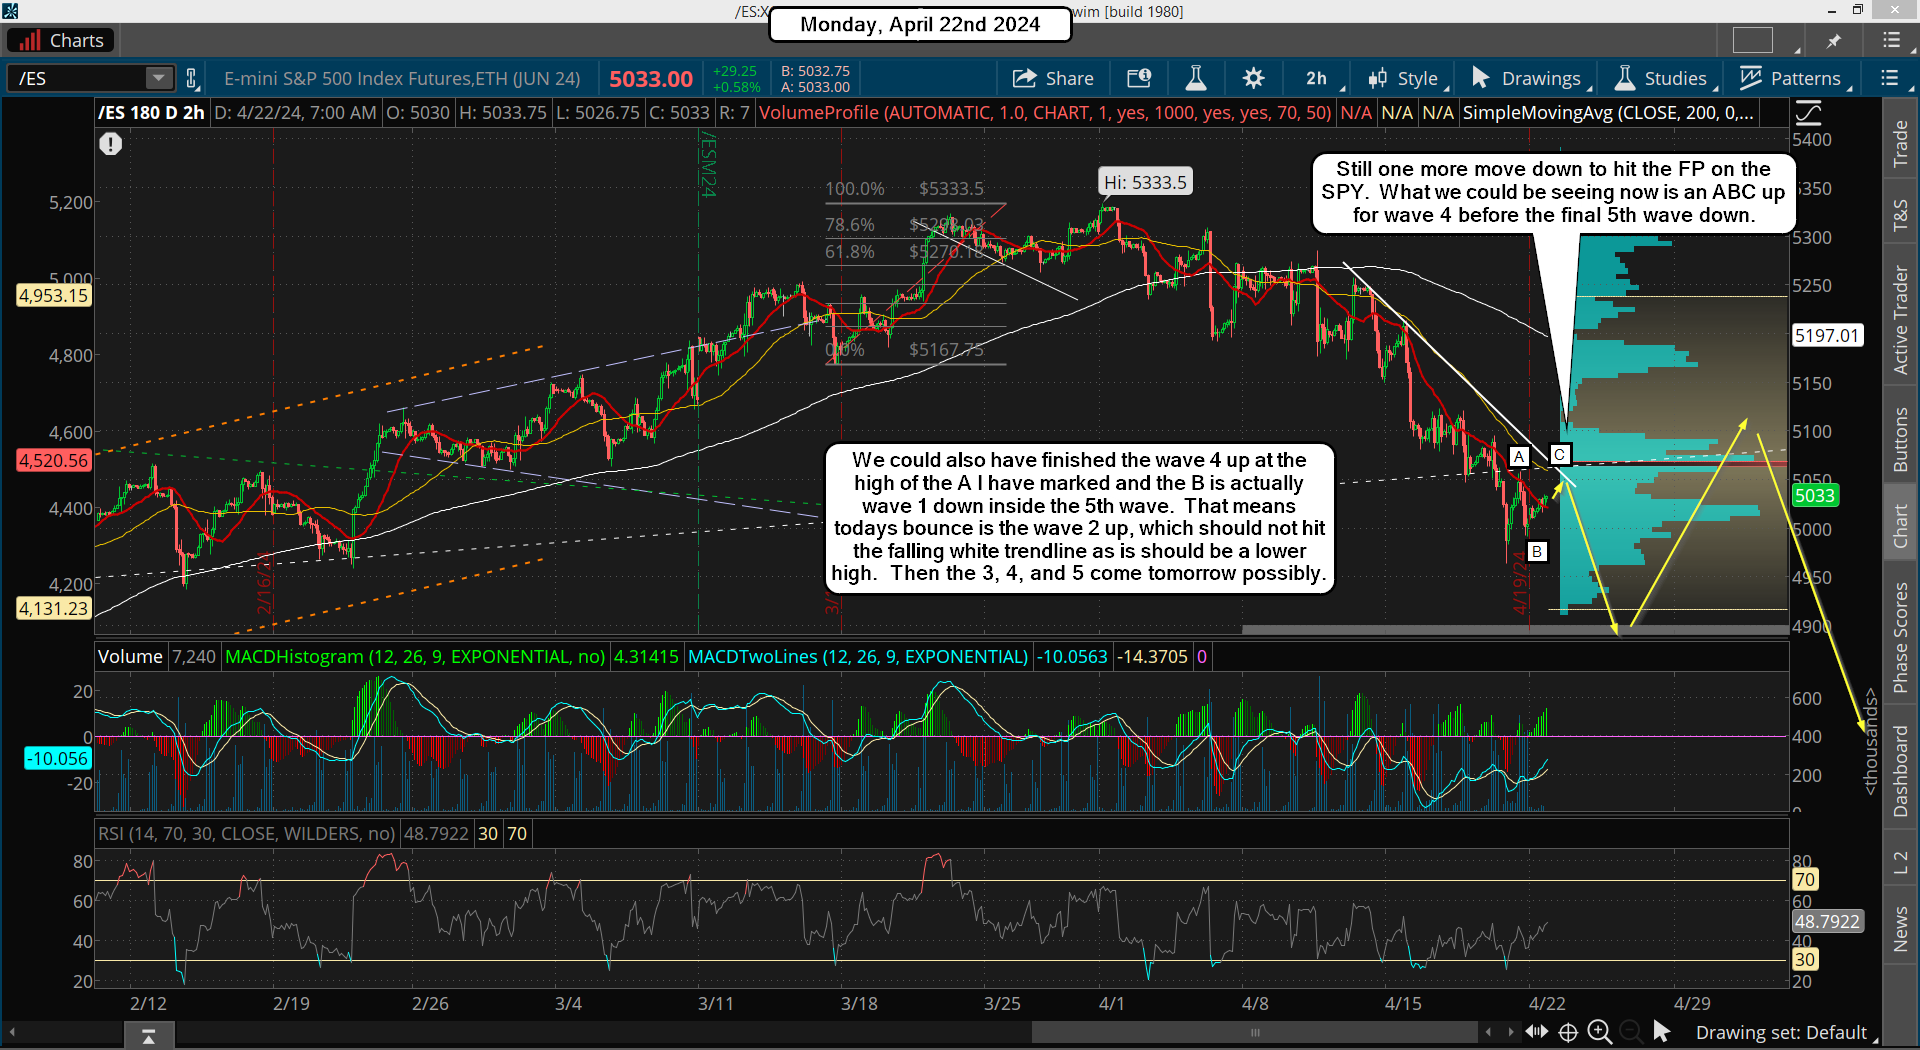
Of course if it's hit today then I'll still looking for a long as the FP's have proven to me over the many years of following them that they work. They can still make it very bearish into the end of the week if they do hit the FP today and bottom as we could see the wave 1 up into the close and then tomorrow gets the wave 2 down that comes really close to hitting the low again. A slightly higher low or double bottom basically. That would still get everyone bearish over the weekend I think (chart below).

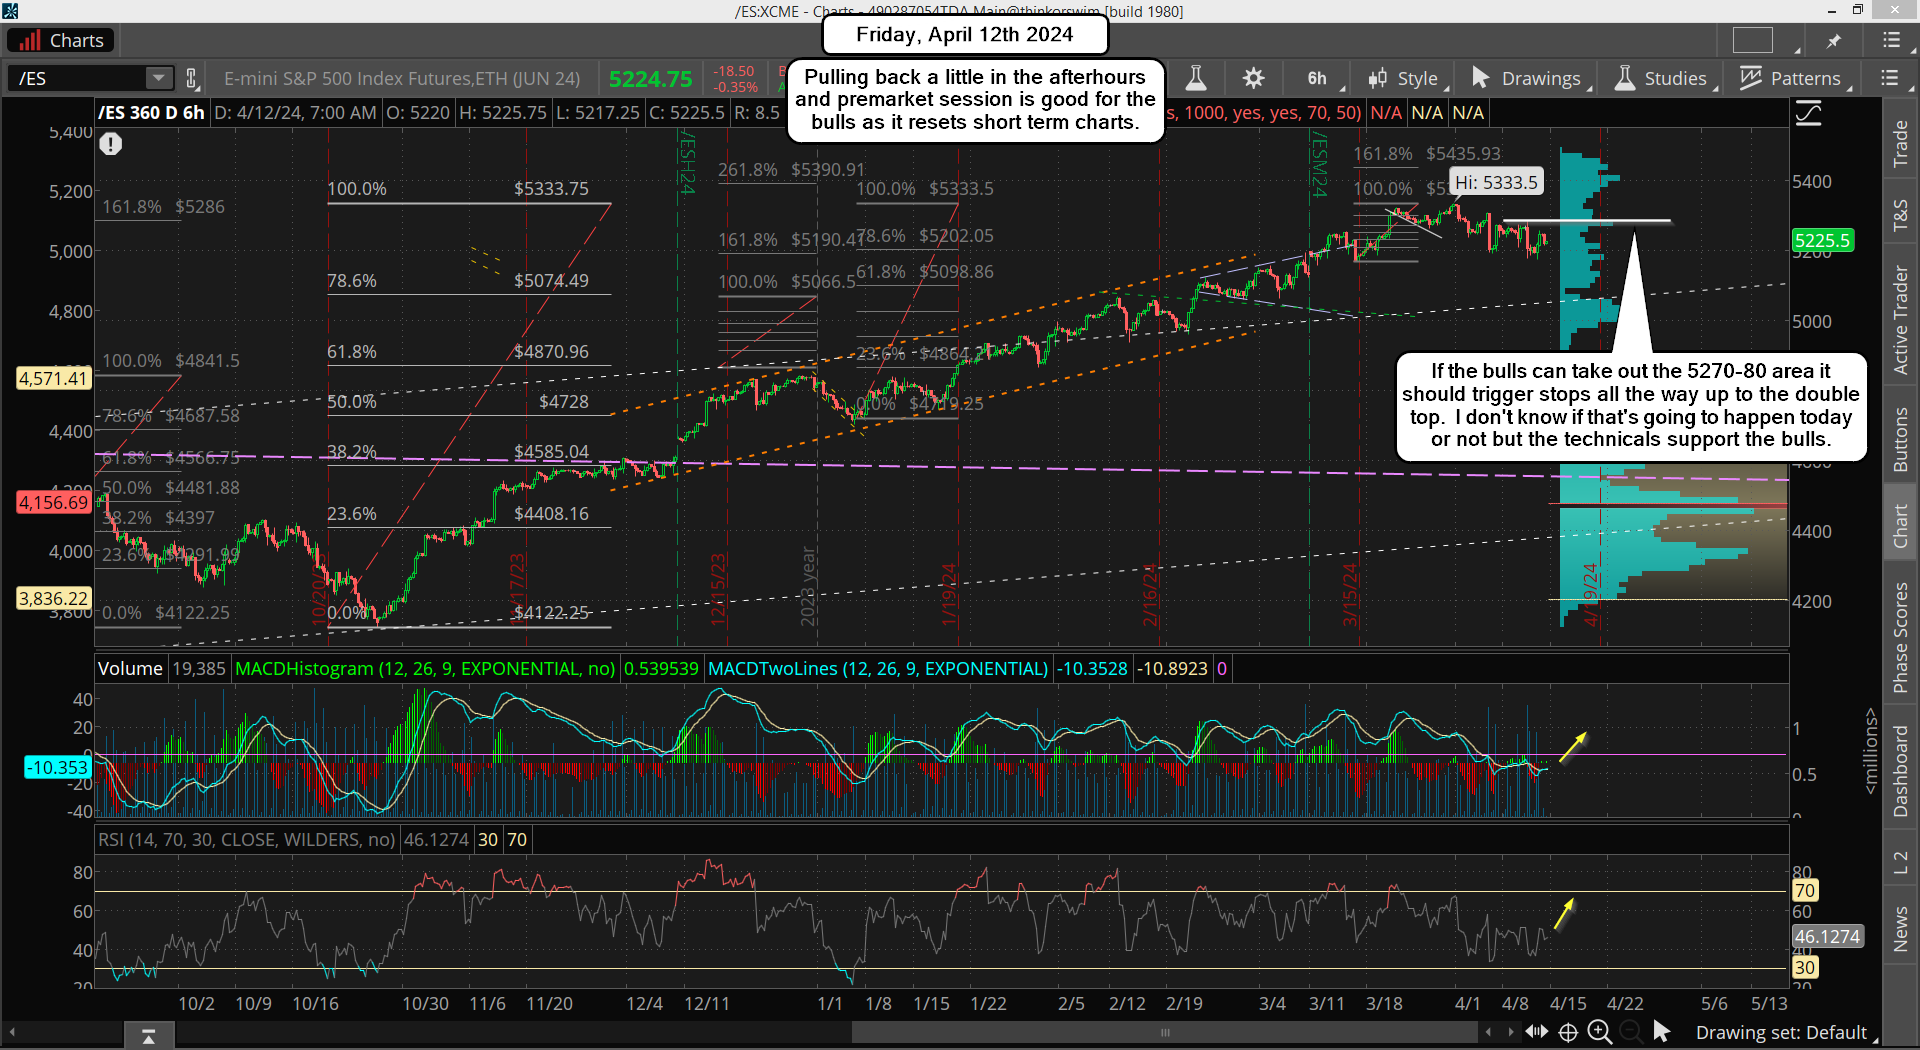
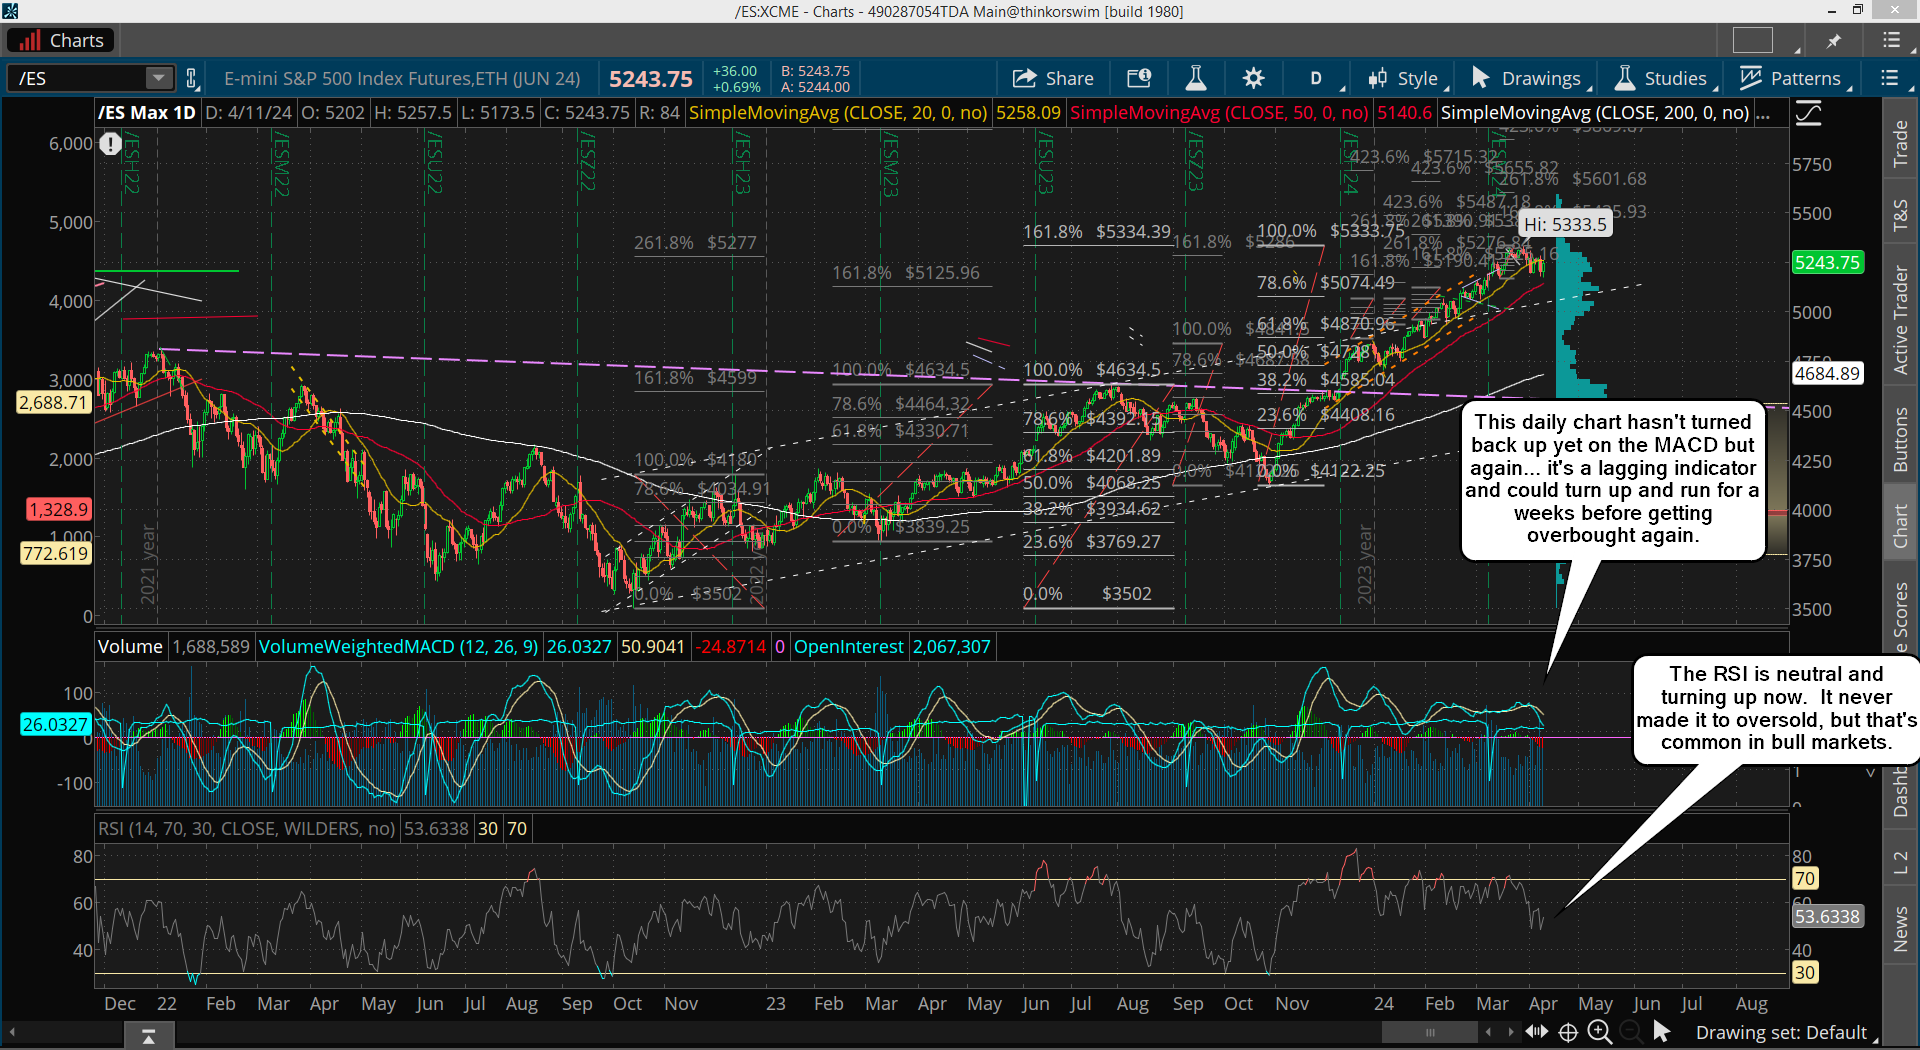
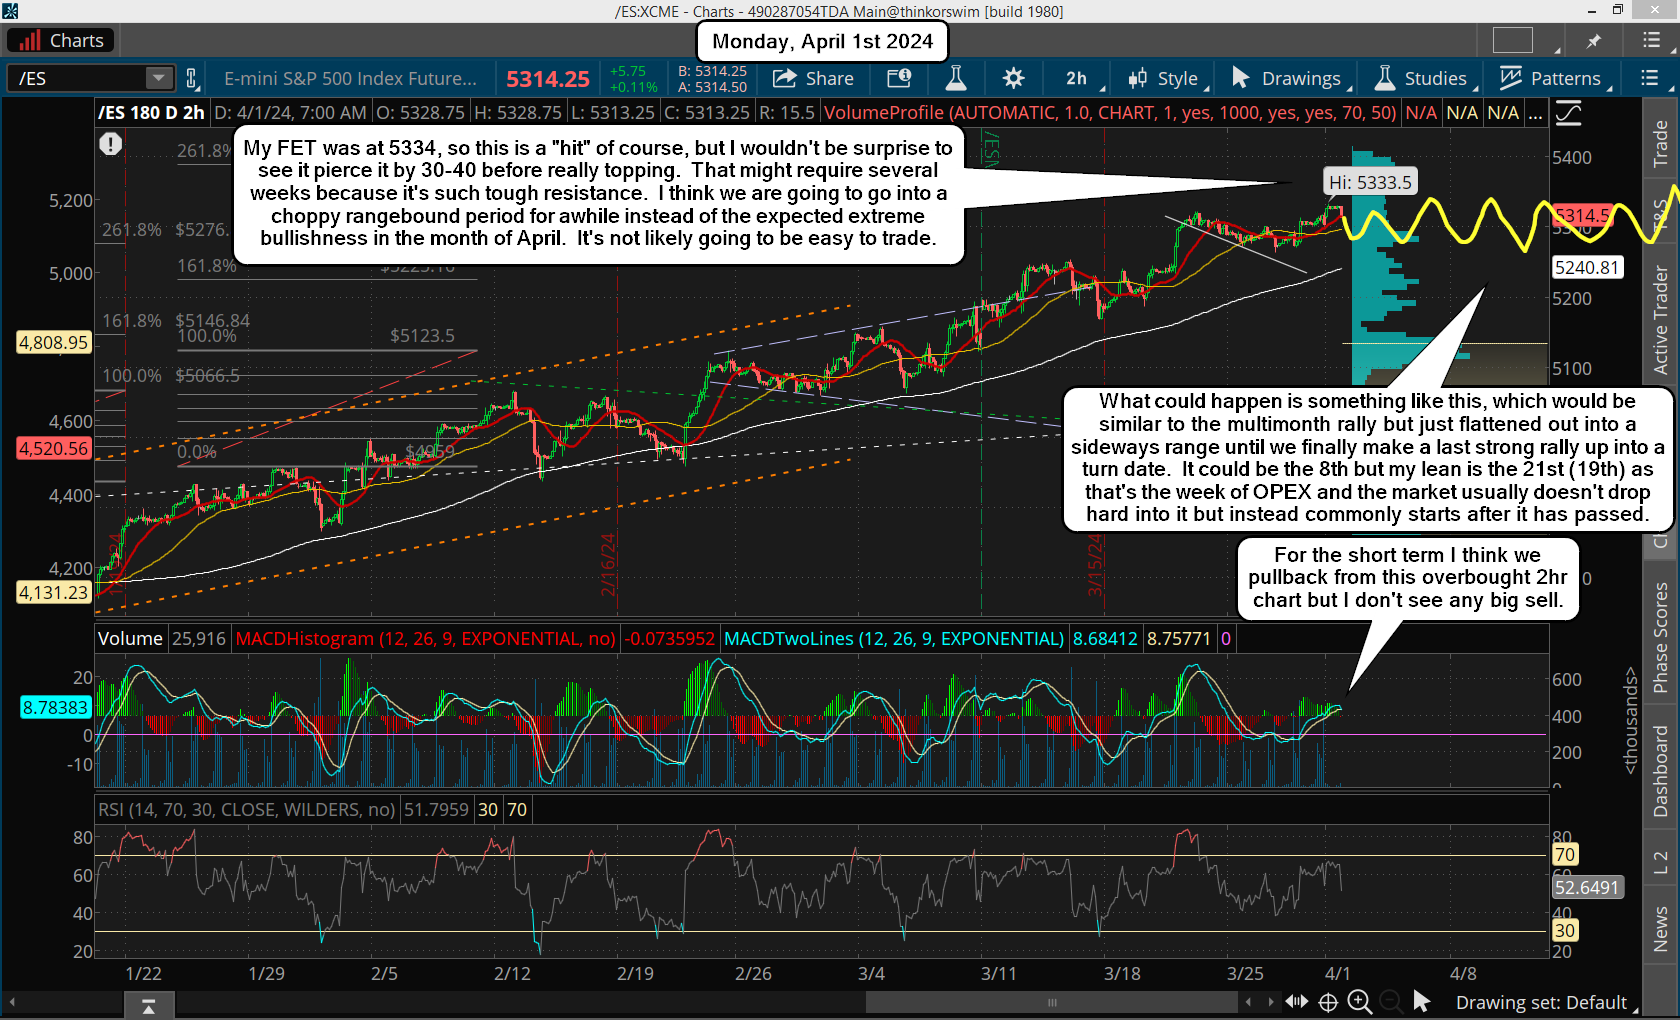
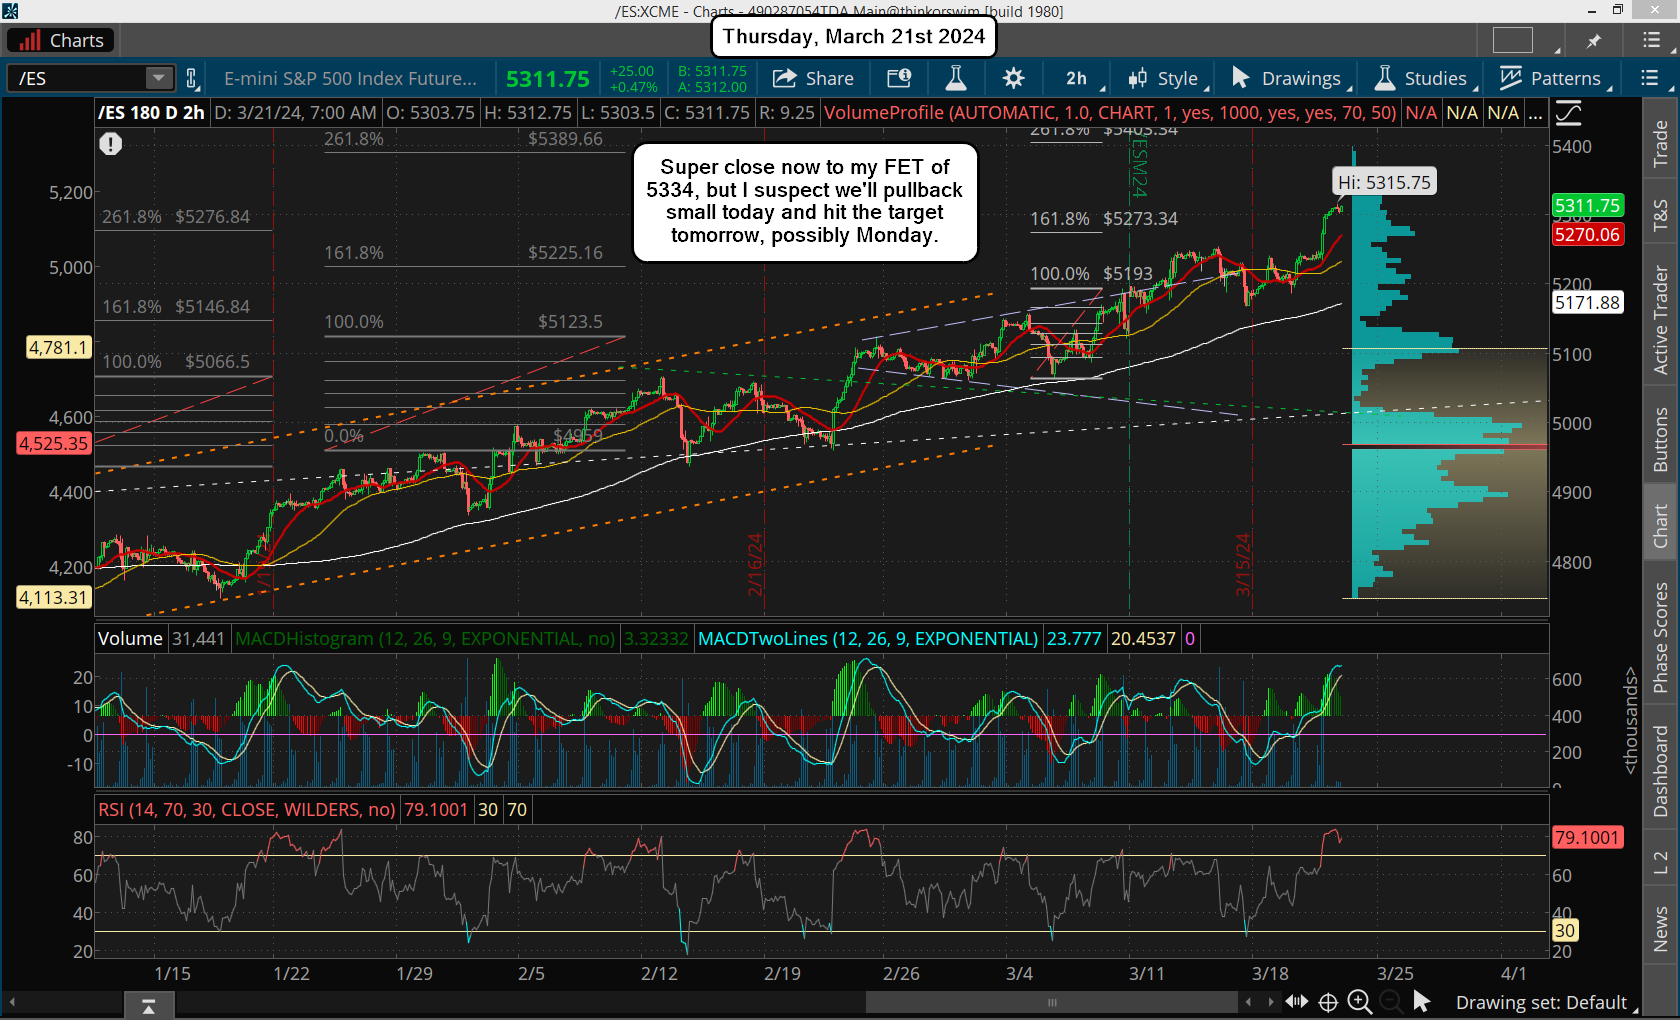
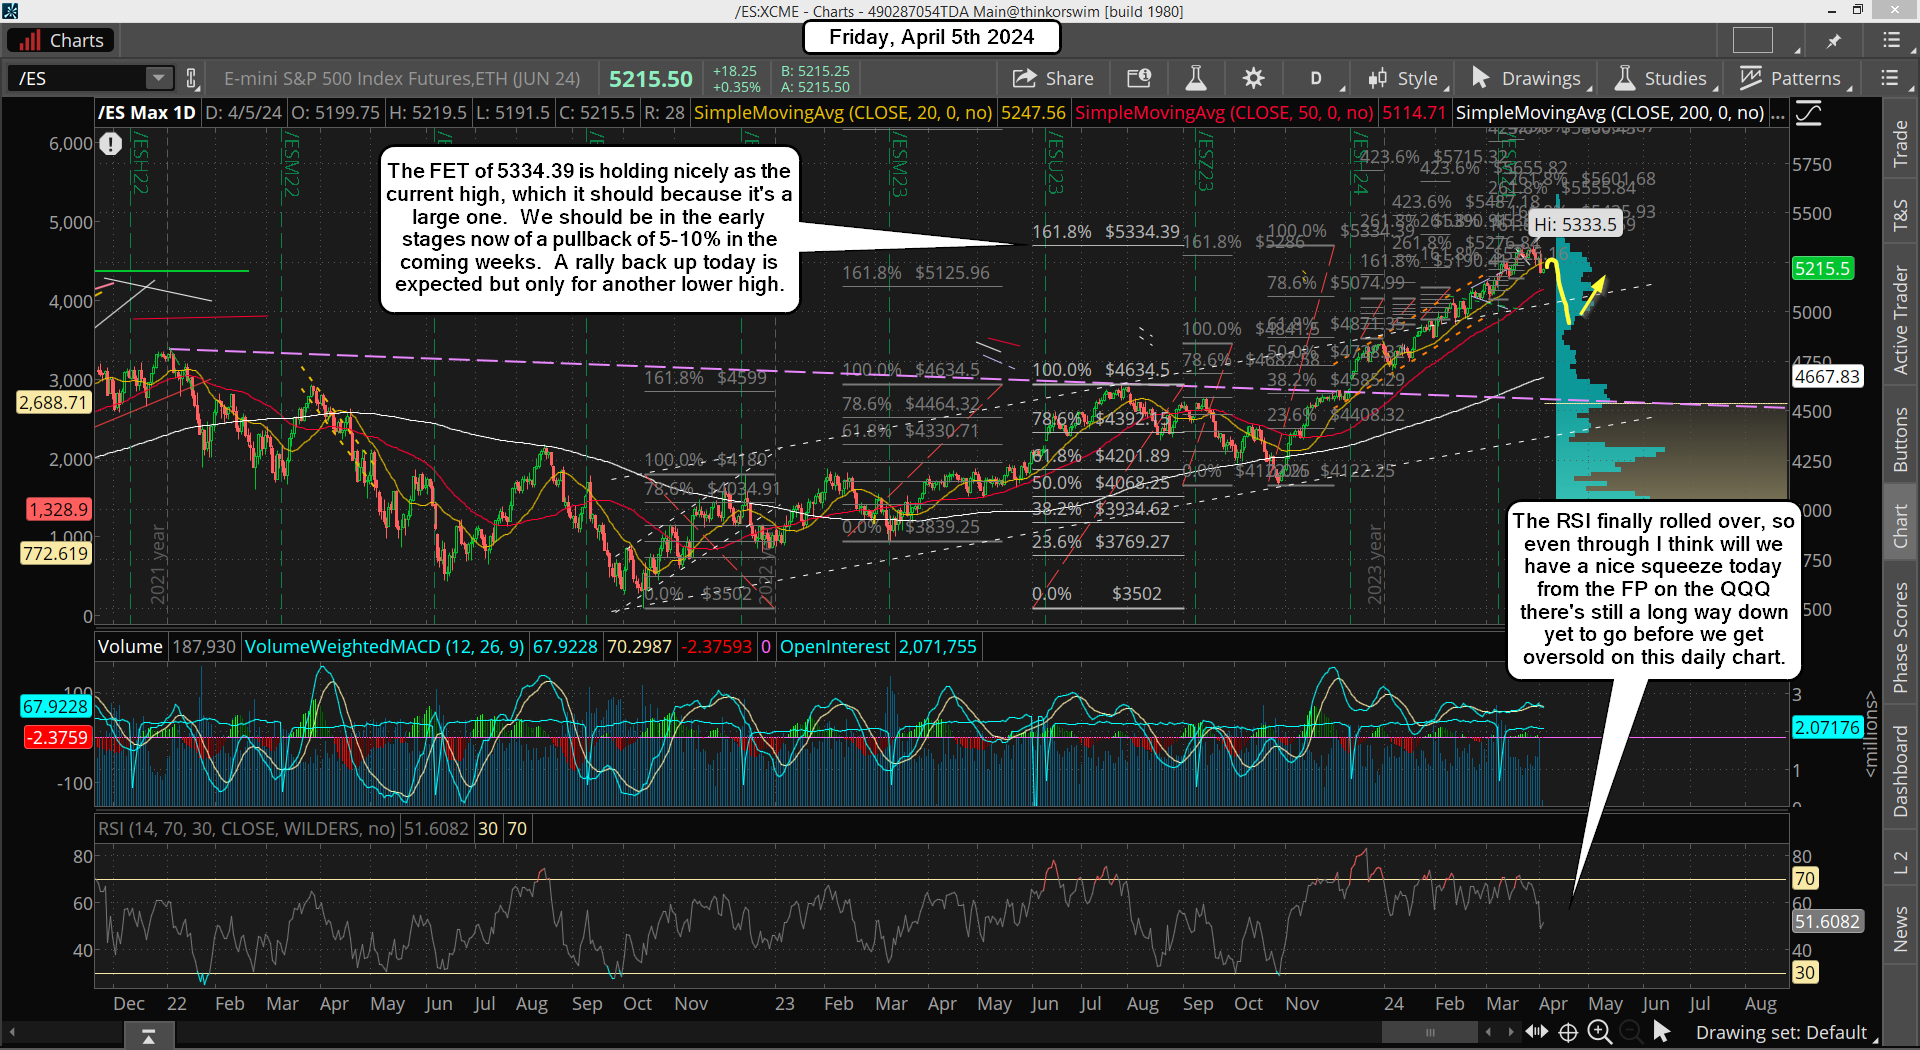
Now if on the other hand the bottom comes today and we rally hard both today and tomorrow then I'd worry about next week being down... an April Fools drop on the 1st maybe? For that to happen though I'd be looking for 100-150 point rally into the close on Thursday. I think one of these 3 scenario's could happen, but I don't know which one. That rally would need to make a new all time high of course, which should hit and pierce my FET of 5334 on the ES (chart below).

That could happen, and if it does then no one will be short going into a 3 day weekend, which opens the door for a bigger pullback next week. One way or the other a big move is coming. It should up, but I don't know if it starts today after hitting the downside FP and then rallies up into the close tomorrow, or if the rally happens next week from closing down for the week to trap short before a big squeeze.

My lean is toward hitting it today and putting in 2 day squeeze to make a new all time high, which sets up next week for another pullback. But I'll play whatever I'm given and will be focusing my attention on what the technicals say after the rally gets started.

Have a blessed day.

ES Morning Update March 26th 2024

0

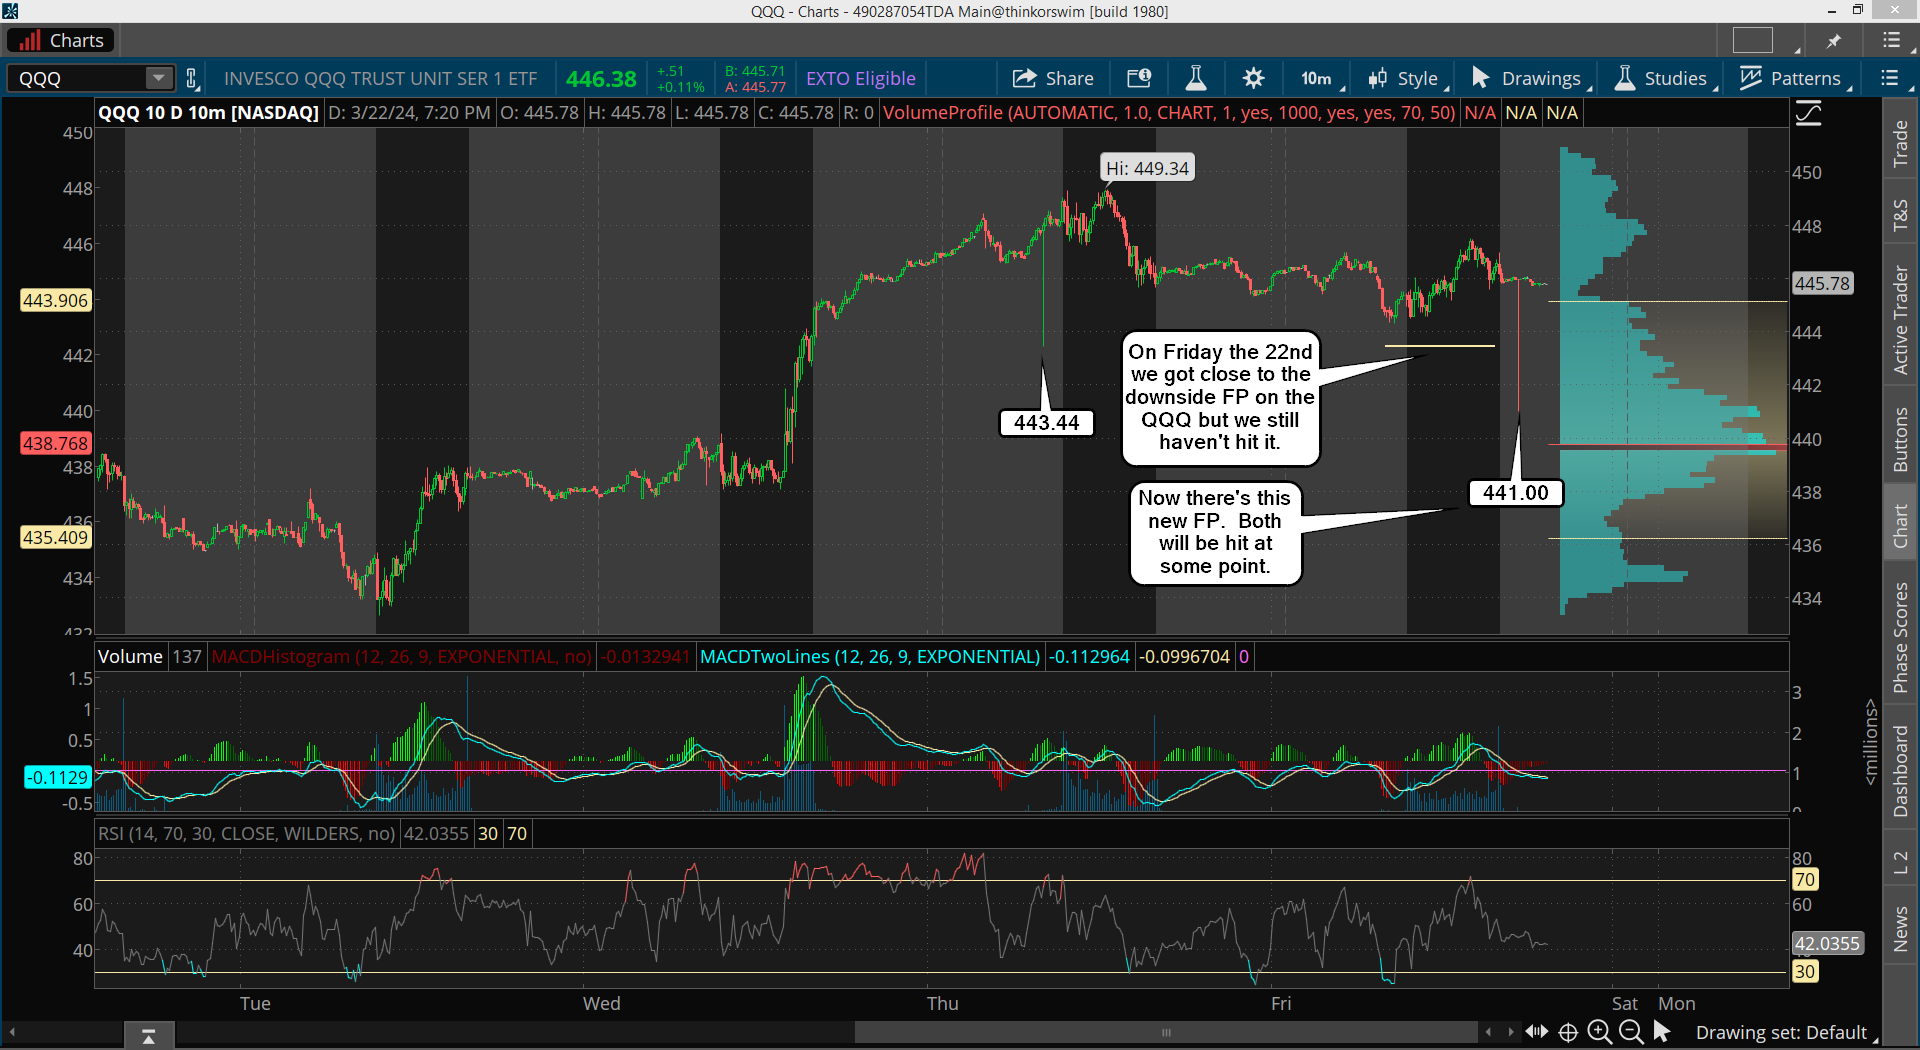
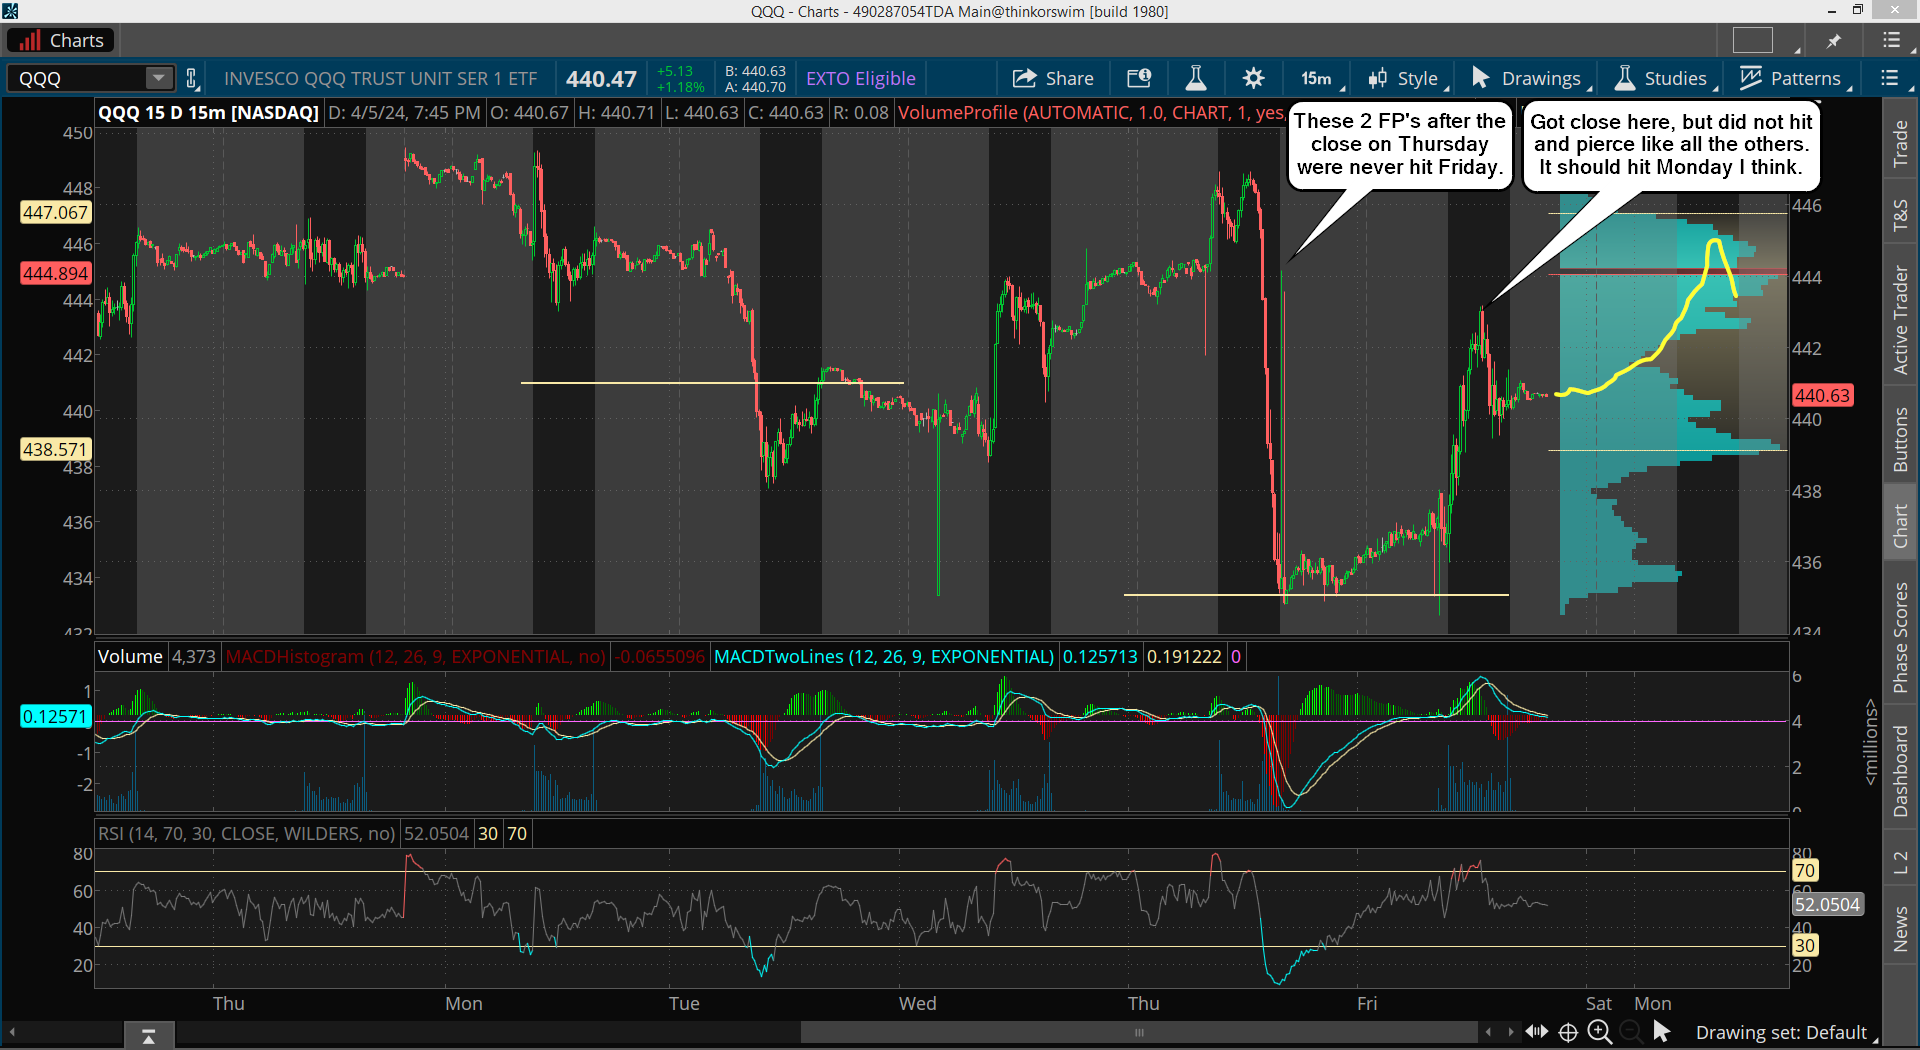
A choppy day yesterday with a negative bias. The 443.44 FP on the QQQ was hit and pierced, so it's done now. The new upside FP almost got hit but came shy a little and the lower FP of 441.00 is still out there and will be hit at some point.  Here it is...

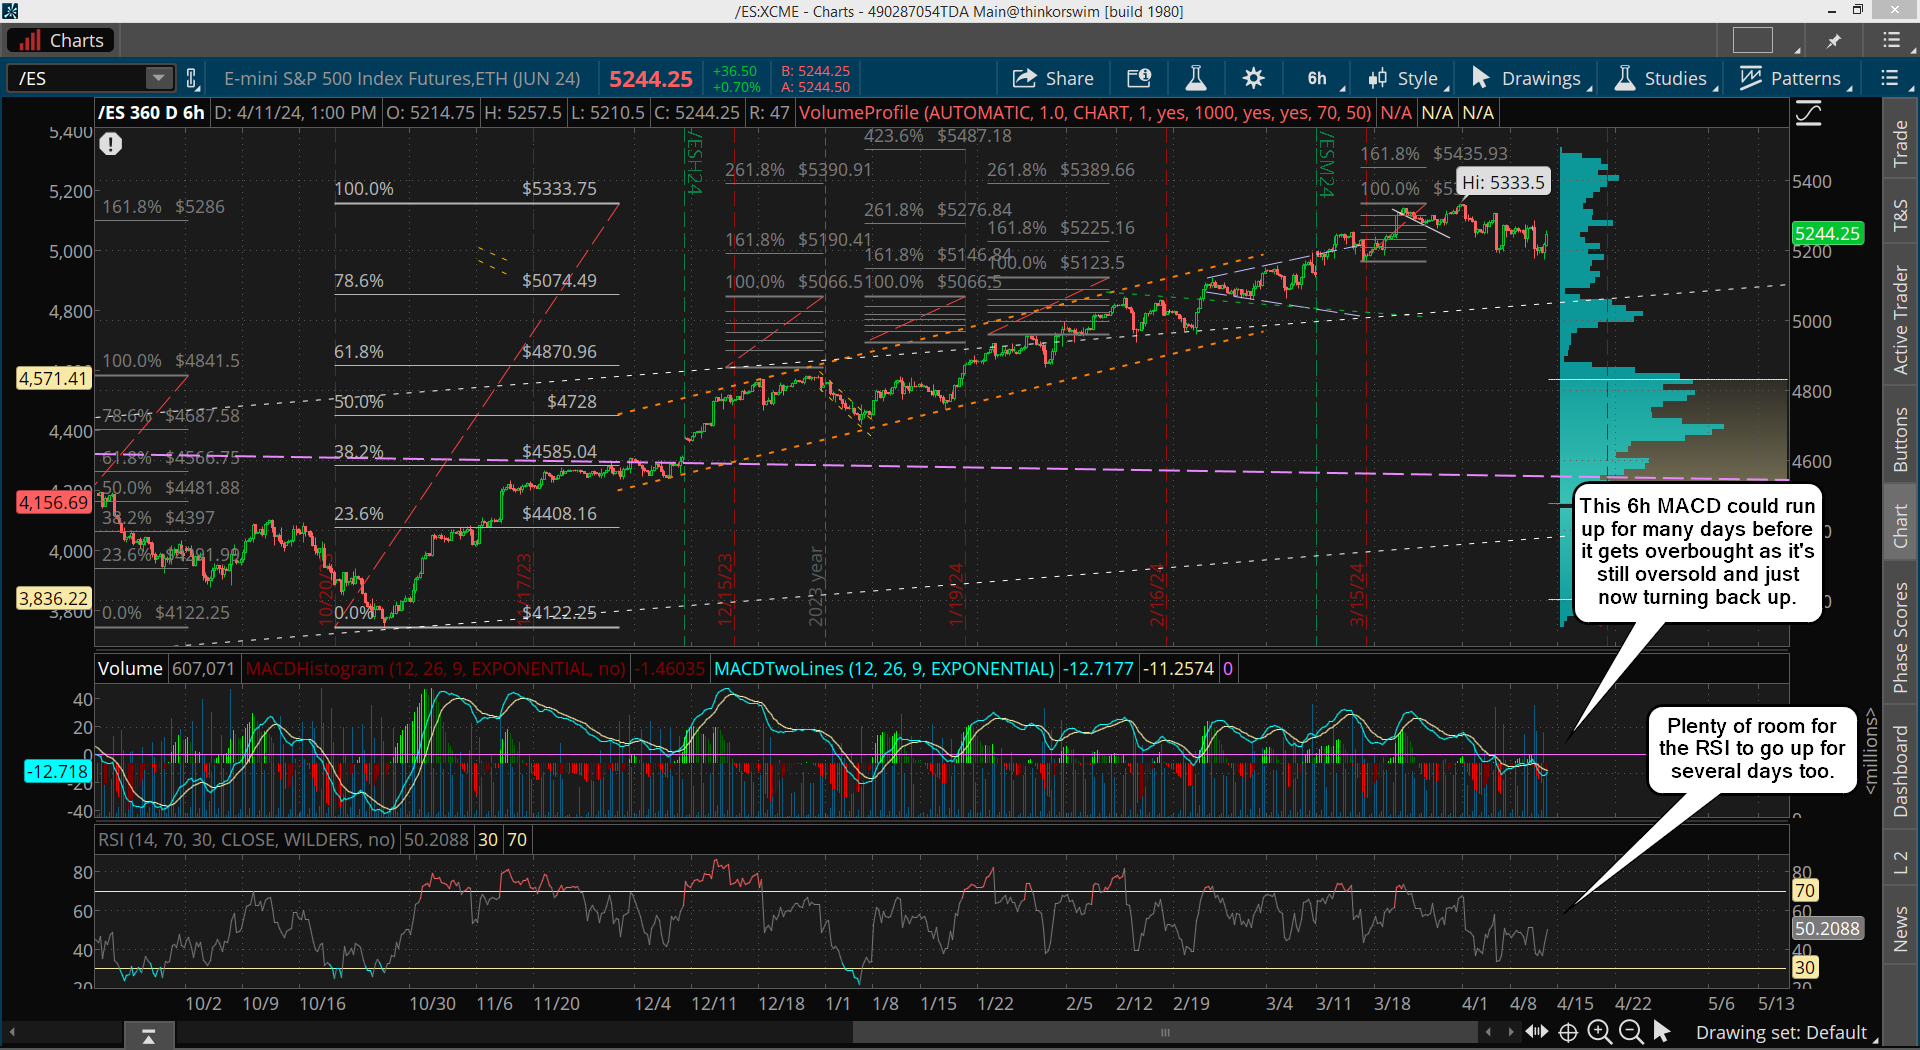
Looking at the technical picture we should go lower before any strong rally up, which leans toward the downside FP being hit today, maybe Wednesday, but I think it hits today. As for the upside FP... well, it might hit in the morning session first and then we drop for the lowest FP. If so, I'd say the RSI and MACD will be oversold enough on the 2hr chart to put a bottom in and allow another good move up, which again... might make another higher high, or fall short.

Once we hit that lower FP I think we'll be oversold enough to produce a strong move up, which should last into the end of the week this Thursday. Then we have a long 3 day weekend ahead, and I would not be surprise to see another pullback into the first week of April. The solar eclipse is on the 8th, and I do think that could cause some shakiness in the market until it's past by.

It would be a great time to pull the rug out on the bulls... especially if they hit my FET of 5334 and pierce it this week. Personally I'm only interesting in going long on the hit and piece of the downside FP on the QQQ at 441.00, which could be around 5250 or so on the ES. No shorts for me right now... not yet at least. Maybe if there's a new all time high to my FET by this Thursday close, as by then I'd think we'll be overbought enough to get a deeper pullback. And I'm sure all the bears will be toast if this happens.

Have a blessed day.

ES Morning Update March 25th 2024

0

(Post wrote on the weekend)

Last Friday did not give us the last higher high that I was hoping for, so today is the last chance to setup a big drop. Another higher high is needed as the turn date window was from the 22nd to 25th and if it pulls back and makes a low then I'll have to say it flipped and produced a bottom instead of a top (meaning it's skipped).

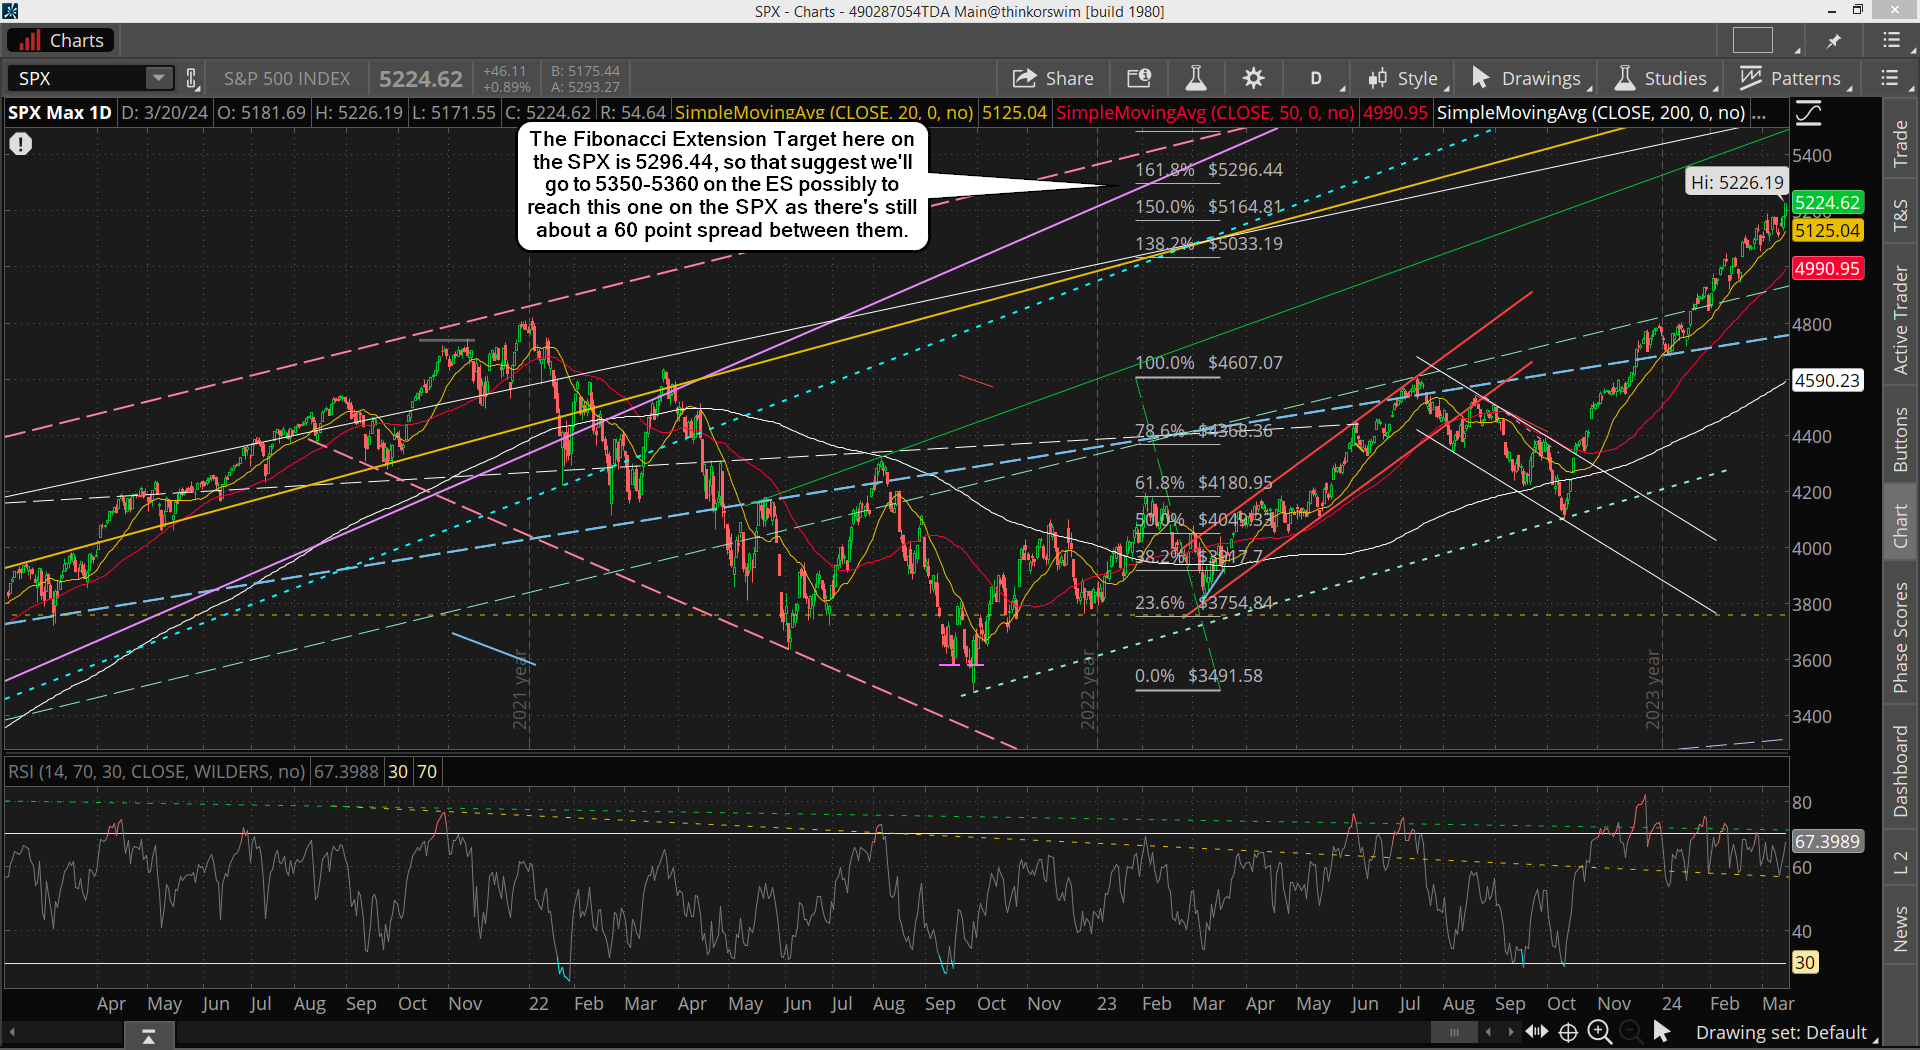
Ideally we hit and pierce through the FET of 5334 on the ES and 5296 on the SPX as well, but certainly not required as it could just be a point higher.  Like I said previously the FET could fall shy or piece and we are close enough to it with the current high put in last week.

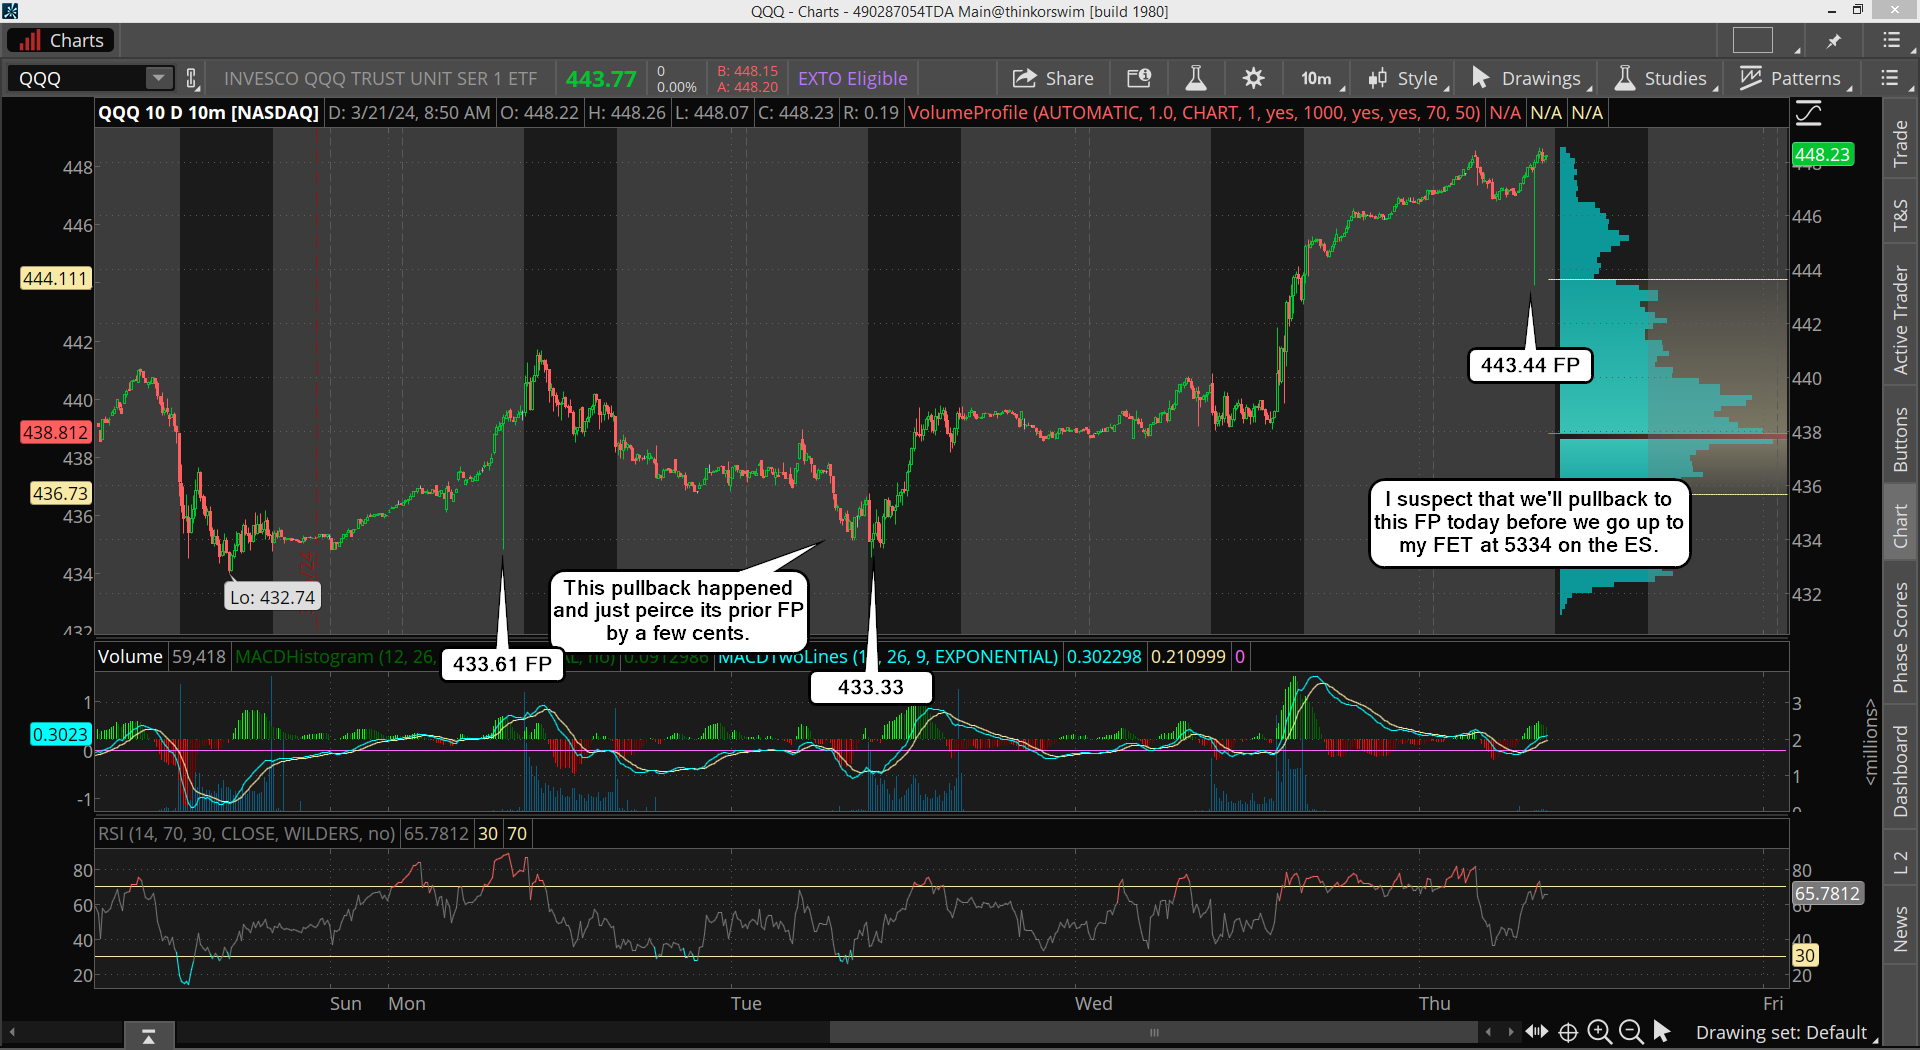
I exited my short at the close Friday at a breakeven as I just didn't like the way the market looked and felt. We pulled back small and got close to the FP on the QQQ but never hit it. I just didn't want the time decay over the weekend and decided that cash is a safe position when I don't know which direction it's going first on Monday. If we drop to the FP, (and we got another one after the close Friday that it lower), then I'll look for a long as the RSI and MACD's will likely be oversold on the 2hr chart for sure, but it could also be on the 6hr too. Here's that new FP...

So there's the 443.44 FP that failed to hit on Friday, and the new 441.00 FP after the close, which is probably around 5250-5260 on the ES I'd estimate. It's very frustrating to "not" get a setup for a nice correction, but you can't make the market do what you want it to do.

So I'm really rooting for a nice squeeze Monday to hit the FET and then reverse back down to start that correction. I would still be leary with those FP's there as typically they don't put out FP's like this if they plan on a short term correction and not just another dip to be bought. Most of the time the Fake Prints will be levels that they plan to pullback to and then turn back up, but I do find it odd that they put out a second downside FP before they even filled the first one.

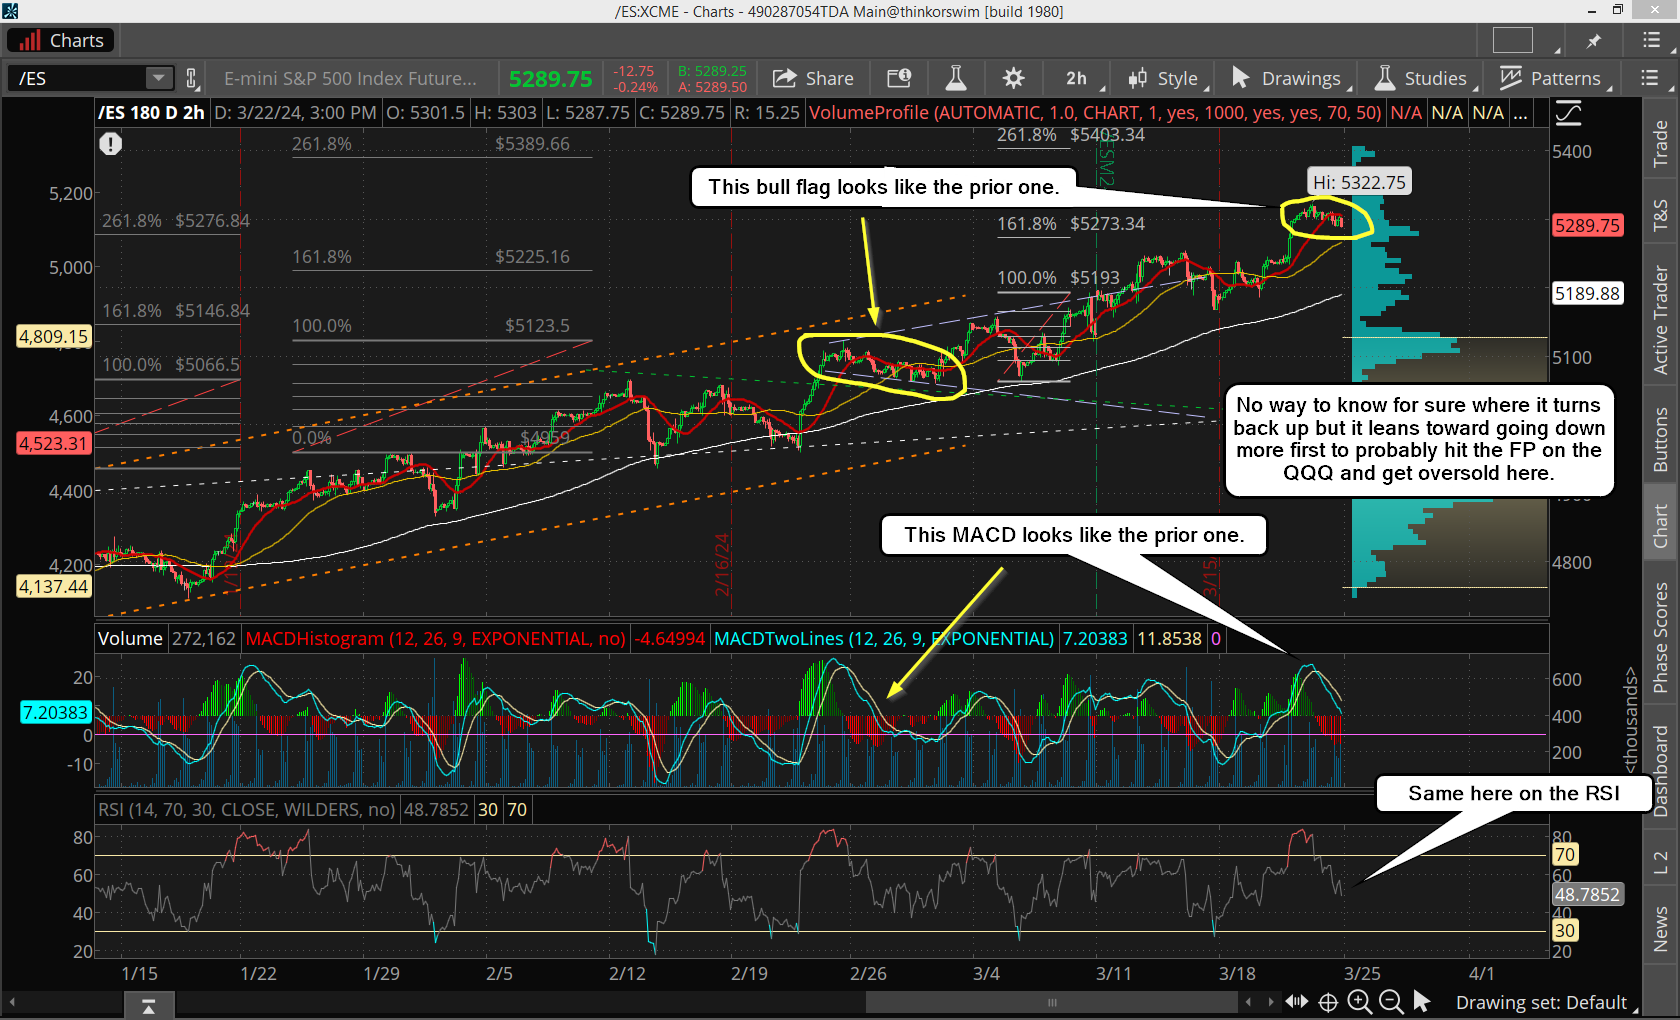
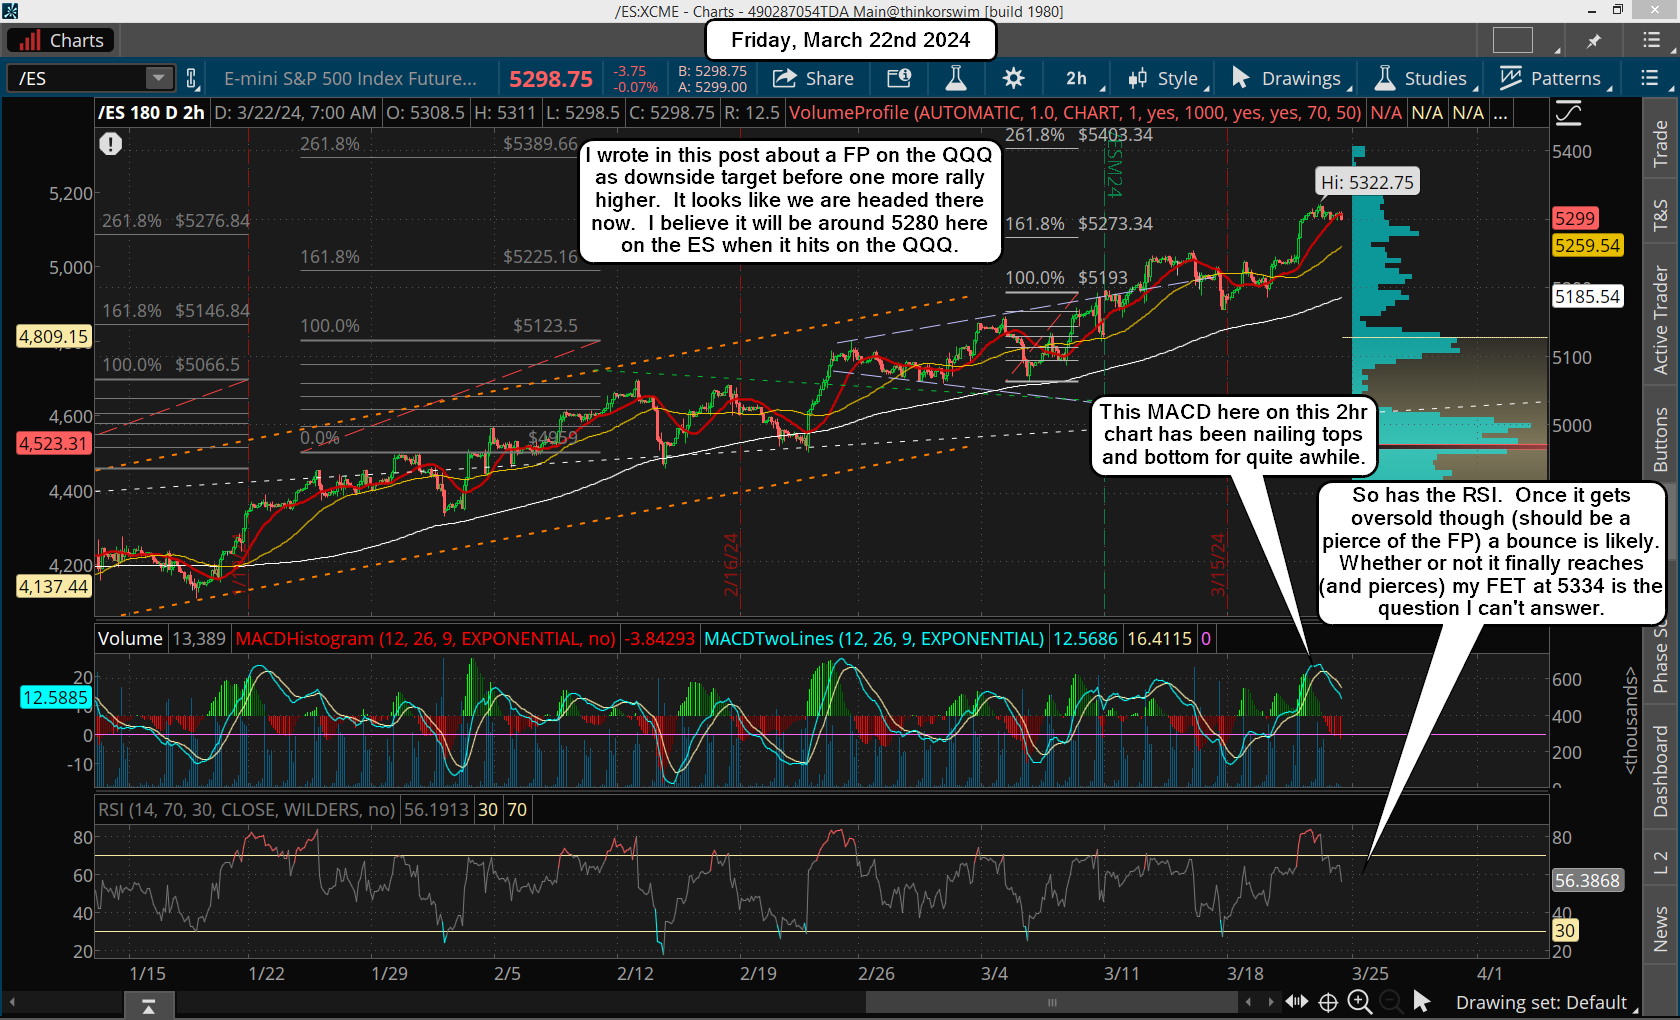
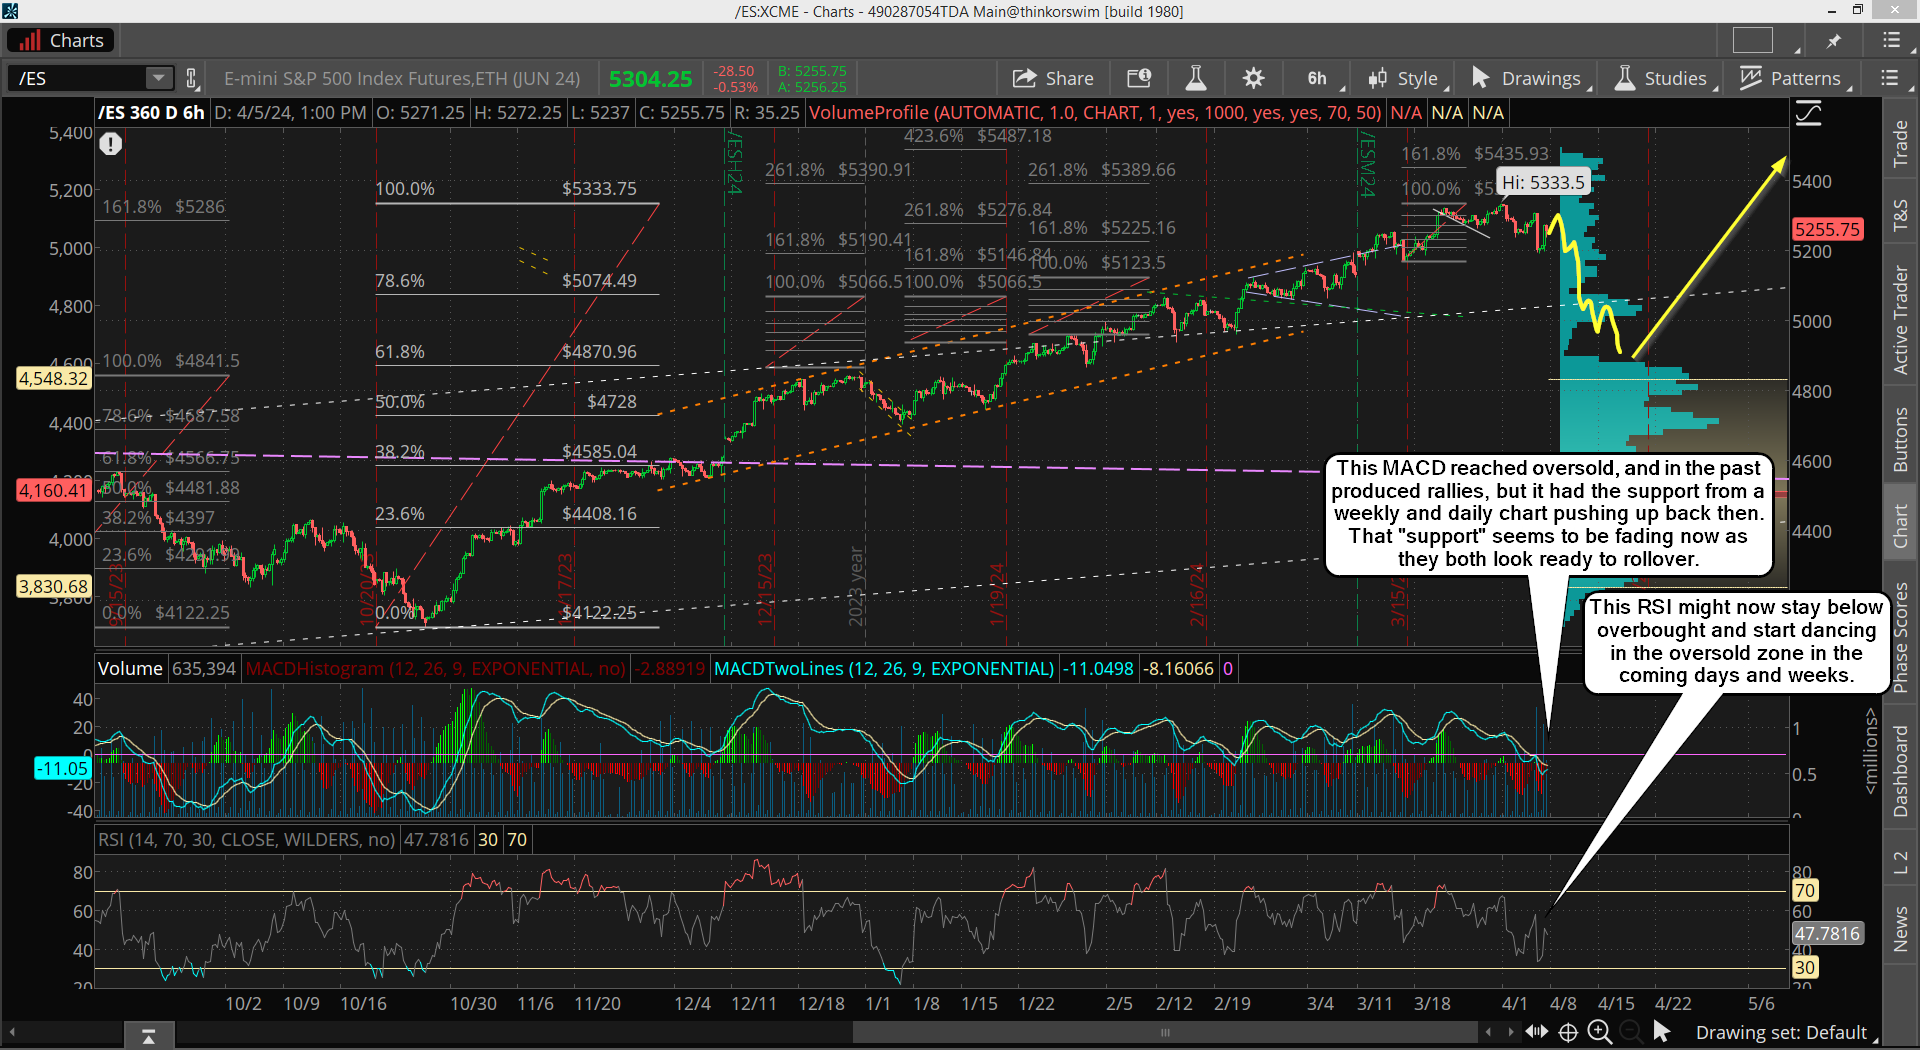
As for the technicals the MACD and RSI on the 2hr chart turned down sharply from Thursday into Friday but the price didn't drop much. It looks a lot like the bull flag that was made from 2/23 to 2/29, and while it looks like it's got lower to go on this screenshot from Friday it could turn back up anytime.

I normally would think that this pattern would play out by going lower to get fully oversold first on Monday, and there's the FP's on the QQQ to support that line of thinking... but since we are still in the "turn window" I can't rule out that it turns back up from where it ended Friday and makes that last rally back up instead.

Then we rollover and drop to hit the FP's and ideally keep going to start the much needed correction that everyone is wanting. We have several things that support this, which of course the first one is the turn window. Then there's the fact that Monday is a Full Moon and we also a Lunar Eclipse is the 24th-25th. Plus we are close to a Solar Eclipse on April 8th. Lastly we have my Fibonacci Extension Target that is super close too. Many reason that we could get a nice correction, but we MUST rally to a higher high first.

My thoughts on this are that the turn window will be skipped so that the market doesn't put in a major top, as if it does then a larger drop would be needed, and it would have to bottom into another turn date.  I just don't think they will do it.  Instead I think they bypass it and put in a low Monday.

Then Tuesday or Wednesday we rally back up into the end of the week, which is Thursday because we are closed on "Good Friday" for the holiday.  Usually light trading happens during holiday weeks, which supports the bulls of course.

The FP's on the QQQ tell me that's where the bottom is likely going to be at before the turn back up.  As for which one?  Well, I have to go with the deepest one at 441.00 for the target.  I think that would put the ES in the 5250 zone most likely.  It's just a rough guess as they don't track each other as close as the SPY would to the SPX and the ES, but that's my best guess.

So, unless we start off Monday with a strong rally up odds favor this scenario.  It would suggest a small bounce early in the day that hits overhead resistance and can't get through it.  Then it rolls over to head to the FP's into the the close or Tuesday morning.  Resistance is around the 5300 zone now as you can see in the chart above.

Now the bounce back up will the the "tell-tale" sign I think as it might not clear that same resistance on the way back up?  I just don't know?  While I would love to see that last squeeze higher to hit 5334+ it might fail.

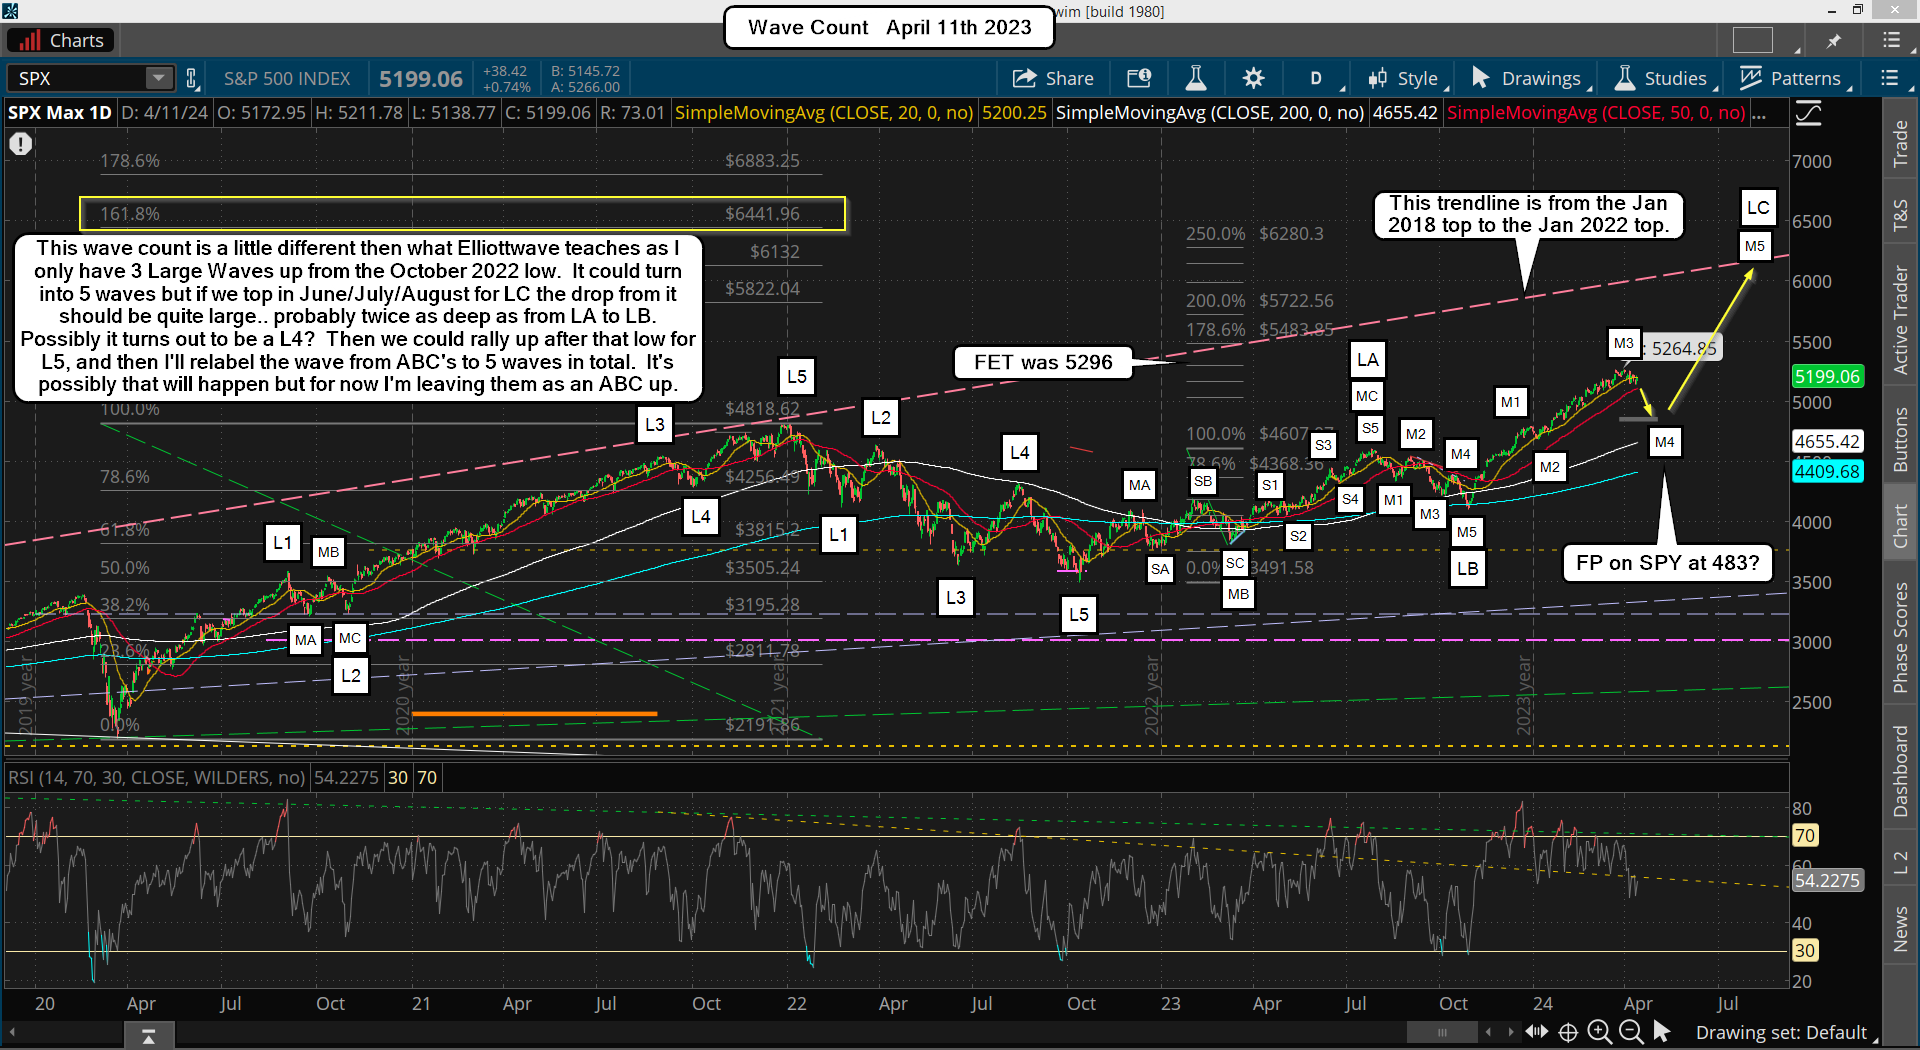
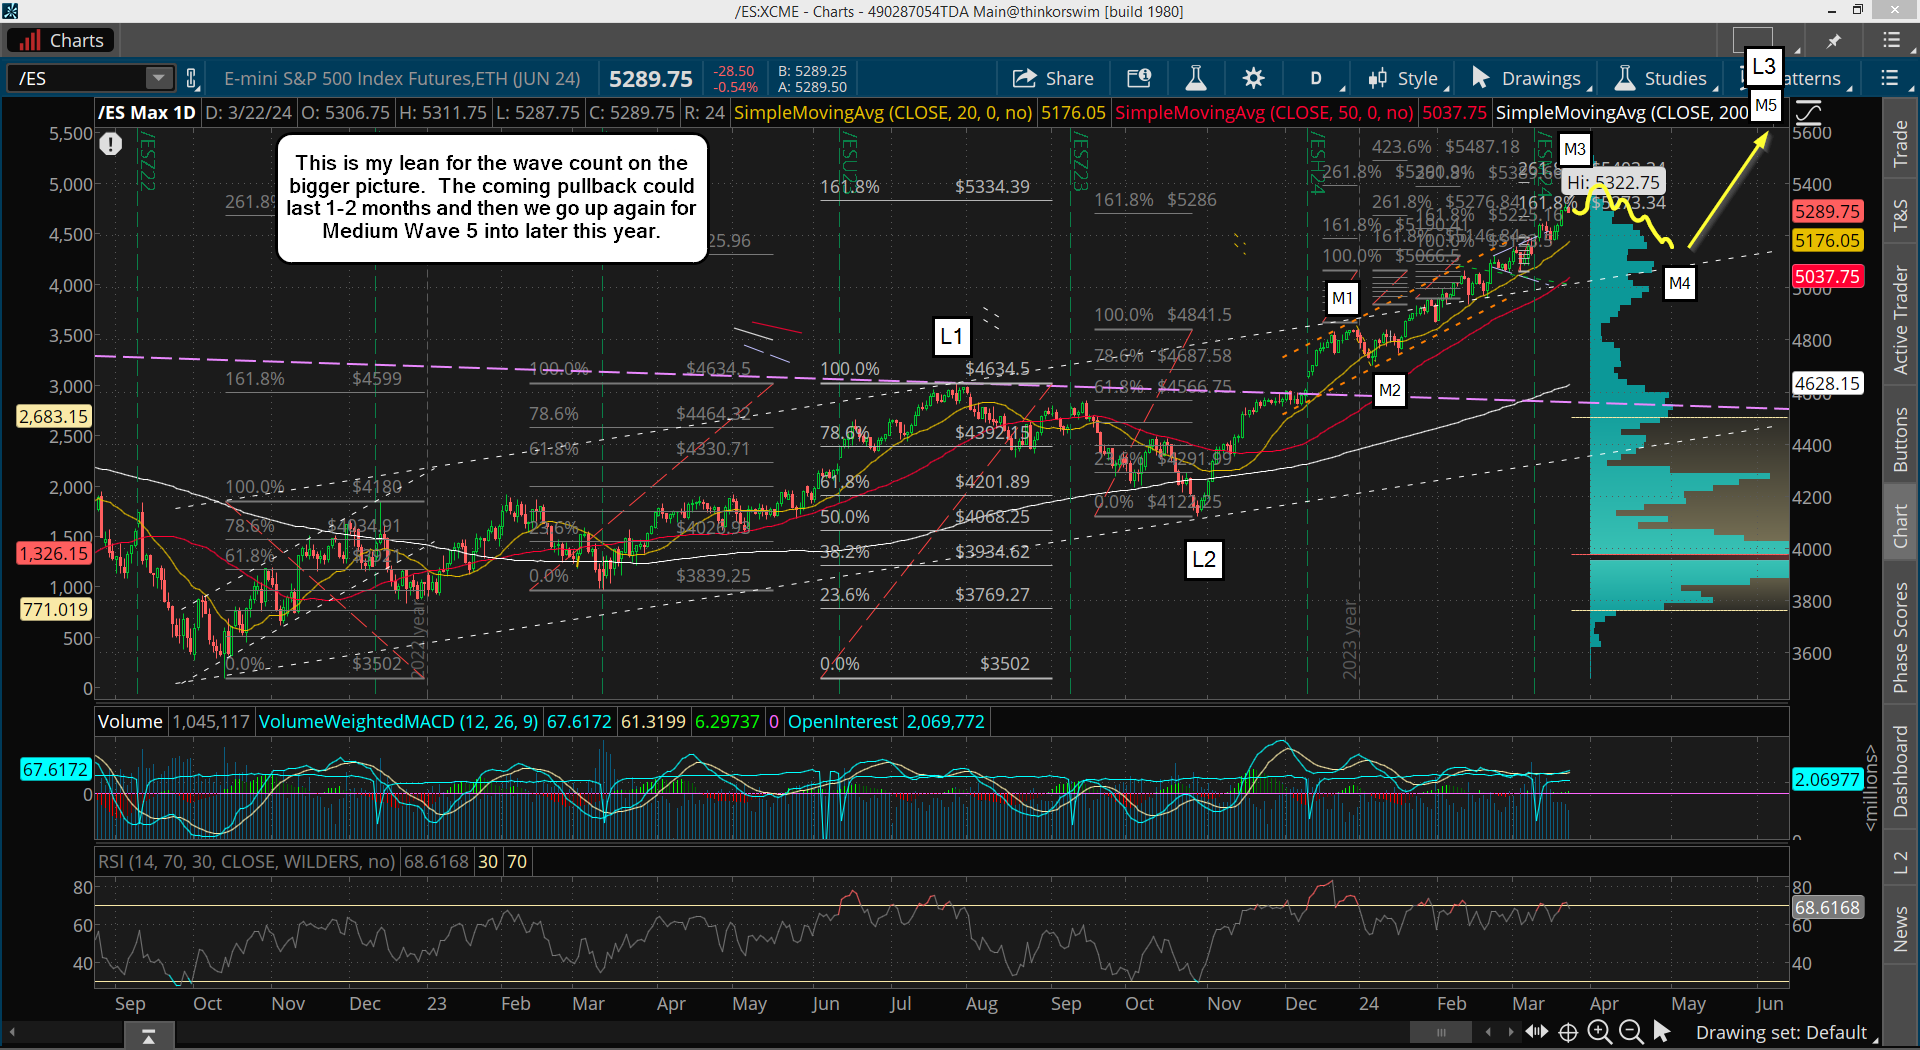
Next, let's go over the wave count.  Below is the bigger picture chart...

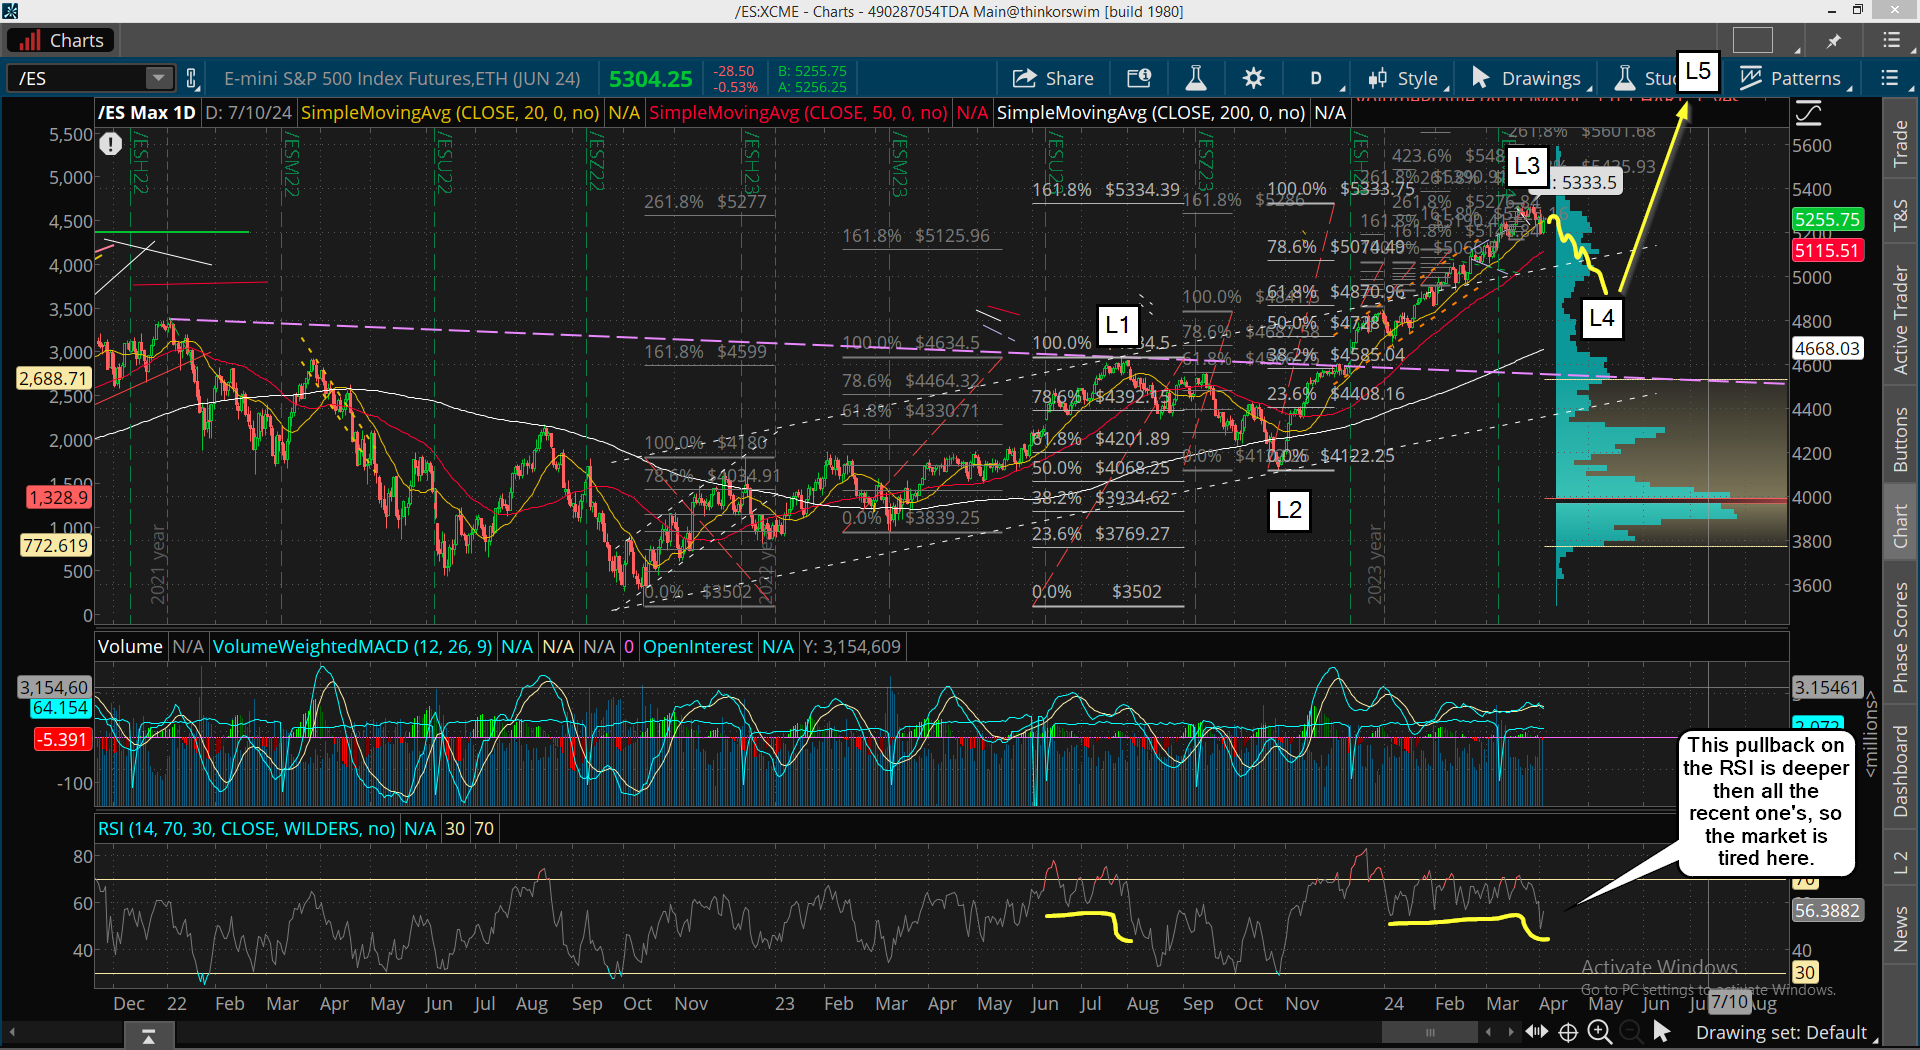
I've moved around some of the waves a little based on where I think we are at now and what should follow.  I don't think we have finished Medium Wave 4 down basically.  I think that's the wave we will see into April for the coming correction.

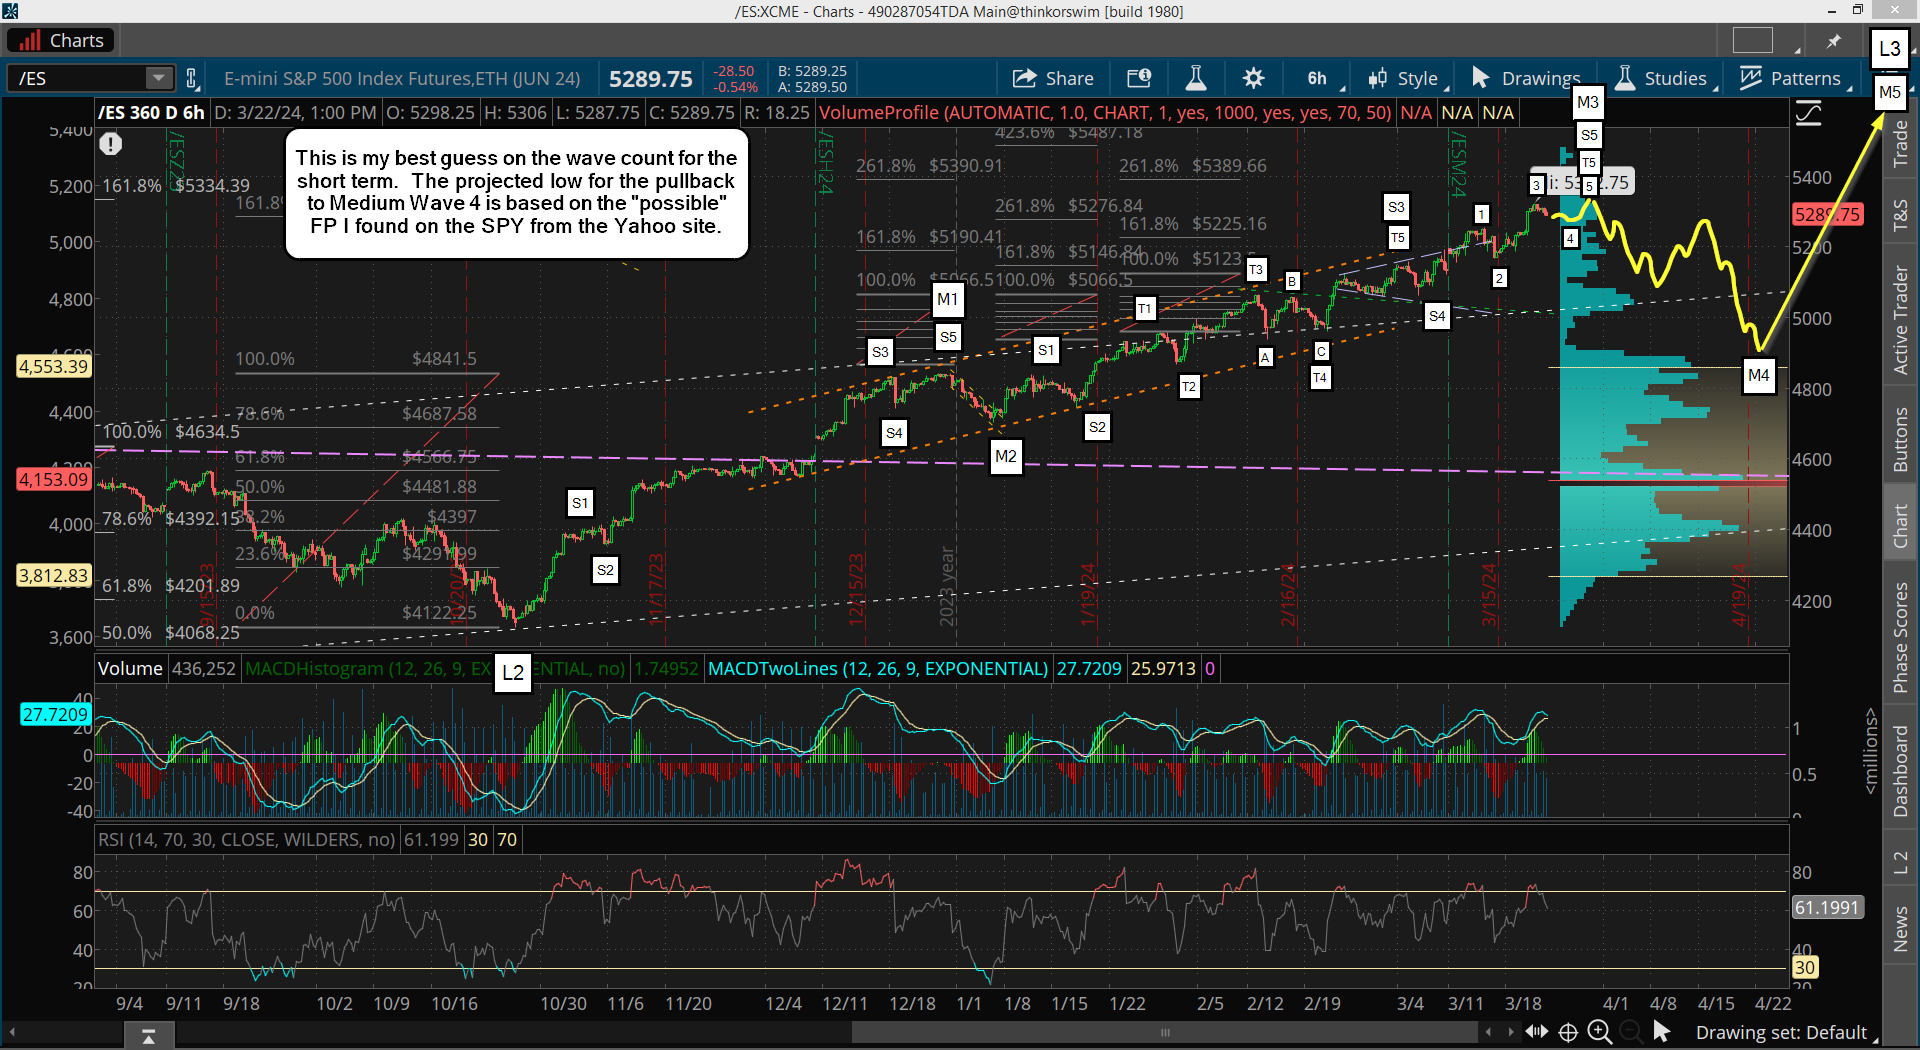
Here's the short term..

On this chart you can see I did my best to label the Small Waves, Tiny Waves and even the Extra Tiny Waves.  I think the pullback to the FP's on the QQQ will be Extra Tiny Wave 4 and then we'll get Extra Tiny Wave 5 up later this week to make another higher high.  That's where we should reach the FET of 5334 and complete T5, S5 and M3... and then we start a correction for Medium Wave 4 down.

If this all plays out like I think then we could reach the "possible" FP on the SPY sometime into mid-April to end the correction.  The Solar Eclipse is on April 8th so that could be the biggest and scariest part of the drop, (the Small Wave C?) but it might chop around the low for another week or so before putting in the final low.  Hard to know for certain, but I would look for this to unfold in an ABC pattern with the C wave subdividing into 5 smaller waves, plus the A wave as well.  The B up could be just one wave or subdivide into a 3 wave pattern.  That's all I have for now.

Have a blessed day.

ES Morning Update March 22nd 2024

0

Yesterday before the open there was a FP on the QQQ at 443.44, which the last time it was hit the prior day and then we turned back up and rallied strongly. So that suggests we will go back up again to hit my FET of 5334 soon. Will it hit today or Monday... I don't know? I'll just say I'm very nervous here trying to short this super strong market. Here's that FP...

So everything has to line up perfectly today (or Monday) for me to risk a short. While I know it's coming I've been taking longs for a month now on pullbacks and have been doing great, so going against the trend is never easy. I really feel like just sitting in cash to see if it happens or not? Going long on a pullback (or correction) is much easier then trying to nail the top. Do I think it will pullback? Yes... but I don't know for certain how much or when. I really have to be cautious here, that's all I'm saying.

What would give me more courage?  A really strong move up to show exhaustion.  I don't think it will happen today, but it's possible I guess.  I lean toward Monday having some last rally to say 5375-5400 on the ES.  That would really fool a lot of people to see that happen on Monday I think.  I know my FET is at 5334 on the ES and 5296 on the SPX, but a pierce of them of 30+ points would be wonderful to short.

But past history doesn't show that much of a move as commonly happening.  Most of the "pierces" were 10 points, maybe 20?  However, on a percentage basis that amount of points back then, if repeated now, could be 30 or 40 points.

Lastly, I will add that I did take a short yesterday with the intention of just playing the FP on the QQQ... meaning I was just looking for a small pullback to hit that FP and then I'd look to exit and wait for that last rally up to 5334 where I'd look to re-short, if everything lines up and I have the courage.

However, Fed Chief Powell is speaking again today (oddly, as it's just after the recent FOMC), so the top could already be in?  Of all the Fibonacci Extension Targets that I researched (back to 2020) about half of the FET's pierced through and the other half fell shy.  We got within 20 points or so yesterday, so maybe it's already topped?

It's just not easy to know at this point because it's so close to the target that it might be done.  I'll just have to watch the RSI on the 2hr and 6hr chart to see when it gets oversold, and the FP on the QQQ too.  Currently the 2hr RSI could be oversold at some point today if we pullback just a small amount.

Now the 6hr RSI, and of course the daily, could take a long time to get oversold... especially the daily.  Really a tough call here.  Again, I took a short but I don't know if it's just going to reach and pierce the FP on the QQQ, or if the top is in and we are starting the correction now.  We'll see.

Have a blessed day.
ES Morning Update March 21st 2024

0

We got the rally yesterday that I was expecting. We are close to my FET of 5334 on the ES, which ideally hits tomorrow, or Monday. It's a window of time for the turn date, so it could be tomorrow or Monday. For today I'd like to see some sideways chop to make a bull flag that leaves Friday for the move up to my target, and likely above it some. But if it hits today then I'll likely take my short and just hold through Friday and Monday where it "could" go a little higher. It's not a perfect system so there's always a little wiggle room as trying to nail the exact date for any top or bottom is always a best guess.

Last month I got this email about the The 1001 Nights of Ali Baba's Investments, which I thought was very interesting. Here's that post...

Introduction

Once upon a time, in a faraway land, there lived a poor woodcutter named Ali Baba. Despite his financial struggles, he always remained optimistic and hardworking, hoping for a better future.

One day, while working in the forest, Ali Baba stumbled upon a hidden treasure in a secret cave. The treasure belonged to a group of forty thieves, and Ali Baba decided to take some of the treasure for himself. However, when the thieves discovered that someone had taken their treasure, they began to search for the culprit.

Ali Baba managed to escape the wrath of the thieves, but he knew he had to be careful. He decided to use his newfound wealth to invest in the stock market, hoping to grow his fortune and secure his future.

For the next 1000 trading days or nights, Ali Baba watched his investments grow steadily. However, as the 1001st day approached, he began to feel uneasy. He had heard from a wise old sage that after 1000 trading days or nights, there was a possible downturn in the stock market.

Ali Baba didn't know what to do. He didn't want to lose all his hard-earned money, but he didn't want to miss out on any potential gains either. Finally, he decided to take a measured approach and sell some of his stocks to lock in his profits while keeping the rest invested for the long term.

As it turned out, the sage's prediction was true, and the stock market did experience a downturn. However, Ali Baba's careful planning and foresight paid off, and he was able to weather the storm without suffering any major losses.

From that day forward, Ali Baba continued to invest wisely and grow his wealth, all while keeping an eye out for any potential risks or challenges that might come his way.

(Original post here: The 1001 Nights of Ali Baba's Investments)

So I decided to do a little research on this.  What I found interesting is a 1000 days might have some value.  I went back to the 2020 crash, which was March 23rd in 2020, and then decided to add 1000 trading days.

Guess what that points to?  You guess it... March 22nd, 2024.  How funny is that?  Check it out yourself at the link below.

https://www.timeanddate.com/date/weekdayadd.html?d1=23&m1=03&y1=2020&

Lastly, the SPX cash has an FET of 5296.44, which is about 5350-5360 on the ES futures.  We could fall shy on the cash but if we base (or grind higher) today we could reach that level by tomorrow, or Sunday/Monday.

Have a blessed day.
ES Morning Update March 20th 2024

3

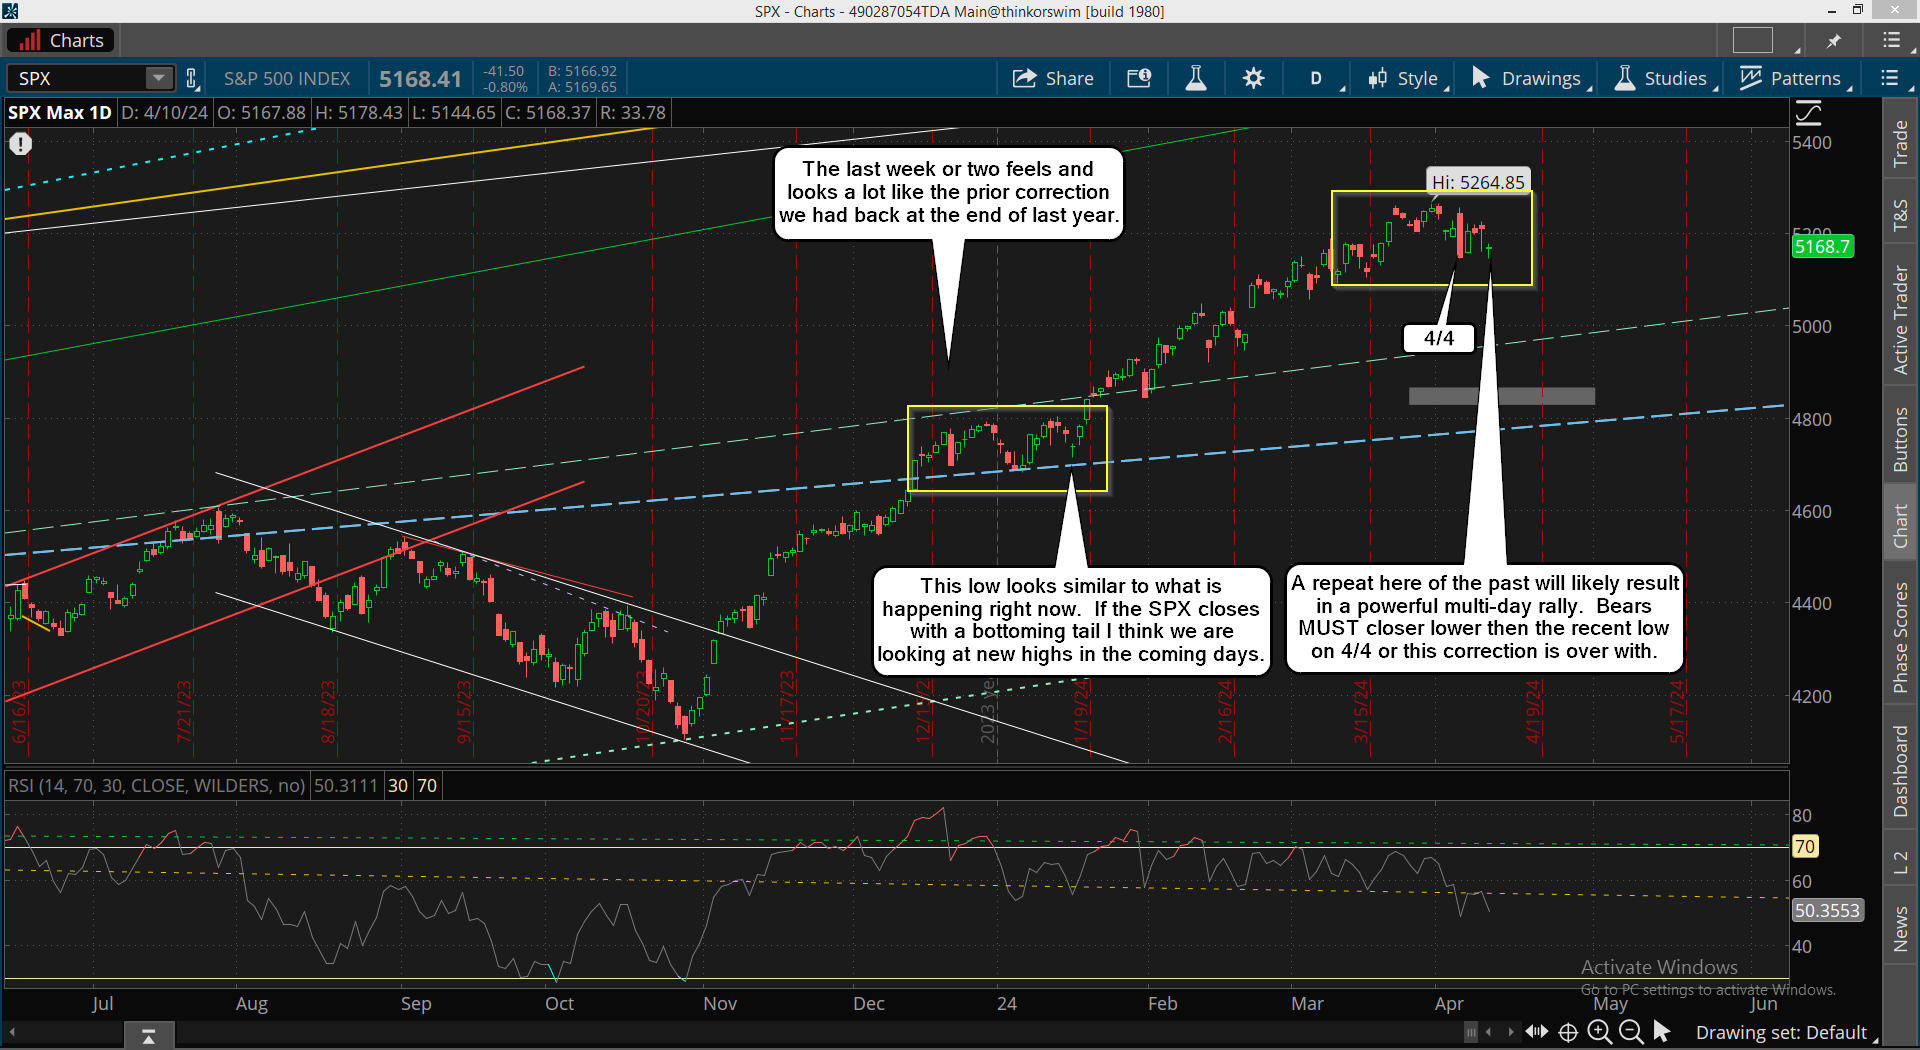
Today is the big day. The FOMC meeting at 2pm EST will decide the next big 100+ point move, which I think will be up. Sure there could be some wild swings up and down but by the close I expect the market to close up nicely. This is all setting up for a super nice short of 5-10% if we hit my FET (Fibonacci Extension Target) of 5334 on the ES, which it will likely piece it of course.

My FET of 5334 is based on the low from October of 2022 up to the high in July of 2023, which is a super important one because it's the largest one over the past 2 years. This means it should produce a pullback like the one that came after the July 2023 high, which was 11% and took 90 days to complete. Does that mean this coming drop will be last the same about of time? I don't know but the common theme is to flip between patterns, which I'd call that that one a slow choppy decline, meaning this one should do the opposite and be a fast drop with very few big bounces.

This is where it could drop to after we top...

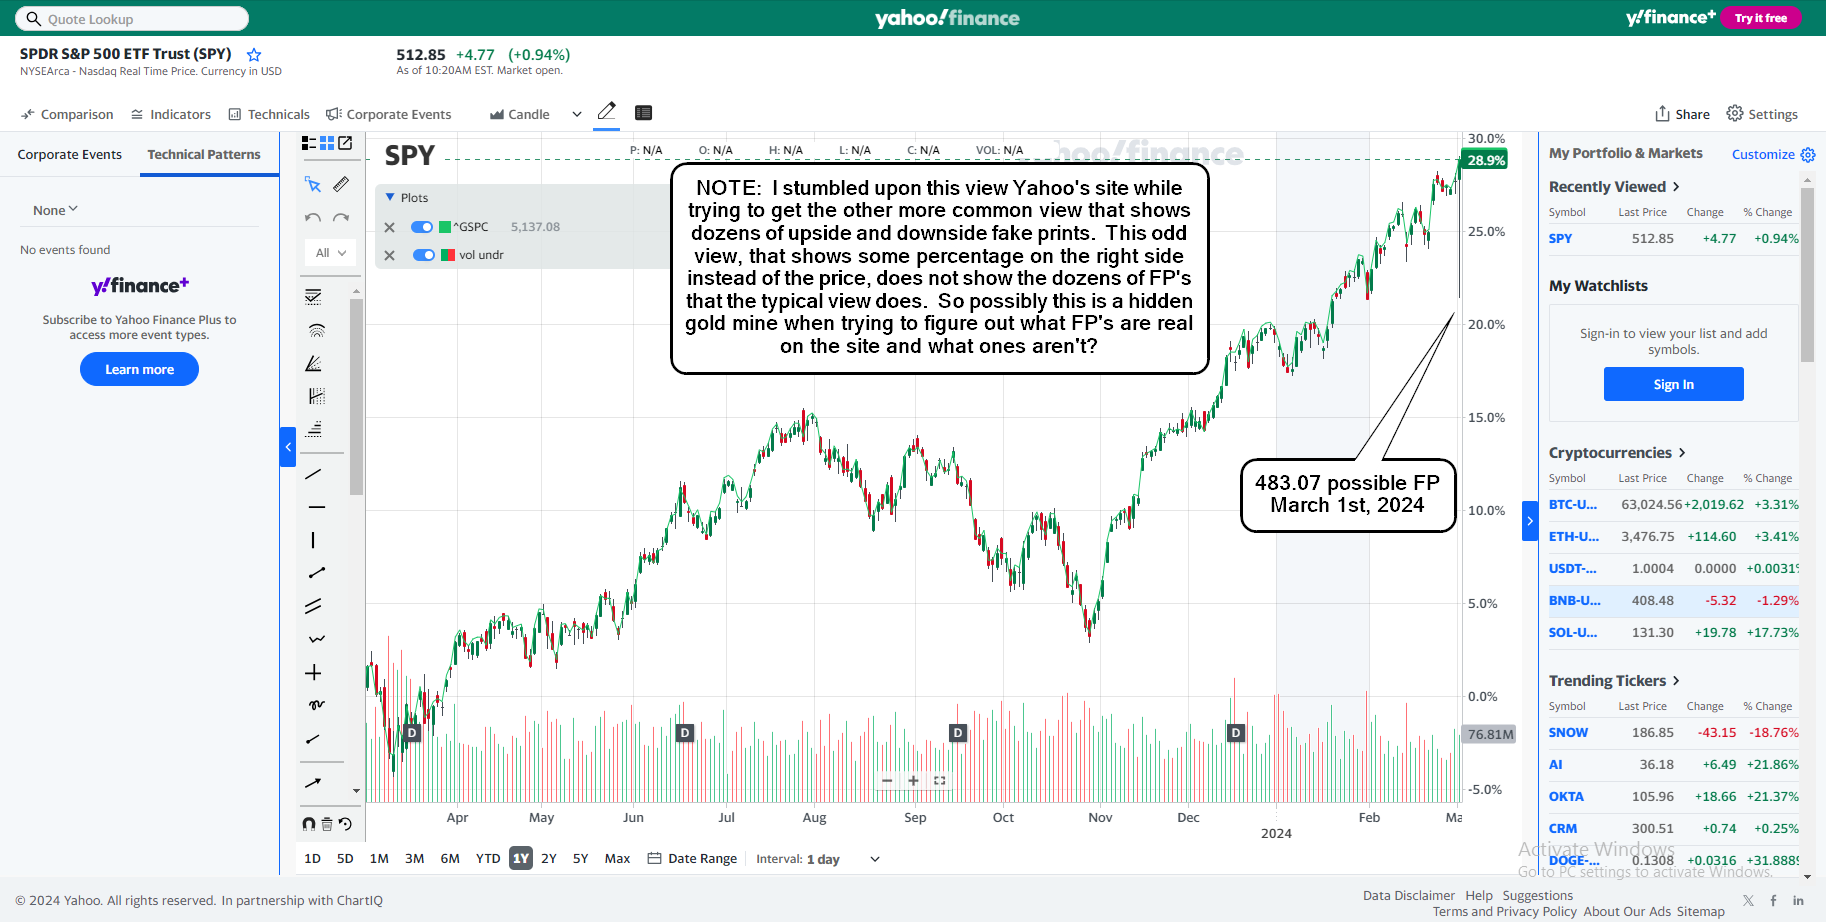
Now I don't know if that will be accurate or not, as I've said previously about Yahoo FP's not be reliable because they show dozens of them and you don't know what is real and what is not. But this one is odd, and it only lasted about 2 or 3 days before it was removed, so it's possibly a real one? As you can see on the chart it's around the low of February the 1st, which on the ES is 4872, and on the SPX that would be 50-60 points lower.

Now if we top at my FET of 5334, then a drop to that FP would be just under 9%, and that's right in line with the 11% back in 2023. They won't ever match exactly but something nice and close would be perfect in my opinion. That's the bigger picture. Let's see if we rally to my upside target this Friday (possibly Monday). If so, I'll be shorting it.

P.S. I posted this yesterday...

Have a blessed day.
ES Morning Update March 19th 2024

0

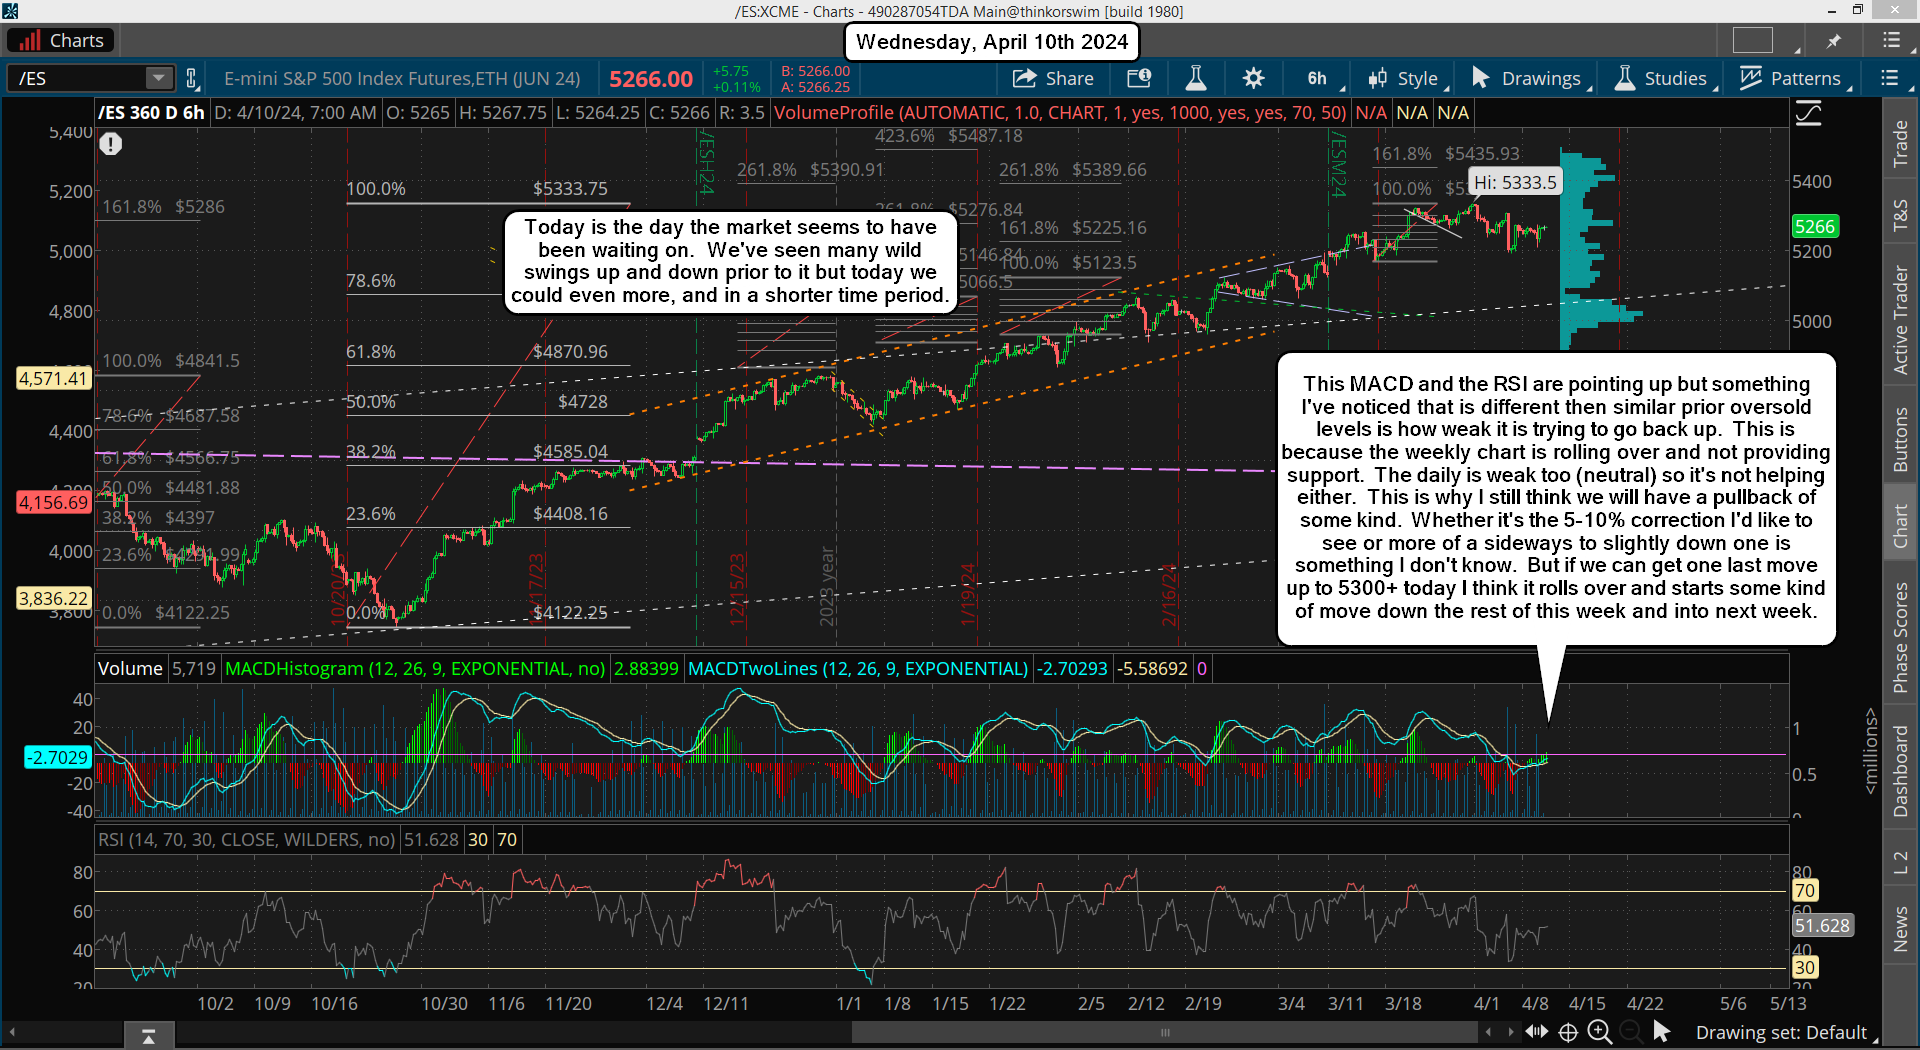
The market had a nice move up yesterday from the low on Friday to make what was most likely a Tiny Wave 1 inside Small Wave 5 up. Then there was a pullback in the second half of the day, which was probably a Tiny Wave 2 down. Today will be hard to figure as the market is waiting on the FOMC meeting tomorrow.

I see two possible paths, which are that this Tiny Wave 2 subdivides into an ABC whereas the A leg was the first pullback from the 5240 high on the ES yesterday. From that low we could rally up for a B wave today (early?) and pullback for the C wave into the close. That leaves Tiny Wave 3 up to start tomorrow, which we should subdivide into 5 smaller waves too. I'd guess that the wave 1 up (Extra Tiny Wave) would happen early in the day Wednesday and then the wave 2 would be a small pullback into the meeting.

Then a strong wave 3 up (Extra Tiny Wave) follows, which is inside Tiny Wave 3, inside Small Wave 5. That should be the most powerful wave of course, and it should be from something said by the Fed that the market takes a positive.  Basically a lot of chop until after the FOMC where the big squeeze should happen and top into this Friday, which ideally would be at the FET of 5334... but again, if it's close and it happens on Friday, I'll be looking for a short.

The other thing that could happen is that we just do a one wave move down for Tiny Wave 2, which will still setup Wednesday to start Tiny Wave 3 up, and the first subwave (of 5) should happen in the morning on Wednesday and then the subwave 2 in front of the meeting.

Doesn't matter which way it plays out as the end result should be a strong rally up after the meeting tomorrow. I lean toward just one wave down for Tiny Wave 2, meaning it doesn't subdivide into an ABC, but I really am not concerned about which way it unfolds as everything tells me we are close to a strong breakout rally into this Friday (possibly Monday) to hit the upside target and setup the market for a nice, much needed correction of 5-10%.

Have a blessed day.
ES Morning Update March 18th 2024

0

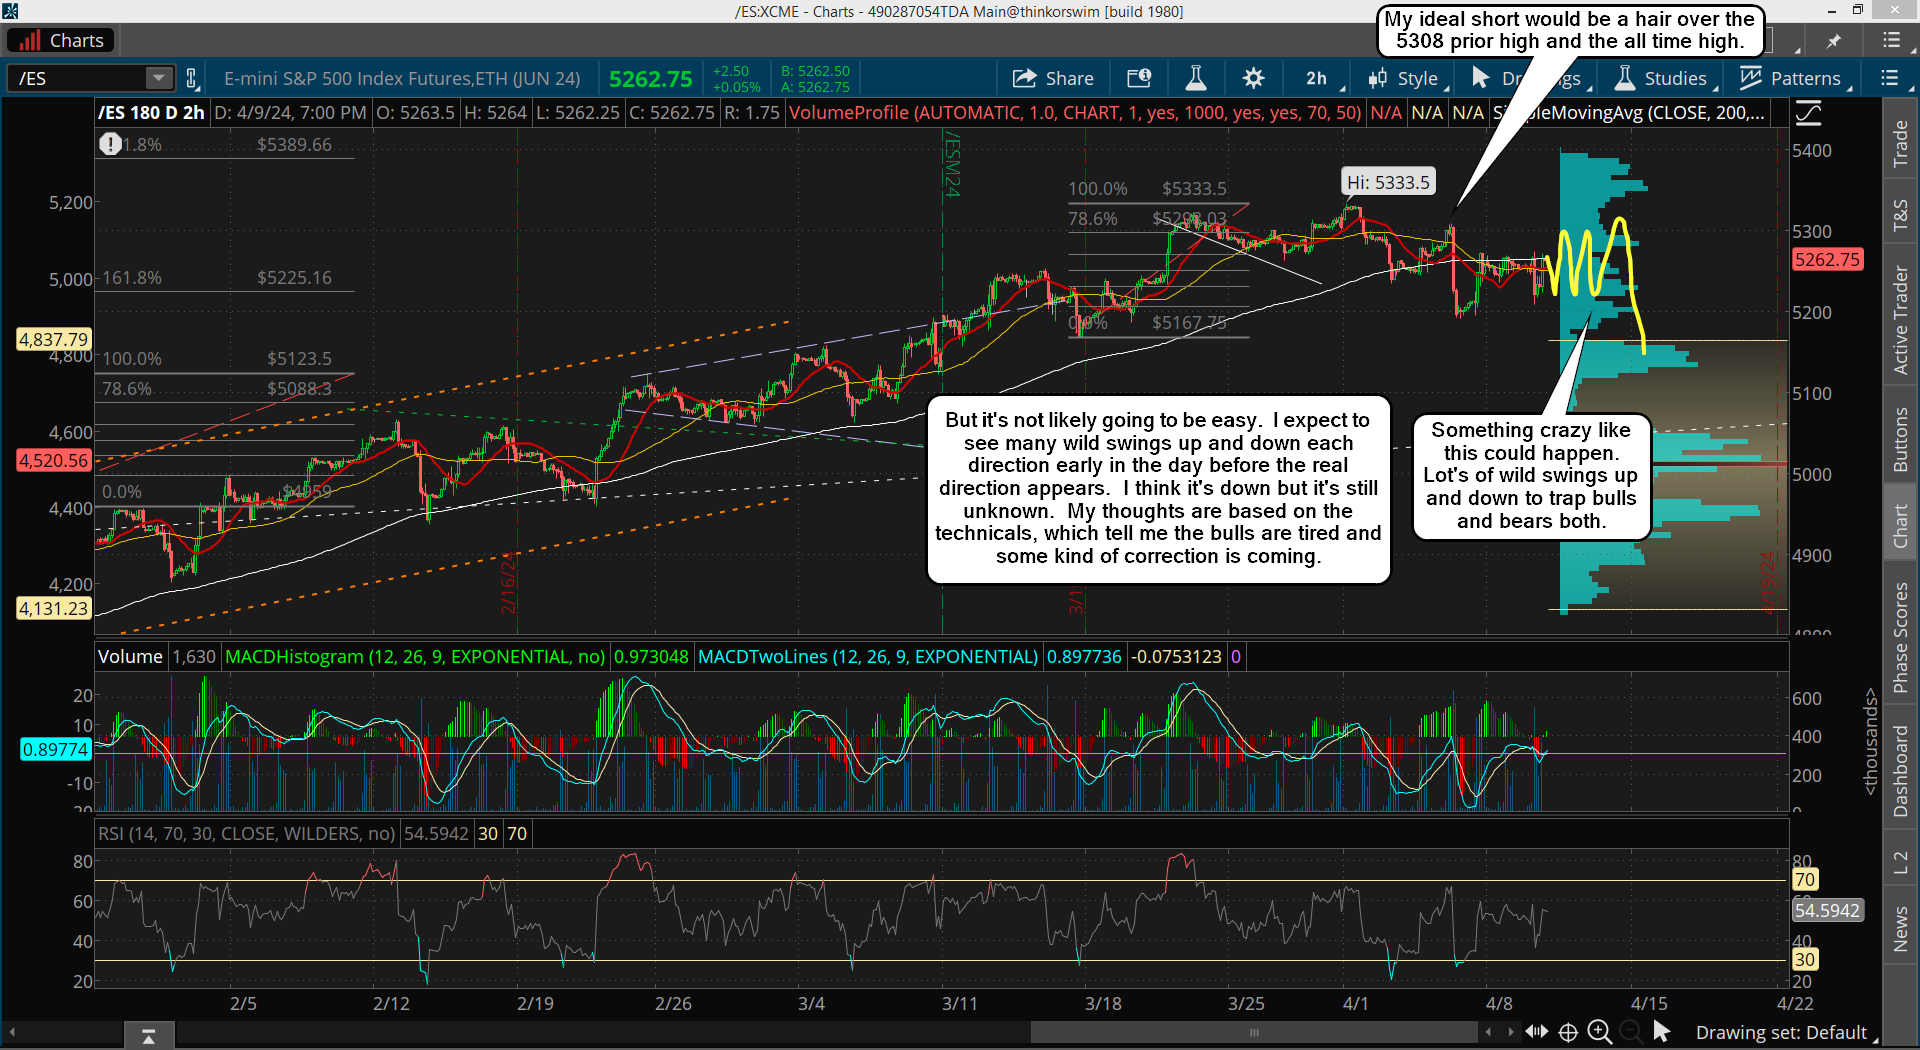
The market finished an ABC down last week for a Small Wave 4 last week most likely and we should be in Small Wave 5 up this week. It will likely unfold in 5 sub-waves with the 1 up happening today, and likely the 2 down tomorrow... which could be very small. Then the 3 up is likely to happen after the FOMC on Wednesday, and again the 4 should be small.

Then lastly the 5 up should complete Small Wave 5 up by this Friday, or possibly next Monday. My FET (Fibonacci Extension Target) is 5334 on the ES, which ideally gets hit... but "time" and "pattern" is super important too. Meaning that if we get close to that zone this Friday I'll be looking for a short.

I've taken 5 longs over the past month and no shorts, but if this plays out I will be taking my first short in a long time. I'm not going into too much more as I'm still working on the bugs of the site. It's completely a 100% clean now of all malware. I started off in a new server with nothing on it, and I'm using a new wordpress theme.

I cleaned up all the old links too, but I'm still waiting on my hosting company to update the SSL certificate, so currently the HTTPS is not working. Only the HTTP showing the website. So a browser that allows that must be used to see the site. I tried it on google chrome but it won't allow it. But Firefox allows it, and so does the Yandex browser. I've not tries others, but hopefully this is all fixed by my hosting company in the next few days.

Have a blessed day.
I Am Back

0

After spending everyday since last Tuesday the 12th, working to rebuild the site, I finally got a new one up and running. It's very similar to the old one but it's a new wordpress theme and I've made a lot of updates on the broken old links to pages that aren't used anymore.

The login is different and easier to sign up now for new people. However, I still have some issues, which are that the images aren't all showing up for old posts and for the profile images (avatars) for the members. Each member will have recreate their account too, if they didn't join prior to March 20th, 2020 as from that date back to the beginning first post on September 21st, 2009 is all the data I had saved.

Meaning if any user joined in that time period their account should still be in the database, but they might have to reset their password... I'm not sure there? Most everyone will need to upload a new profile picture as again, they seem lost or damaged. It's way easier now to do everything with your profile as I've changed that signin and/or join process completely.

As for all the posts from March 20th, 2020 up until today I have them all stored in Notepad for the text and my hard drives for the images. It's going to take 6-12 months of slowly putting those old posts back up to get everything back, as I had 3519 posts and the backup copy from 2009-2020 only has 2204 posts. That's a lot of posts to put back up over time.

The good news is that most aren't important really as the market is ever changing. They are more just for me and website traffic to them, that's all. I did put up about 10 or so of the most recent. I will add to that over time so that anyone can go back and reference some old post if needed. If anyone has trouble with the new site and logging back in or re-creating their site again just email me: Red (at) RedDragonLeo (dot) com

One more thing to note... the certificate for the HTTPS needs updated, so some browser will put a warning about.  I should have it fixed in a day or so as well.

Have a blessed day.
ES Morning Update March 12th 2024

0

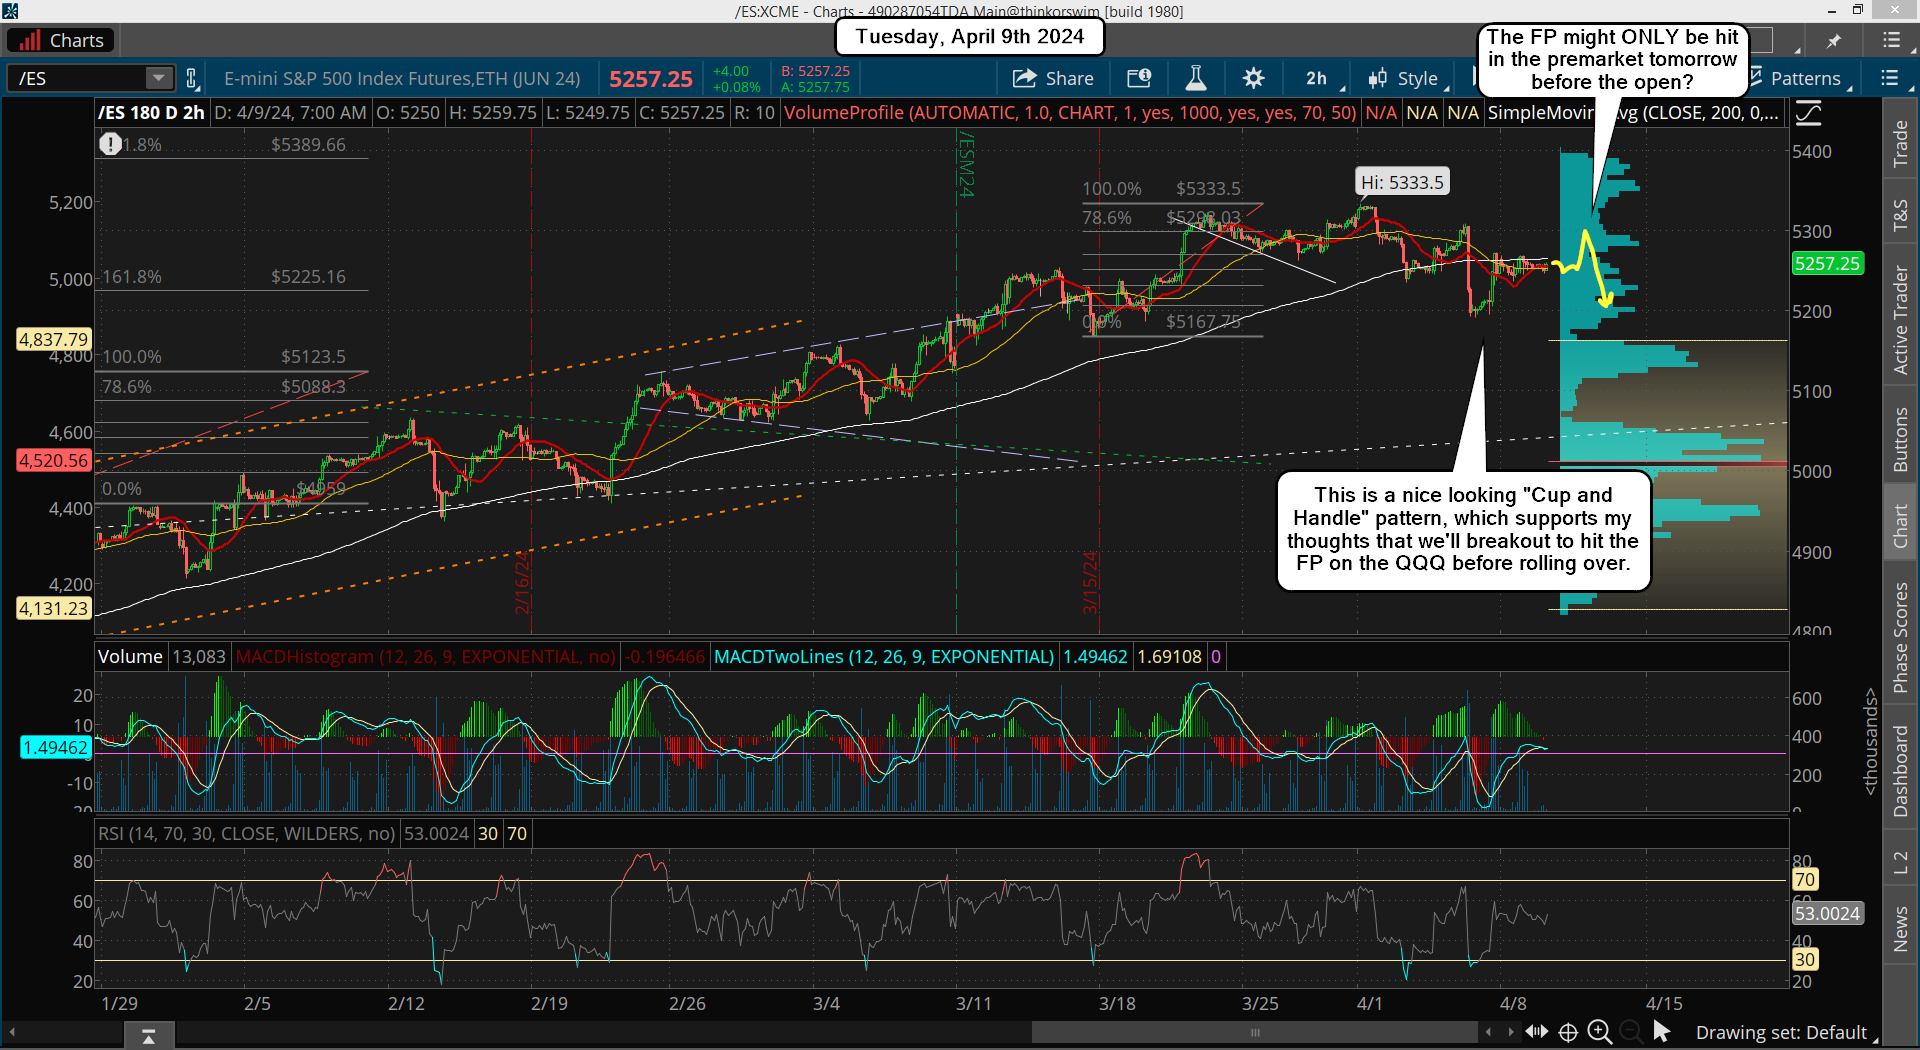
Yesterday first pulled back and then went up into the close to end slightly red but we have made another new higher high then the 5196 gap up high at the open Monday. It's really hard to get a good feel right now on where the market is going as there's nothing clear in the technicals.

Then of course we have the CPI this morning before the open and that's going to cause some wild swings both ways. I just sat on my hands yesterday and will again look for some better setup to get long. I could miss it, but I don't want to chase as that's how you lose money, so I'll be looking for one more pullback before we run up to the FET of 5334, which as I said yesterday, could happen after the CPI... and that would mean we should top there and drop into the March 22nd turn date to put in a low.

I prefer a pullback for Small Wave 4 but who knows if that wave count is right or not? The smaller degree ones are the toughest to figure out, but if we get a pullback then it should be S4, and might end next week before the FOMC?

It's possible that we hit my closer FET at 5225 from the CPI and then reverse back down afterwards... I mean after the wild swings subside of course. We did pullback some yesterday with a low of 5157 on the ES, but I just didn't feel comfortable taking a long there with the CPI the next day. I'm just patiently waiting to get a decent pullback to go long for that last rally up, or for that final FET of 5334 to get hit without me long where I'll short it. Nothing more to add, let's just see what happens and look for another setup.

On last thing, that low yesterday of 5157 came just shy of filling the gap on the ES from the roll from the March contract to the June, as on Friday it close at 5132 at the 4:59pm EST last tick.  Not that it's required to close that gap I'd certain be interested in a long if we dropped that low to fill it.  I'd still have to look at the technicals but it would be of big interest to me, that's for sure.

Have a blessed day.
ES Morning Update March 11th 2024

0

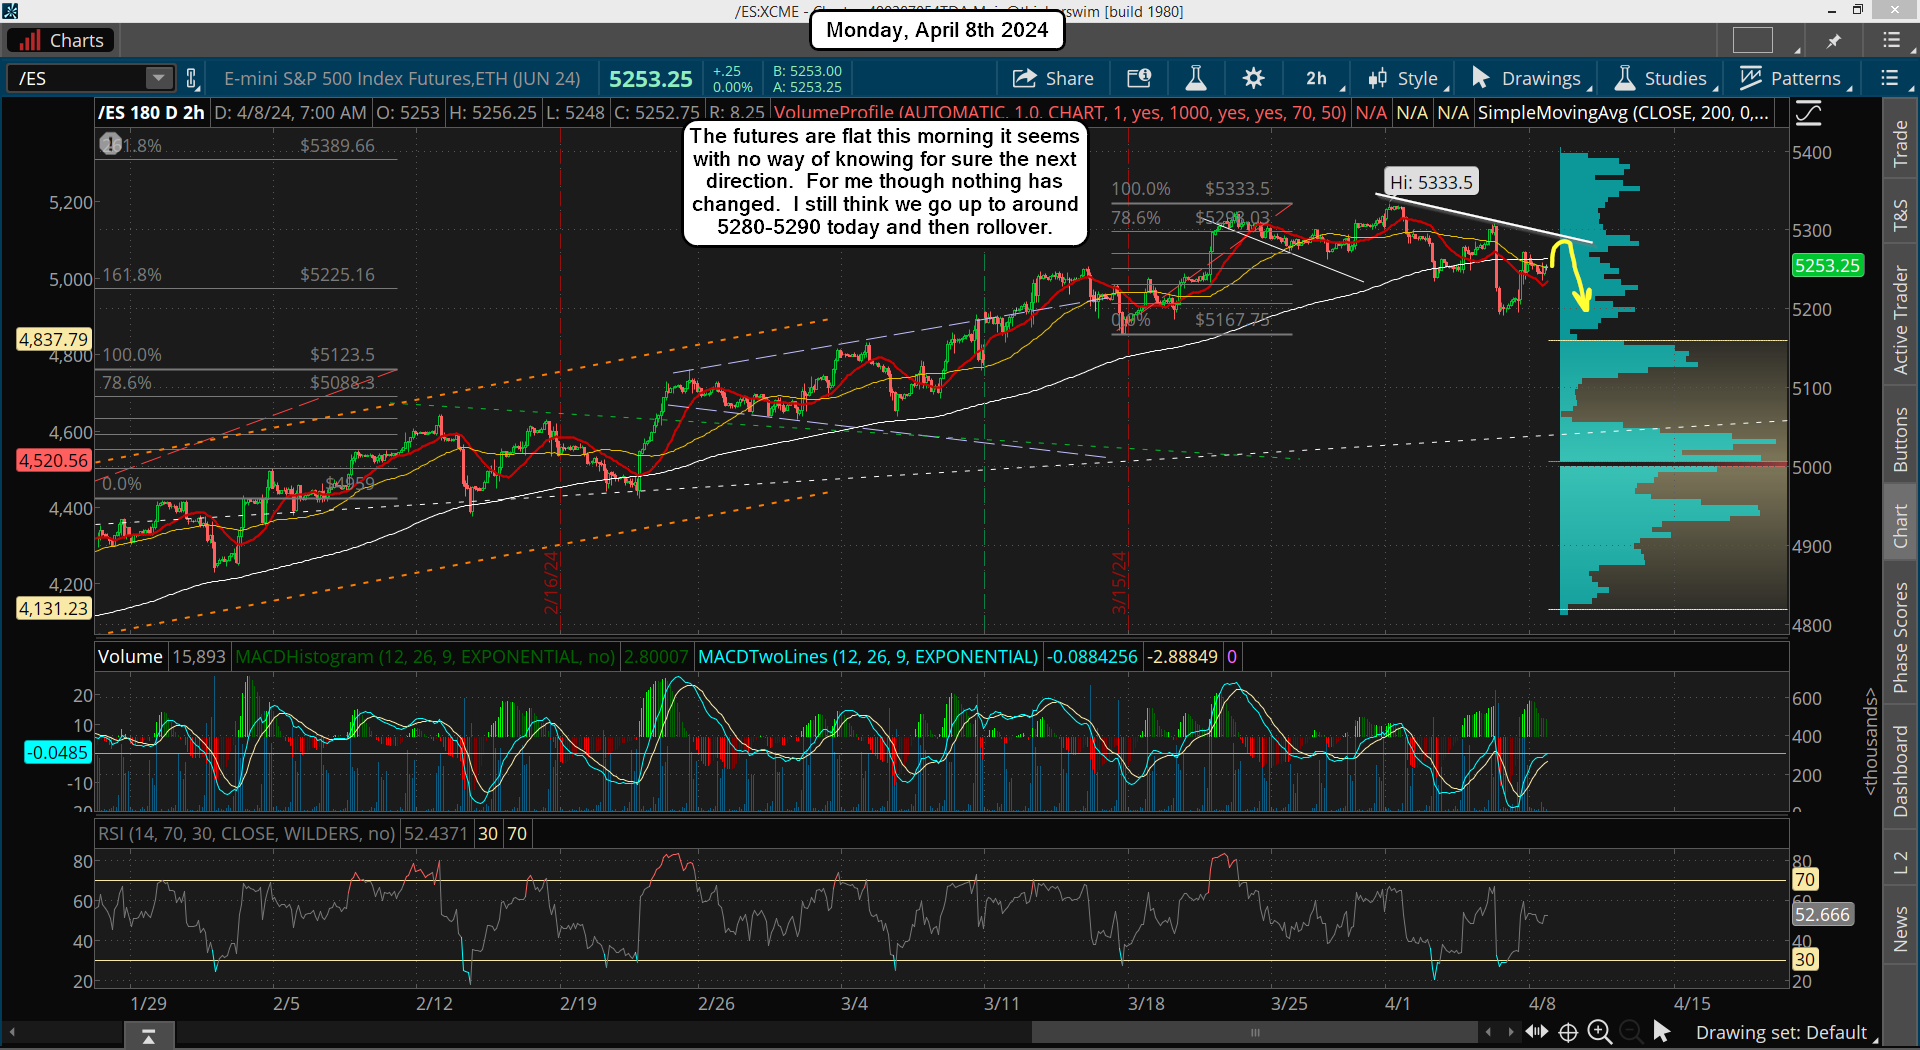
Yesterday first pulled back and then went up into the close to end slightly red but we have made another new higher high then the 5196 gap up high at the open Monday. It's really hard to get a good feel right now on where the market is going as there's nothing clear in the technicals. Then of course we have the CPI this morning before the open and that's going to cause some wild swings both ways.

I just sat on my hands yesterday and will again look for some better setup to get long. I could miss it, but I don't want to chase as that's how you lose money, so I'll be looking for one more pullback before we run up to the FET of 5334, which as I said yesterday, could happen after the CPI... which would mean we should top there and drop into the March 22nd turn date to put in a low. I prefer a pullback for Small Wave 4 but who knows if that wave count is right or not?

The smaller degree ones are the toughest to figure out, but if we get a pullback then it should be S4, and might end next week before the FOMC? It's possible that we hit my closer FET at 5225 from the CPI and then reverse back down afterwards... I mean after the wild swings subside of course. We did pullback some yesterday with a low of 5157 on the ES, but I just didn't feel comfortable taking a long there with the CPI the next day.

I'm just patiently waiting to get a decent pullback to go long for that last rally up, or for that final FET of 5334 to get hit without me long where I'll short it. Nothing more to add, let's just see what happens and look for another setup.

Have a blessed day.
ES Morning Update March 8th 2024

0

We got the rally up yesterday that I was looking for, but it make another new all time high, so that killed my Tiny Wave count, but the overall bigger picture is still intact. I've not taken a single short in over a month now, just longs on pullbacks... and it works. That won't continue forever but as of right now all the pullbacks are getting bought up.

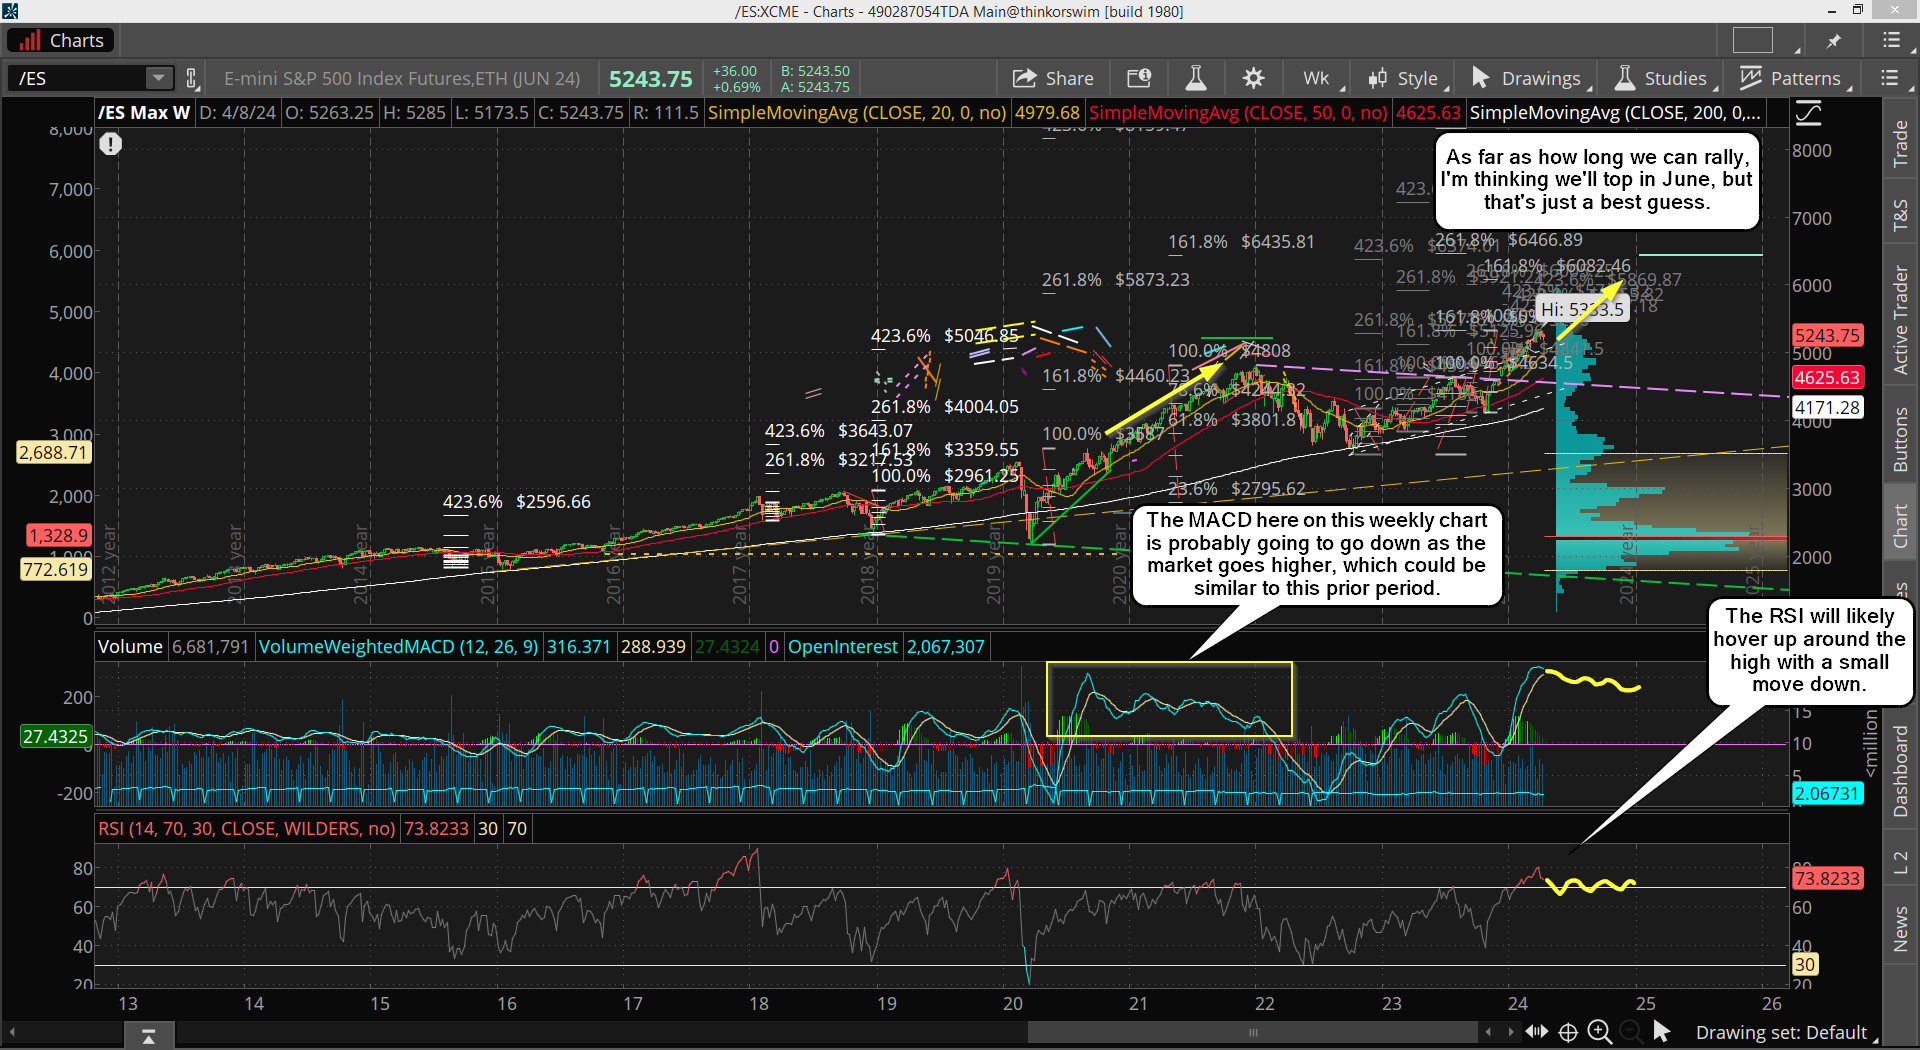
That should continue into the turn date on March 22nd where hopefully we top for Large Wave 3 (or C?), and then a good correction should happen. Anywhere from 5-10% is my best guess, and that''s only if it's a Large Wave 3 top... meaning the drop will be a Large Wave 4, thereby leaving Large Wave 5 up into this summer.

If the top turns out to be a Large Wave C then the bear market will start and we'll go down the rest of the year. I do not know yet which one will play out but I lean toward Large Wave 3 because of the "lack of" a negative divergence on the weekly chart. We'll cross that road when we get there.

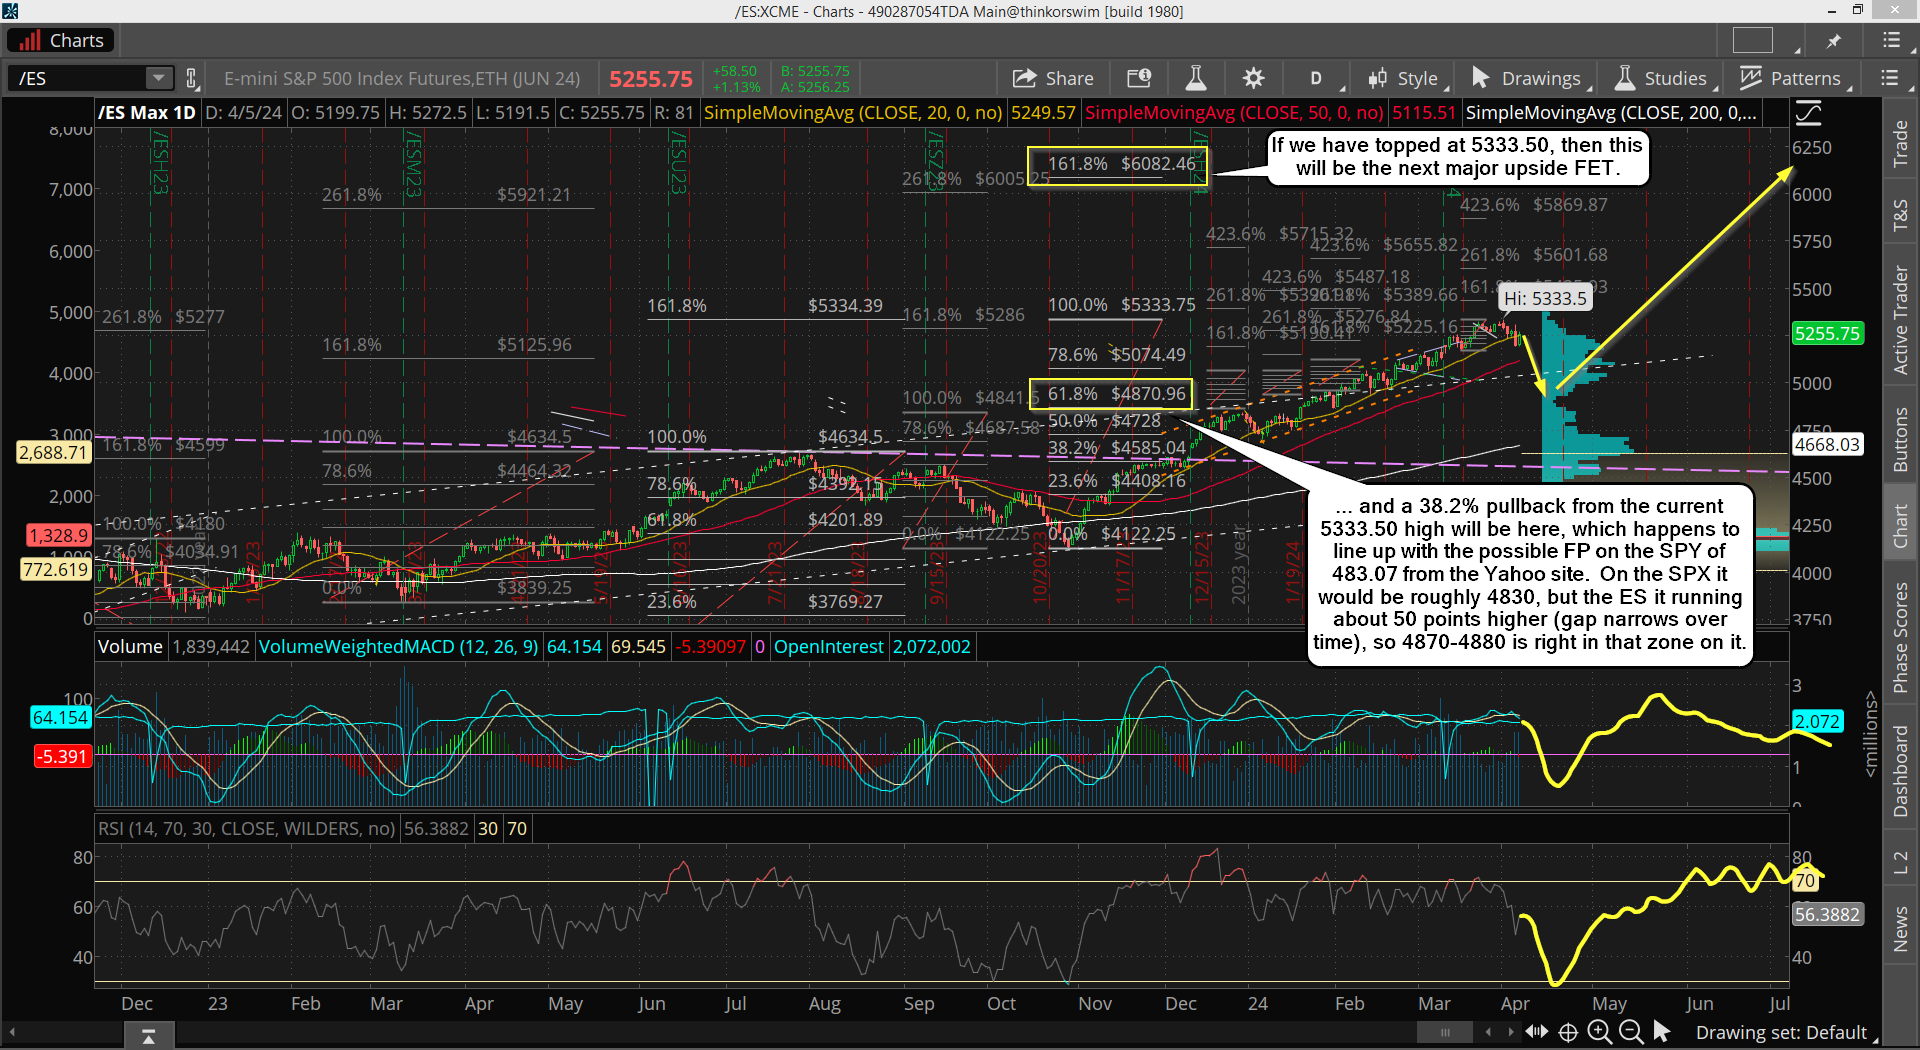
Moving on, below is the new adjusted wave count...

As you can see the overall picture is still the same, we are just not pulling back as much as on my other wave count. It's always a "best guess" on the smaller waves, but what it's suggesting in a small pullback in the futures, which already happened right before the close yesterday, and that is a wave 4 on my chart. I didn't label it as an "Extra Tiny Wave 4" (didn't have room to type all that inside the small box), but that's what it would be basically as it's the next lower degree below Tiny Waves.

Afterwards, I'd look for an early rally today for "Extra Tiny Wave 5", which might just be a double top, who knows? But then I'd lean toward a surprise late Friday pullback for Tiny Wave 4 down. We've had so many "Friday Rallies" that this would be a good surprise to everyone that has spotted this pattern I think.

And again, I'm guessing here on these moves, but I don't trade them. I have only been looking at deeper pullbacks to get long at, which I've been focused on watching the RSI get oversold on the 2hr chart and near oversold on the 6hr chart. So I won't be doing anything until I see a deeper pullback to once again get at least the 2hr chart oversold.

If my crazy wave count plays out then we'll go up Monday for Tiny Wave 5 instead of the typical weakness that we have been having for many weeks now. Lastly we'd see a nice pullback Tuesday after the CPI for Small Wave 4 down. These "events" are just periods where those waves can play out, but possibly it's something else next week that is blamed for the move? I just keep adjusting as we go forward in time and keep looking for longs until we get to the next important turn date.

Have a great weekend.

ES Morning Update March 7th 2024

0

The market continued higher yesterday and then pulled back some around midday and went mostly sideways into close. We did not make a new all time high (which I didn't think we would) and are likely still in a Tiny Wave B bounce, inside Small Wave 4, which the B wave is subdividing too it seems.

I don't think we have finished it as the technicals suggest we need more time to get the short term charts overbought again. But that doesn't mean it will be an a straight line of course. Most likely this is Tiny Wave B and it's subdividing, which suggest it might not top until tomorrow, or Monday?

Today could be choppy again with some more "pulling back" first, but I don't think it will take out the low from Tuesday. Possibly it's a B wave inside the B wave? If so, then there's a C wave up inside Tiny Wave B still yet to come.

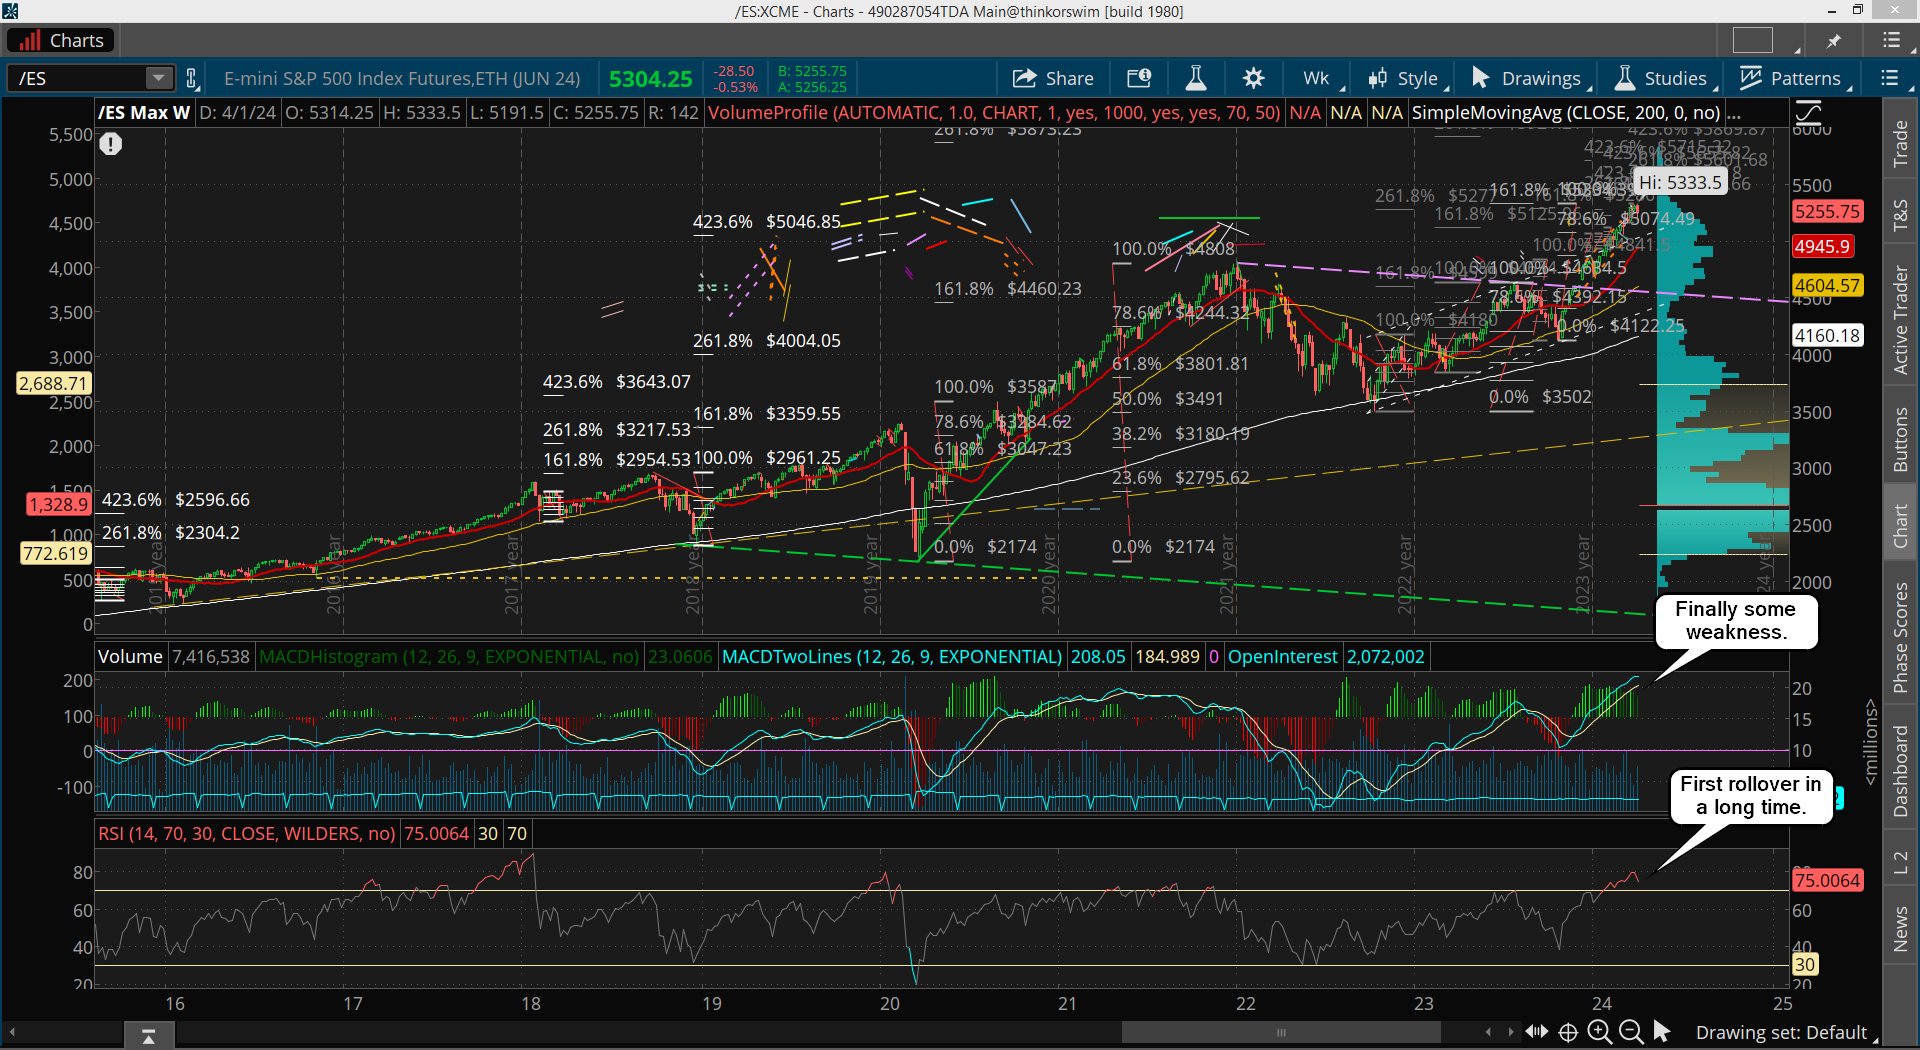
As you can see in the 2hr chart above this could do a lot of chop into next week, but we could bottom into the CPI? If this plays out then I'd look for the rest of next week to carve out a Tiny Wave's 1 and 2... which leaves 3, 4 and 5 to finish all the waves up to complete Large Wave 3 (or C) the week after that. Ideally we top into the March 22nd turn date, but who knows if that happens or not.

I can only say that so far this has been tracking pretty good. The waves within waves aren't easy to predict, nor the price levels, but it's still been "on track" for the most part.

Have a blessed day.
ES Morning Update March 6th 2024

0

WOW! What a surprise... a down day. Haven't seen that in quite awhile it seems. I wasn't expecting it to be that deep but it is what it is I guess. It still looks like an A wave down inside Small Wave 4 right now, and I think we bottomed yesterday near the close as we rallied back up nicely into the afterhours session.

I think we will now spend the rest of the week, and probably into the CPI next Tuesday, carving out the B wave bounce. I wasn't expecting the A down to end that fast but it certain looks like it might have done so... but there's this new FP (2 of them possibly?) that might be saying that we will go back down today to retest the low from yesterday to put in a double bottom. Here's that FP on the QQQ...

I'm thinking that we revisit the lower (possible) FP at 434.28 first and then rally up to the 443.69 FP later. But that's just a guess as we could also go up to the higher FP first and then the lower one isn't hit until next week after the CPI? It's hard too know for sure but I'll just be keeping them in mind as "targets" for when we are heading in that direction. The more logical move is to hit the downside today and then go back up.

Of course on the ES it will trade a little differently then the QQQ but the direction should match, so whenever the upside FP on the QQQ is hit and pieced I'd be looking at the ES as possibly topping for the B wave bounce. As for the C wave down... that's going to be hard to figure out.

I do think it will unfold in 5 waves, so if by some crazy squeeze we hit the upside FP on the QQQ today then we could start the C down after that and then I'd looking for it to bottom into the CPI next week instead of top. There are a lot of variations to how this could play out but so far odds favor yesterdays drop (the A wave) as being finished. We'll see.

Have a blessed day.
ES Morning Update March 5th 2024

0

We may have topped yesterday for Tiny Wave 5 up with that late day squeeze up to 5157 as we sold off quickly after the close. I said yesterday that I was looking for the 5225 level per my FET (Fibonacci Extension Target), which I thought would be from Tiny Wave 5 up, but it appears finished to me now.

If so, then Small Wave 3 up ended too and now we should spend all week (possibly) drifting lower for Small Wave 4... which might be in an ABC pattern? Small Wave 2 down was a choppy mess that started from the 5123 high on 2/23 and ended at the 5060 low on 2/29, so that's 6 calendar days in total, and that pattern could be repeated in "time" but probably not in pattern.

They tend to alternative one or the other, and since we have lots of time left before reaching the next turn date on March 22nd I think the market will drag out this Small Wave 4 all week to burn that time, which leaves two weeks for Small Wave 5 up to play out. Therefore I lean toward an ABC down this time and another week or so in time to finish Small Wave 4... and it just might bottom right into the CPI next Tuesday, either before it or after it's released?

If the market can pullback to about 5100 into next week then that should be plenty of time to reset the short term overbought charts and allow another week plus rally to the 5334.39 upside level for my FET from the July 2023 high from the October 2022 low. That target should be hit (and pierced) before any good pullback (5-10%?) can happen, and ideally that's right into the turn date as well. It's really hard too forecast the day to day moves, but a week full of nothing but chop would be ideal I think.

And then they can used the CPI number rally the market up. Lastly, the futures will roll into the next quarters contract next Thursday into Friday, and it's estimated that the spread will be almost 60 point between it and the SPX cash, so keep that in mind.

Have a blessed day.
ES Morning Update March 4th 2024

0

We got the rally last Friday to the 5146 level from my short term Fibonacci Extension Target, which I'm going to abbreviate to just FET going forward. Now looking back in time from my post I did on the 161.8% extension it's common to see exactly what we saw last week. What I mean is that there was a run up to "almost hit the FET", then a small pullback, and final a hit and pierce of the FET.

We saw that happen last week with the first high of 5123, which was the one that fell shy, then the pullback, and finally the rally up to pierce the FET of 5146 on Friday. Now that was a short term FET, and since that pattern has completed now we should pullback some early this week before the next rally up to the next FET of 5190, which is close to another FET at 5225, so somewhere in that zone would be the next high before another small pullback or pause happens.

The levels that I calculated those price points from, (chart above), for the FET of 5190, was using the 4866 low on 1/31/24 to the 5066 high on 2/12/24, which projects a 161.8% extension high of 5190. The other FET of 5225 was calculated from the 2/21/24 low of 4959 to the recent high of 5123 on 2/23/24.

Those two are close to each other so somewhere in that range would be the next upside zone where the rally expected next week should end at and pullback or pause again. Meaning we should "pause" Monday and/or Tuesday of this week (possible pullback to 5110 or less?) and then start the next move up for the two FET's at 5190-5225 the rest of the week.

That should take us into the week of OPEX (next week), which is where the pullback for Small Wave 4 should happen.  That would leave Small Wave 5 up into the following week, and interestingly we have an FOMC meeting on Wednesday, March 20th... right in front of the turn date on March 22nd. Very nice timing for sure.

My best guess would again be to see a "pause" on Monday and Tuesday that week (18th/19th), and then a last squeeze back up into Friday the 22nd to reach the biggest FET I have, which was calculated from the 3502 in October of 2022 and the 4634 high on 7/27/23, which projects a 161.8% level of 5334. That... in my opinion is "The Big ONE", and should be the point where we see a nice pullback of 300-500 points from.

I'm thinking it will complete a Large Wave C (or 3?), which should produce a 5-10% pullback (if L3) or "the top" if LC... which would mean a much, much larger drop. I don't think it will be that way because I don't see any negative divergence yet on the weekly chart, but there's really no way to know until it happens. Here's my new adjusted wave count...

The big thing I've changed is that I removed the Tiny Waves 1-5 and just marked them as Small Waves. It suggests the 5066 high on 2/12/24 ended Small Wave 5 up, and Medium Wave 3 up. Then the pullback afterwards completed Medium Wave 4, and now we are in Medium Wave 5 up, which will have five small waves inside it.

My best guess is that we started Small Wave 3 up inside Medium Wave 5 last Friday, and that it will end in the 5190-5225 zone. Then a small pullback for Small Wave 4 the first couple of days next week, and the final Small Wave 5 up into Friday, March 22nd. That should complete Medium Wave 5, inside Large Wave C (or 3?) which is where the best sell should come from.  Here's a close up of the waves...

I think that on Friday we started Small Wave 3 up inside Medium Wave 5, which probably will end by this Friday.  The small intraday pullback on Thursday was likely a Tiny Wave 2, with Tiny Wave 3 up afterwards.  Any pullback today should be Tiny Wave 4, then Tiny Wave 5 should reach the 5190-5225 zone.

It's at that point where we could see a similar choppy sideways pullback the first 2-4 days of next week for Small Wave 4 that could look like Small Wave 2 did from it's 5123 start on 2/23 to the 5060 low on 2/29... only it will be shorter in time I think.  It should be the move into the FOMC next Wednesday the 20th.  Then something Powell says can be blamed for the final rally up into Friday toward FET of 5334.39 to complete all the waves.

The drop afterwards could be a large one.  I don't know how much but could be something similar to the July top (LA or L1) down to the October low (LB or L2).  That drop was from 4634.50 to 4122.25, which was a 11% pullback.  If we reach 5334.39 then 11% would be 590 points down roughly.  I doubt if it repeats like that but it's something to remember.  I lean toward 300-500 points at most.  We'll see.

Have a blessed day.
ES Morning Update March 1st 2024

0

We got an early pop yesterday after the PCE data came out, which really wasn't important but the market was setup for a move up and it just used that data as a catalyst to rally. But it failed to hold and dropped back to negative midday after that 20 point pop, and then it went back up into the close to around the same zone.

The market is close to a bottom as that pop and retrace was back test of the falling channel the market has been in since the high. This tells me that today or Monday we should see another multi-day rally of 100+ points. Possibly it starts today, it's hard too know for sure? We got close to the 5050 zone yesterday with a hit of 5060, which might be "close enough", suggesting any pullback today might be just a higher low.

I posted the chart above in the chatroom yesterday, which is a fake print on the QQQ, and low and behold it was hit and pierce around the open before a reversal back down midday, so it was a "signal" that it would be a point of interest where the market would hit and turn from.

Over the many years of tracking FP's I've noticed that the intraday one's don't have any edge for them hitting and reversing back down for days or weeks. They can hit and pause, and the go further in the same direction, or hit and reverse for only an intraday move like yesterday... and then continue in the same direction. The only thing I use them for is to exit positions I'm in that are based on the technicals.

Moving on... another strong rally is close and should go into next week. We should hit my 5146 target, possibly pause there and pullback some. It will be a point to exit longs and wait for a better entry from another move down I think. But I'll have to wait to see how the technicals are when we get there, as it might reach the next target of 5190.

Now as far as wave count goes, if we bottomed yesterday, then that should completed Small Wave 4, which means we are in Small Wave 5 up now. Wave fives can go any amount. They can truncate short, extend to be longer then the wave three, match the wave one... pretty much any amount.

My feeling on it are that we have a target of 5146 with my Fibonacci Extension System, which is the shorter and closer one. Then there's another higher one at 5190, so one of those zone would be a likely top for the coming rally that I'm calling Small Wave 5 right now. If that count is correct then it will complete Medium Wave 3, and from there we should see a decent pullback of 3%+ I'd think.

We have Jay Powell speaking next Wednesday, so possibly we rally up into that date and he causes some small panic for that Medium Wave 4 pullback? But it shouldn't start the bigger pullback I think as it should be followed by Medium Wave 5 up into late March, like "possibly" the 22nd? If that happens we'll complete either a Large Wave C or 5, and with the C the market will have topped and we'll start the bear market.

But I lean toward the 5 because there's no negative divergence on the weekly chart yet, therefore a 5-10% pullback for Large Wave 4 would be more likely. Then a final rally for Large Wave 5 into late summer. Below is a chart I posted in the chatroom yesterday showing that divergences.

It's never a guarantee that we MUST have a negative divergence but usually we have one. Something that could cause that not to happen would be some kind of event (another false flag?), which then we'd get another drop like the COVID crash in 2020. I have no way of knowing if that's going to happen or not, so I will just place my short with the mindset that we will only get a 5-10% pullback, and if it turns out to be more then I'll adapt. We'll cross that road when we get there. For now let's just see if we get the rally up to 5146 or 5190 the next few days.

Have a great weekend.

Have a blessed day.
ES Morning Update February 29th 2024

0

More chop yesterday with a drift lower. It's getting close to the 5050 support zone now, and the RSI is working its' way down closer to oversold. It doesn't have to reach oversold of course as in strong up trends it doesn't get buried below the 30 level, so a bottom is very close now.

It could happen today or it could have been yesterday, but after that I do expect a rally up next week with the target of 5146 for the short term and 5190-5225 ultimately. I'll have to see where the technicals are once the first lower upside target is met, as that might be all we get on the coming rally before another pullback like the current one happens.

It's hard to say until we get there first, and how long it takes to get there is important to as "time" for the strong bullish period the first week of March. If there is enough time left then we could reach the higher level, but if it takes all of next week to reach the lower target then time will run out and we should pullback again the week of OPEX prior to those higher levels being reached.

And while I want to see the March 22nd turn date produce a high that's not known at this point as it could be a bottom? Right now though it does look possible to play out, which will either be the end of Medium Wave 3 (meaning Medium Wave 4 be the pullback, which might just be 3-5%) or the Large Wave C (or 3?), which would should result in a larger pullback, like 5-9% possibly.

Have a blessed day.
ES Morning Update February 28th 2024

0

Pretty much as expected yesterday... a little lower throughout the day and then up into the close.  That bounce was likely a B wave, which clearly ended as we are back down again this morning.  So I have to think we are now in the C wave down of Small Wave 4 and will finish soon, probably in a day or so.

Then we should start Small Wave 5 up to complete Medium Wave 3, which might end by the end of next week? If so, I'd look for Medium Wave 4 to play out during the week of OPEX, which should be followed by Medium Wave 5 up into the turn date on March 22nd.  This is the ideal path but we all know the market rarely plays out like you want it, so I'll just adjust as we go forward.

As for today, I think the upside is limited as we appear to be in a C wave as I said, but it should end today or tomorrow and then we start back up.  My target is 5190-5225 to complete Medium Wave 3.

Have a blessed day.
ES Morning Update February 27th 2024

0

We started the pullback yesterday, which was mostly into the close. I do not know how low it will go as it could be finished now, but the 5050 zone is an important support that would be ideal for a long. However, with yesterday and Sunday being a "turn window" I decided to take a chance and just re buy my previous longs at a cheaper price.

We might go down to that 5050 zone, but if it happens I'll just ride it out as I still think we will rally up into the next turn date on March 22nd. For me, I'm just trying to get another good entry on the longs, which I did, but nailing the exact best spot is impossible. Not much else to add here as the overall trend is still up and that's how I'm trading it.

Have a blessed day.
s2Member®