Saturday, July 25, 2026
Home Blog Page 40

ES Morning Update January 2nd 2019

0

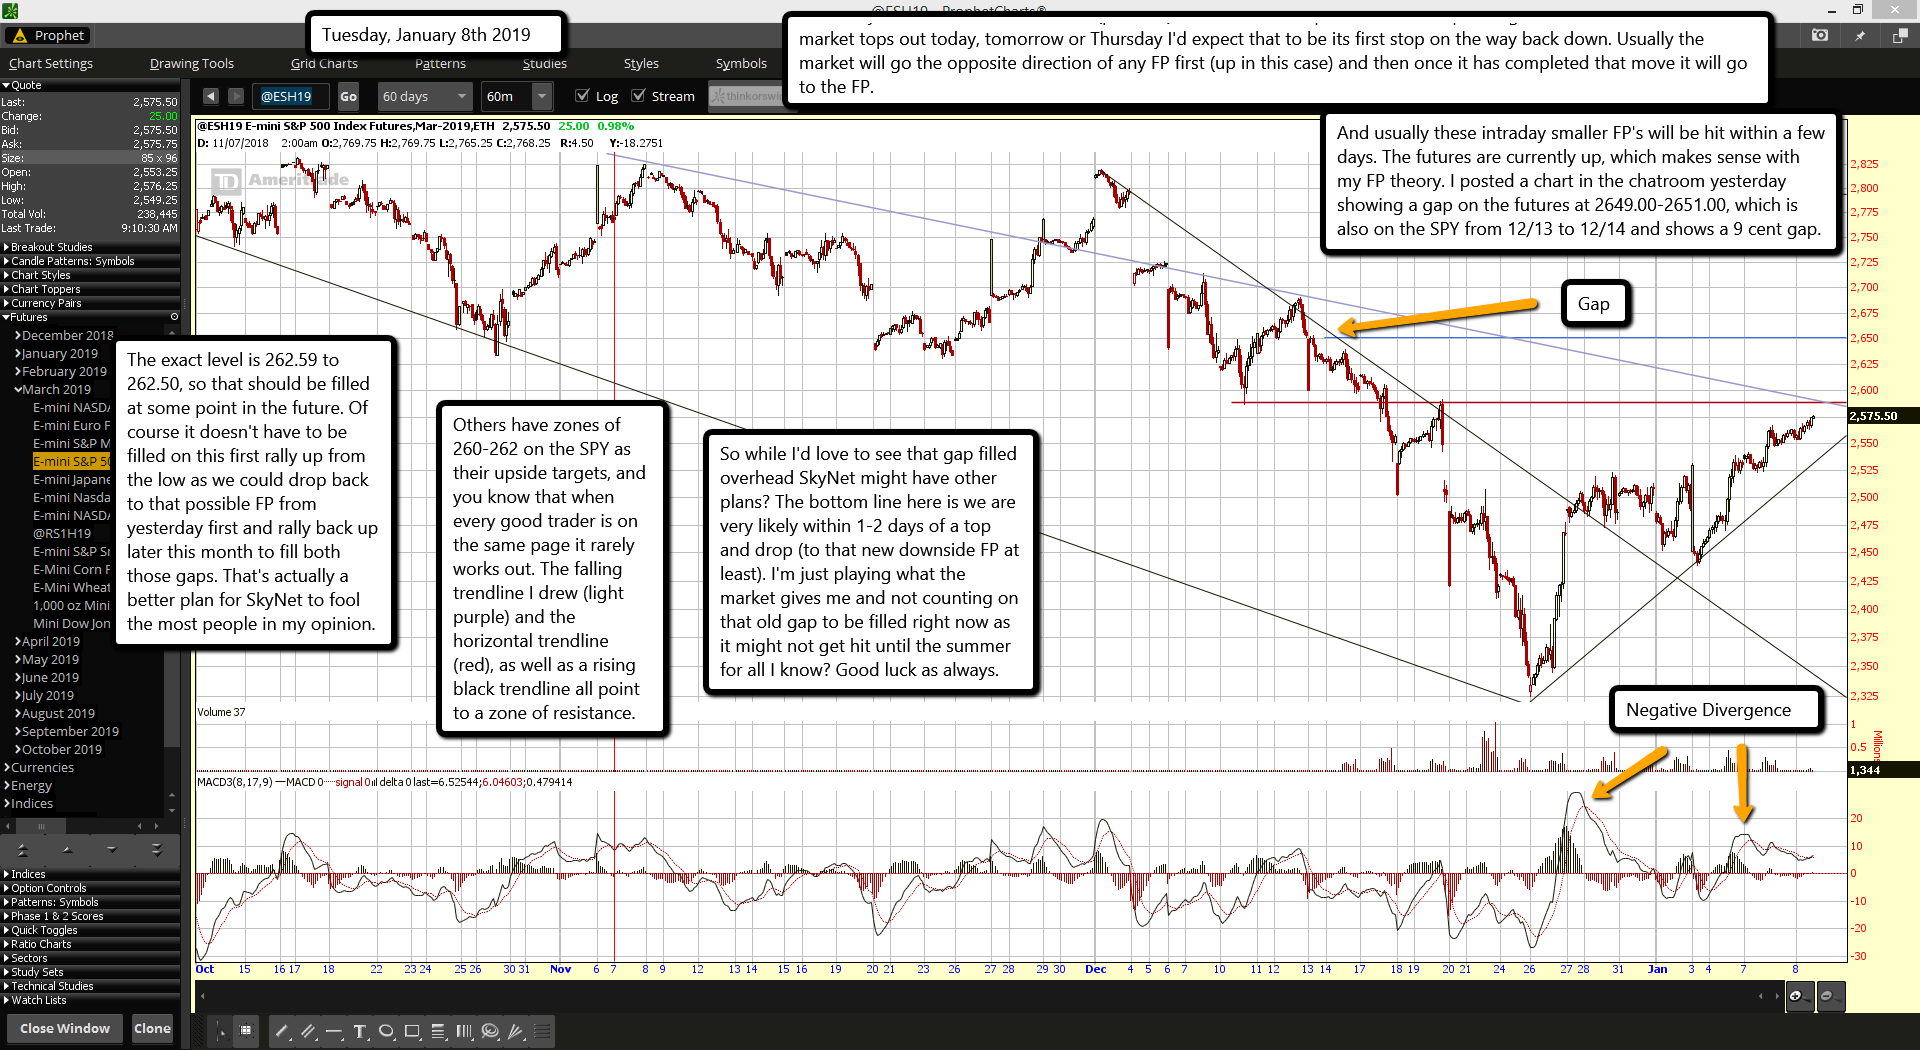
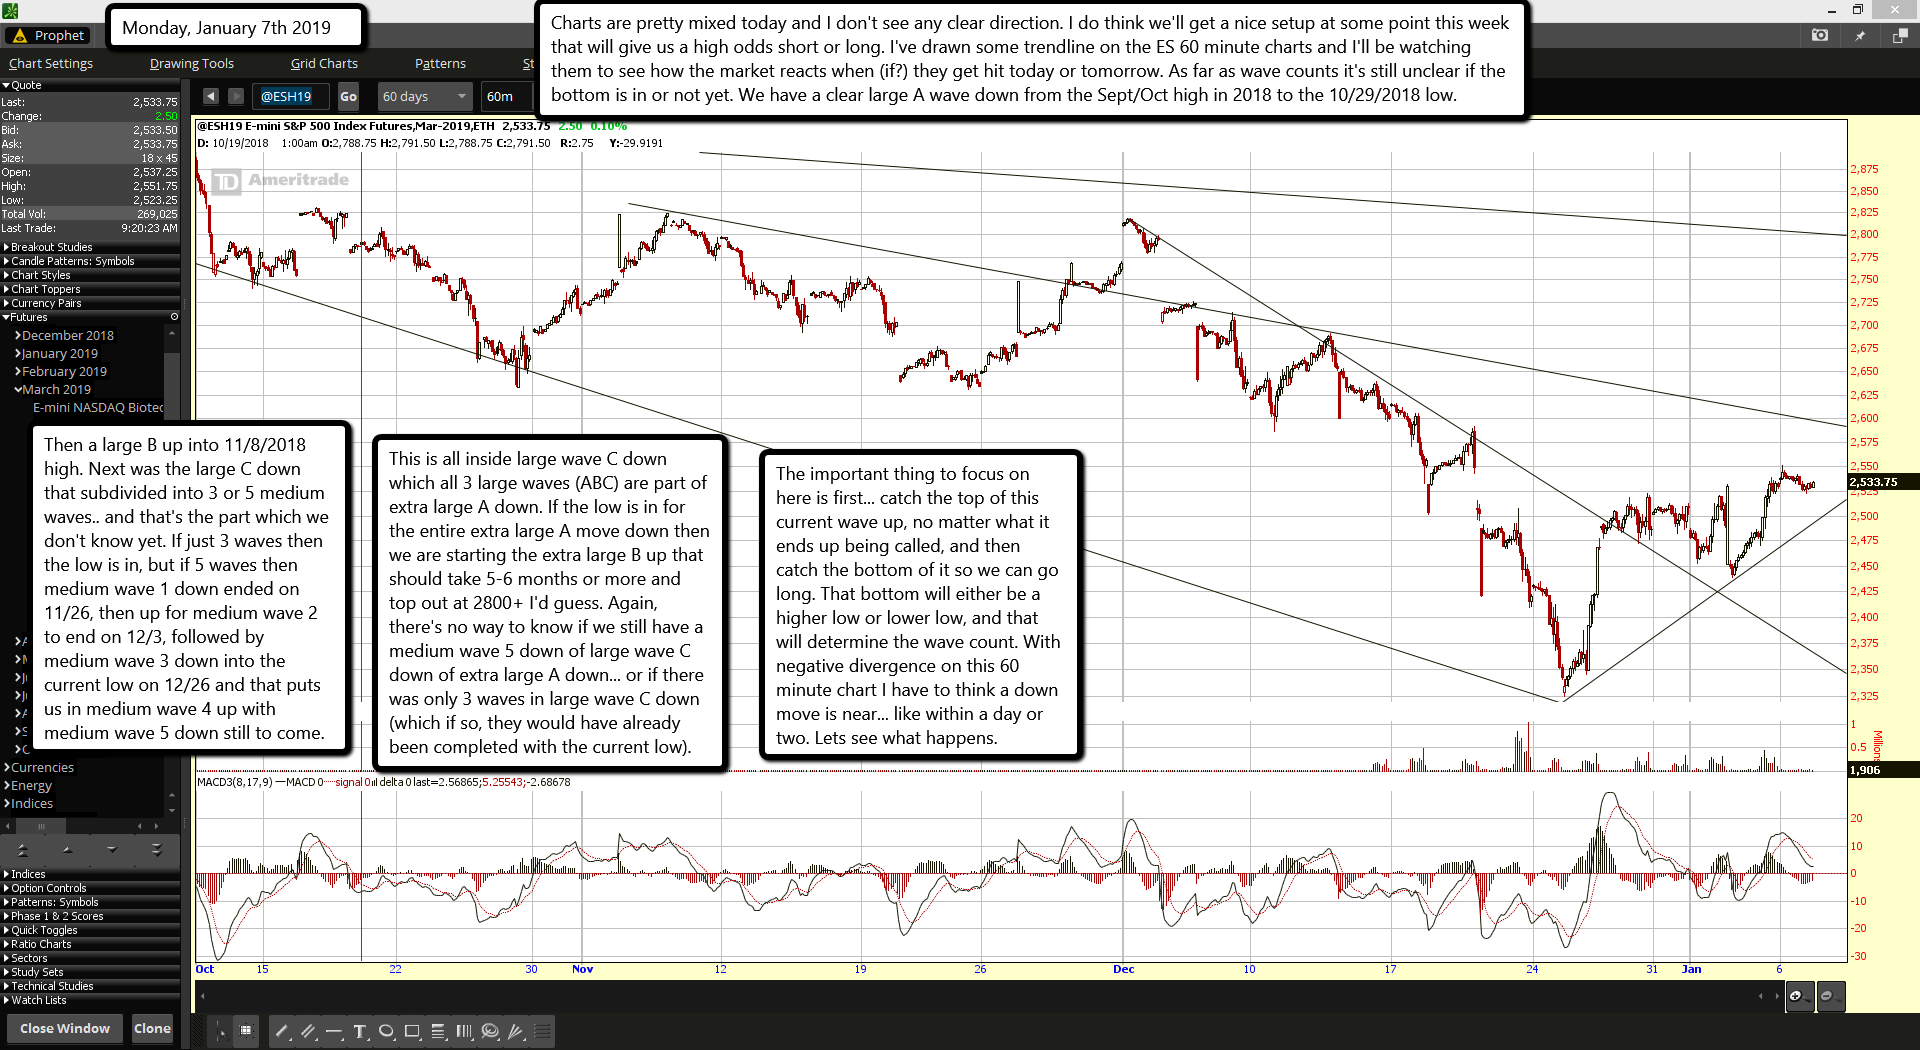
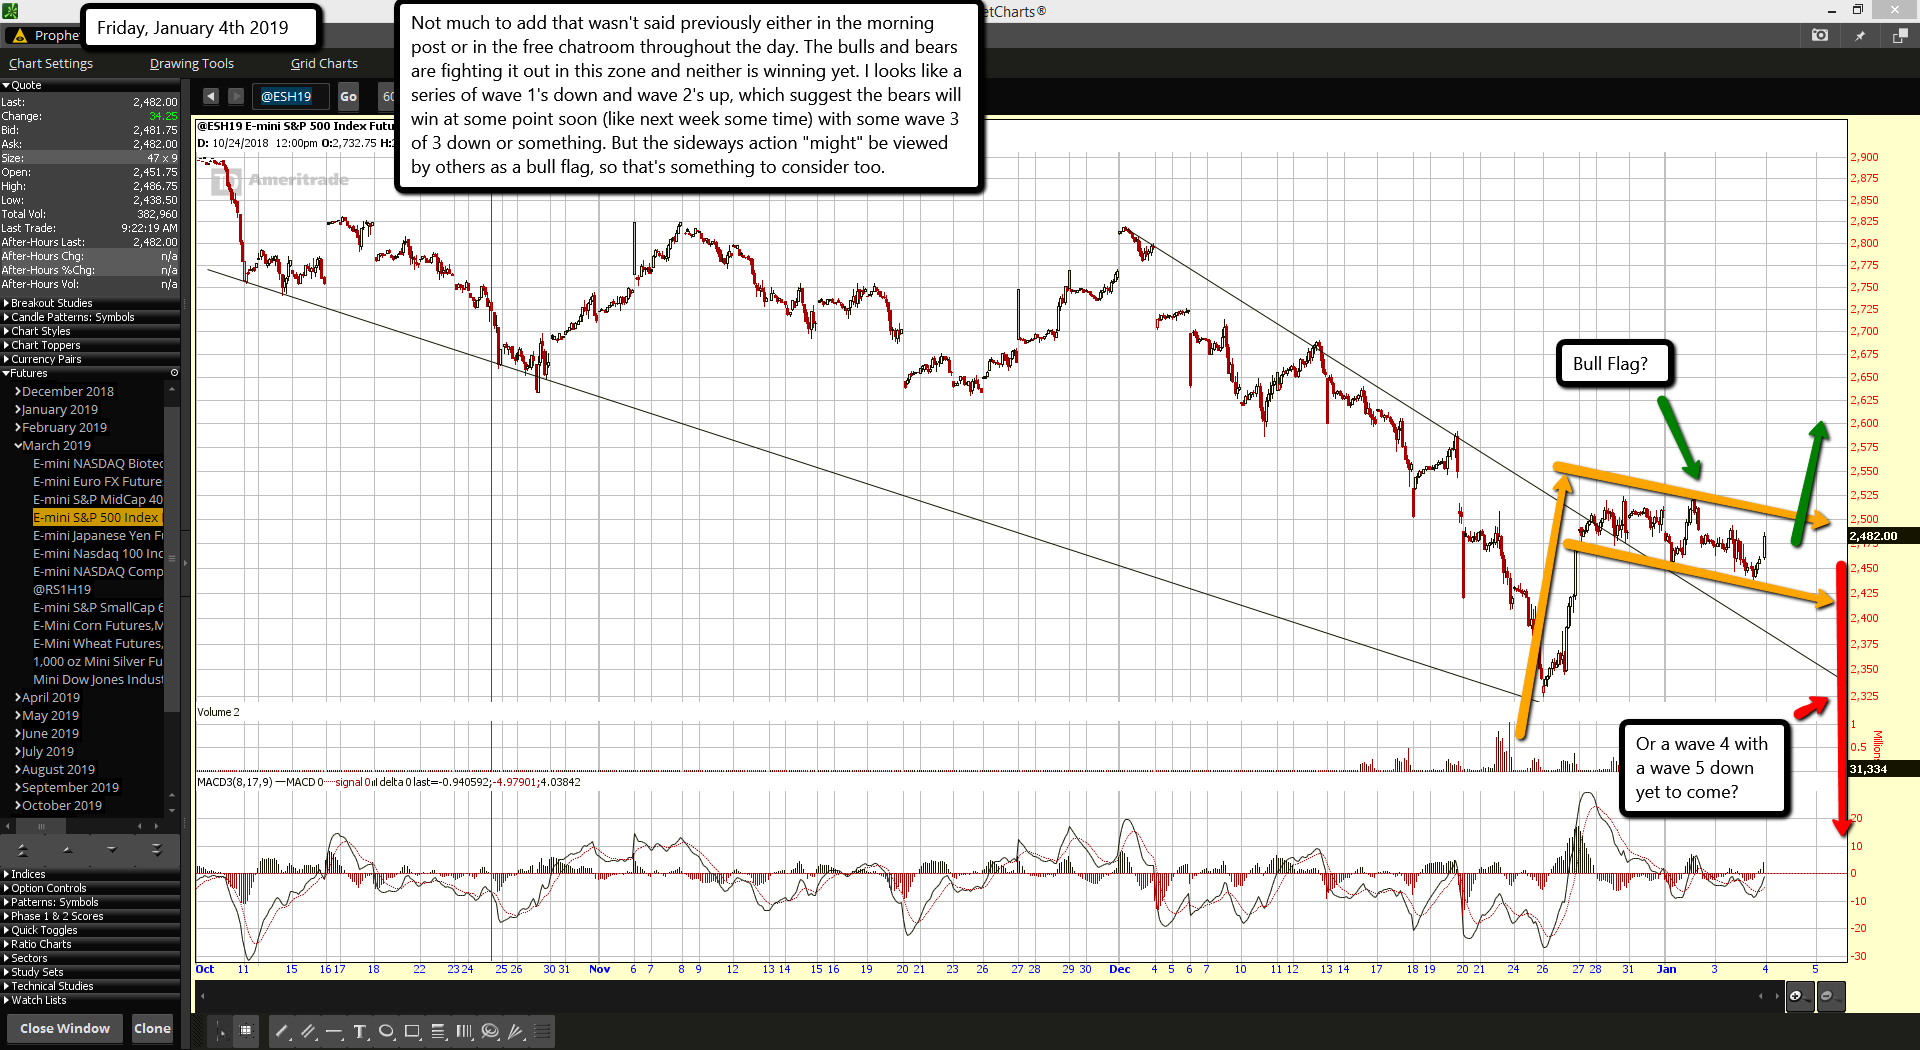
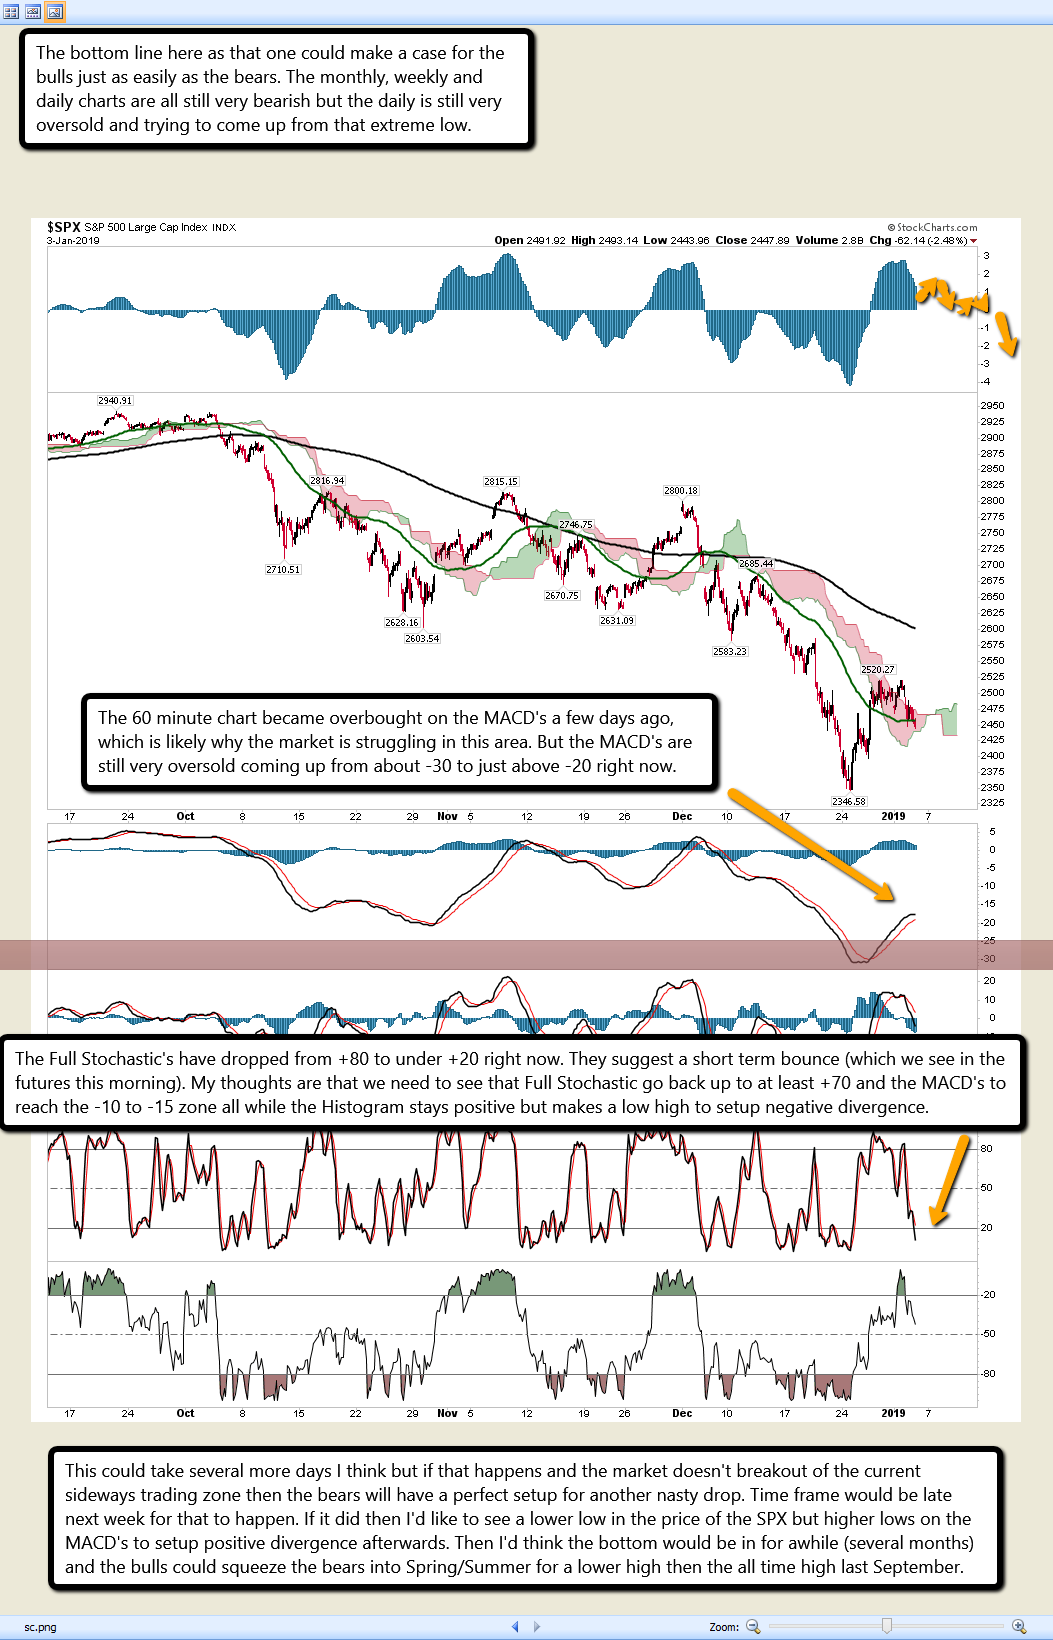
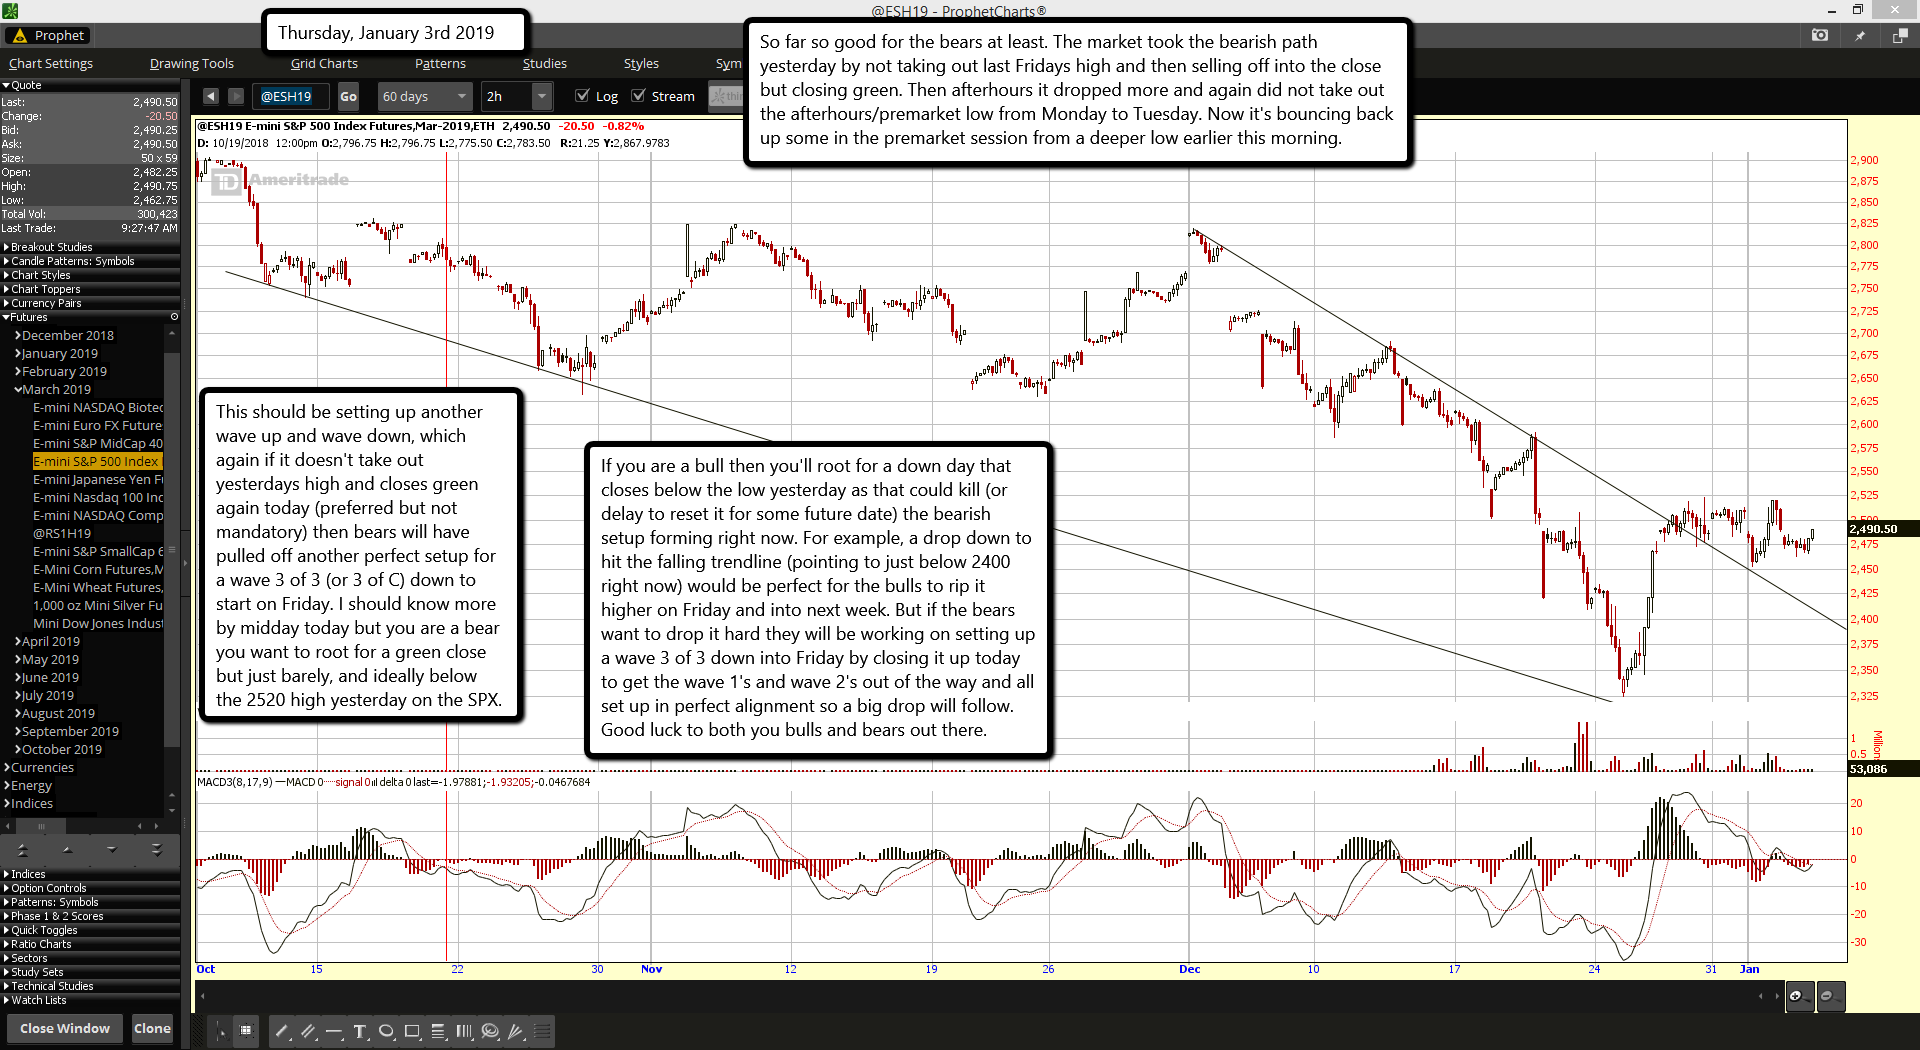
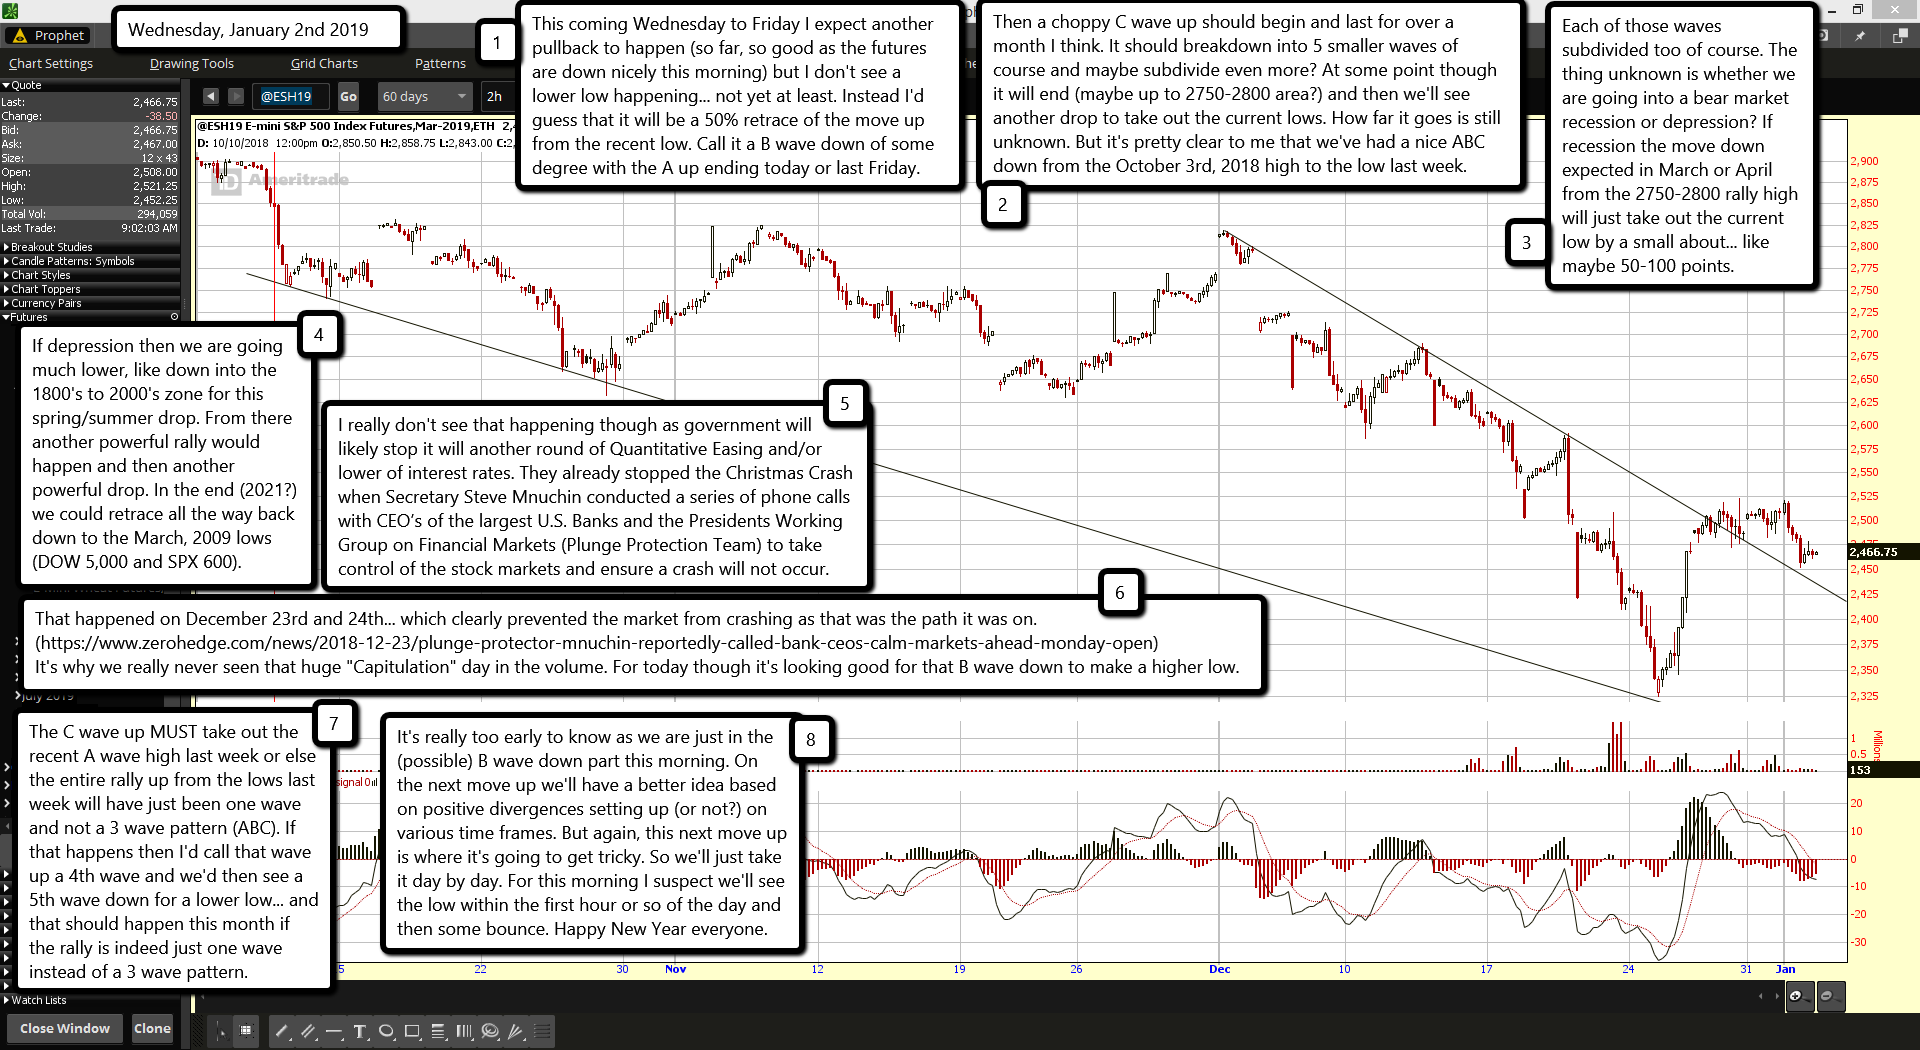
This coming Wednesday to Friday I expect another pullback to happen (so far, so good as the futures are down nicely this morning) but I don't see a lower low happening... not yet at least. Instead I'd guess that it will be a 50% retrace of the move up from the recent low. Call it a B wave down of some degree with the A up ending today or last Friday.

Then a choppy C wave up should begin and last for over a month I think. It should breakdown into 5 smaller waves of course and maybe subdivide even more? At some point though it will end (maybe up to 2750-2800 area?) and then we'll see another drop to take out the current lows. How far it goes is still unknown. But it's pretty clear to me that we've had a nice ABC down from the October 3rd, 2018 high to the low last week.

Each of those waves subdivided too of course. The thing unknown is whether we are going into a bear market recession or depression? If recession the move down expected in March or April from the 2750-2800 rally high will just take out the current low by a small about... like maybe 50-100 points.

If depression then we are going much lower, like down into the 1800's to 2000's zone for this spring/summer drop. From there another powerful rally would happen and then another powerful drop. In the end (2021?) we could retrace all the way back down to the March, 2009 lows (DOW 5,000 and SPX 600).

I really don't see that happening though as government will likely stop it will another round of Quantitative Easing and/or lower of interest rates. They already stopped the Christmas Crash when Secretary Steve Mnuchin conducted a series of phone calls with CEO’s of the largest U.S. Banks and the Presidents Working Group on Financial Markets (Plunge Protection Team) to take control of the stock markets and ensure a crash will not occur.

That happened on December 23rd and 24th... which clearly prevented the market from crashing as that was the path it was on. (https://www.zerohedge.com/news/2018-12-23/plunge-protector-mnuchin-reportedly-called-bank-ceos-calm-markets-ahead-monday-open) It's why we really never seen that huge "Capitulation" day in the volume. For today though it's looking good for that B wave down to make a higher low.

The C wave up MUST take out the recent A wave high last week or else the entire rally up from the lows last week will have just been one wave and not a 3 wave pattern (ABC). If that happens then I'd call that wave up a 4th wave and we'd then see a 5th wave down for a lower low... and that should happen this month if the rally is indeed just one wave instead of a 3 wave pattern.

It's really too early to know as we are just in the (possible) B wave down part this morning. On the next move up we'll have a better idea based on positive divergences setting up (or not?) on various time frames. But again, this next move up is where it's going to get tricky. So we'll just take it day by day. For this morning I suspect we'll see the low within the first hour or so of the day and then some bounce. Happy New Year everyone.

ES Morning Update December 31st 2018

2

Today is the last day of 2018 and I'm not expecting much action in the market. A pin around the 2500 SPX area seems likely. The market will be close Tuesday of course for New Years Day. No point going into to much detail right now as again I don't expect much to happen.

On another note everyone in my free chatroom knows that that lost my beloved dog Suzy last week. She slipped a disc in her spine and it paralyzed her rear legs and body. I was up all night Christmas Day and so was she as the pain was horrible. The next day I took her the Vet and they said there was no way to cure her and I was forced to put her to sleep.

She was the smartest dog I'd ever seen.  She would go up on the hill side behind my house by herself and our other little dog Mickey (that we bought for Suzy to have a buddy to play with) would follow her up the hill. Then my two cats Simba and Sheba would also follow her as well. She literally would "walk the animals" herself without me! I've never seen anything like it in my life.

In the summertime I would take her and Mickey up the hill and both cats would follow too. But that was me walking them, not Suzy walking them without me. It's just been too muddy lately to go up the hill (for me at least), but Suzy missed those walks and would decide to do them without me.

She was incredible smart. I have 8 security cameras on the property and a monitor in the living room on the wall to the left of the big screen TV. Suzy would know the difference between what's on TV and what's on the monitor. She would lay on the couch and watch the monitor to see what's going on outside. Then if someone (usually a mail truck) would come onto the property she'd bark and leave the couch to go outside and meet them.

Micky doesn't have a clue what the monitor is or does, but he's still a puppy so maybe he'll learn? As most of you regulars know I lost my Dad back in March of 2016 and then my mother later that year in November. Suzy (my mothers middle name was Sue or Susan) was their dog first so losing her was like losing my mother all over again. She was less then 4 years old and should have lived to be 10-12... maybe 15? Needless to say I've had a very depressing Christmas. I can only think that my mother was missing Suzy in heaven and took her early to be with her up there. So this post is dedicated to Suzy. May she be happy again with my mother and dad.

ES Morning Update December 24th 2018

0

Markets oversold everywhere and I'm expecting another big drop... aka, the crash wave. Yeah, it's crazy to even think that's possible during Christmas week but I'm still expecting it anyway. Today would be the most logical day to do it on as it's the day before Christmas and most traders will be gone. Plus the market closes early today at 1pm EST, so volume should be super light... but what if it's not? What if today is the day that we see that capitulation volume?

Last Friday at the end of the day I heard the closing bell ring twice through my Think or Swim account. It never rings twice. So was that a sign of a crash coming today like it was back on Black Monday, October 19th 1987 when the opening bell back then didn't ring at all? I believe it is a signal, and today would be the most likely day for another Black Monday. Everyone will be caught off guard due to the holiday tomorrow... which is a perfect time for them to pull the trigger I think.

Remember, all market debasements are planned by the elite that run the show. Nothing is random. While no one can guarantee something is going to happen on any given day I'll just say that the clues have been given for a crash this week and today seems to have the highest odds. If it doesn't happen today then great, I'll just look for lower prices in the coming days. Have a very Merry Christmas everyone, and may God bless you.

Christmas Crash Coming

0

This coming Monday, December 24th 2018 get prepared for a stock market crash like 1987!

On Friday, December 21st I heard the closing bell ring twice with my TDameritrade account.  The day the stock market crashed in 1987 the bell never rang.  Of course repeating that pattern would be too obvious so ringing it twice the day before the crash is apparently the new way to signal the insiders.  Get ready Monday...


ES Morning Update December 21st 2018

0

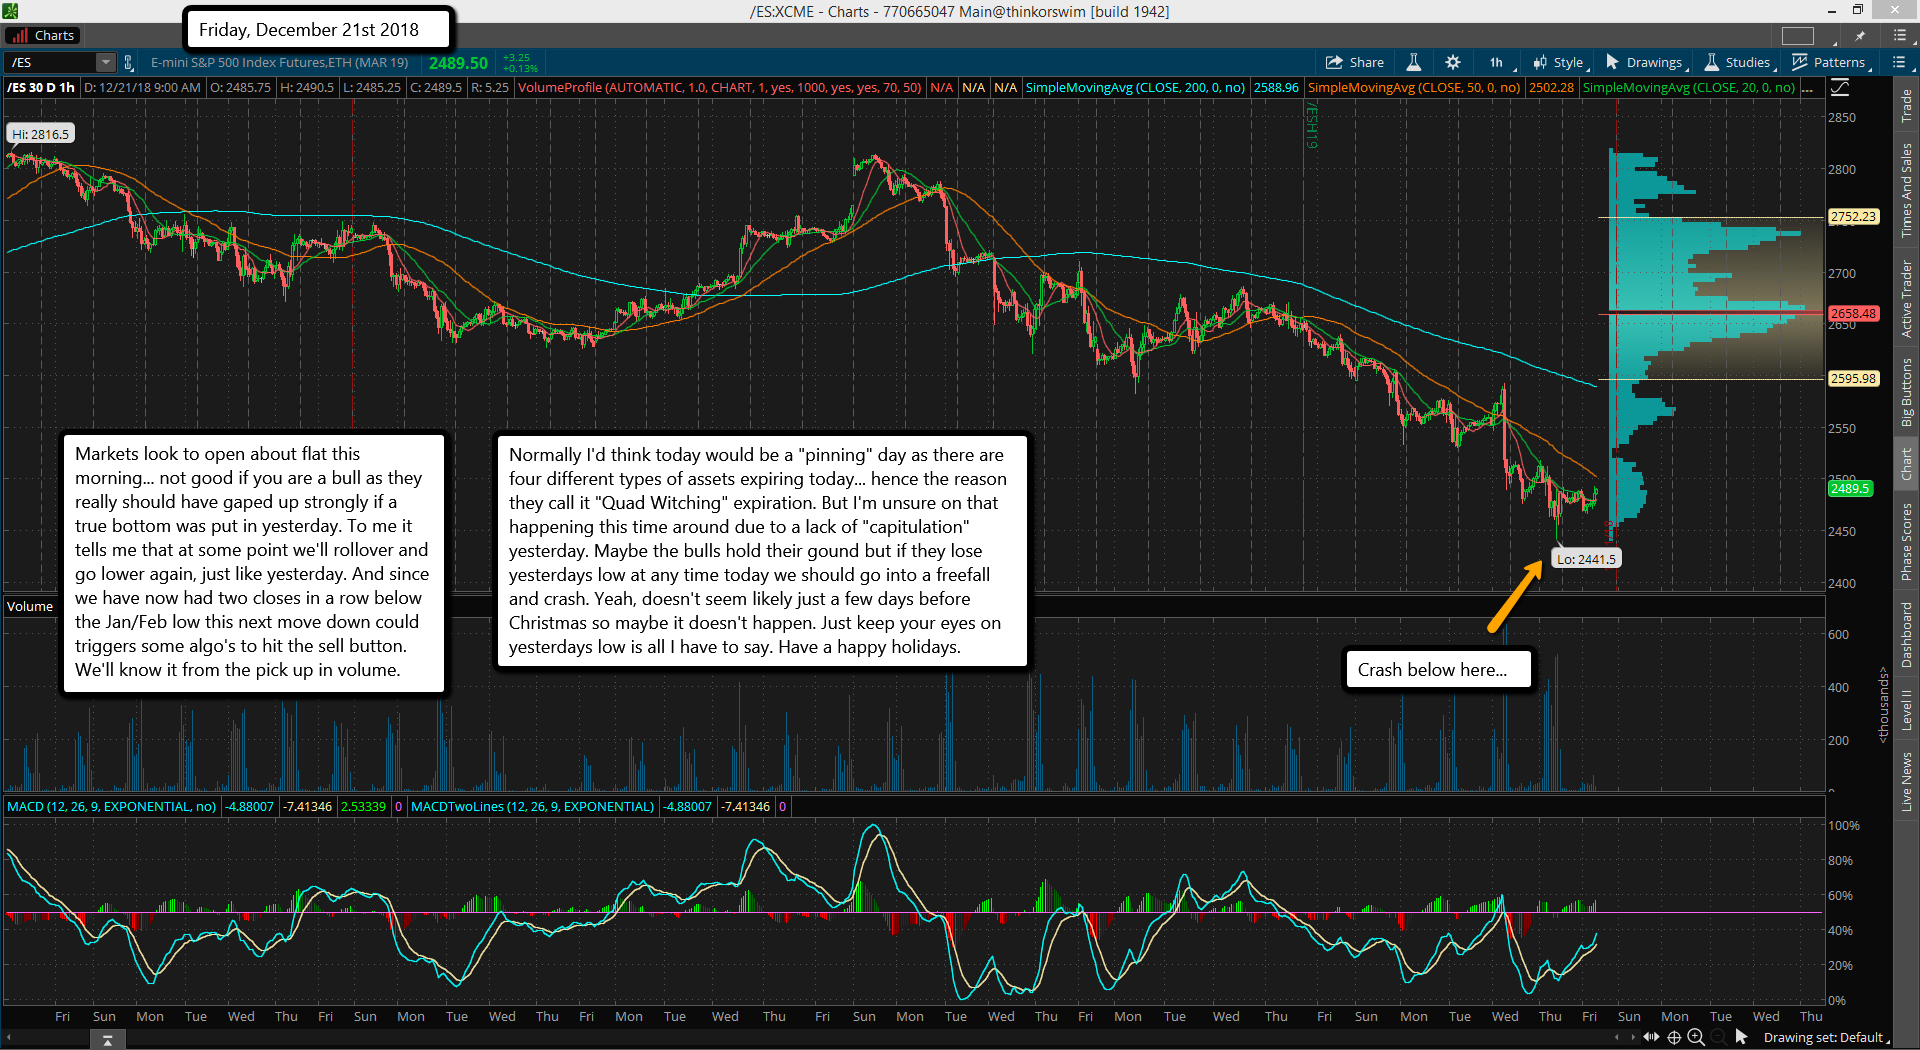
Markets look to open about flat this morning... not good if you are a bull as they really should have gaped up strongly if a true bottom was put in yesterday. To me it tells me that at some point we'll rollover and go lower again, just like yesterday. And since we have now had two closes in a row below the Jan/Feb low this next move down could triggers some algo's to hit the sell button. We'll know it from the pick up in volume.

Normally I'd think today would be a "pinning" day as there are four different types of assets expiring today... hence the reason they call it "Quad Witching" expiration. But I'm unsure on that happening this time around due to a lack of "capitulation" yesterday. Maybe the bulls hold their gound but if they lose yesterdays low at any time today we should go into a freefall and crash. Yeah, doesn't seem likely just a few days before Christmas so maybe it doesn't happen. Just keep your eyes on yesterdays low is all I have to say. Have a happy holidays.

ES Morning Update December 20th 2018

0

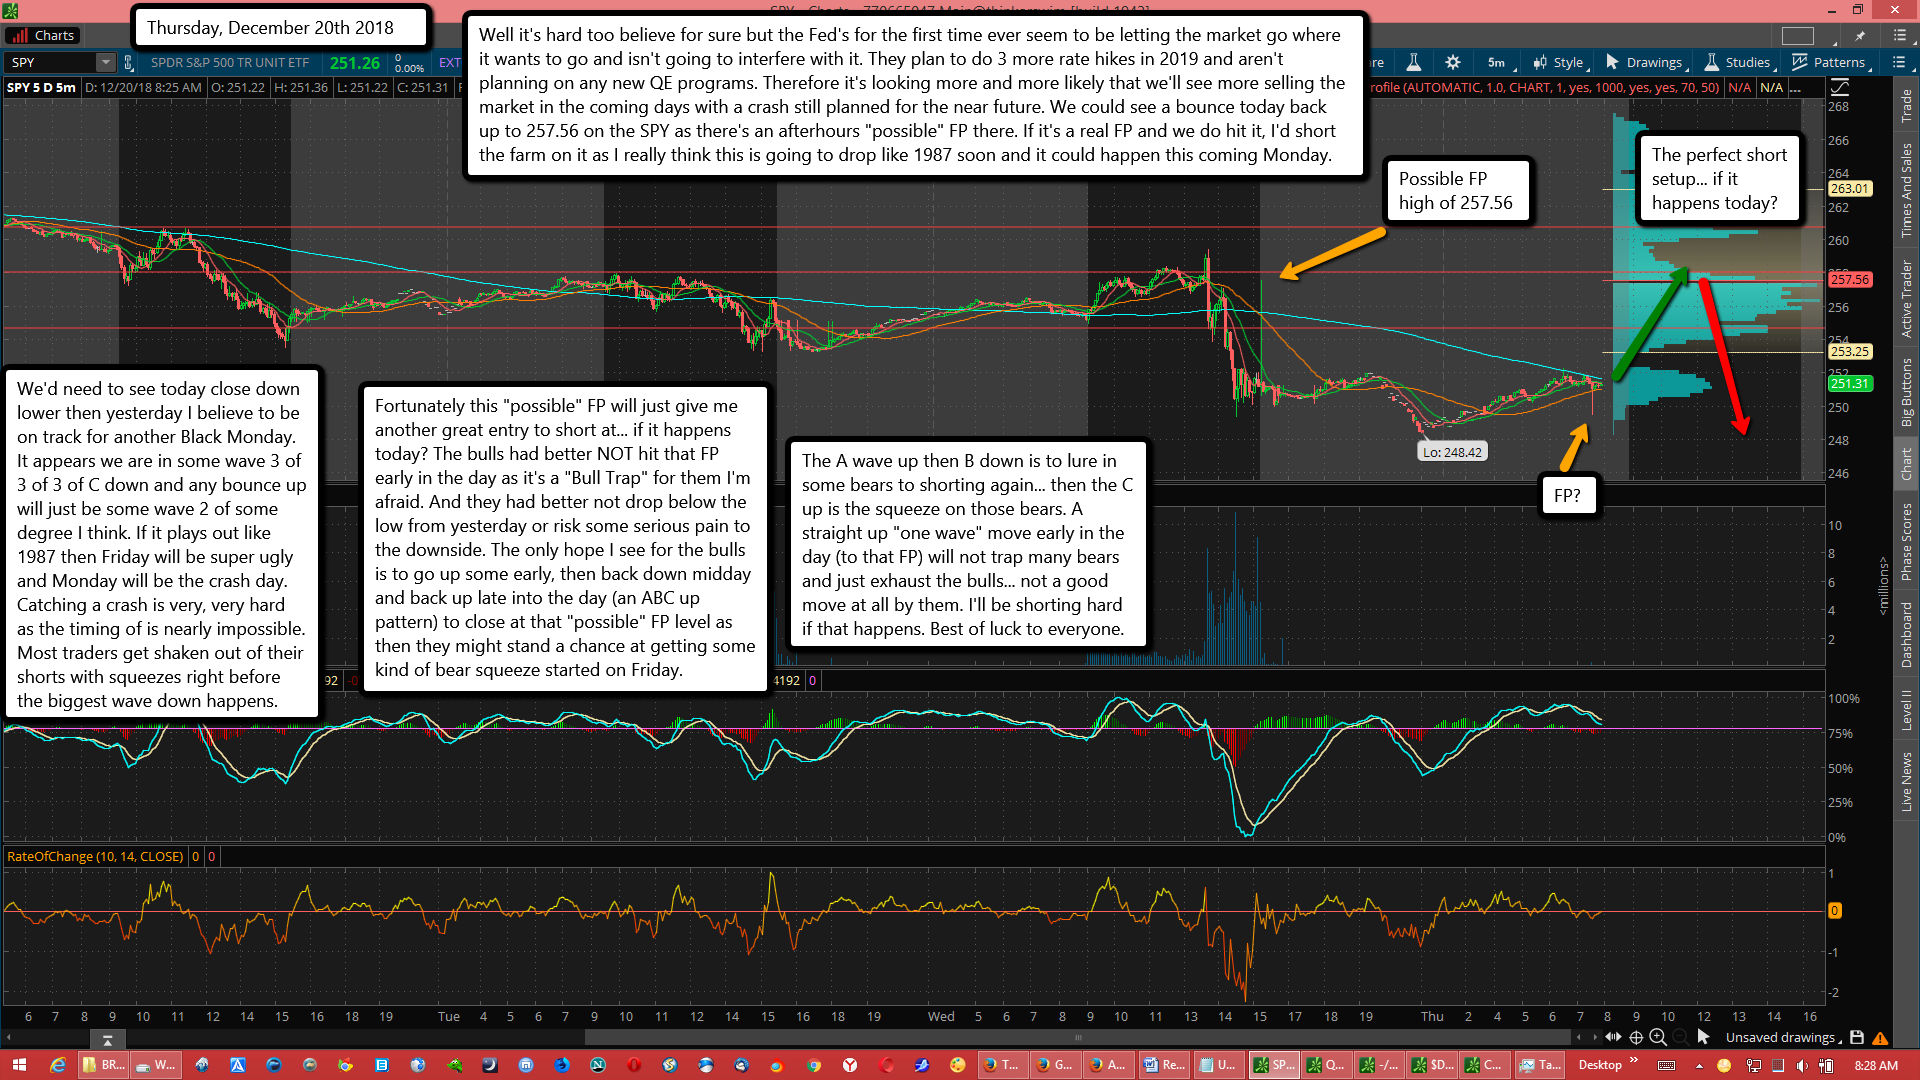
Well it's hard too believe for sure but the Fed's for the first time ever seem to be letting the market go where it wants to go and isn't going to interfere with it. They plan to do 3 more rate hikes in 2019 and aren't planning on any new QE programs. Therefore it's looking more and more likely that we'll see more selling the market in the coming days with a crash still planned for the near future. We could see a bounce today back up to 257.56 on the SPY as there's an afterhours "possible" FP there. If it's a real FP and we do hit it, I'd short the farm on it as I really think this is going to drop like 1987 soon and it could happen this coming Monday.

We'd need to see today close down lower then yesterday I believe to be on track for another Black Monday. It appears we are in some wave 3 of 3 of 3 of C down and any bounce up will just be some wave 2 of some degree I think. If it plays out like 1987 then Friday will be super ugly and Monday will be the crash day. Catching a crash is very, very hard as the timing of is nearly impossible. Most traders get shaken out of their shorts with squeezes right before the biggest wave down happens.

Fortunately this "possible" FP will just give me another great entry to short at... if it happens today? The bulls had better NOT hit that FP early in the day as it's a "Bull Trap" for them I'm afraid. And they had better not drop below the low from yesterday or risk some serious pain to the downside. The only hope I see for the bulls is to go up some early, then back down midday and back up late into the day (an ABC up pattern) to close at that "possible" FP level as then they might stand a chance at getting some kind of bear squeeze started on Friday.

The A wave up then B down is to lure in some bears to shorting again... then the C up is the squeeze on those bears. A straight up "one wave" move early in the day (to that FP) will not trap many bears and just exhaust the bulls... not a good move at all by them. I'll be shorting hard if that happens. Best of luck to everyone.

ES Morning Update December 19th 2018

0

Today is "The Day" for the bears as if they want to crash it then today gives them their highest odds. Failure here and the bulls can take it back up into the end of the year. Crazy as it sounds it's all boiling down to the FOMC meeting today. Jerome Powell needs to say something (and do something) that the market will view positively or else it's going to fall off a cliff and crash. Once the horizontal support from the current low and the Jan/Feb low breaks there's nothing but air below for a long long way down. There's no way to know what they plan to do today as it's been the common practice for many years now to "save the market" at every critical junction like this.

So there's not much more I can add that hasn't already been said many times over again. It will crash today or be saved by the Fed's... pretty simple. Technically speaking it's perfectly aligned up for a crash... a wave 3 of 3 of C or something like that. But we all know that the market is manipulated heavily and we just have to guess on "if" this time will be like the prior times in the past or if they will just let it fall without interfering. I don't have the answer but I remain short and will either lose or win big. Good luck to everyone... bears and bulls alike.

ES Morning Update December 18th 2018

0

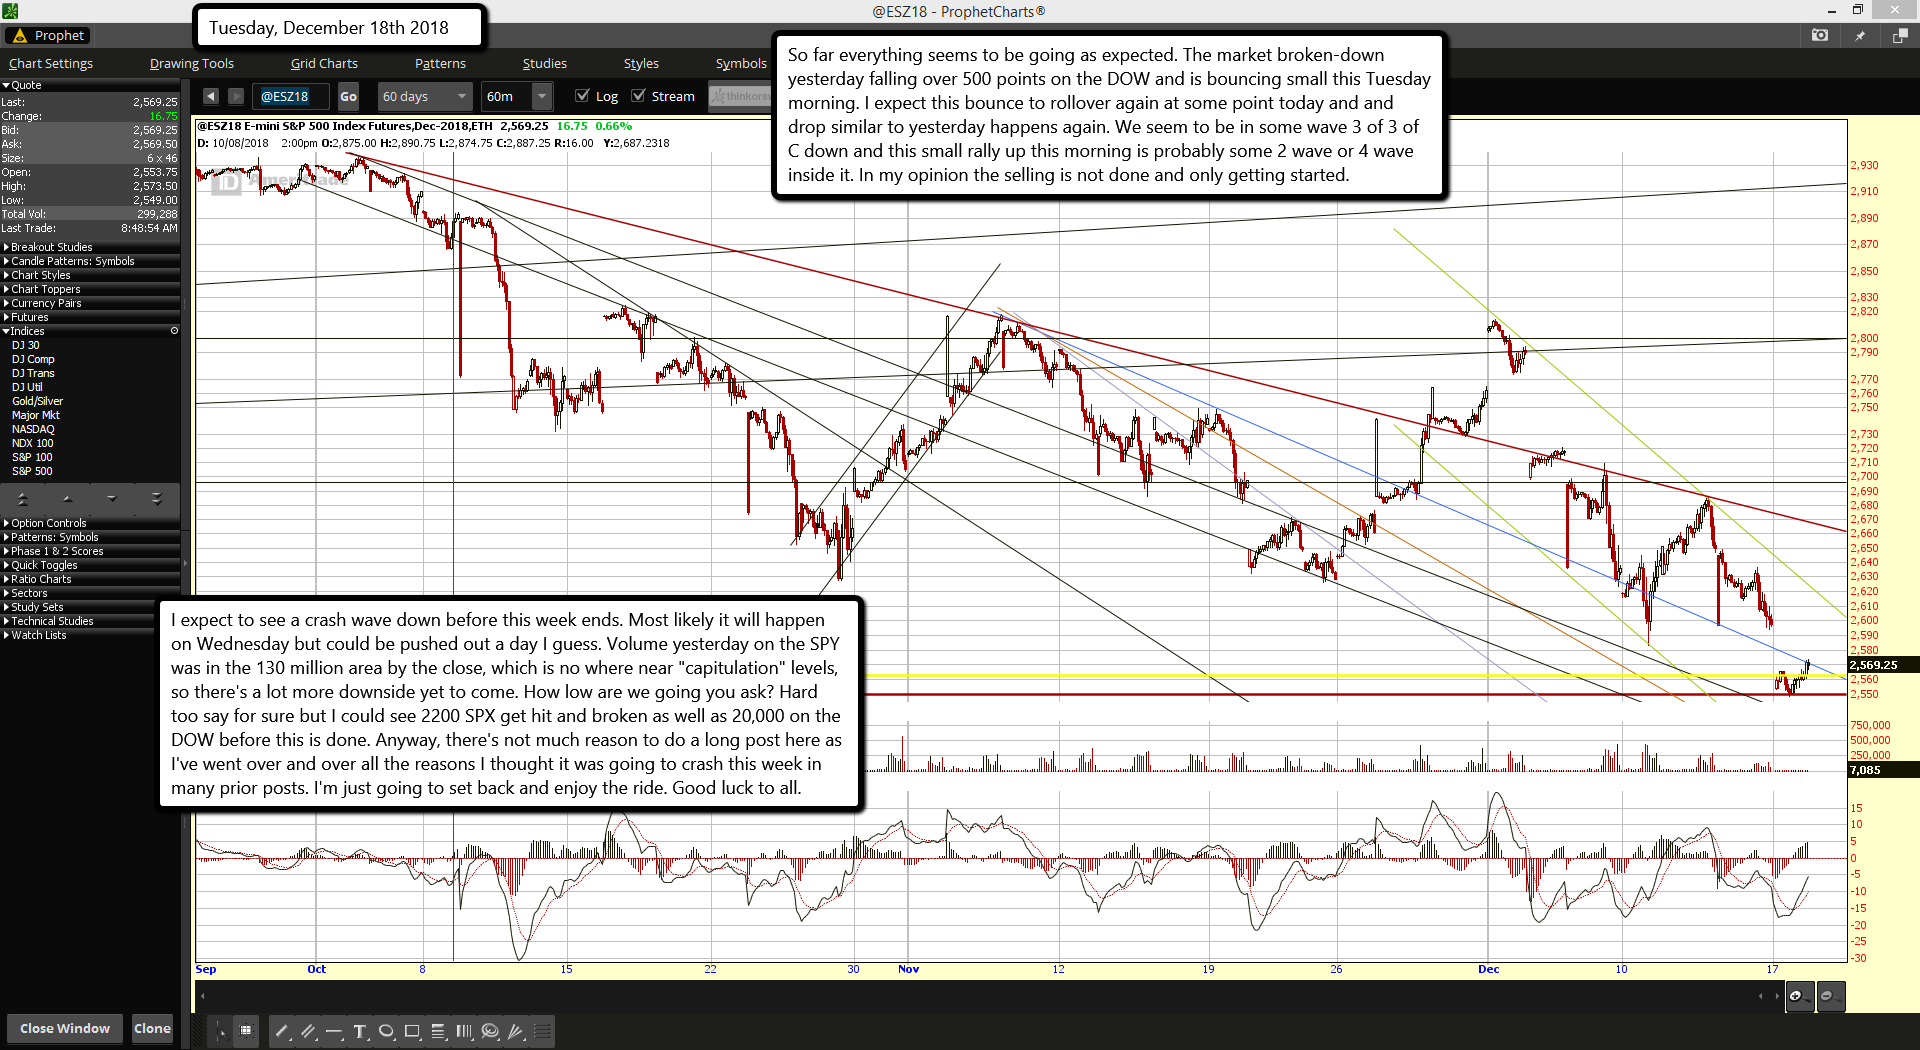
So far everything seems to be going as expected. The market broken-down yesterday falling over 500 points on the DOW and is bouncing small this Tuesday morning. I expect this bounce to rollover again at some point today and and drop similar to yesterday happens again. We seem to be in some wave 3 of 3 of C down and this small rally up this morning is probably some 2 wave or 4 wave inside it. In my opinion the selling is not done and only getting started.

I expect to see a crash wave down before this week ends. Most likely it will happen on Wednesday but could be pushed out a day I guess. Volume yesterday on the SPY was in the 130 million area by the close, which is no where near "capitulation" levels, so there's a lot more downside yet to come. How low are we going you ask? Hard too say for sure but I could see 2200 SPX get hit and broken as well as 20,000 on the DOW before this is done. Anyway, there's not much reason to do a long post here as I've went over and over all the reasons I thought it was going to crash this week in many prior posts. I'm just going to set back and enjoy the ride. Good luck to all.

ES Morning Update December 17th 2018

0

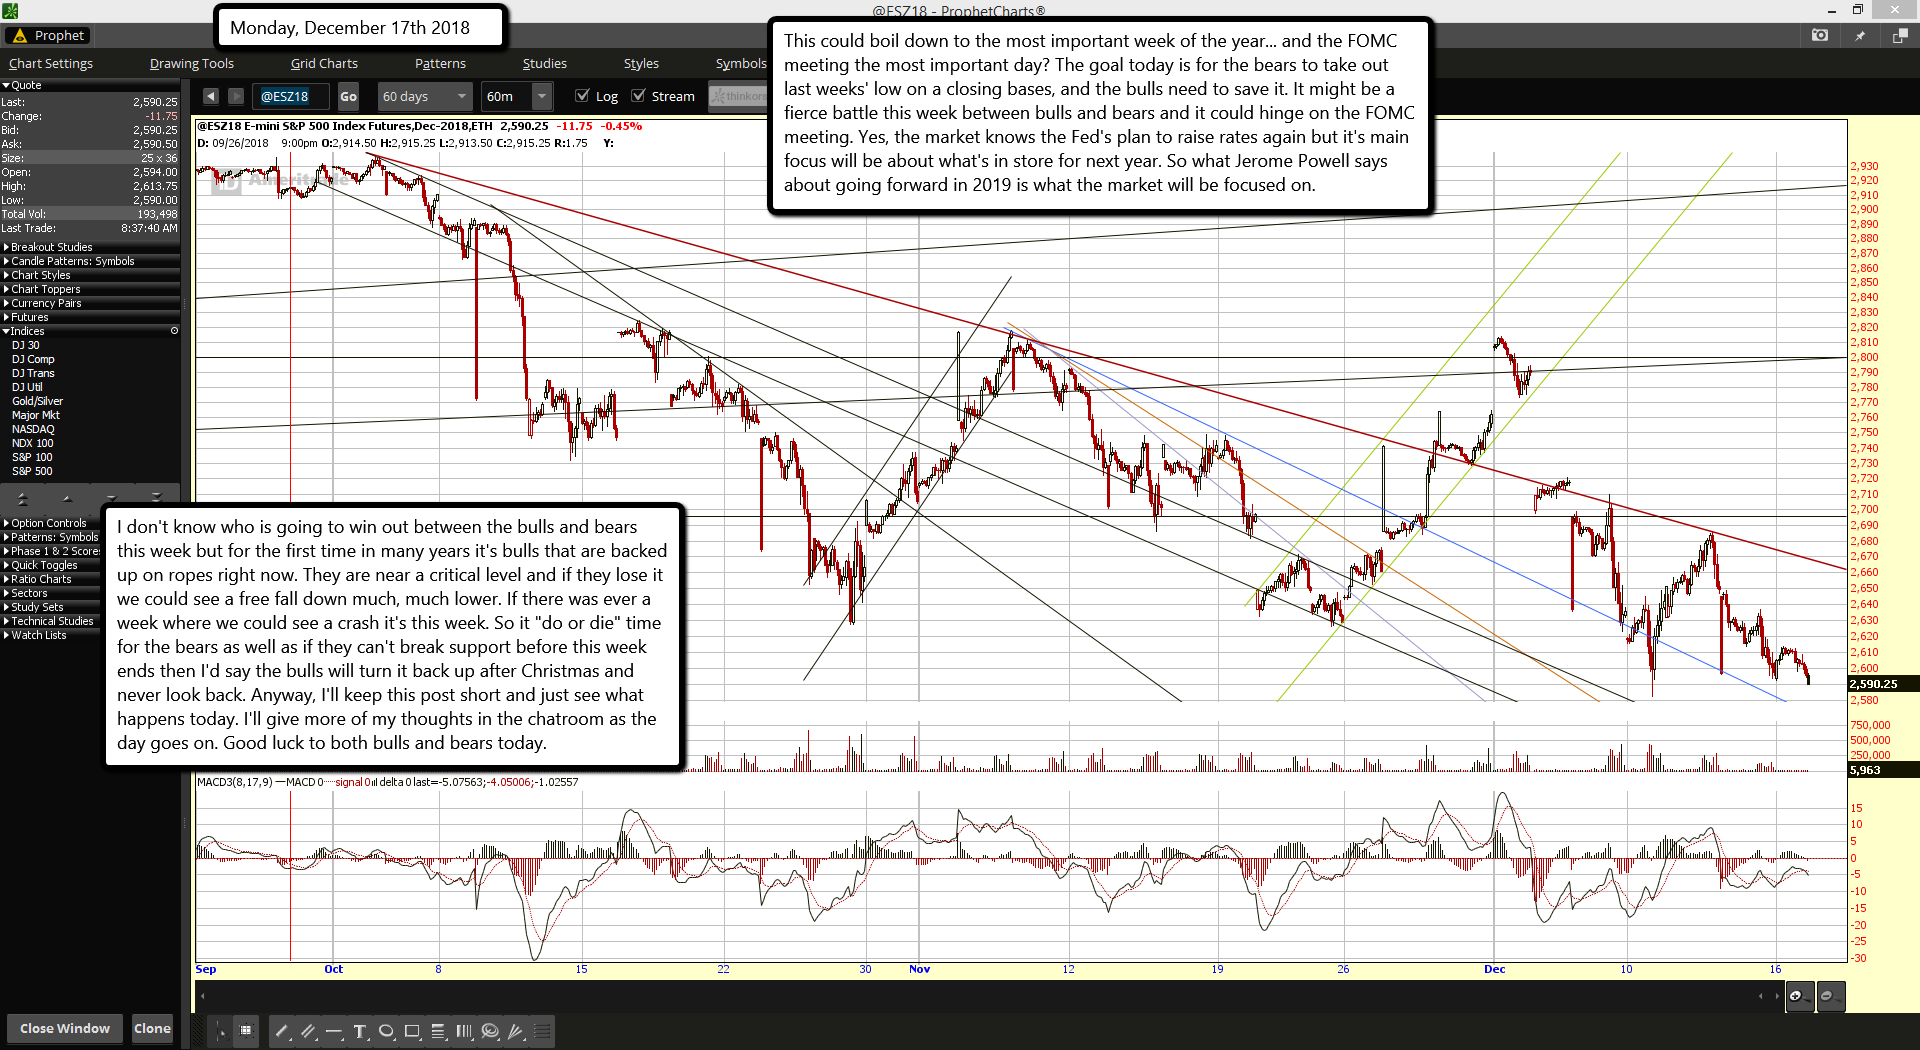
This could boil down to the most important week of the year... and the FOMC meeting the most important day? The goal today is for the bears to take out last weeks' low on a closing bases, and the bulls need to save it. It might be a fierce battle this week between bulls and bears and it could hinge on the FOMC meeting. Yes, the market knows the Fed's plan to raise rates again but it's main focus will be about what's in store for next year. So what Jerome Powell says about going forward in 2019 is what the market will be focused on.

I don't know who is going to win out between the bulls and bears this week but for the first time in many years it's bulls that are backed up on ropes right now. They are near a critical level and if they lose it we could see a free fall down much, much lower. If there was ever a week where we could see a crash it's this week. So it "do or die" time for the bears as well as if they can't break support before this week ends then I'd say the bulls will turn it back up after Christmas and never look back. Anyway, I'll keep this post short and just see what happens today. I'll give more of my thoughts in the chatroom as the day goes on. Good luck to both bulls and bears today.

ES Morning Update December 14th 2018

0

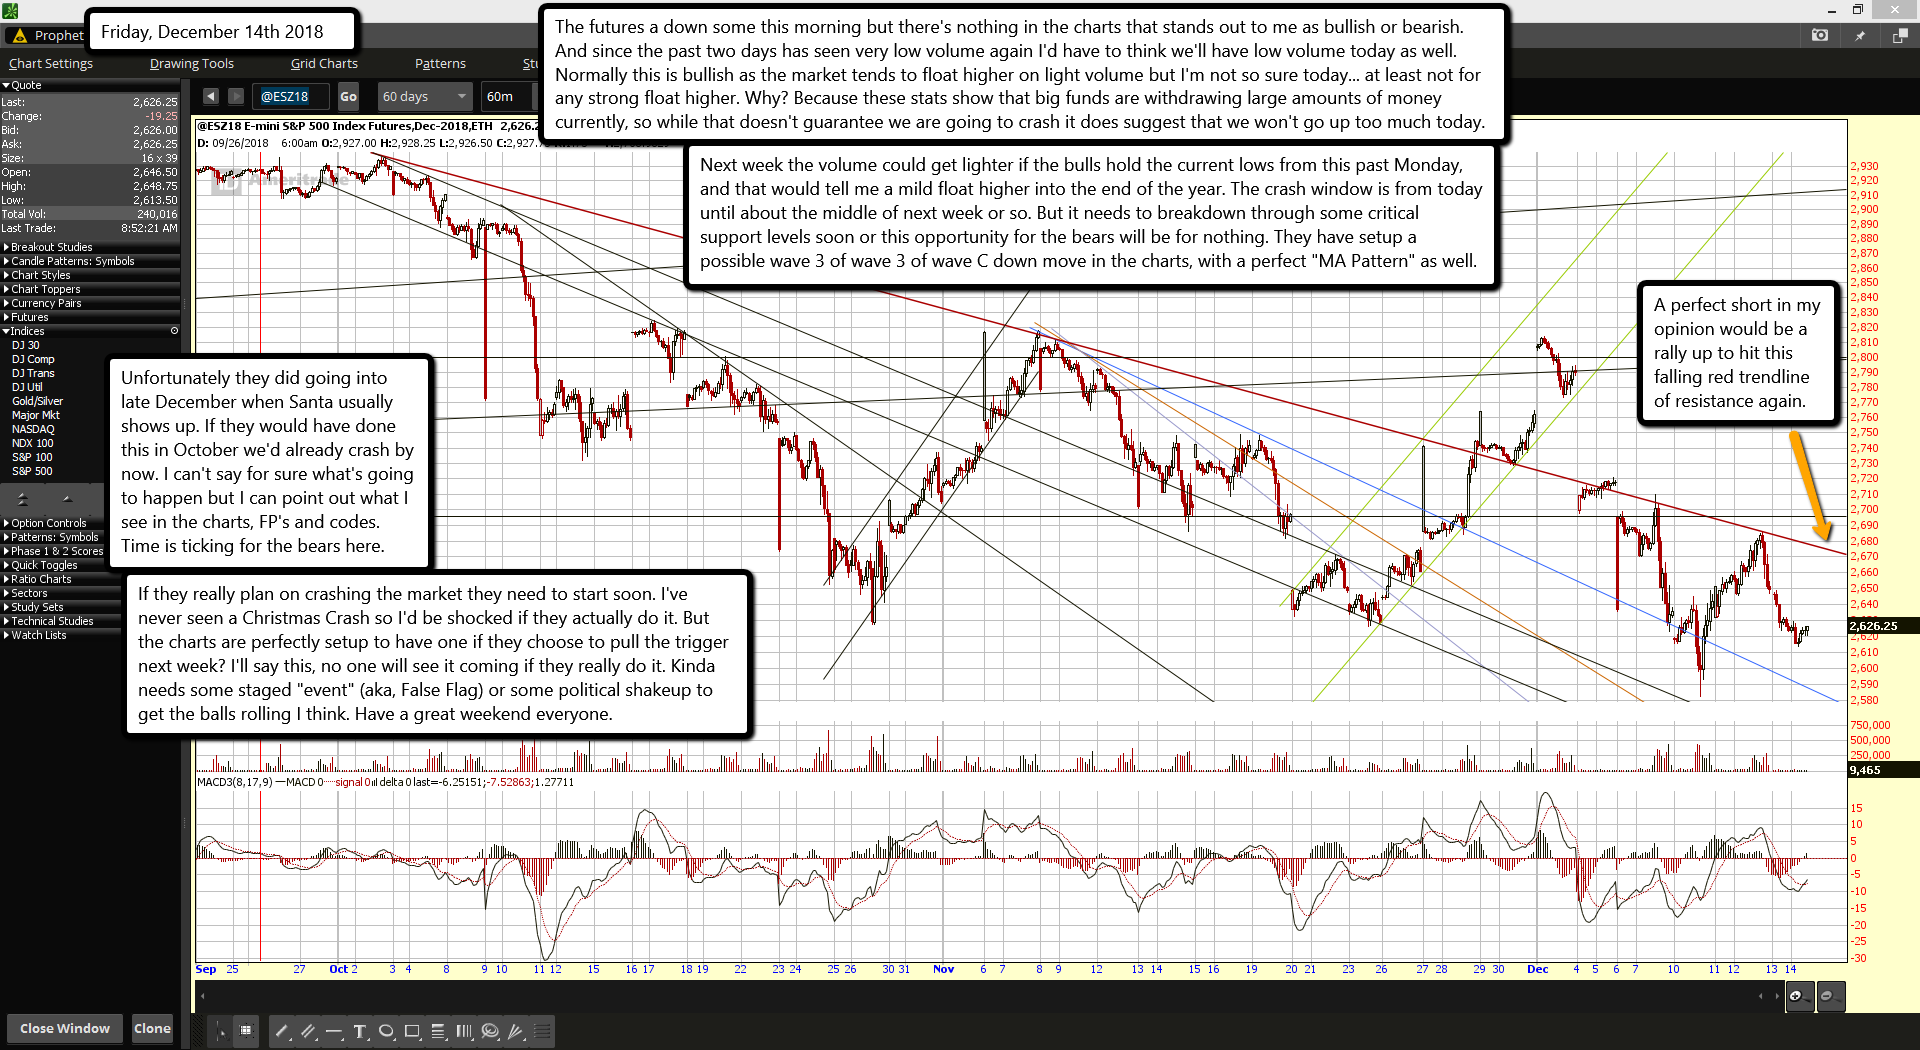
The futures a down some this morning but there's nothing in the charts that stands out to me as bullish or bearish. And since the past two days has seen very low volume again I'd have to think we'll have low volume today as well. Normally this is bullish as the market tends to float higher on light volume but I'm not so sure today... at least not for any strong float higher. Why? Because these stats show that big funds are withdrawing large amounts of money currently, so while that doesn't guarantee we are going to crash it does suggest that we won't go up too much today.


Lipper reporting $46b equity MF + ETF outflow in the past week, which is huge, but at least half of this is seasonal end of year stuff. Last 6 yrs:
2013: -$13b
2014: -$18b
2015: -$13b
2016: -$21b
2017: -$22b
2018: -$46b

The largest equity fund outflow of the year almost always occurs in mid-December. Even so, this week's outflow of 0.44% of total equity fund assets is the largest in 15 years.  The previous record was 0.39% in mid-August 2011.


Next week the volume could get lighter if the bulls hold the current lows from this past Monday, and that would tell me a mild float higher into the end of the year. The crash window is from today until about the middle of next week or so. But it needs to breakdown through some critical support levels soon or this opportunity for the bears will be for nothing. They have setup a possible wave 3 of wave 3 of wave C down move in the charts, with a perfect "MA Pattern" as well.

Unfortunately they did going into late December when Santa usually shows up. If they would have done this in October we'd already crash by now. I can't say for sure what's going to happen but I can point out what I see in the charts, FP's and codes. Time is ticking for the bears here.

If they really plan on crashing the market they need to start soon. I've never seen a Christmas Crash so I'd be shocked if they actually do it. But the charts are perfectly setup to have one if they choose to pull the trigger next week? I'll say this, no one will see it coming if they really do it. Kinda needs some staged "event" (aka, False Flag) or some political shakeup to get the balls rolling I think. Have a great weekend everyone.

ES Morning Update December 13th 2018

0

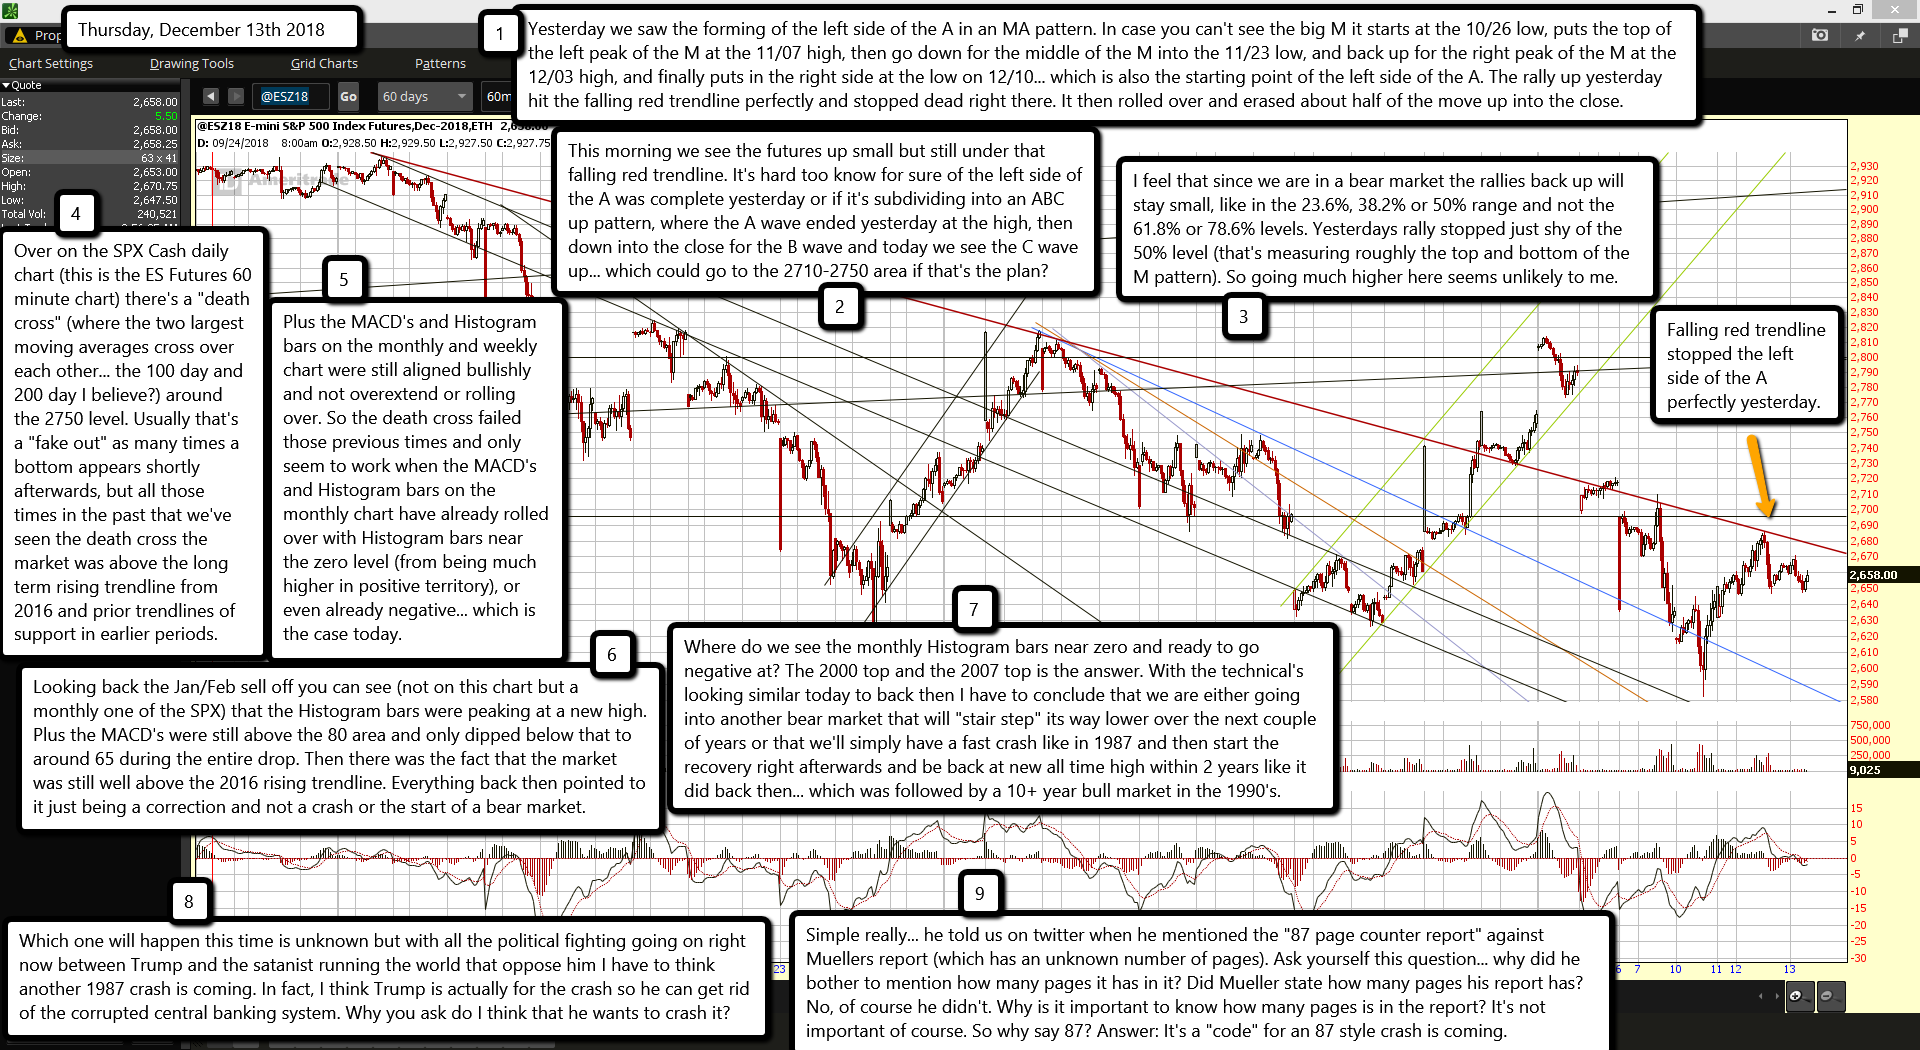
Yesterday we saw the forming of the left side of the A in an MA pattern. In case you can't see the big M it starts at the 10/26 low, puts the top of the left peak of the M at the 11/07 high, then go down for the middle of the M into the 11/23 low, and back up for the right peak of the M at the 12/03 high, and finally puts in the right side at the low on 12/10... which is also the starting point of the left side of the A. The rally up yesterday hit the falling red trendline perfectly and stopped dead right there. It then rolled over and erased about half of the move up into the close.

This morning we see the futures up small but still under that falling red trendline. It's hard too know for sure of the left side of the A was complete yesterday or if it's subdividing into an ABC up pattern, where the A wave ended yesterday at the high, then down into the close for the B wave and today we see the C wave up... which could go to the 2710-2750 area if that's the plan?

I feel that since we are in a bear market the rallies back up will stay small, like in the 23.6%, 38.2% or 50% range and not the 61.8% or 78.6% levels. Yesterdays rally stopped just shy of the 50% level (that's measuring roughly the top and bottom of the M pattern). So going much higher here seems unlikely to me.

Over on the SPX Cash daily chart (this is the ES Futures 60 minute chart) there's a "death cross" (where the two largest moving averages cross over each other... the 100 day and 200 day I believe?) around the 2750 level. Usually that's a "fake out" as many times a bottom appears shortly afterwards, but all those times in the past that we've seen the death cross the market was above the long term rising trendline from 2016 and prior trendlines of support in earlier periods.

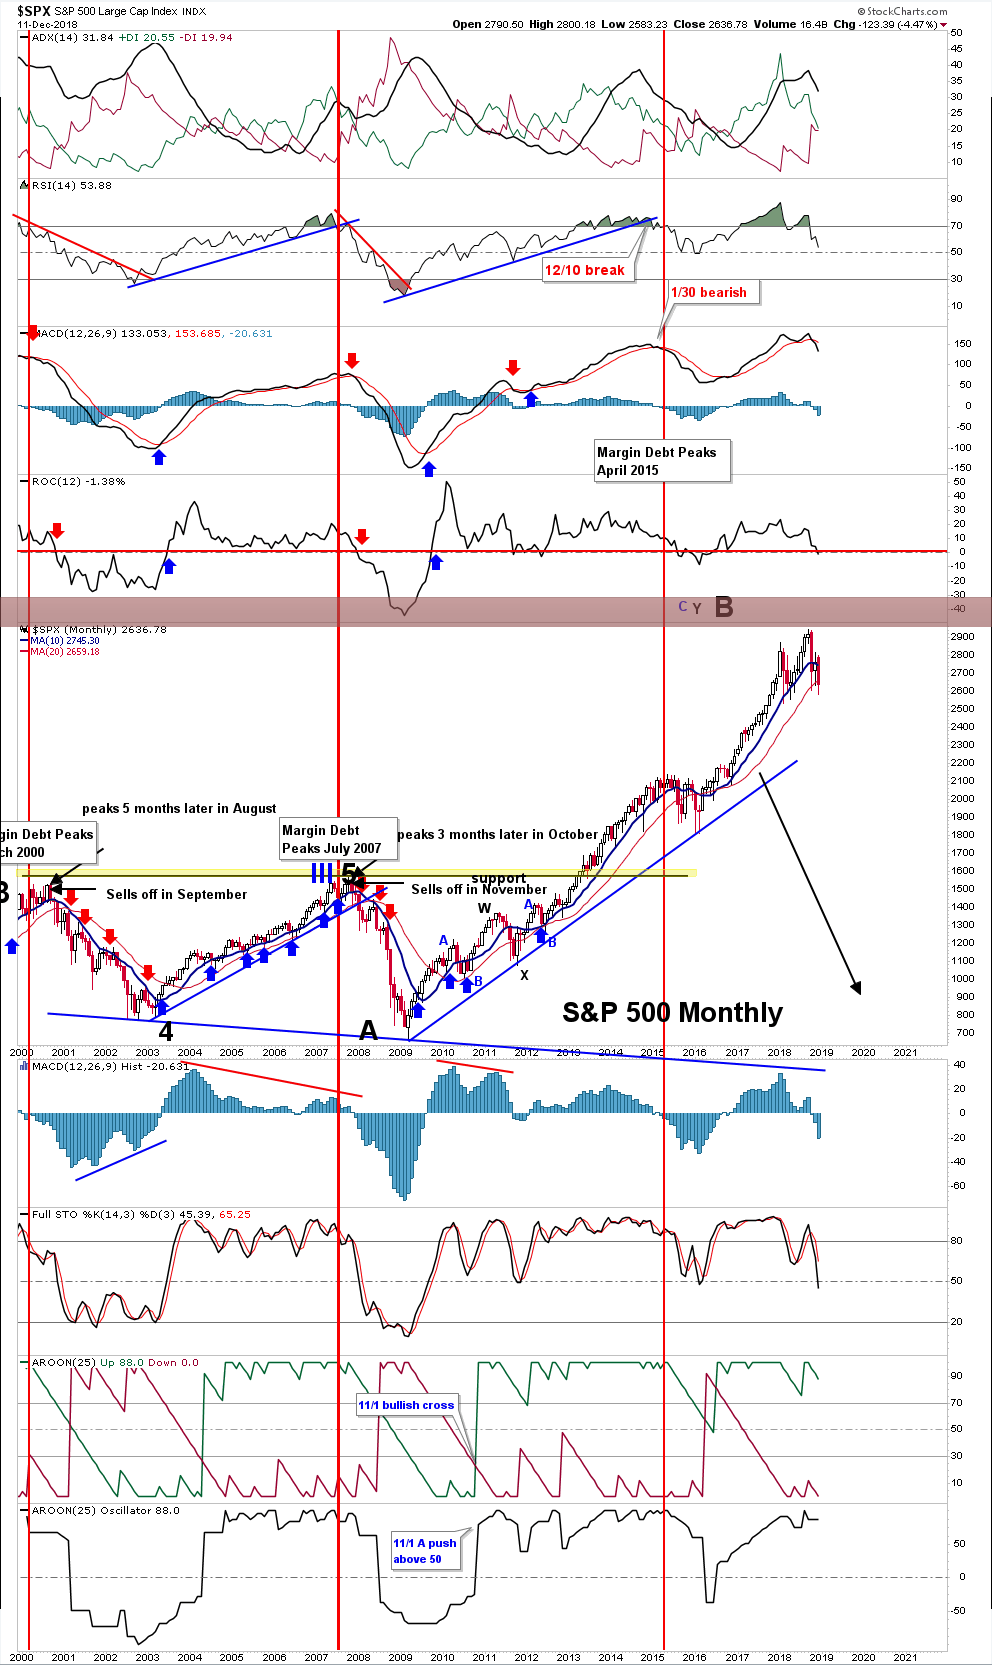
Plus the MACD's and Histogram bars on the monthly and weekly chart were still aligned bullishly and not overextend or rolling over. So the death cross failed those previous times and only seem to work when the MACD's and Histogram bars on the monthly chart have already rolled over with Histogram bars near the zero level (from being much higher in positive territory), or even already negative... which is the case today.

(Source of monthly chart above is from Ron Walker at TheChartPatternTrader)

Looking back the Jan/Feb sell off you can see (not on this chart but a monthly one of the SPX) that the Histogram bars were peaking at a new high. Plus the MACD's were still above the 80 area and only dipped below that to around 65 during the entire drop. Then there was the fact that the market was still well above the 2016 rising trendline. Everything back then pointed to it just being a correction and not a crash or the start of a bear market.

Where do we see the monthly Histogram bars near zero and ready to go negative at? The 2000 top and the 2007 top is the answer. With the technical's looking similar today to back then I have to conclude that we are either going into another bear market that will "stair step" its way lower over the next couple of years or that we'll simply have a fast crash like in 1987 and then start the recovery right afterwards and be back at new all time high within 2 years like it did back then... which was followed by a 10+ year bull market in the 1990's.

Which one will happen this time is unknown but with all the political fighting going on right now between Trump and the satanist running the world that oppose him I have to think another 1987 crash is coming. In fact, I think Trump is actually for the crash so he can get rid of the corrupted central banking system. Why you ask do I think that he wants to crash it?

Simple really... he told us on twitter when he mentioned the "87 page counter report" against Muellers report (which has an unknown number of pages). Ask yourself this question... why did he bother to mention how many pages it has in it? Did Mueller state how many pages his report has? No, of course he didn't. Why is it important to know how many pages is in the report? It's not important of course. So why say 87? Answer: It's a "code" for an 87 style crash is coming.

ES Morning Update December 12th 2018

0

Last Chance To Get Short Before The Crash

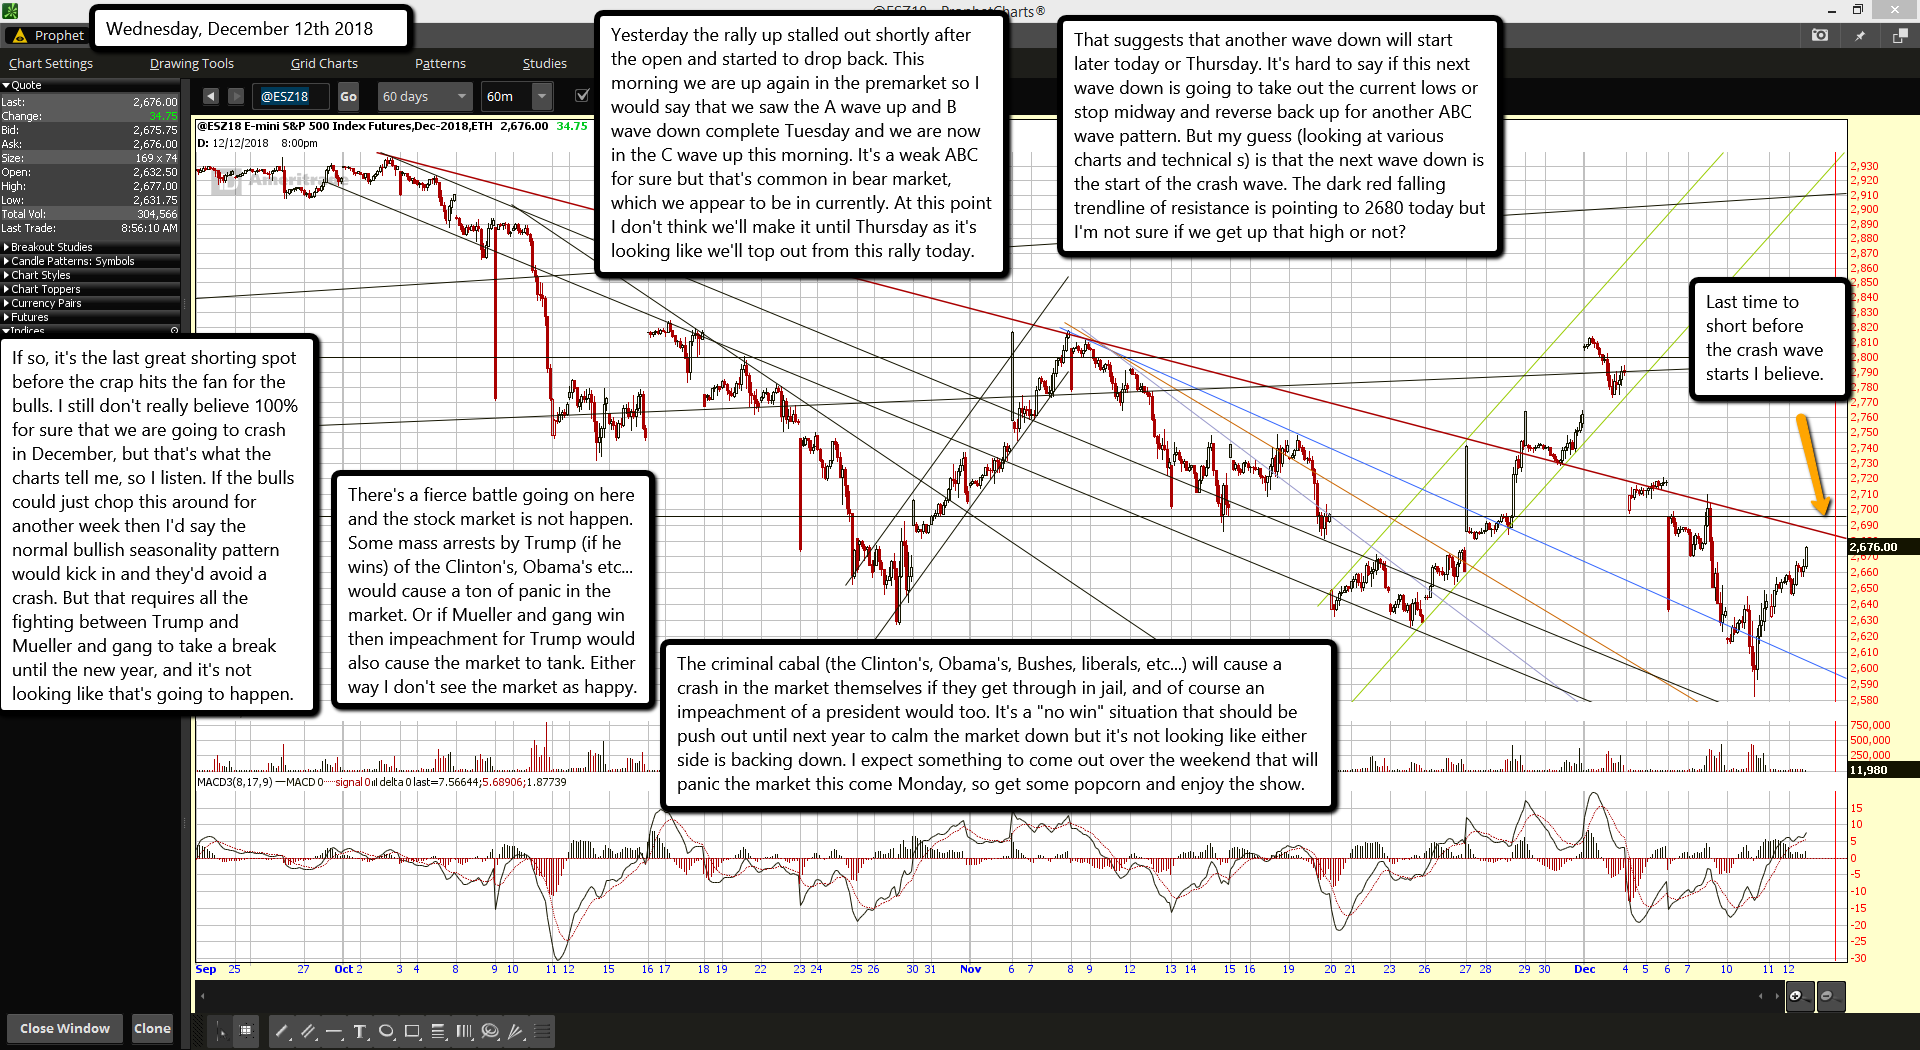
Yesterday the rally up stalled out shortly after the open and started to drop back. This morning we are up again in the premarket so I would say that we saw the A wave up and B wave down complete Tuesday and we are now in the C wave up this morning. It's a weak ABC for sure but that's common in bear market, which we appear to be in currently. At this point I don't think we'll make it until Thursday as it's looking like we'll top out from this rally today.

That suggests that another wave down will start later today or Thursday. It's hard to say if this next wave down is going to take out the current lows or stop midway and reverse back up for another ABC wave pattern. But my guess (looking at various charts and technical s) is that the next wave down is the start of the crash wave. The dark red falling trendline of resistance is pointing to 2680 today but I'm not sure if we get up that high or not?

If so, it's the last great shorting spot before the crap hits the fan for the bulls. I still don't really believe 100% for sure that we are going to crash in December, but that's what the charts tell me, so I listen. If the bulls could just chop this around for another week then I'd say the normal bullish seasonality pattern would kick in and they'd avoid a crash. But that requires all the fighting between Trump and Mueller and gang to take a break until the new year, and it's not looking like that's going to happen.

There's a fierce battle going on here and the stock market is not happen. Some mass arrests by Trump (if he wins) of the Clinton's, Obama's etc... would cause a ton of panic in the market. Or if Mueller and gang win then impeachment for Trump would also cause the market to tank. Either way I don't see the market as happy.

The criminal cabal (the Clinton's, Obama's, Bushes, liberals, etc...) will cause a crash in the market themselves if they get through in jail, and of course an impeachment of a president would too. It's a "no win" situation that should be push out until next year to calm the market down but it's not looking like either side is backing down. I expect something to come out over the weekend that will panic the market this come Monday, so get some popcorn and enjoy the show.

ES Morning Update December 11th 2018

0

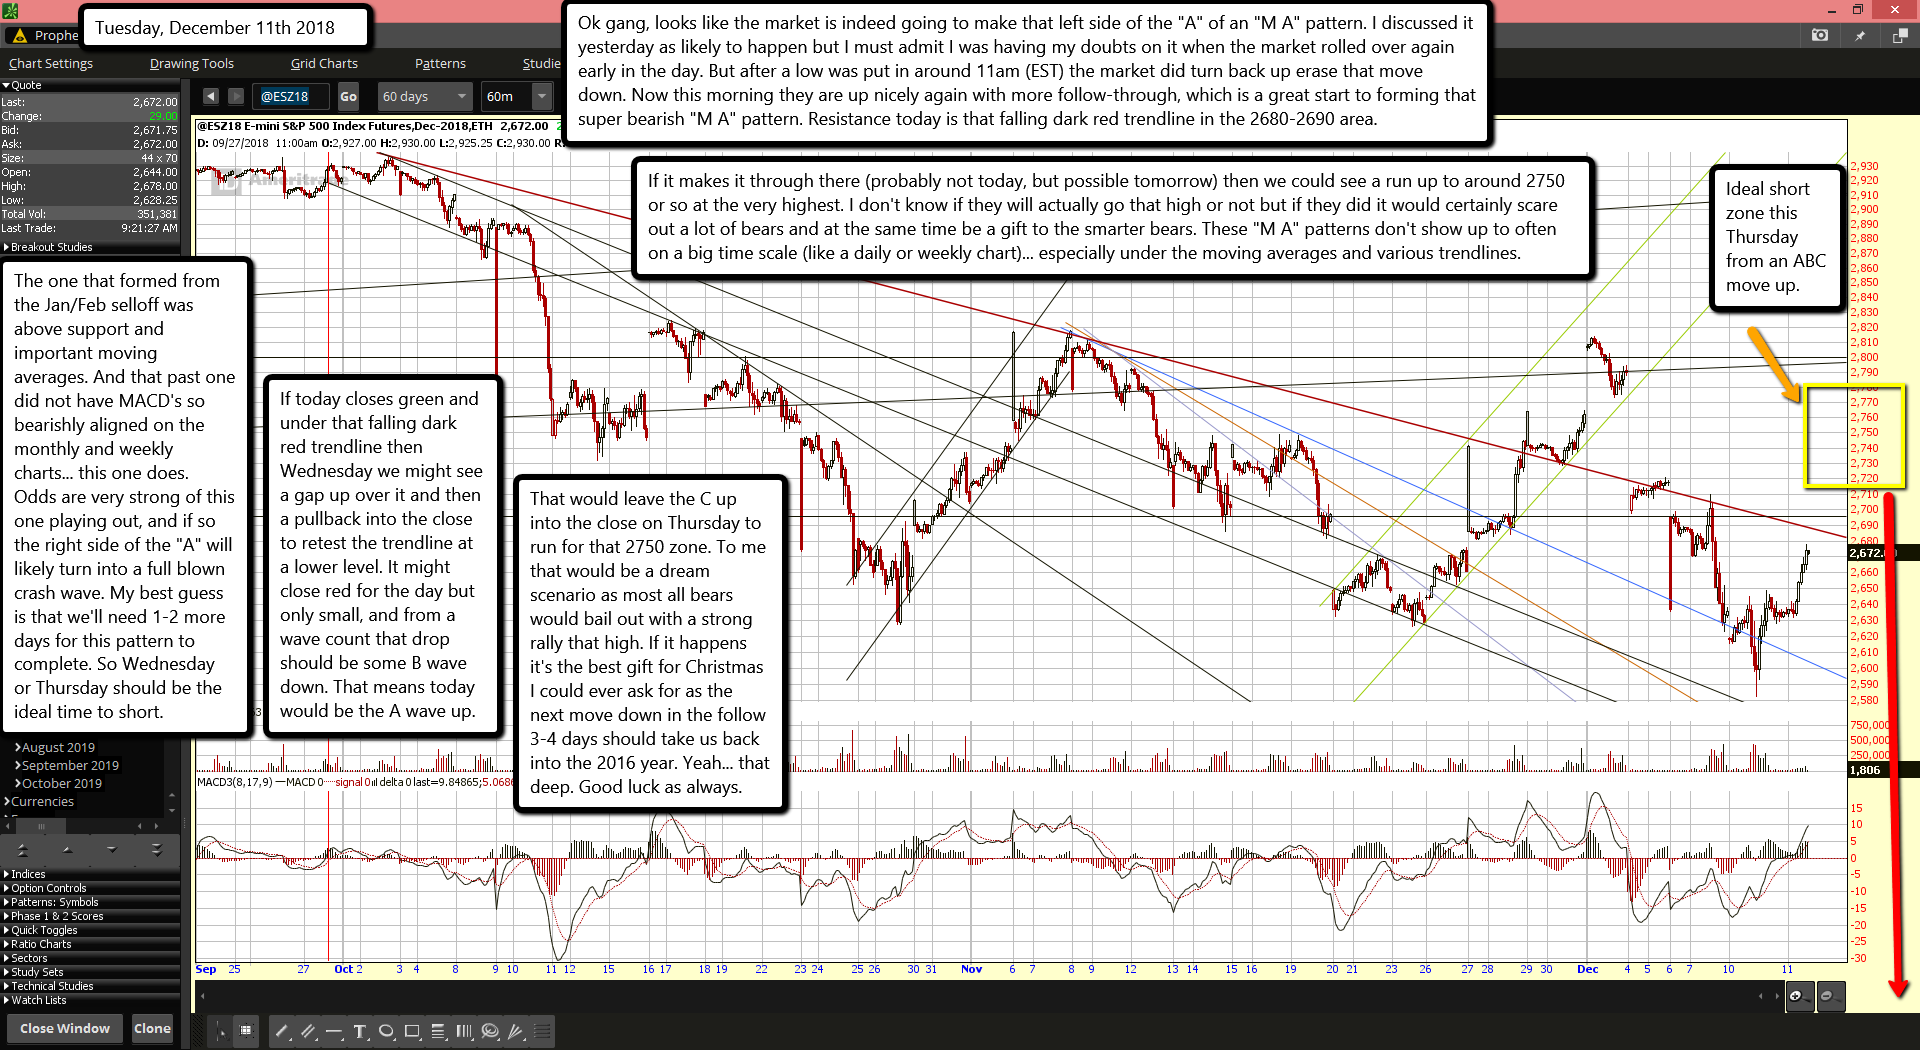
Ok gang, looks like the market is indeed going to make that left side of the "A" of an "M A" pattern. I discussed it yesterday as likely to happen but I must admit I was having my doubts on it when the market rolled over again early in the day. But after a low was put in around 11am (EST) the market did turn back up erase that move down. Now this morning they are up nicely again with more follow-through, which is a great start to forming that super bearish "M A" pattern. Resistance today is that falling dark red trendline in the 2680-2690 area.

If it makes it through there (probably not today, but possible tomorrow) then we could see a run up to around 2750 or so at the very highest. I don't know if they will actually go that high or not but if they did it would certainly scare out a lot of bears and at the same time be a gift to the smarter bears. These "M A" patterns don't show up to often on a big time scale (like a daily or weekly chart)... especially under the moving averages and various trendlines.

The one that formed from the Jan/Feb selloff was above support and important moving averages. And that past one did not have MACD's so bearishly aligned on the monthly and weekly charts... this one does. Odds are very strong of this one playing out, and if so the right side of the "A" will likely turn into a full blown crash wave. My best guess is that we'll need 1-2 more days for this pattern to complete. So Wednesday or Thursday should be the ideal time to short.

If today closes green and under that falling dark red trendline then Wednesday we might see a gap up over it and then a pullback into the close to retest the trendline at a lower level. It might close red for the day but only small, and from a wave count that drop should be some B wave down. That means today would be the A wave up.

That would leave the C up into the close on Thursday to run for that 2750 zone. To me that would be a dream scenario as most all bears would bail out with a strong rally that high. If it happens it's the best gift for Christmas I could ever ask for as the next move down in the follow 3-4 days should take us back into the 2016 year. Yeah... that deep. Good luck as always.

ES Morning Update December 10th 2018

0

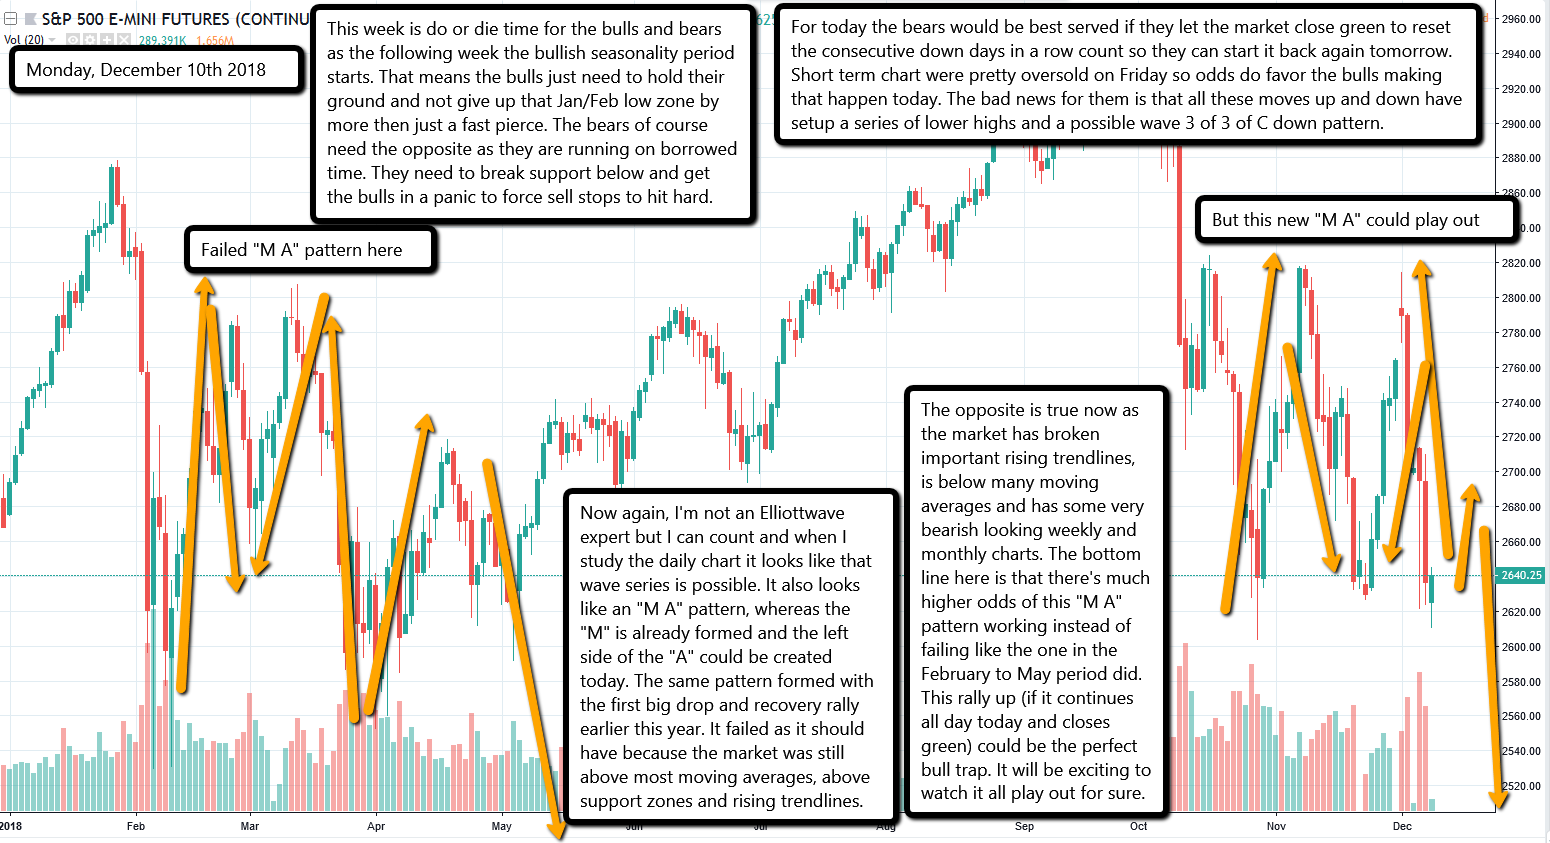
This week is do or die time for the bulls and bears as the following week the bullish seasonality period starts. That means the bulls just need to hold their ground and not give up that Jan/Feb low zone by more then just a fast pierce. The bears of course need the opposite as they are running on borrowed time. They need to break support below and get the bulls in a panic to force sell stops to hit hard.

For today the bears would be best served if they let the market close green to reset the consecutive down days in a row count so they can start it back again tomorrow. Short term chart were pretty oversold on Friday so odds do favor the bulls making that happen today. The bad news for them is that all these moves up and down have setup a series of lower highs and a possible wave 3 of 3 of C down pattern.

Now again, I'm not an Elliottwave expert but I can count and when I study the daily chart it looks like that wave series is possible. It also looks like an "M A" pattern, whereas the "M" is already formed and the left side of the "A" could be created today. The same pattern formed with the first big drop and recovery rally earlier this year. It failed as it should have because the market was still above most moving averages, above support zones and rising trendlines.

The opposite is true now as the market has broken important rising trendlines, is below many moving averages and has some very bearish looking weekly and monthly charts. The bottom line here is that there's much higher odds of this "M A" pattern working instead of failing like the one in the February to May period did. This rally up (if it continues all day today and closes green) could be the perfect bull trap. It will be exciting to watch it all play out for sure.

ES Morning Update December 7th 2018

0

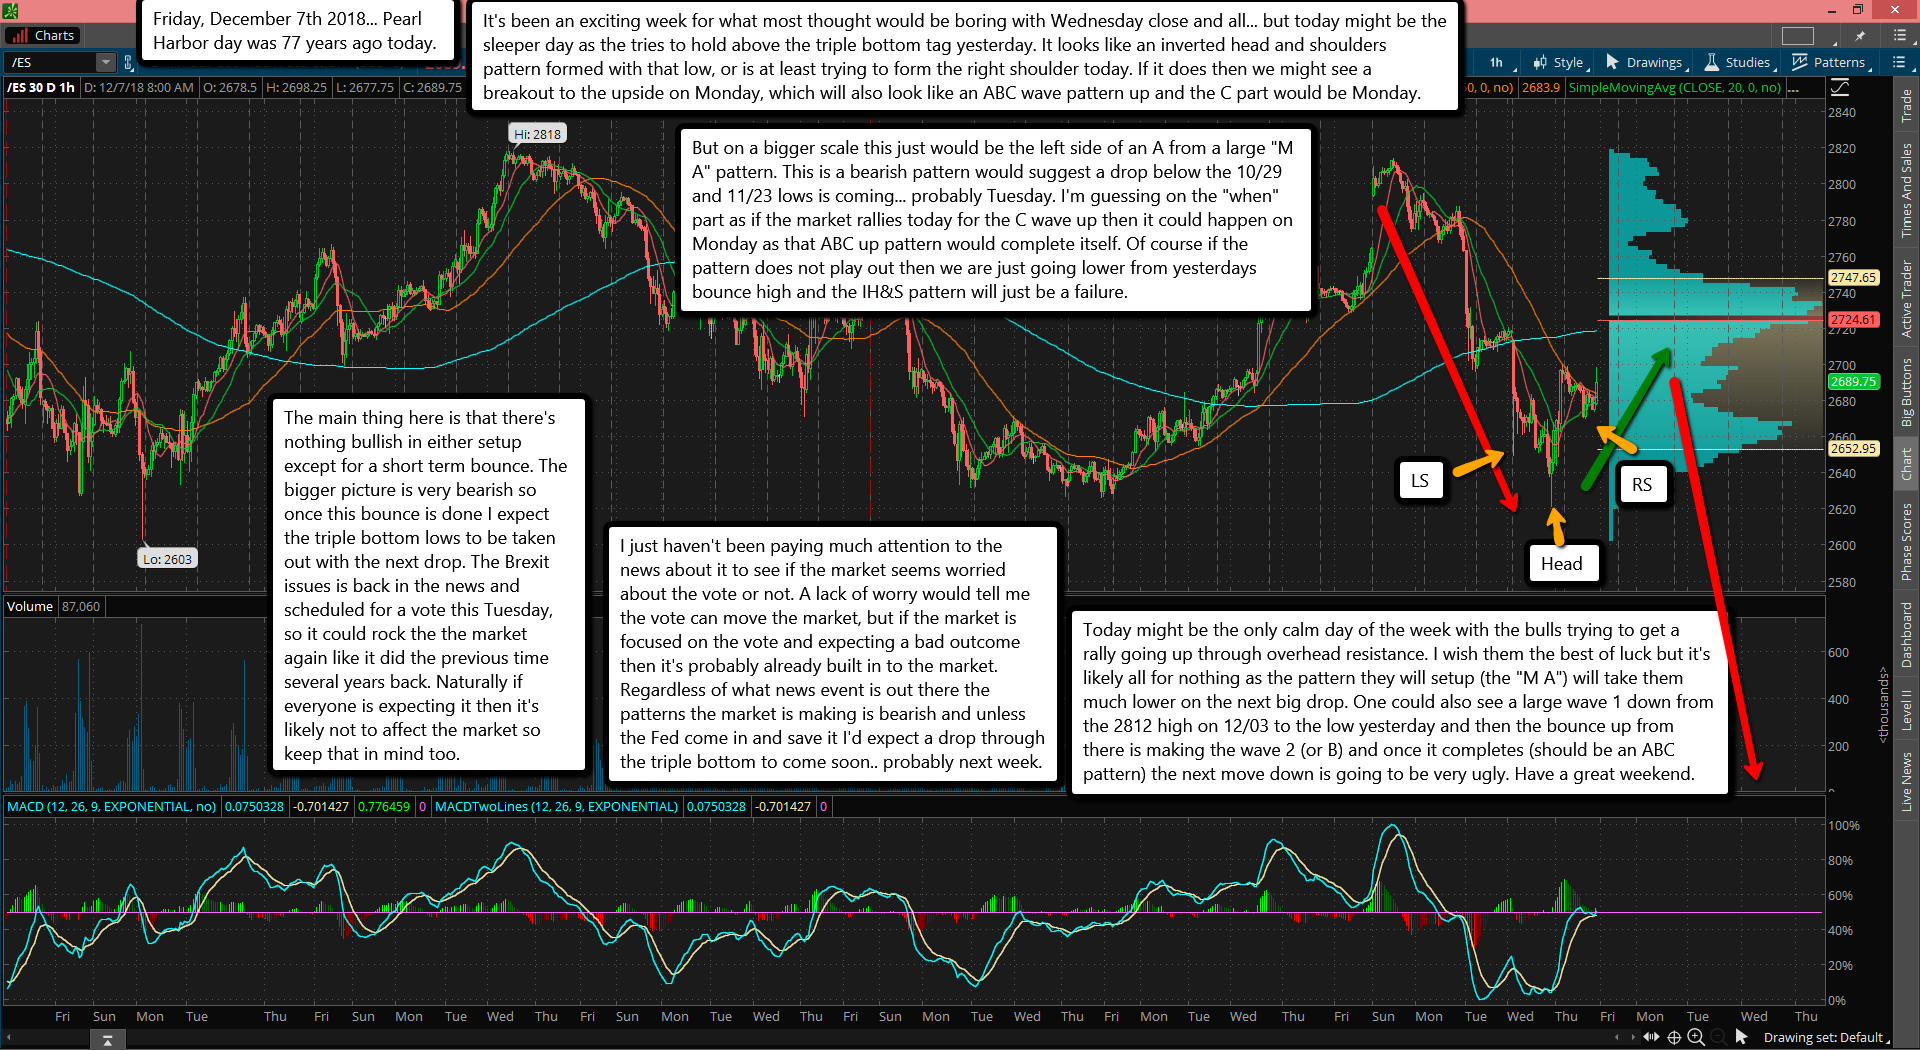
It's been an exciting week for what most thought would be boring with Wednesday close and all... but today might be the sleeper day as the tries to hold above the triple bottom tag yesterday. It looks like an inverted head and shoulders pattern formed with that low, or is at least trying to form the right shoulder today. If it does then we might see a breakout to the upside on Monday, which will also look like an ABC wave pattern up and the C part would be Monday.

But on a bigger scale this just would be the left side of an A from a large "M A" pattern. This is a bearish pattern would suggest a drop below the 10/29 and 11/23 lows is coming... probably Tuesday. I'm guessing on the "when" part as if the market rallies today for the C wave up then it could happen on Monday as that ABC up pattern would complete itself. Of course if the pattern does not play out then we are just going lower from yesterdays bounce high and the IH&S pattern will just be a failure.

The main thing here is that there's nothing bullish in either setup except for a short term bounce. The bigger picture is very bearish so once this bounce is done I expect the triple bottom lows to be taken out with the next drop. The Brexit issues is back in the news and scheduled for a vote this Tuesday, so it could rock the the market again like it did the previous time several years back. Naturally if everyone is expecting it then it's likely not to affect the market so keep that in mind too.

I just haven't been paying much attention to the news about it to see if the market seems worried about the vote or not. A lack of worry would tell me the vote can move the market, but if the market is focused on the vote and expecting a bad outcome then it's probably already built in to the market. Regardless of what news event is out there the patterns the market is making is bearish and unless the Fed come in and save it I'd expect a drop through the triple bottom to come soon.. probably next week.

Today might be the only calm day of the week with the bulls trying to get a rally going up through overhead resistance. I wish them the best of luck but it's likely all for nothing as the pattern they will setup (the "M A") will take them much lower on the next big drop. One could also see a large wave 1 down from the 2812 high on 12/03 to the low yesterday and then the bounce up from there is making the wave 2 (or B) and once it completes (should be an ABC pattern) the next move down is going to be very ugly. Have a great weekend.

ES Morning Update December 6th 2018

2

It's seems that what I wrote yesterday (below) started to happen in the afterhours so I'll just add some additional thoughts this morning. Short term the 60 minute chart is very oversold and due a bounce, but the 6 hour chart has more to go on the down side. We are at support from a falling blue trendline so a bounce back up today could happen. But the bad news (for the bulls) is that this looks like the start of a large wave C down and this first drop this morning in the the futures is likely just the wave 1 down of that C wave. So any wave 2 up bounce is likely to be followed by a wave 3 down (of C down) that should take out the 10/29 lows and 11/23 lows. Bottom line... it's likely to get nasty from here going forward.

Could it be saved? Sure, but that was back in the days when the Fed's were pumping money into the system via QE, and now they are taking money out with QT... along with rising interest rates. Anything is possible here but odds just shifted to the bears with the big drop on Tuesday and this mornings follow-through. As I said below (a post I did yesterday for today) I was looking for this big drop to start on Friday and would have shorted todays close but it fooled me. I wonder how many bears missed it? And more importantly is... I wonder how many bulls are trapped?

Everything below was written Wednesday afternoon (before the drop in the futures)...

Well, got my pullback to the 2700-2720 zone that I was expecting by next week... except it all happened in one day! Crazy market for sure! I was hoping they would hold the market up until Thursday and then tank it but that wasn't to be and instead it dropped 90 points on the SPX in just one day. It's like a wild wild west show in the market right now. So, where do we go from here you ask?

From a technical point of view we have the makings of a nice "W V" pattern with the "W" already formed with the lows on 10/29 and 11/23, and the "V" appears half formed now with the large drop on Tuesday being the left side of it. This "W V" pattern is a bullish pattern and is the opposite of the "M A" pattern that is bearish. What normally happens is once the bottom of the "V" is put in (might already be put in at the low on Tuesday?) the right side of the "V" goes up and takes out the horizontal top area and basically goes the same distance up from that level as it went down.

Meaning that if look at the horizontal top levels of 2823 on 10/17, then 2817 on 11/07, and 2814 on 12/03 you have around 2819 or so as a middle price range. So you take that and subtract the low of the "V" (right now it's at 2696 but it's not confirmed yet as the low of the "V") from that top and you get 123 points or so (2819-2696). Ok, now add that to the 2819 middle area to make the horizontal top of the "W V" pattern to get your upside forecasted target zone of the right side of th "V", or 2942 (2819+123).

That is your upside target if this plays out like a normal "W V" pattern... and it most cases they do indeed play out. We have the normal seasonality pattern of the Santa rally coming soon, and the bullish December month that rare has even seen a crash in it. So what's to worry about then you ask? Just go long and everything will be fine... right? Yeah, the bulls hope so. I can't blame anyone for buying this pullback as it looks "textbook" perfect to me. In fact I'll be looking at a long if we go down small today and close red a little on the DOW (I think it leads the market) with a decent "bottoming tail" on it. Short term charts will support that too as they are quite oversold from Tuesdays 90 point drop on the SPX.

Chart ONE:

Chart TWO:

Chart Three:

So while the current pattern doesn't have to follow the 1987 pattern day by day it could continue, and if it does then a slightly green close is expected Thursday with a long bottoming tail and long topping tail.  That might suggest a rally up to 2740-2760 SPX intraday and down to 2650-2670 on the downside.

Now afterhours the futures tanked to 2650 so that part is possible... let's see what today brings.  While most all of the "MA" bearish patterns and "WV" bullish patterns work and play out normally... what if this one doesn't?  Be prepared for a lot of pain for the bulls.  Maybe one of the FP's I have will play out to the downside afterall?

ES Morning Update December 4th 2018

0

CORRECTION: Yesterday's post for December 3rd was titled improperly for December 1st, 2018.


This morning we see the futures down a little as try to reset the overbought 60 minute chart that was created yesterday with the massive gap up Sunday night. Most likely we'll see the gap filled at some point today and then a float back up with the expected light volume. There was a "possible" FP on the SPY yesterday before the open around 9:21 am, which might be the target high this coming Thursday.

It was for 281.00 and that Sunday night gap up high was 281.38, so the FP is a lower high and plays into my guessing that we'll hit it Thursday by the close and setup Friday for a nice drop. By then the daily chart will be quite overbought and ready to drop for a few days. This coming pullback will be the "tell all" for the bears as if they plan on crashing it that move down will be the start of it.

But they've fumbled the ball many times in the past as they had the highest odds of success back in November. Now that we are in December the odds are greatly reduced. I'm not saying it's not possible but odds are certainly lower now then before. Everyone knows that crashes don't happen in December, and that's been the pattern for decades and decades with the stock market.

So unless something political comes out to shake up the month I'd expect this "possible" crash to get pushed out into the new year. Let's face it, the release of good news and bad news is fully controlled so it can certainly be buried until January.... if they choose to do so? There's a lot going on behind the scenes with Trump and his plans to arrest the criminal cabal with the Clinton's, Bushes, and Obama's at the forefront that we'll never hear about.

And as long as these things aren't brought to the light for us sheep to worry about the market can be saved from that disaster. There's been news out of banks being raided and CEO's stepping down in masses of various high profile companies, but so far that's not be pumped by the main stream media as dangerous for the market.

But if that stuff is ever put out there in focus this market will panic. It seems to be under control for now, and I'd guess that was Trump and his team that is keeping it under wraps. The big worry is the ripple effect of the derivatives that the elite created back in the 1980's to setup a full collapse at some point in the future when they were ready.

It will devastate the market and put us into another great depression if it triggers. But can Trump stop them from collapsing it? Clearly he's in a battle against these satanists and seems to winning right now. However, I'm puzzled as to why he's allowing the Fed to raise interest rates and do QT (quantitative tightening) at the same time when the stock market is so overbought.

It's a recipe for disaster... especially if what I talked about in yesterdays post happens in the public eye. Mass arrests of these people can cause them to panic and sell, sell, sell... which might not normally affect the market but many of these criminals are heads of large tech companies (like Apple, Google and Facebook) and others at large banks. It's a shit storm waiting to explode!

Anyway, for now I'm just looking short term and that suggests a light pullback today and a drift up higher in the 281.00 FP by the close on Thursday where I think we'll peak out on this first wave up from the 11/23 low. From there I'd expect a drop into the 2700-2720 zone next week and then a final push up into the end of the year toward 286 SPY zone.

This all assumes any crash it put on hold until after the holidays, and it's looking like that's the plan as if it wasn't the plan then Trump would not have agreed to a 90 hold on Tariffs this past weekend. That agreement caused the 40-50 point rally in the futures and saved the market from a technical breakdown that was expected to happen this week.

But this isn't "uncommon" as we've seen the market get a last minute save time after time in other past similar situations. It's not viewed as healthy in their opinion to let a market naturally correct and instead they keep pumping the bull full of steroids, then cocaine, and crack until he finally crashes... which is of course not health for the people but seems to always benefit the insiders that caused as they come in and buy up everything at extremely oversold levels from the poor sheep in panic mode.

It's happened in the past many times and will happen again. Trump seems to be trying to stop it and maybe he will... don't know? If so then I'd just expect a mild recession next year instead of another great depression like the elite planned. The battle between good and evil rages on it seems...

ES Morning Update December 1st 2018

1

The futures are up big this morning as they celebrate the trade tariffs deal getting put on ice for 90 days. As you can see on this chart they are still in a nice rising channel. I expect them to take out the prior highs on 11/07 of 2841 by tomorrow, where I'll then look for a short setup. Today looks very similar to 10/01/1987, where tomorrow would but in the top on this 2 week rally with a spinning top candle pattern and green close (10/02/1987). Since we are now closed this Wednesday

I'd put the odds of a second spinning top pattern (which closes red) at 50/50, so it might not happen at all? It was the 10/05/1987 pattern I'm speaking of. If all continues to follow that prior period then this Thursday should be like 10/06/1987. Of course this could all be pushed out a day as patterns rarely follow exactly. But they do have a similar theme. For that theme back then there was the top on 8/25 which put in a low on 9/8, then bounced up into 9/14 for the first lower high.

Then back down again for the double bottom on 9/22 (slightly lower low), followed by a second rally back up into 9/23 to "almost" a double top of the first bounce into 9/14, and a smaller drop again into 9/25 before turning back up to rally up into 10/02 where it took out those two prior highs. From there it rollover over and crashed.

Today's pattern is similar where we topped on 10/03/2018 and dropped into a 10/29 low that was followed by a bounce to 11/07, then another drop for a double bottom (high low) and another rally back up to 12/03 (today) where are going to open with a double top of the prior bounce high on 11/07. If this continues to follow that prior pattern in 1987 then by tomorrow we should take out these prior highs and put in some kind of topping tail. From there (starting Thursday) we should be in the pattern similar to 10/06/87 to 10/29/87.

Yeah, there's never been a crash in December... I get it. But we've never had such a shake up in our government either. This "draining the swamp" that Trump is doing has never been done before in the history of our country. Trump plans to arrest a massive amount of criminals with Hillary at company at the top of his list. He's already cleaned up the Judges, and many banksters have stepped down to retire... as well as many top company CEO's. Why? Because they are dirty and they know it's just a matter of time before Trump finds them and those them behind bars where they belong.

The "shake up" that's about to come is going to be historic. What most people don't understand is that all these criminals had protection from the Clintons, Obama's, and Bushes. And the top dog of all of them was none other then George H. Bush... who just died. He protected them all by using his power to seal documents by making them classified. These are documents that Trump has likely had since he took office. The military has been collecting evidence for years now and was just waiting for the right president that could be trusted to enforce the law and go arrest these pedofiles and satanist.

Trump is just the man for the job, but there's one big problem... most of the evidence can't be used in court against them due to it being classified. That all changes now that Bush died as all of those document cease to maintain that "classified" status with his death.

This is why Trump was working so hard on clearing out the corrupt Supreme Court Judges as he's know he'll get to arrest these people after those documents are available... which they now are with the death of GHW Bush. It's a time to celebrate this Wednesday if you are a patriotic American as the death of that murdering satanist opens the path for Trump to do mass arrests now.

It's why he immediately scheduled the Senate to a meeting this Wednesday to start the process of showing the evidence so he can arrest them ASAP. You may not think this is going to affect the stock market but I beg to differ. I expect a full blown crash as thousand of panicked minions sell all their assets and try to flew the country. The banksters will be trying to burn the evidence at midnight via some shredding machine in their office.

But it's too late as Trump already has the means to charge them and throw them in jail. He's now go fair and honest Judges, and "un-classified" proof now that old man Bush died. It's a matter of days to weeks in my opinion before the shit hits the fan as criminals panic. When heads of major banks step down, retired, flea the country... and/or their financial records come out, there's going to be major turmoil in the stock market.

It's the perfect storm as the market is already in what chartists will call a large B wave up of some degree with a large C down down expected to follow afterwards. This C wave down will not just go to the 2400 SPX area (+/- 100 points) as most expect but will end up be a full blown crash... possibly another depression? Too early to tell on that one but it's possible. Anyway, enough about that... good luck to bulls and bears alike.

ES Morning Update November 30th 2018

0

Yesterday worked out perfectly to match up with 10/02/1987. Today needs a similar close but we need to be green instead of red. That should setup the next big move down as early as Monday. Now, there is another possibility and that's one where the pattern delays by one day... meaning we have a third "spinning top" (doji) type close on Monday (mainly due to the G20 event) and then we start back down hard on Tuesday. So let's keep that in mind as a possibility for those wanting to short at the close today. Patterns rarely match exactly... day for day, so a one day delay could happen.

Now let's break this down into a wave count as well. It's a possible wave count as again I'm not an Elliottwave guru. I'm going to use labels that make sense to me so don't hold that against me as again I'm not an expert on this. The September 21st, 2018 top to the October 29th low is what I'm calling a "Super Large A Wave" down. It broke-down into 5 "Large Waves" which you can figure out for yourself as it's not that important right now. Of course some of those waves broke-down into "Medium Waves" and then "Small Waves", etc... you get the picture.

Let's just start at the bottom of this "Super Large A Wave" down and go from there. The "Super Large B Wave" appears to have topped at on 11/07 at 2815 SPX. Then the "Super Large C Wave" down started. It bottomed at 2631.09 on 11/23, which I'm calling the "Large Wave 1" down inside the "Super Large C Wave" down. From there we started a "Large Wave 2" up, and it may or may not be completed yet? I think it topped with the intraday high of 2753.75 on 11/29 (yesterday).

Here's how I think it broke-down. We had a "Medium Wave A" up (inside "Large Wave 2" up) from that 2631.09 low (11/23) to a 2674.35 high (11/24), then a "Medium Wave B" down into the next morning hitting a low of 2655.89 on 11/27. Yeah, it's a small pullback but it's all I can figure out. The "Medium Wave A" up broke-down into 5 smaller waves from what I can tell on the 10 minute chart. Anyway, the "Medium Wave C" up started from that low and also broke-down into 5 smaller waves... which I think ended with the 2753.75 high yesterday.

So, from 2661.94 on 11/27 to the intraday 2679.05 high you have a "Small Wave 1" up, then "Small Wave 2" down into 2664.41 in the afternoon that day. From there we started the "Small Wave 3" up (inside "Medium Wave C" up, inside "Large Wave 2" up) that seemed to also breakdown again into smaller waves. That first wave up ended at the open on 11/28 at 2697.69, then "Tiny Wave 2" down intraday to 2684.34, where we then started "Tiny Wave 3" up (inside "Small Wave 3" up, inside "Medium Wave C" up, inside "Large Wave 2" up). That was of course the big squeeze wave on the bears that hurt like hell for those caught short.

The "Tiny Wave 3" up seems to have topped at 2744.00 going into the close that day (11/28) and then the "Tiny Wave 4" down hit an intraday low of 2722.94 on 11/29. Then the "Tiny Wave 5" up hit a high of 2753.75 later that afternoon. That should end "Tiny Wave 5" up (inside "Small Wave 3" up, inside "Medium Wave C" up, inside "Large Wave 2" up). It leaves "Small Wave 4" down for today, then "Small Wave 5" up for Monday to complete "Medium Wave C" up inside "Large Wave 2" up... inside "Super Large Wave C" down.

So (if this wave count is correct?) this sets up Tuesday to start "Large Wave 3" down of "Super Large Wave C" down. Naturally it should subdivide into 5 smaller waves (the "Medium", "Small" and "Tiny" ones) but when you get them all aligned together in some wave 3's of C's you have the makings of a crash wave. So while everyone still see's this December as being bullish the wave counts do not agree. Yeah, I guess they could do a whole lot of chop to delay this count until January but I really don't see that as possible.

This multi-combination of wave 3's and wave C's down is likely to happen in the month of December... so bulls beware. You've been saved in the past by the Fed's and their low internet rates and constant buying of the market via QE, but now we have rising interest rates and the Fed withdrawing money via QT. I'm sorry but that doesn't look too me like the typical safety net the bulls are used too. Call me crazy but I still see a crash wave coming this December.

ES Morning Update November 29th 2018

0

Ok, the bulls put a whipping on the bears yesterday with a huge squeeze up. While I was expecting some light volume float higher I didn't expect it to rally so much. But all is fine as it's playing into the perfect bearish setup for this coming Friday. Basically today would need to pullback some (can also go higher some first) and then close about flat... aka, the "spinning top" candle pattern. Then do the same on Friday and we have a chart pattern similar to 1987 where yesterday was like 10/01/1987, today like 10/02/1987 and Friday like 10/05/1987.

The bears need to hold the bulls back here and not give up much more ground. The prior highs of 2748 on 11/14/2018 and 11/19/2018 should be taken out by the bulls but that should only be for stop runs on the bears. A close back below that zone today and Friday is needed in my opinion to keep the similar pattern as in 1987. Failure to do that and the bulls could explode much higher and even catch that holiday season "year end" rally... which might take them to new all time highs. I give this low odds right now as the bulls need to prove themselves first, and so far all I see is a big short squeeze today. The volume on the SPY was certainly up higher but it looked more like bears capitulating then bulls buying. So I'll still look for a top this coming Friday on this bounce and go from there.

s2Member®