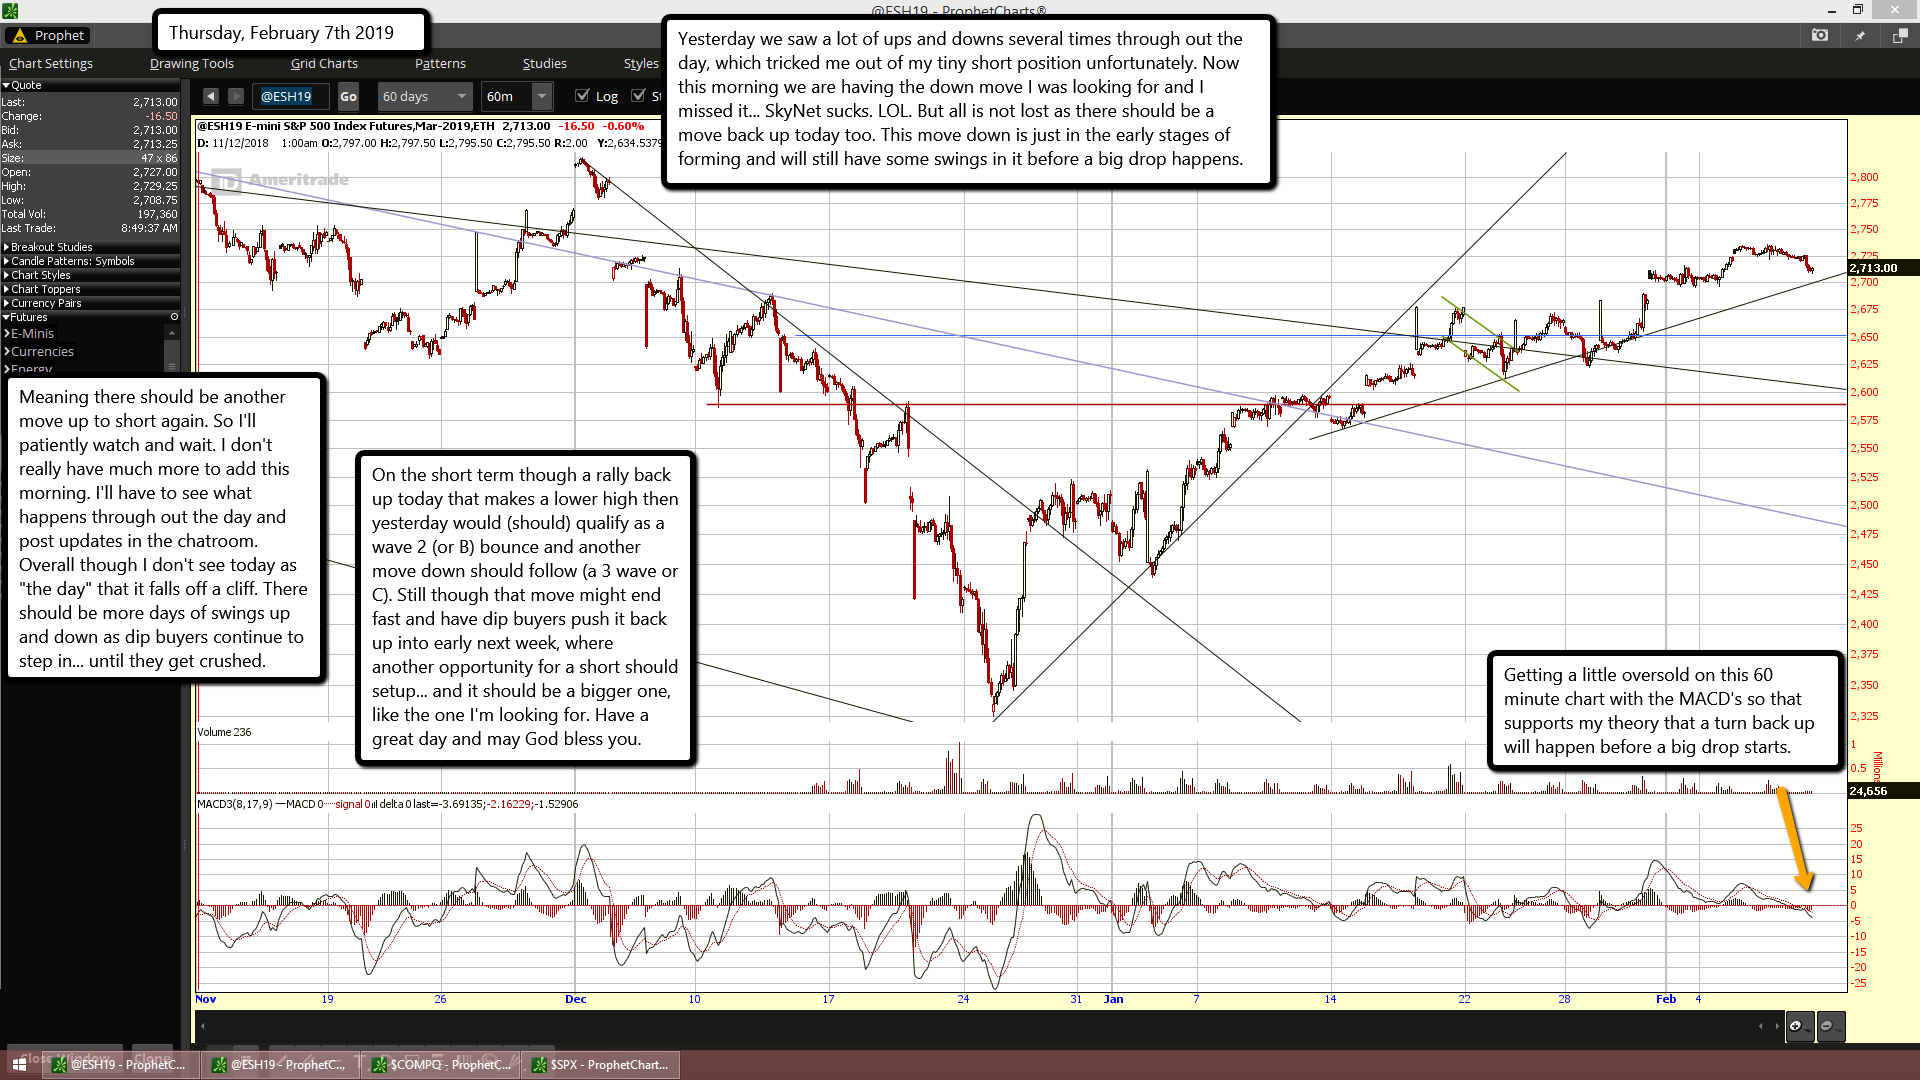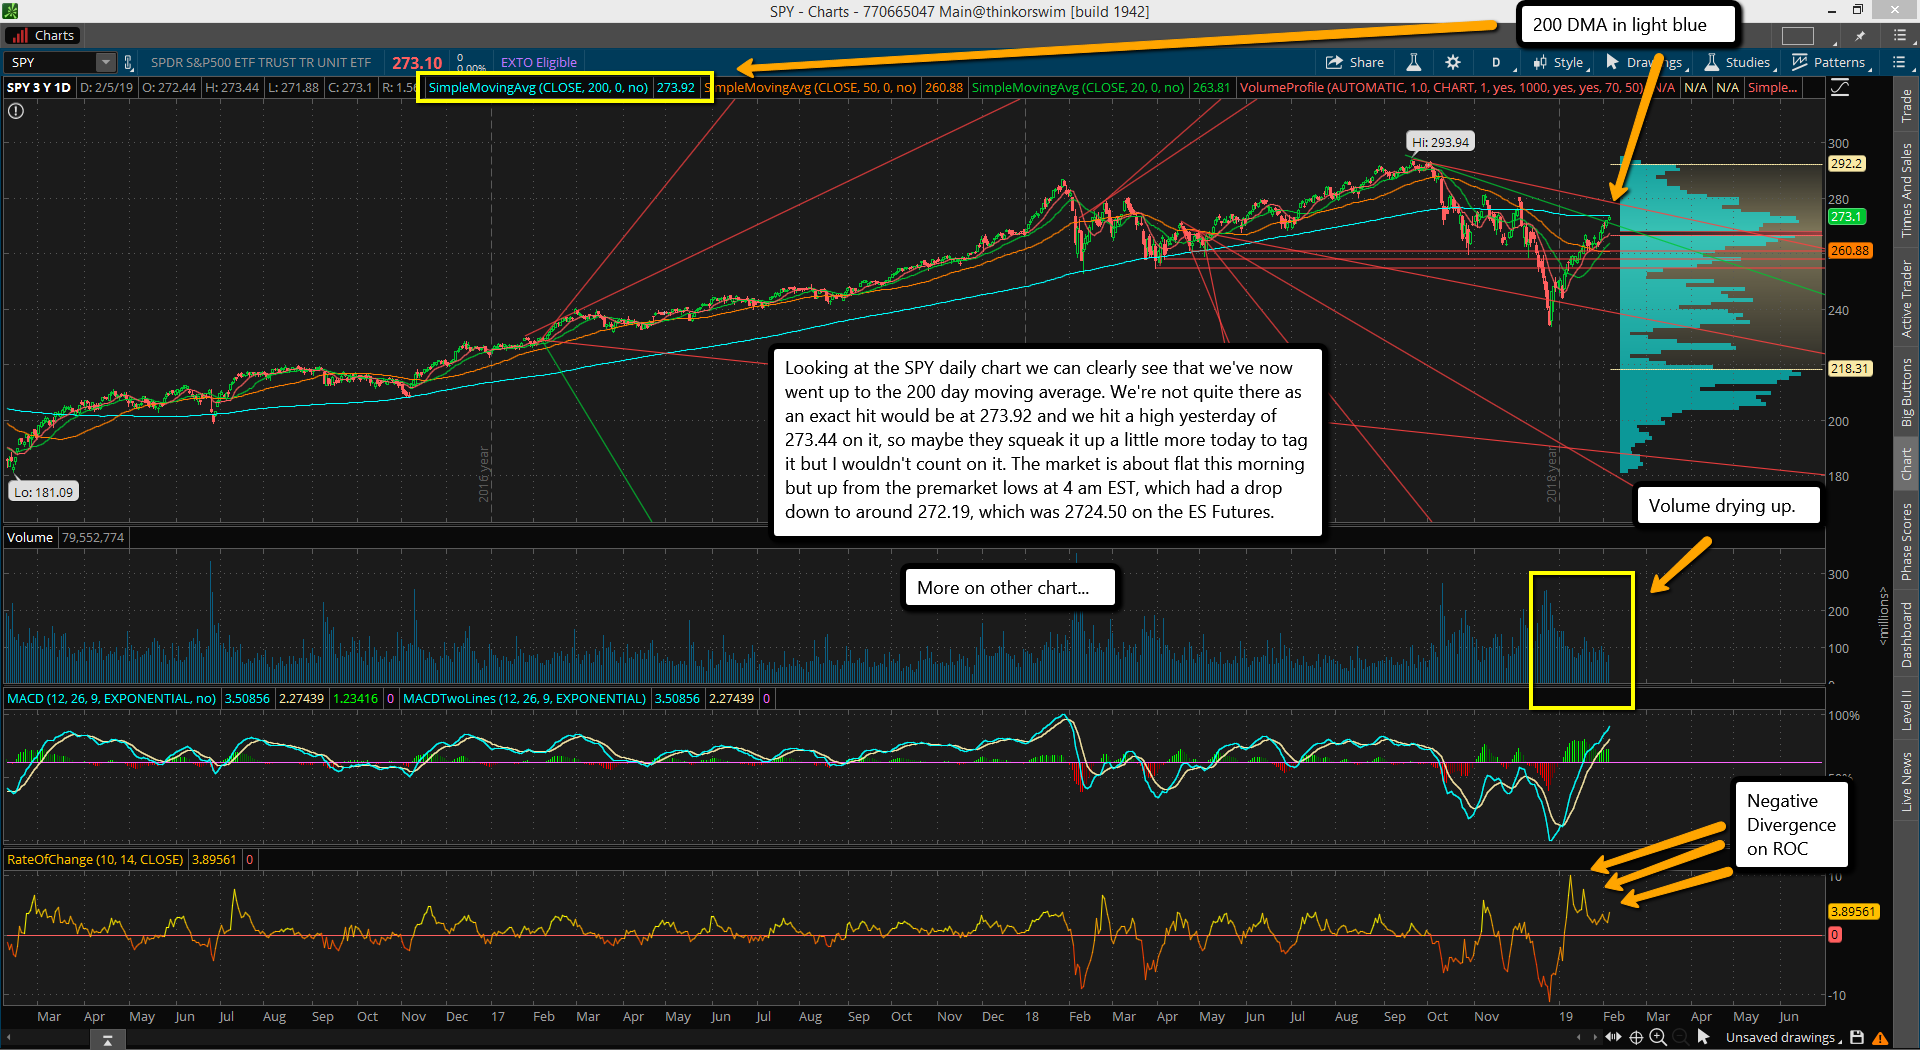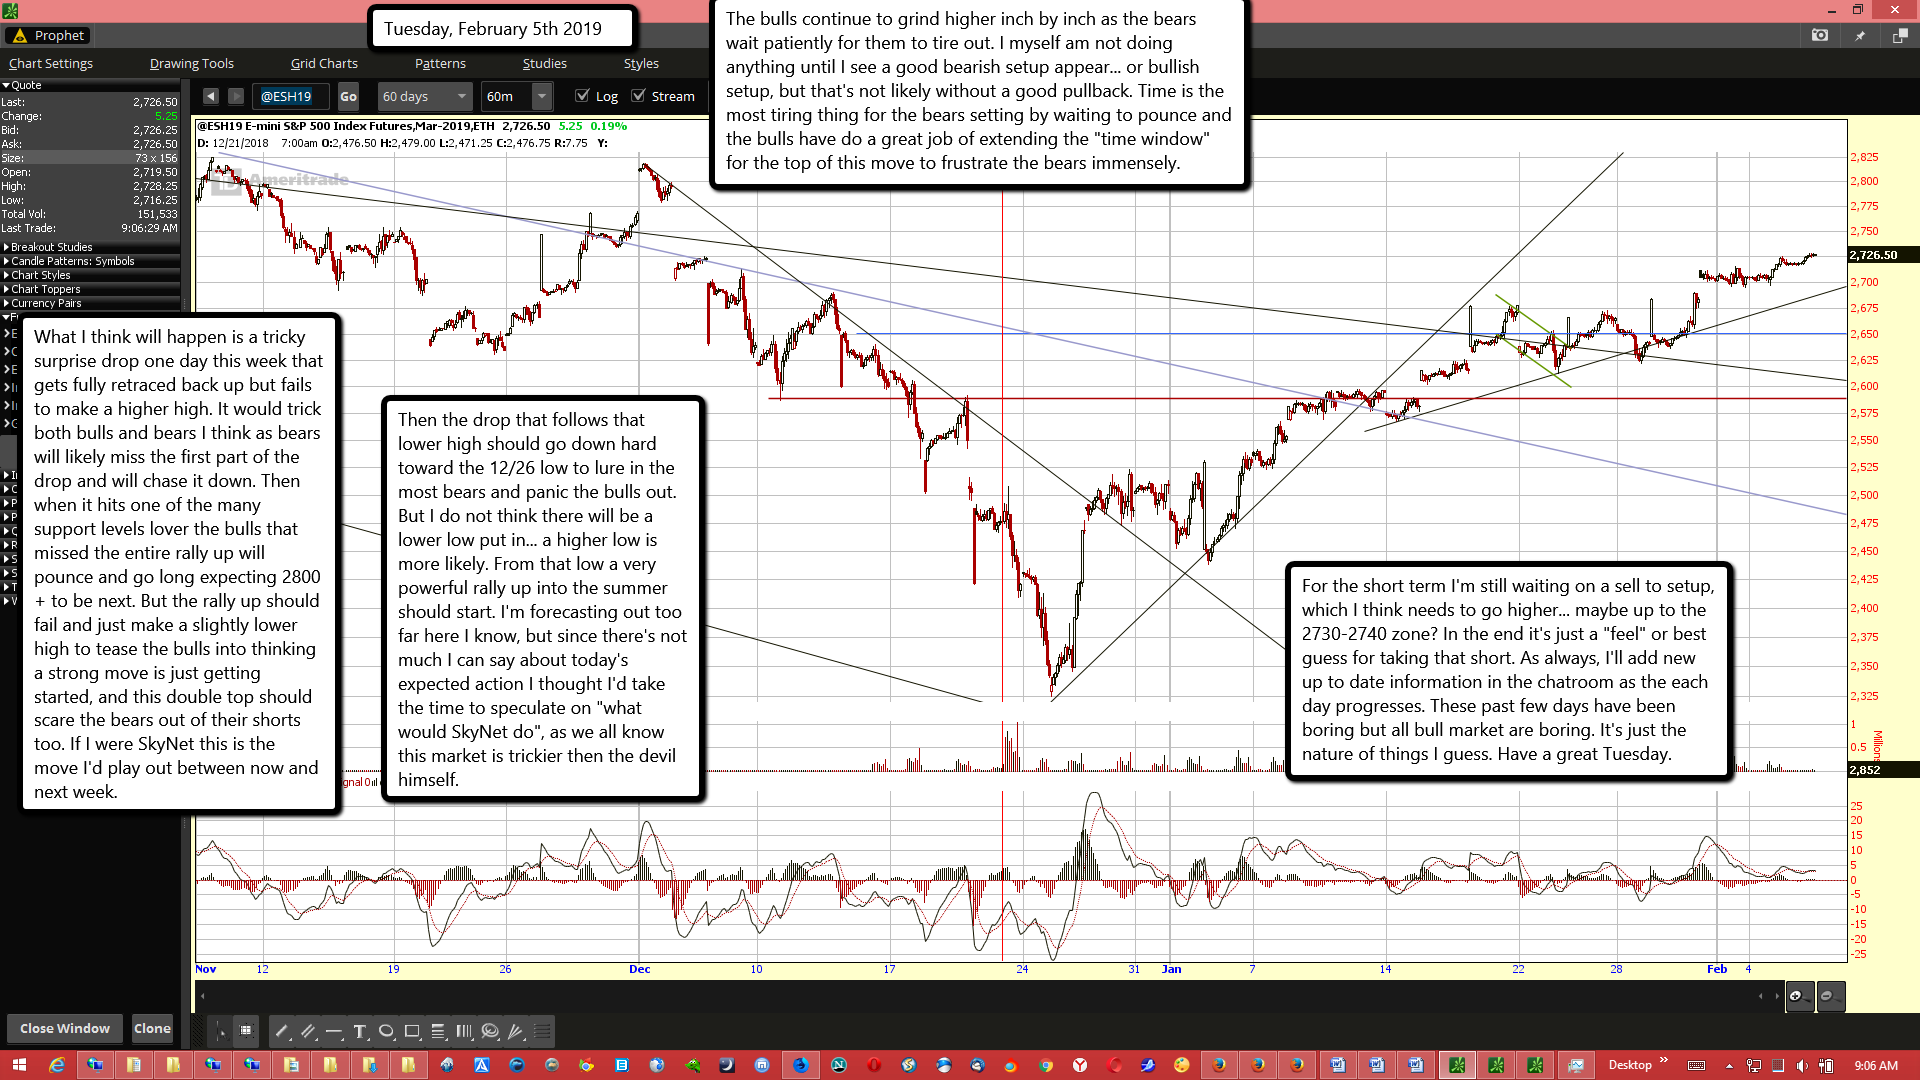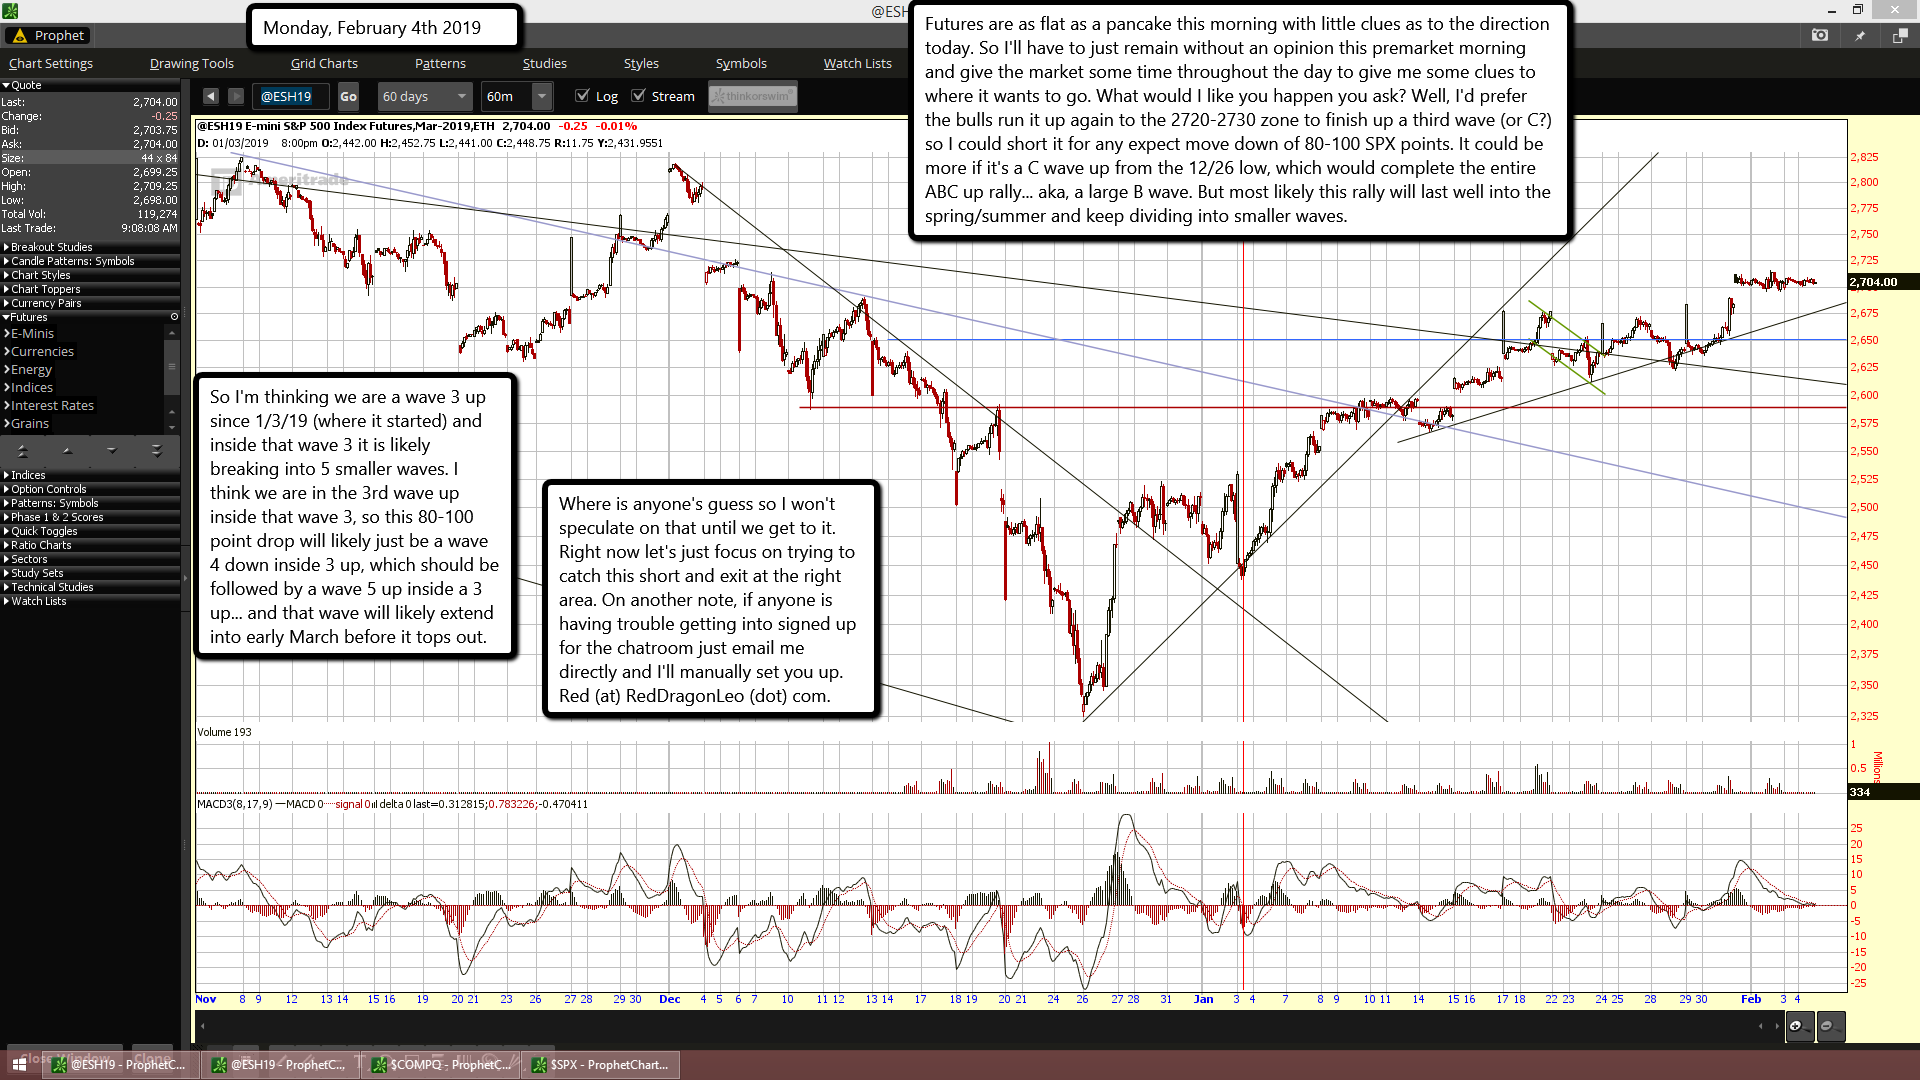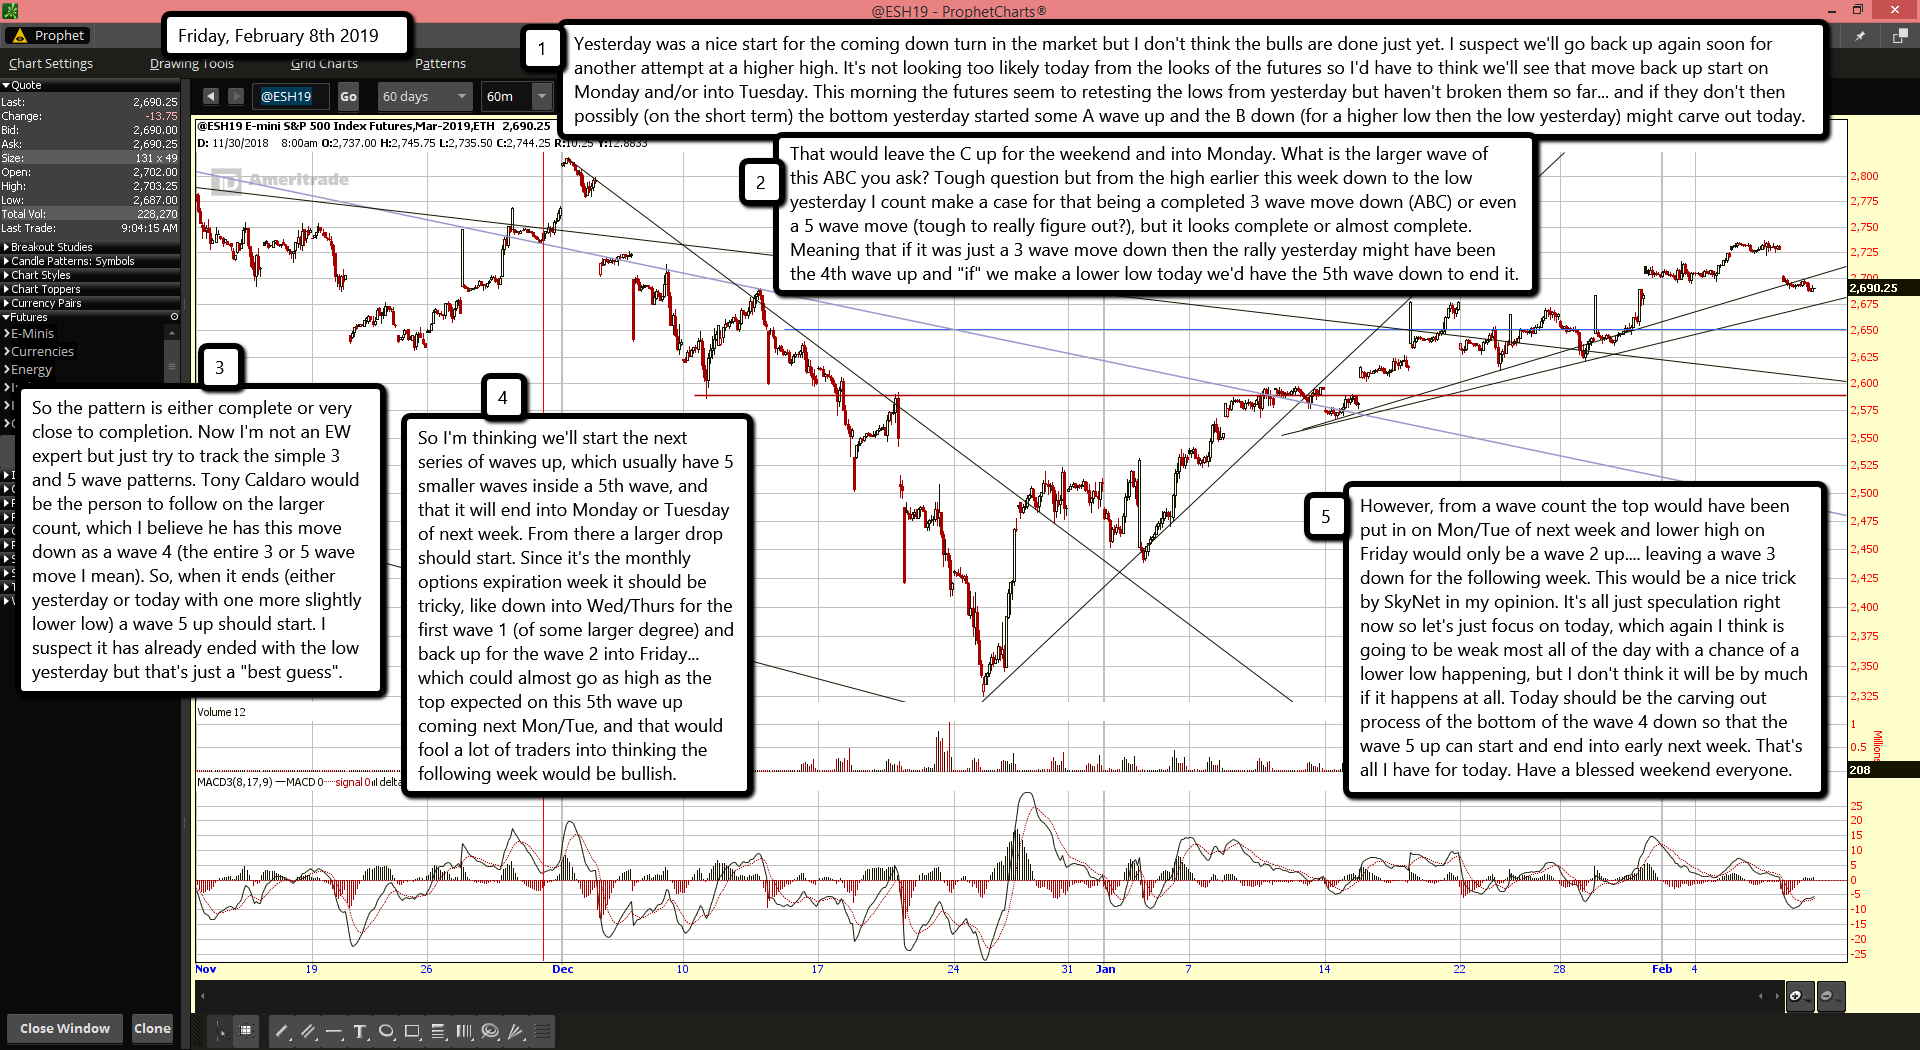
Nothing new to add today that hasn't already been covered. We are waiting on this bull to tire out and stop. The grind looks to be continuing this early premarket morning but not as strong as yesterday, so a top is near. Many are looking for early next week and their target ranges are 2700 up to 2740, which we are in that range already. I guess it will take some surprise news event to get it topped out and reversed. Funny how many times we've seen such releases of news right at critical turning points. You'd almost have to believe in miracles to think that the news is so well aligned... or conspiracy? Nah, it's got to be just a lot of coincidences doesn't it? I'll let you be the judge on that one. Anyway, that's all for now. I'll do new updates throughout the day in the free chatroom if needed. Just a waiting game for now. Have a great weekend.
ES Morning Update January 31st 2019
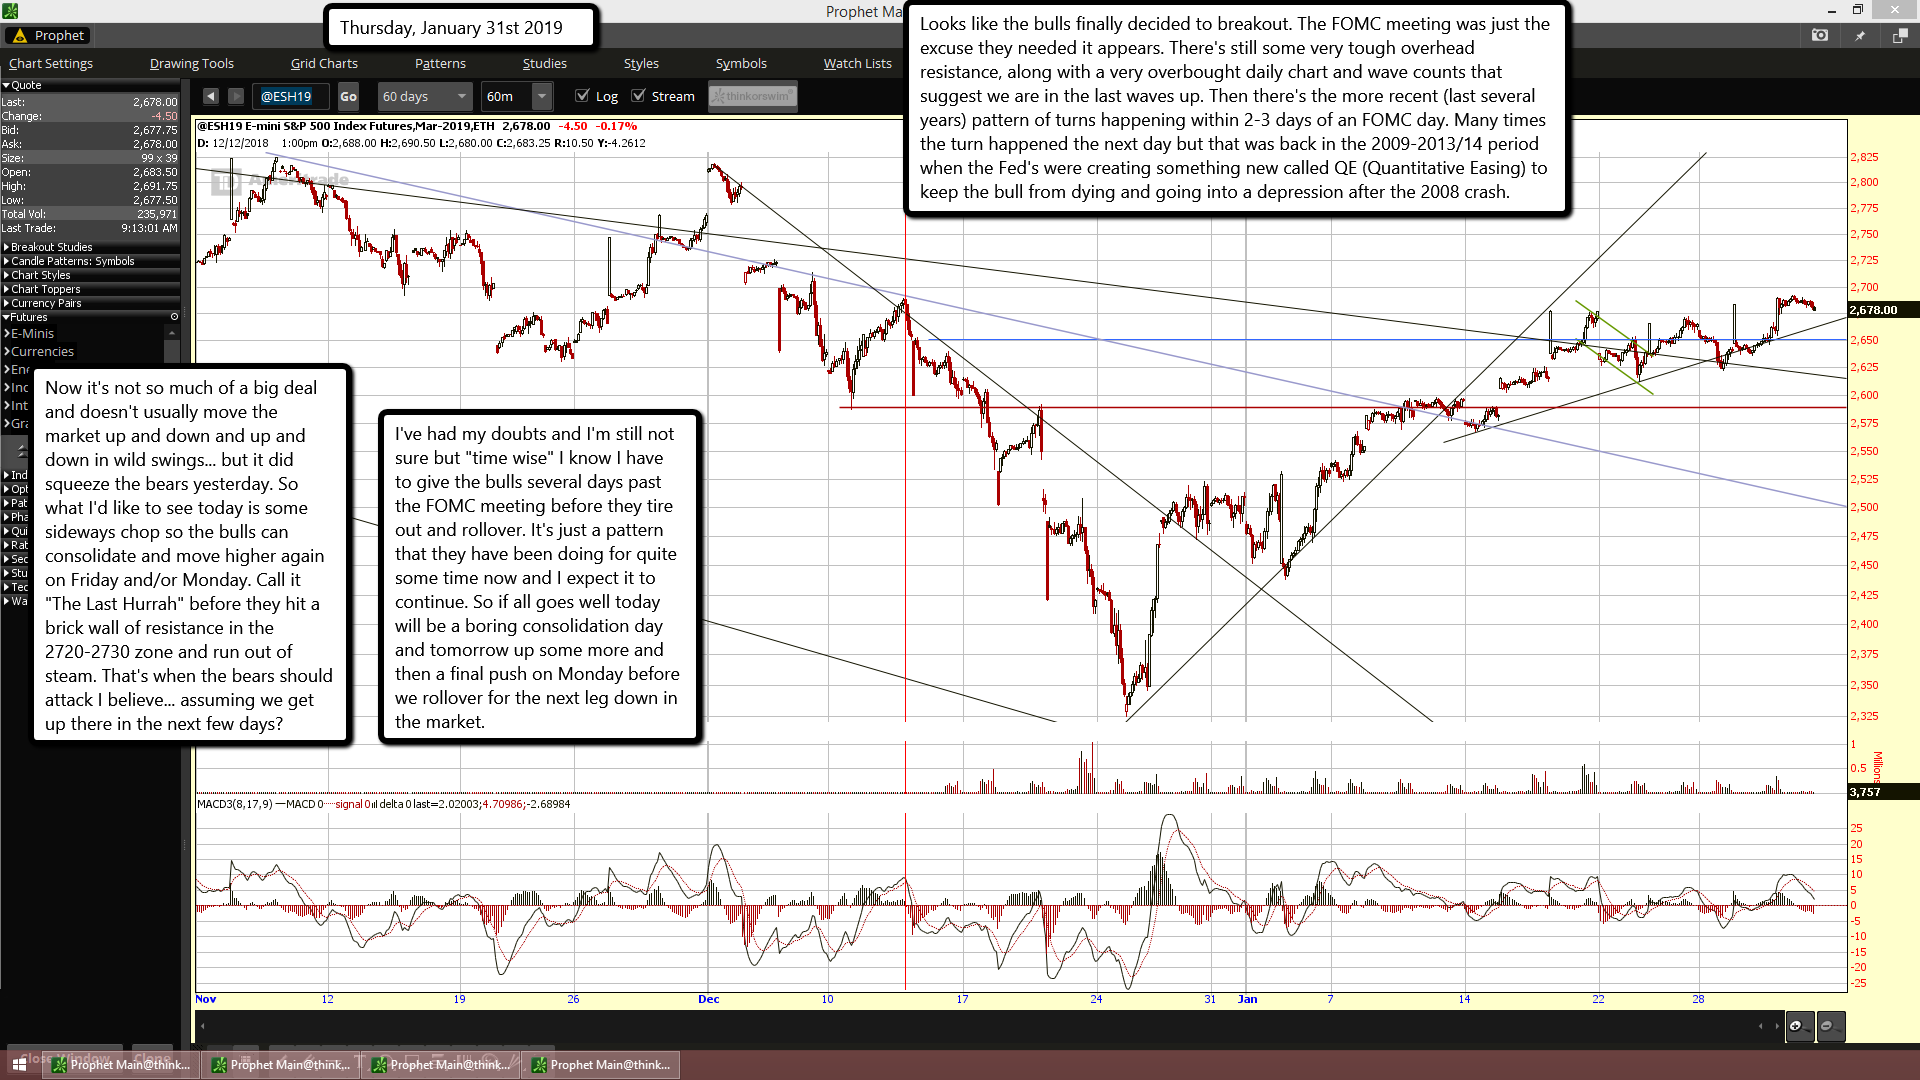
Looks like the bulls finally decided to breakout. The FOMC meeting was just the excuse they needed it appears. There's still some very tough overhead resistance, along with a very overbought daily chart and wave counts that suggest we are in the last waves up. Then there's the more recent (last several years) pattern of turns happening within 2-3 days of an FOMC day. Many times the turn happened the next day but that was back in the 2009-2013/14 period when the Fed's were creating something new called QE (Quantitative Easing) to keep the bull from dying and going into a depression after the 2008 crash.
Now it's not so much of a big deal and doesn't usually move the market up and down and up and down in wild swings... but it did squeeze the bears yesterday. So what I'd like to see today is some sideways chop so the bulls can consolidate and move higher again on Friday and/or Monday. Call it "The Last Hurrah" before they hit a brick wall of resistance in the 2720-2730 zone and run out of steam. That's when the bears should attack I believe... assuming we get up there in the next few days?
I've had my doubts and I'm still not sure but "time wise" I know I have to give the bulls several days past the FOMC meeting before they tire out and rollover. It's just a pattern that they have been doing for quite some time now and I expect it to continue. So if all goes well today will be a boring consolidation day and tomorrow up some more and then a final push on Monday before we rollover for the next leg down in the market.
ES Morning Update January 30th 2019
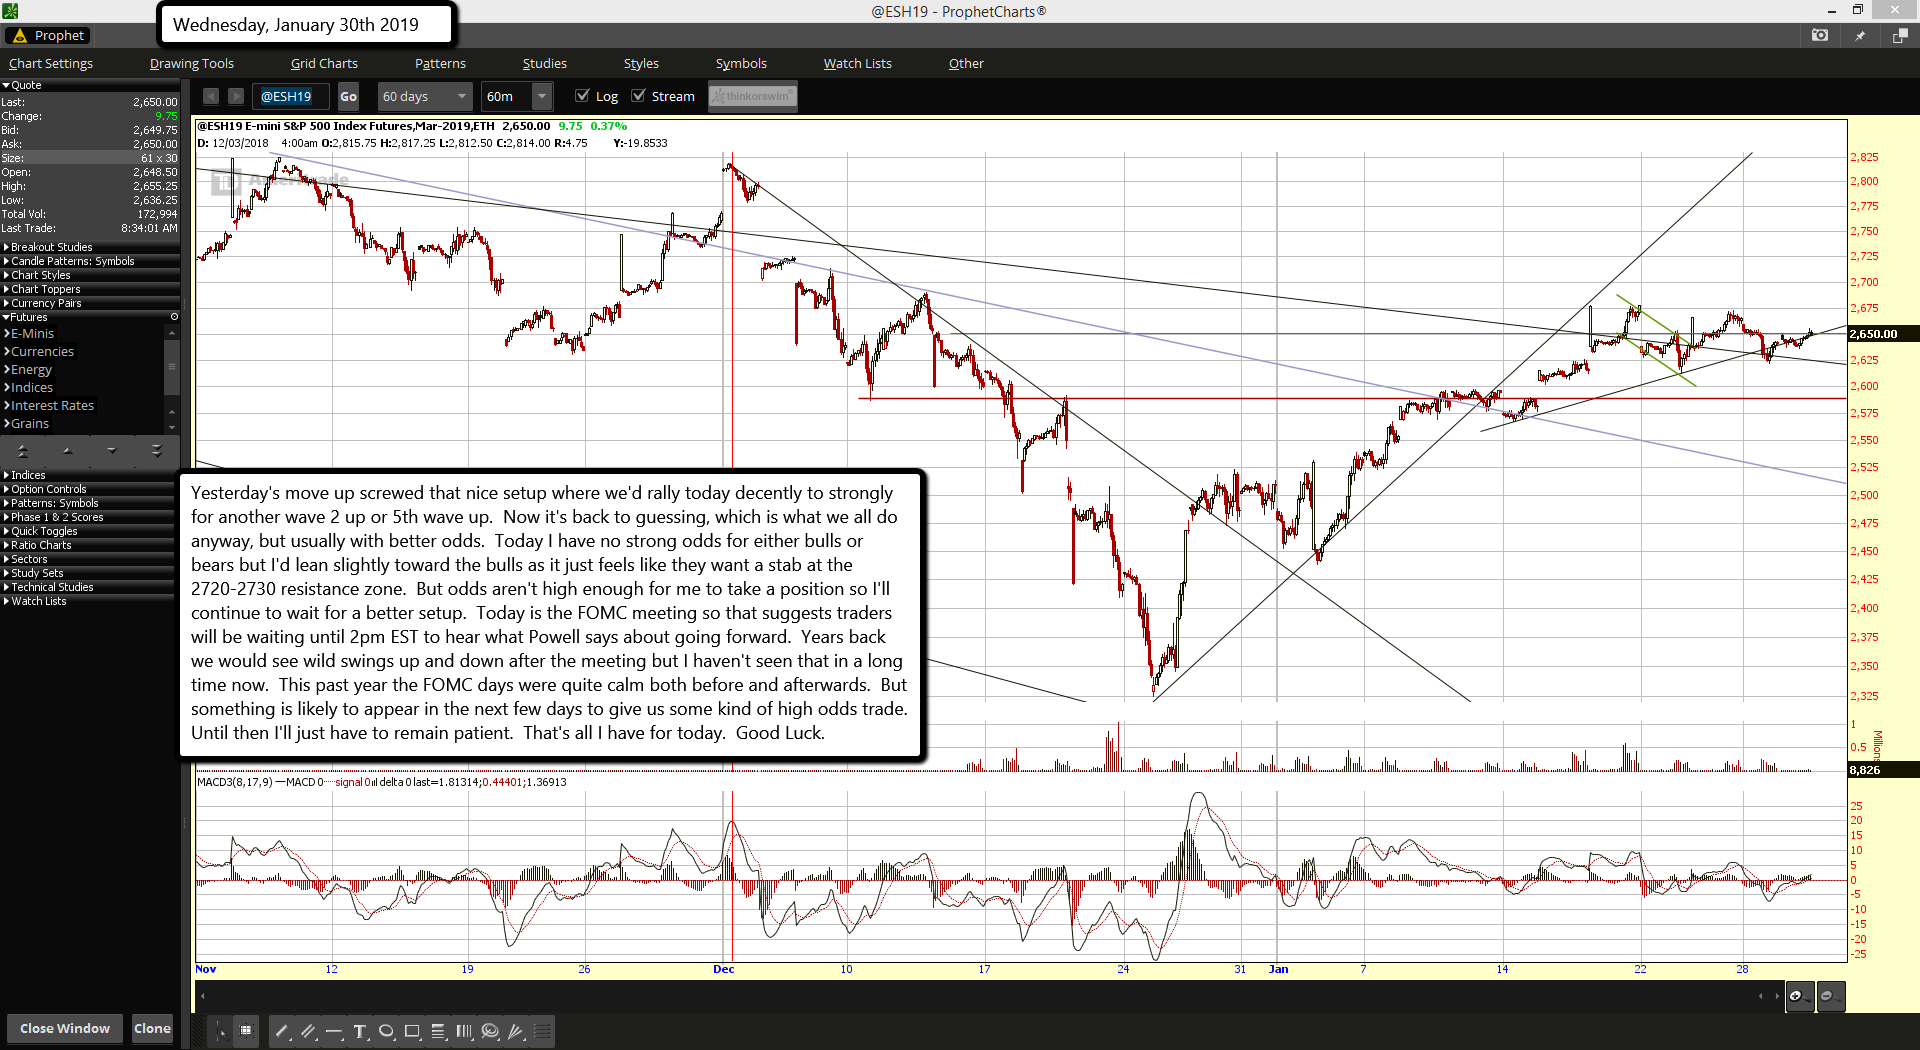
Yesterday's move up screwed that nice setup where we'd rally today decently to strongly for another wave 2 up or 5th wave up. Now it's back to guessing, which is what we all do anyway, but usually with better odds. Today I have no strong odds for either bulls or bears but I'd lean slightly toward the bulls as it just feels like they want a stab at the 2720-2730 resistance zone. But odds aren't high enough for me to take a position so I'll continue to wait for a better setup. Today is the FOMC meeting so that suggests traders will be waiting until 2pm EST to hear what Powell says about going forward. Years back we would see wild swings up and down after the meeting but I haven't seen that in a long time now. This past year the FOMC days were quite calm both before and afterwards. But something is likely to appear in the next few days to give us some kind of high odds trade. Until then I'll just have to remain patient. That's all I have for today. Good Luck.
ES Morning Update January 29th 2019
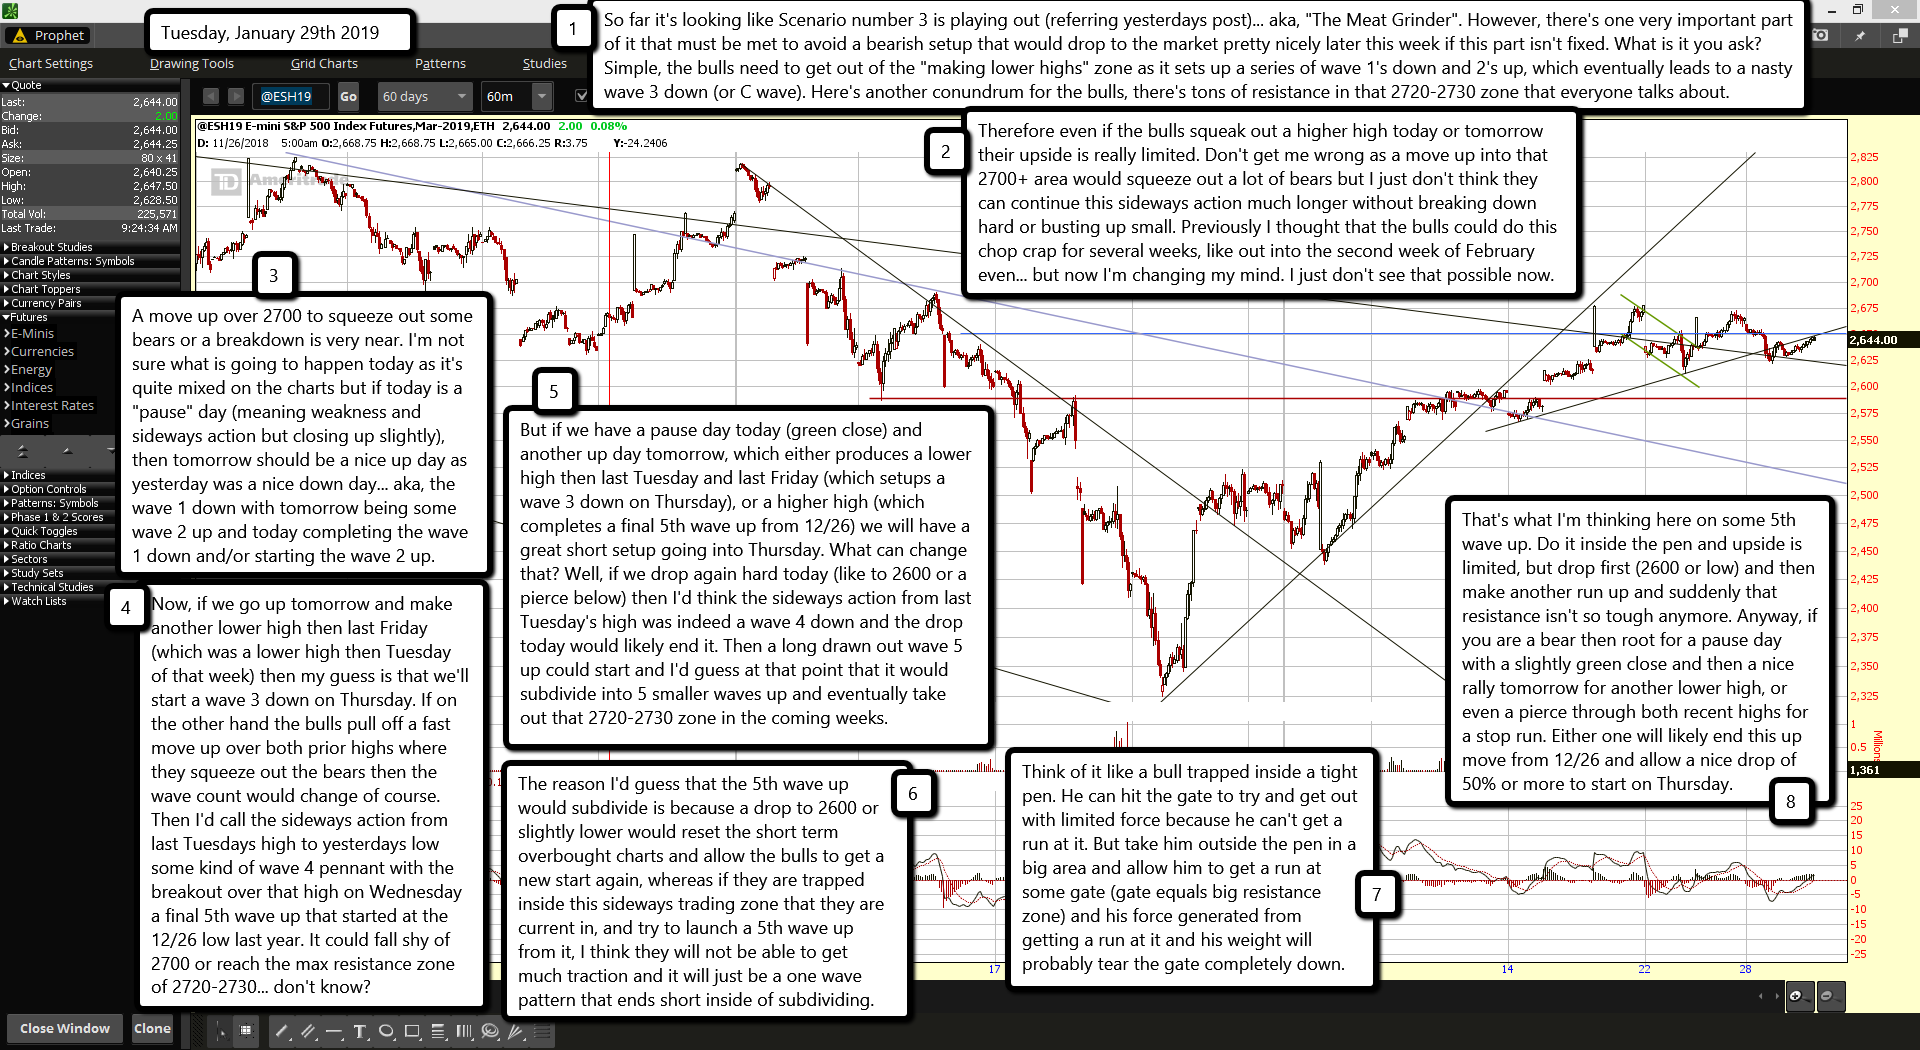
So far it's looking like Scenario number 3 is playing out (referring yesterdays post)... aka, "The Meat Grinder". However, there's one very important part of it that must be met to avoid a bearish setup that would drop to the market pretty nicely later this week if this part isn't fixed. What is it you ask? Simple, the bulls need to get out of the "making lower highs" zone as it sets up a series of wave 1's down and 2's up, which eventually leads to a nasty wave 3 down (or C wave). Here's another conundrum for the bulls, there's tons of resistance in that 2720-2730 zone that everyone talks about.
Therefore even if the bulls squeak out a higher high today or tomorrow their upside is really limited. Don't get me wrong as a move up into that 2700+ area would squeeze out a lot of bears but I just don't think they can continue this sideways action much longer without breaking down hard or busting up small. Previously I thought that the bulls could do this chop crap for several weeks, like out into the second week of February even... but now I'm changing my mind. I just don't see that possible now.
A move up over 2700 to squeeze out some bears or a breakdown is very near. I'm not sure what is going to happen today as it's quite mixed on the charts but if today is a "pause" day (meaning weakness and sideways action but closing up slightly), then tomorrow should be a nice up day as yesterday was a nice down day... aka, the wave 1 down with tomorrow being some wave 2 up and today completing the wave 1 down and/or starting the wave 2 up.
Now, if we go up tomorrow and make another lower high then last Friday (which was a lower high then Tuesday of that week) then my guess is that we'll start a wave 3 down on Thursday. If on the other hand the bulls pull off a fast move up over both prior highs where they squeeze out the bears then the wave count would change of course. Then I'd call the sideways action from last Tuesdays high to yesterdays low some kind of wave 4 pennant with the breakout over that high on Wednesday a final 5th wave up that started at the 12/26 low last year. It could fall shy of 2700 or reach the max resistance zone of 2720-2730... don't know?
But if we have a pause day today (green close) and another up day tomorrow, which either produces a lower high then last Tuesday and last Friday (which setups a wave 3 down on Thursday), or a higher high (which completes a final 5th wave up from 12/26) we will have a great short setup going into Thursday. What can change that? Well, if we drop again hard today (like to 2600 or a pierce below) then I'd think the sideways action from last Tuesday's high was indeed a wave 4 down and the drop today would likely end it. Then a long drawn out wave 5 up could start and I'd guess at that point that it would subdivide into 5 smaller waves up and eventually take out that 2720-2730 zone in the coming weeks.
The reason I'd guess that the 5th wave up would subdivide is because a drop to 2600 or slightly lower would reset the short term overbought charts and allow the bulls to get a new start again, whereas if they are trapped inside this sideways trading zone that they are current in, and try to launch a 5th wave up from it, I think they will not be able to get much traction and it will just be a one wave pattern that ends short inside of subdividing.
Think of it like a bull trapped inside a tight pen. He can hit the gate to try and get out with limited force because he can't get a run at it. But take him outside the pen in a big area and allow him to get a run at some gate (gate equals big resistance zone) and his force generated from getting a run at it and his weight will probably tear the gate completely down.
That's what I'm thinking here on some 5th wave up. Do it inside the pen and upside is limited, but drop first (2600 or low) and then make another run up and suddenly that resistance isn't so tough anymore. Anyway, if you are a bear then root for a pause day with a slightly green close and then a nice rally tomorrow for another lower high, or even a pierce through both recent highs for a stop run. Either one will likely end this up move from 12/26 and allow a nice drop of 50% or more to start on Thursday.
ES Morning Update January 28th 2019
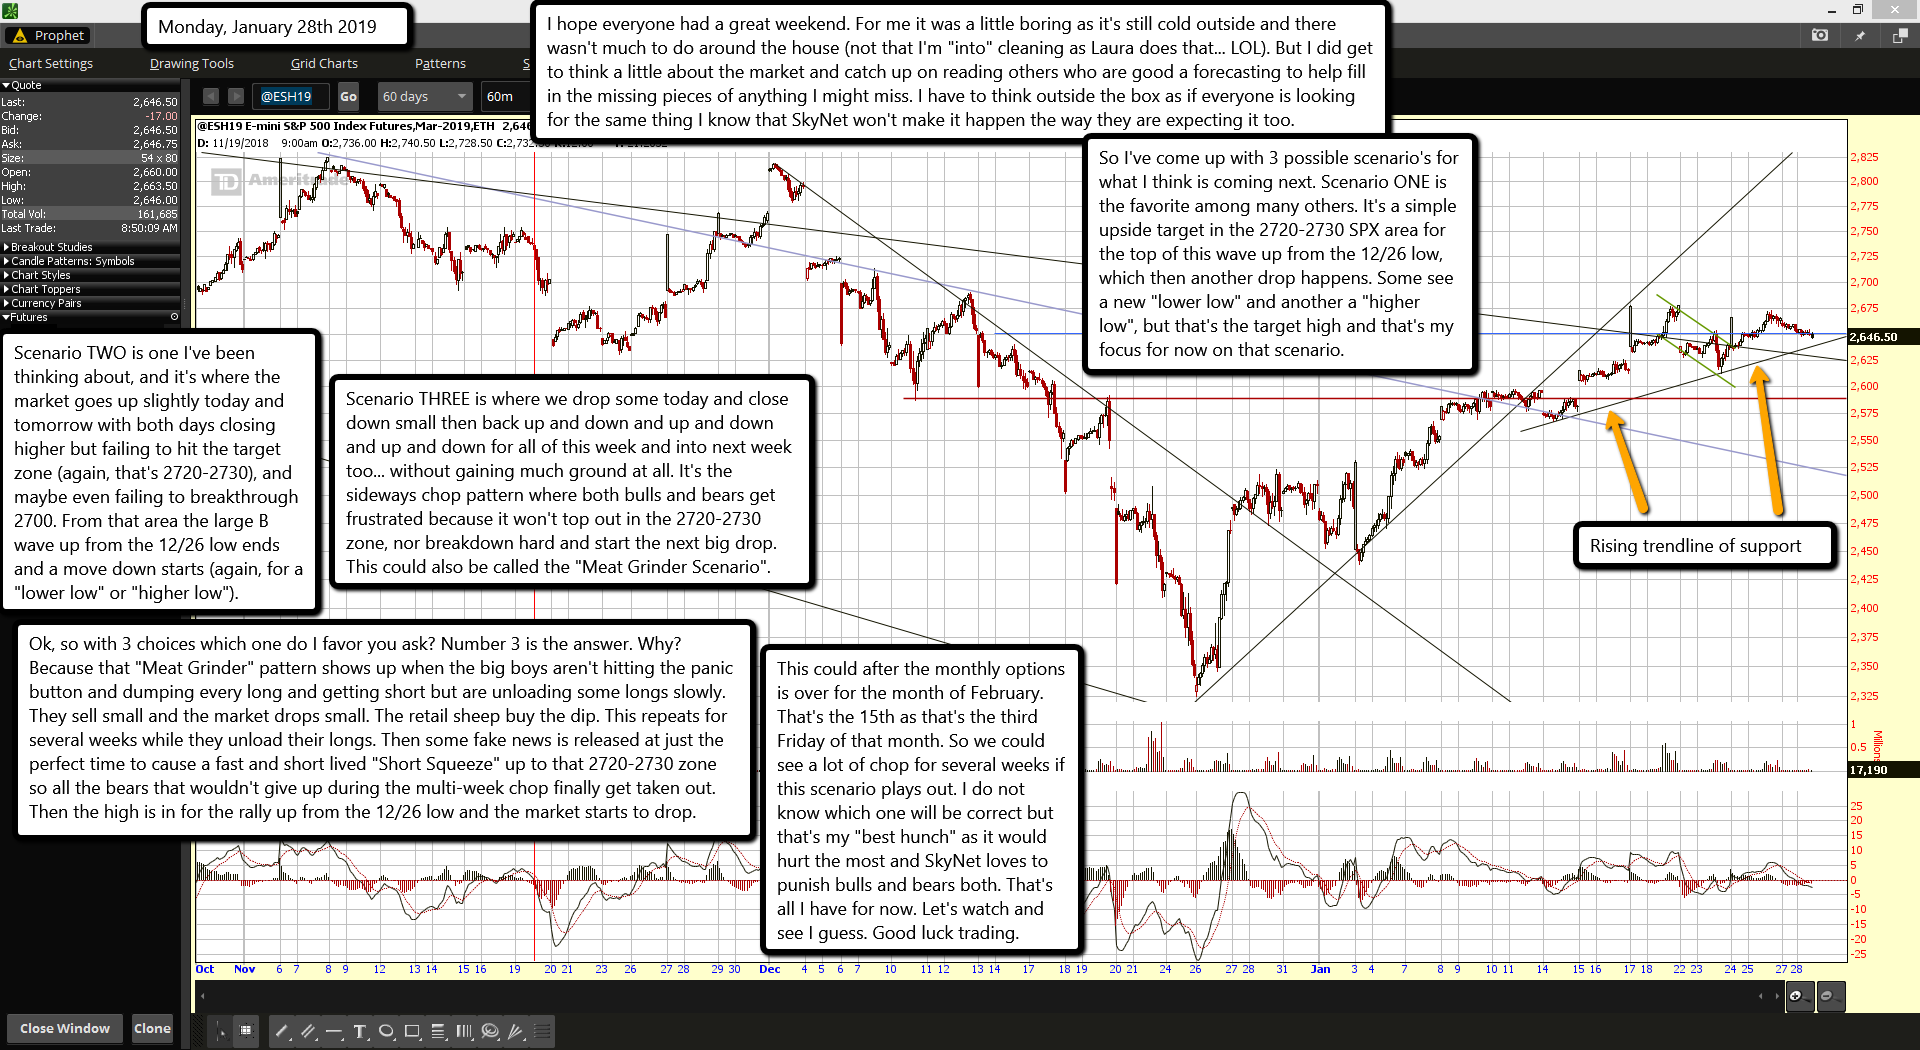
I hope everyone had a great weekend. For me it was a little boring as it's still cold outside and there wasn't much to do around the house (not that I'm "into" cleaning as Laura does that... LOL). But I did get to think a little about the market and catch up on reading others who are good a forecasting to help fill in the missing pieces of anything I might miss. I have to think outside the box as if everyone is looking for the same thing I know that SkyNet won't make it happen the way they are expecting it too.
So I've come up with 3 possible scenario's for what I think is coming next. Scenario ONE is the favorite among many others. It's a simple upside target in the 2720-2730 SPX area for the top of this wave up from the 12/26 low, which then another drop happens. Some see a new "lower low" and another a "higher low", but that's the target high and that's my focus for now on that scenario.
Scenario TWO is one I've been thinking about, and it's where the market goes up slightly today and tomorrow with both days closing higher but failing to hit the target zone (again, that's 2720-2730), and maybe even failing to breakthrough 2700. From that area the large B wave up from the 12/26 low ends and a move down starts (again, for a "lower low" or "higher low").
Scenario THREE is where we drop some today and close down small then back up and down and up and down and up and down for all of this week and into next week too... without gaining much ground at all. It's the sideways chop pattern where both bulls and bears get frustrated because it won't top out in the 2720-2730 zone, nor breakdown hard and start the next big drop. This could also be called the "Meat Grinder Scenario".
Ok, so with 3 choices which one do I favor you ask? Number 3 is the answer. Why? Because that "Meat Grinder" pattern shows up when the big boys aren't hitting the panic button and dumping every long and getting short but are unloading some longs slowly. They sell small and the market drops small. The retail sheep buy the dip. This repeats for several weeks while they unload their longs. Then some fake news is released at just the perfect time to cause a fast and short lived "Short Squeeze" up to that 2720-2730 zone so all the bears that wouldn't give up during the multi-week chop finally get taken out. Then the high is in for the rally up from the 12/26 low and the market starts to drop.
This could after the monthly options is over for the month of February. That's the 15th as that's the third Friday of that month. So we could see a lot of chop for several weeks if this scenario plays out. I do not know which one will be correct but that's my "best hunch" as it would hurt the most and SkyNet loves to punish bulls and bears both. That's all I have for now. Let's watch and see I guess. Good luck trading.
ES Morning Update January 25th 2019
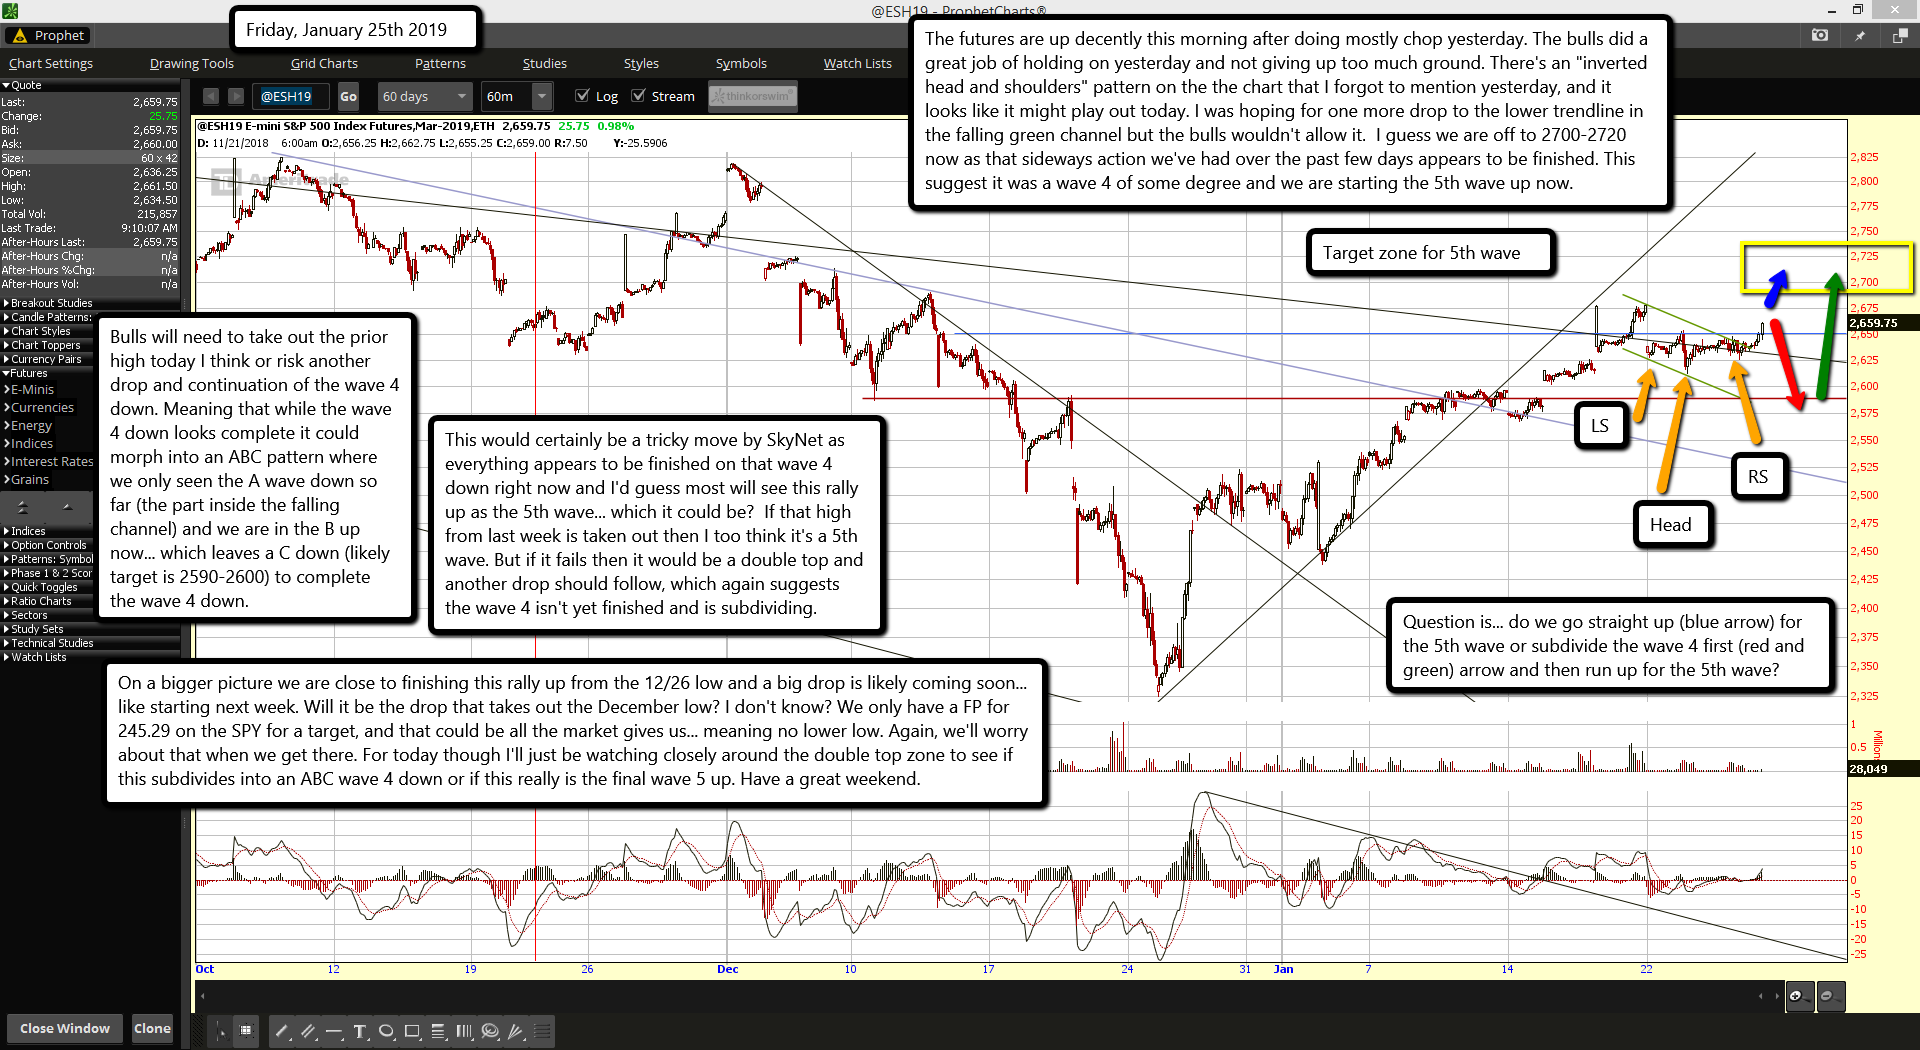
The futures are up decently this morning after doing mostly chop yesterday. The bulls did a great job of holding on yesterday and not giving up too much ground. There's an "inverted head and shoulders" pattern on the the chart that I forgot to mention yesterday, and it looks like it might play out today. I was hoping for one more drop to the lower trendline in the falling green channel but the bulls wouldn't allow it. I guess we are off to 2700-2720 now as that sideways action we've had over the past few days appears to be finished. This suggest it was a wave 4 of some degree and we are starting the 5th wave up now.
Bulls will need to take out the prior high today I think or risk another drop and continuation of the wave 4 down. Meaning that while the wave 4 down looks complete it could morph into an ABC pattern where we only seen the A wave down so far (the part inside the falling channel) and we are in the B up now... which leaves a C down (likely target is 2590-2600) to complete the wave 4 down.
This would certainly be a tricky move by SkyNet as everything appears to be finished on that wave 4 down right now and I'd guess most will see this rally up as the 5th wave... which it could be? If that high from last week is taken out then I too think it's a 5th wave. But if it fails then it would be a double top and another drop should follow, which again suggests the wave 4 isn't yet finished and is subdividing.
On a bigger picture we are close to finishing this rally up from the 12/26 low and a big drop is likely coming soon... like starting next week. Will it be the drop that takes out the December low? I don't know? We only have a FP for 245.29 on the SPY for a target, and that could be all the market gives us... meaning no lower low. Again, we'll worry about that when we get there. For today though I'll just be watching closely around the double top zone to see if this subdivides into an ABC wave 4 down or if this really is the final wave 5 up. Have a great weekend.
ES Morning Update January 24th 2019
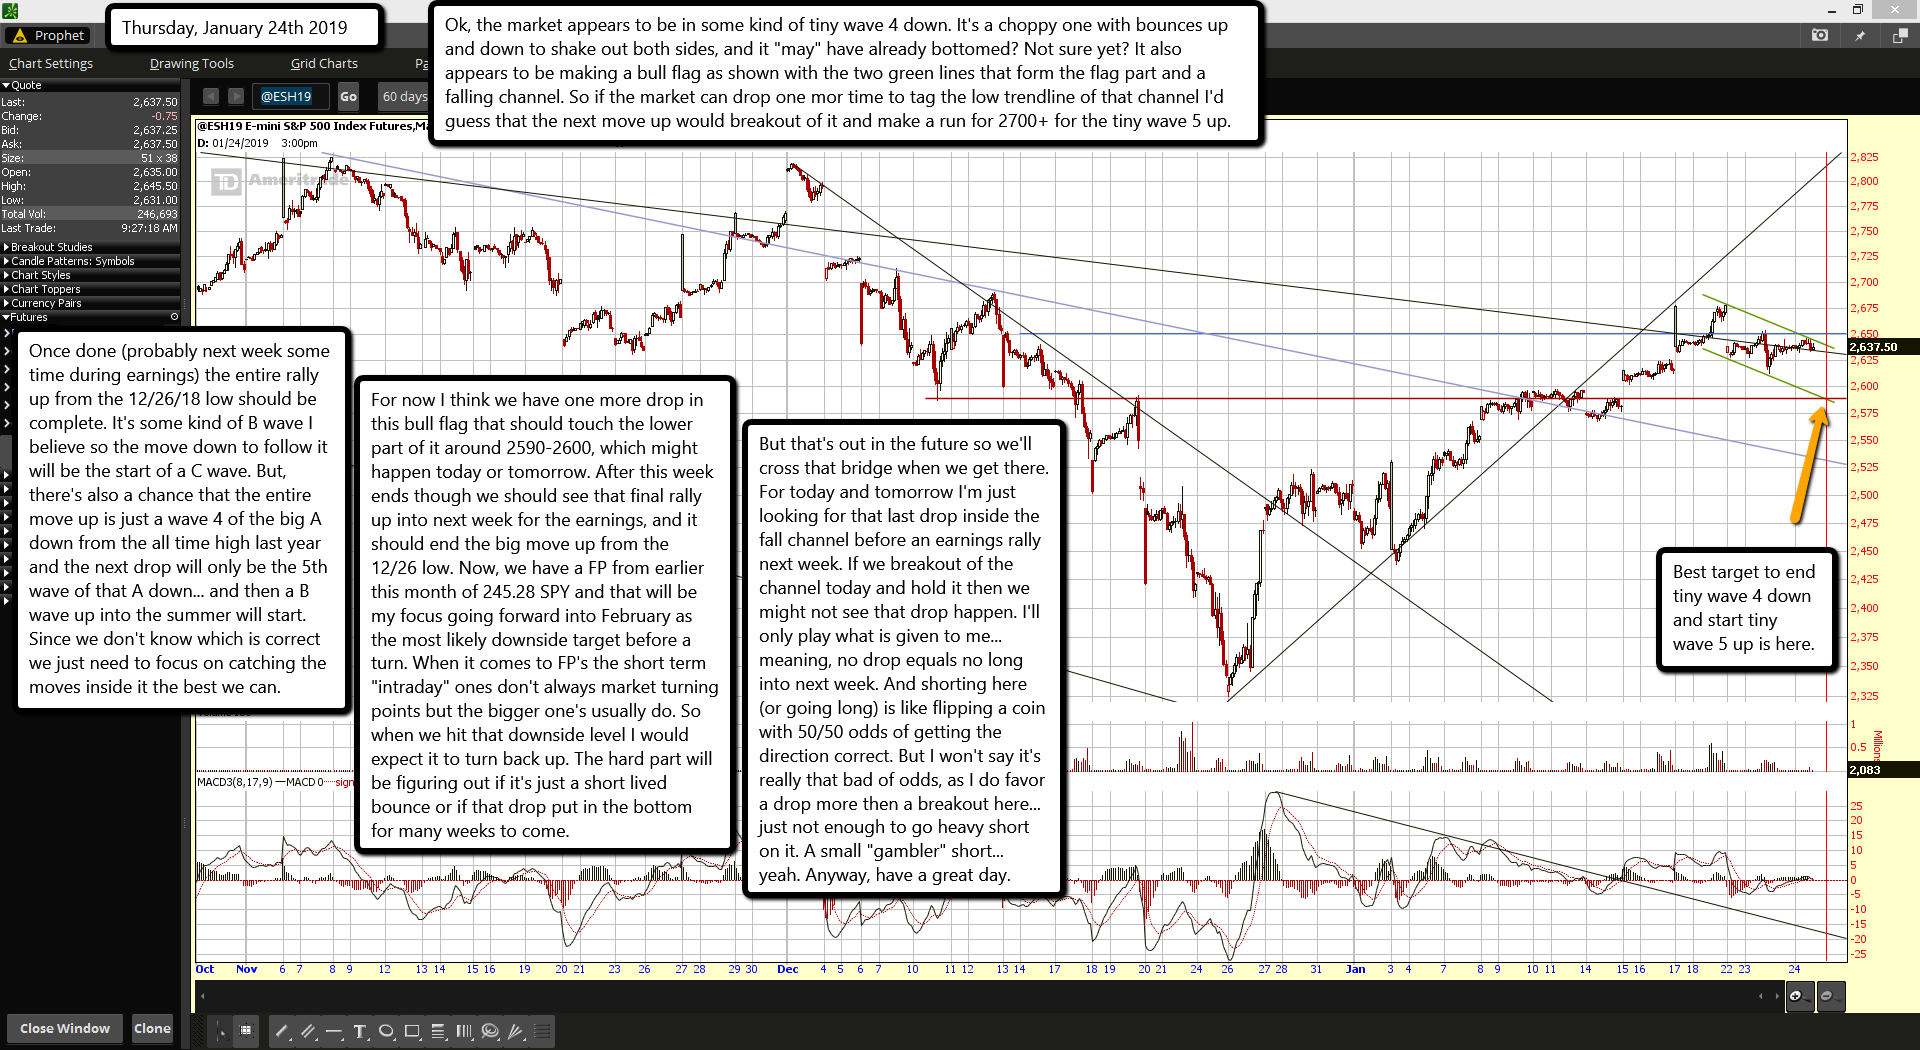
Ok, the market appears to be in some kind of tiny wave 4 down. It's a choppy one with bounces up and down to shake out both sides, and it "may" have already bottomed? Not sure yet? It also appears to be making a bull flag as shown with the two green lines that form the flag part and a falling channel. So if the market can drop one more time to tag the low trendline of that channel I'd guess that the next move up would breakout of it and make a run for 2700+ for the tiny wave 5 up.
Once done (probably next week some time during earnings) the entire rally up from the 12/26/18 low should be complete. It's some kind of B wave I believe so the move down to follow it will be the start of a C wave. But, there's also a chance that the entire move up is just a wave 4 of the big A down from the all time high last year and the next drop will only be the 5th wave of that A down... and then a B wave up into the summer will start. Since we don't know which is correct we just need to focus on catching the moves inside it the best we can.
For now I think we have one more drop in this bull flag that should touch the lower part of it around 2590-2600, which might happen today or tomorrow. After this week ends though we should see that final rally up into next week for the earnings, and it should end the big move up from the 12/26 low. Now, we have a FP from earlier this month of 245.28 SPY and that will be my focus going forward into February as the most likely downside target before a turn. When it comes to FP's the short term "intraday" ones don't always market turning points but the bigger one's usually do. So when we hit that downside level I would expect it to turn back up. The hard part will be figuring out if it's just a short lived bounce or if that drop put in the bottom for many weeks to come.
But that's out in the future so we'll cross that bridge when we get there. For today and tomorrow I'm just looking for that last drop inside the fall channel before an earnings rally next week. If we breakout of the channel today and hold it then we might not see that drop happen. I'll only play what is given to me... meaning, no drop equals no long into next week. And shorting here (or going long) is like flipping a coin with 50/50 odds of getting the direction correct. But I won't say it's really that bad of odds, as I do favor a drop more then a breakout here... just not enough to go heavy short on it. A small "gambler" short... yeah. Anyway, have a great day.
ES Morning Update January 23rd 2019
I'm feeling a whole lot better today gang as yesterday I was quite sick and didn't do a morning update post. My runny nose seems to have stopped mostly now, but it's so sore it looks like Rudolph the Red Nose Reindeer. The headache and fever is gone, and the sore throat is mostly gone. Overall I'm a ton better today then yesterday. Sucks getting so sick as I rarely do but I guess the extremely cold weather kicked my but from going inside and outside too much over the last few days.
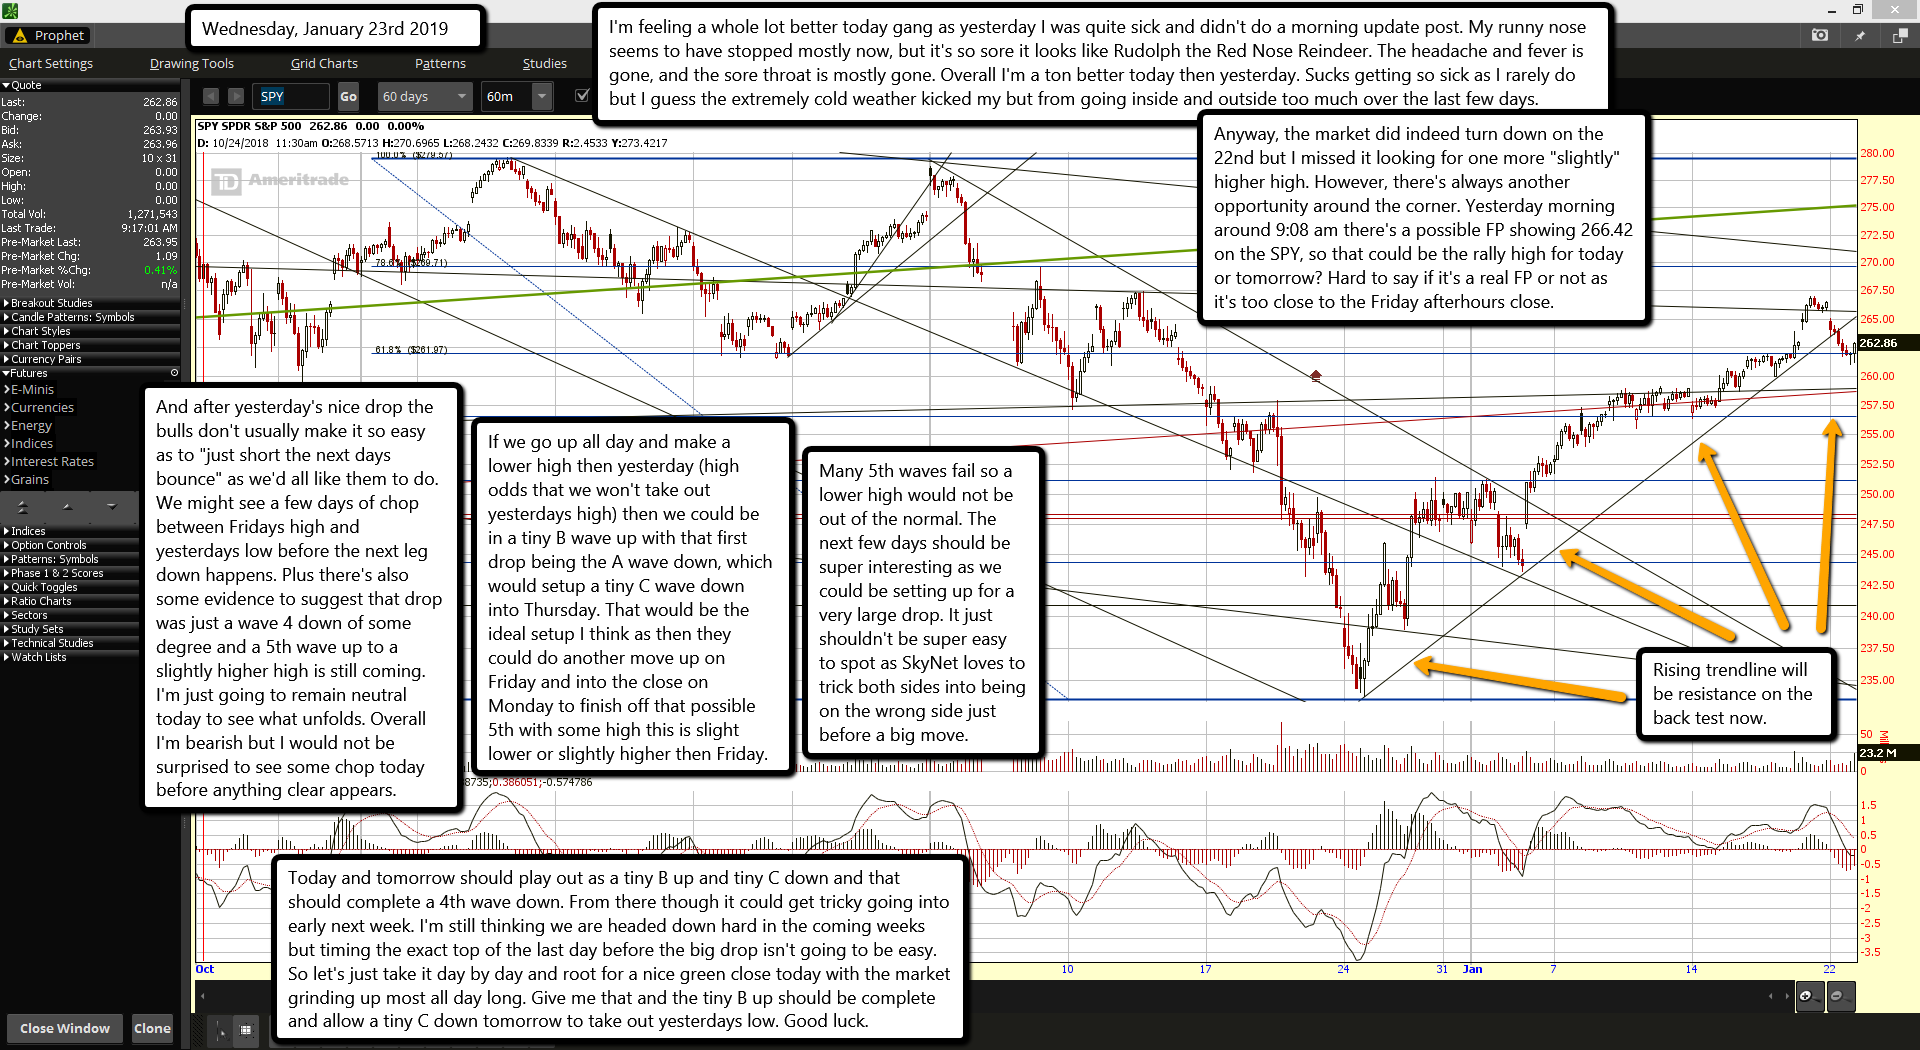
Anyway, the market did indeed turn down on the 22nd but I missed it looking for one more "slightly" higher high. However, there's always another opportunity around the corner. Yesterday morning around 9:08 am there's a possible FP showing 266.42 on the SPY, so that could be the rally high for today or tomorrow? Hard to say if it's a real FP or not as it's too close to the Friday afterhours close.
And after yesterday's nice drop the bulls don't usually make it so easy as to "just short the next days bounce" as we'd all like them to do. We might see a few days of chop between Fridays high and yesterdays low before the next leg down happens. Plus there's also some evidence to suggest that drop was just a wave 4 down of some degree and a 5th wave up to a slightly higher high is still coming. I'm just going to remain neutral today to see what unfolds. Overall I'm bearish but I would not be surprised to see some chop today before anything clear appears.
If we go up all day and make a lower high then yesterday (high odds that we won't take out yesterdays high) then we could be in a tiny B wave up with that first drop being the A wave down, which would setup a tiny C wave down into Thursday. That would be the ideal setup I think as then they could do another move up on Friday and into the close on Monday to finish off that possible 5th with some high this is slight lower or slightly higher then Friday.
Many 5th waves fail so a lower high would not be out of the normal. The next few days should be super interesting as we could be setting up for a very large drop. It just shouldn't be super easy to spot as SkyNet loves to trick both sides into being on the wrong side just before a big move.
Today and tomorrow should play out as a tiny B up and tiny C down and that should complete a 4th wave down. From there though it could get tricky going into early next week. I'm still thinking we are headed down hard in the coming weeks but timing the exact top of the last day before the big drop isn't going to be easy. So let's just take it day by day and root for a nice green close today with the market grinding up most all day long. Give me that and the tiny B up should be complete and allow a tiny C down tomorrow to take out yesterdays low. Good luck.
ES Morning Update January 18th 2019
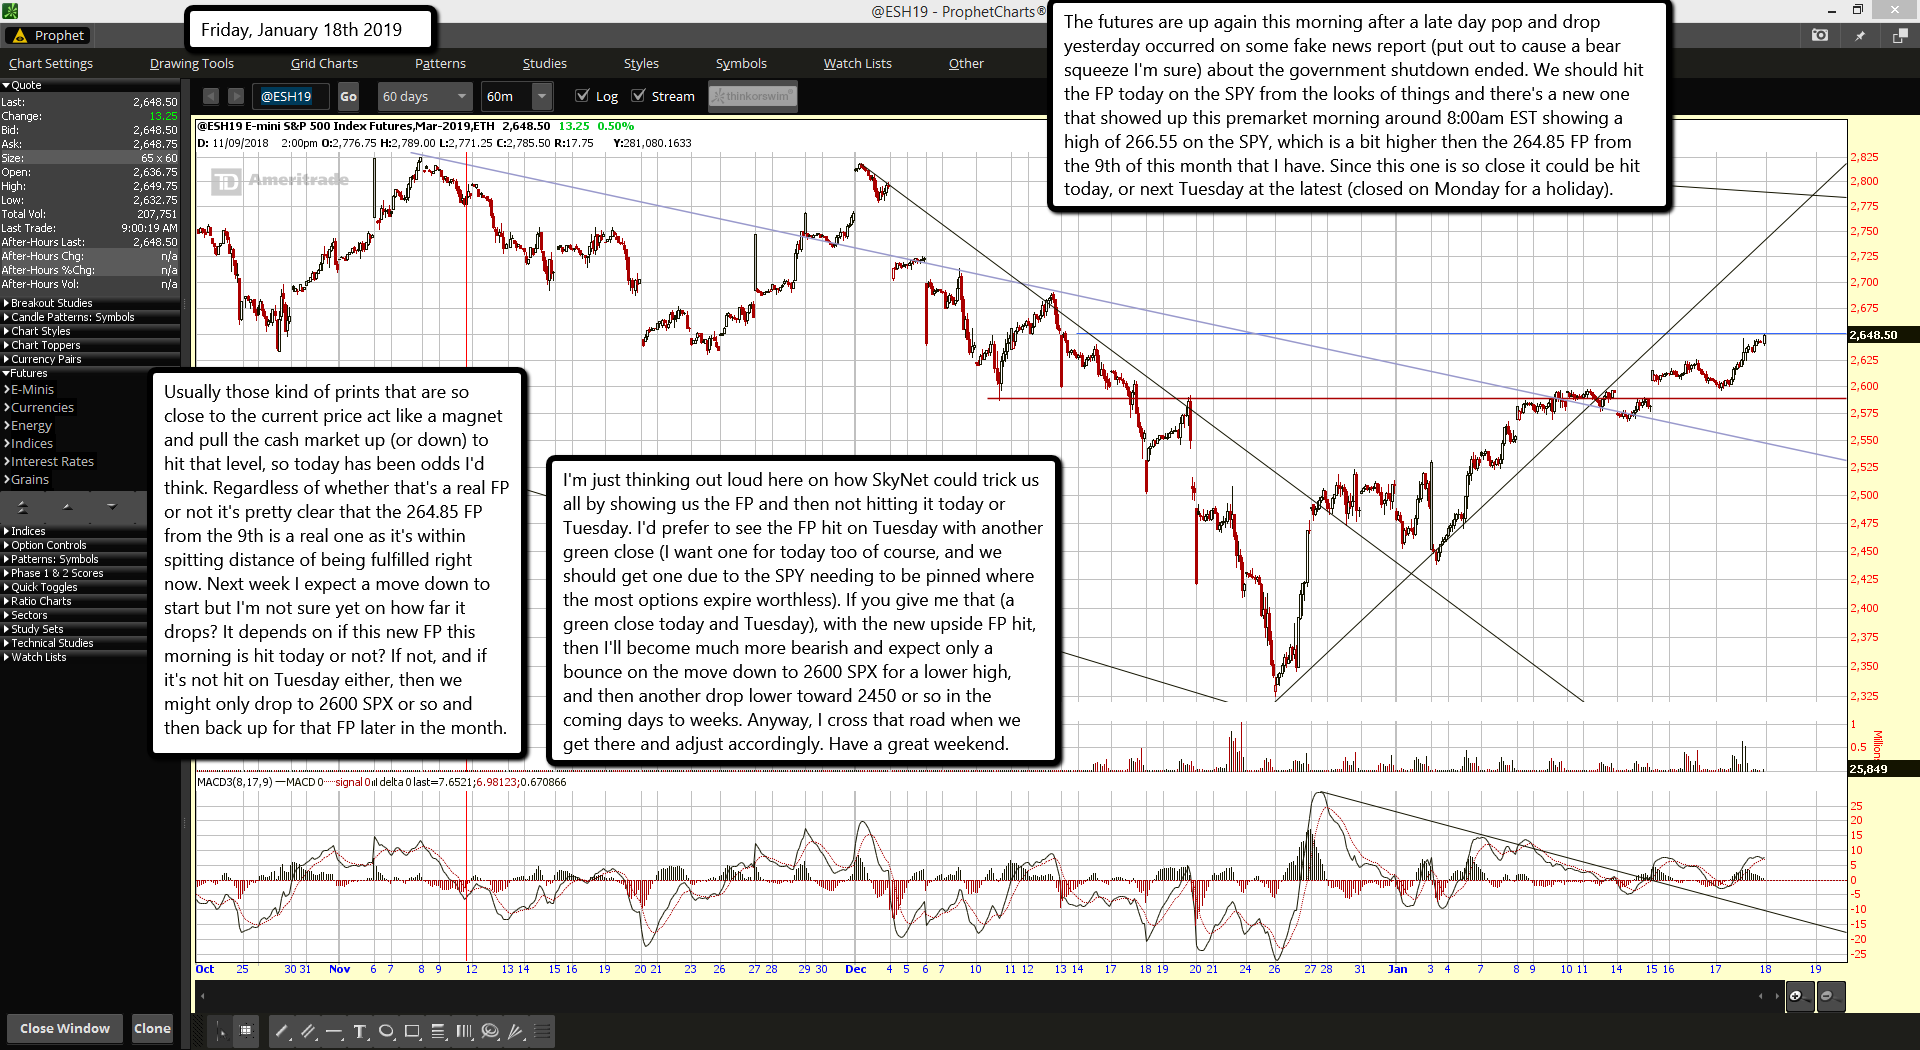
The futures are up again this morning after a late day pop and drop yesterday occurred on some fake news report (put out to cause a bear squeeze I'm sure) about the government shutdown ended. We should hit the FP today on the SPY from the looks of things and there's a new one that showed up this premarket morning around 8:00am EST showing a high of 266.55 on the SPY, which is a bit higher then the 264.85 FP from the 9th of this month that I have. Since this one is so close it could be hit today, or next Tuesday at the latest (closed on Monday for a holiday).
Usually those kind of prints that are so close to the current price act like a magnet and pull the cash market up (or down) to hit that level, so today has been odds I'd think. Regardless of whether that's a real FP or not it's pretty clear that the 264.85 FP from the 9th is a real one as it's within spitting distance of being fulfilled right now. Next week I expect a move down to start but I'm not sure yet on how far it drops? It depends on if this new FP this morning is hit today or not? If not, and if it's not hit on Tuesday either, then we might only drop to 2600 SPX or so and then back up for that FP later in the month.
I'm just thinking out loud here on how SkyNet could trick us all by showing us the FP and then not hitting it today or Tuesday. I'd prefer to see the FP hit on Tuesday with another green close (I want one for today too of course, and we should get one due to the SPY needing to be pinned where the most options expire worthless). If you give me that (a green close today and Tuesday), with the new upside FP hit, then I'll become much more bearish and expect only a bounce on the move down to 2600 SPX for a lower high, and then another drop lower toward 2450 or so in the coming days to weeks. Anyway, I cross that road when we get there and adjust accordingly. Have a great weekend.
ES Morning Update January 17th 2019
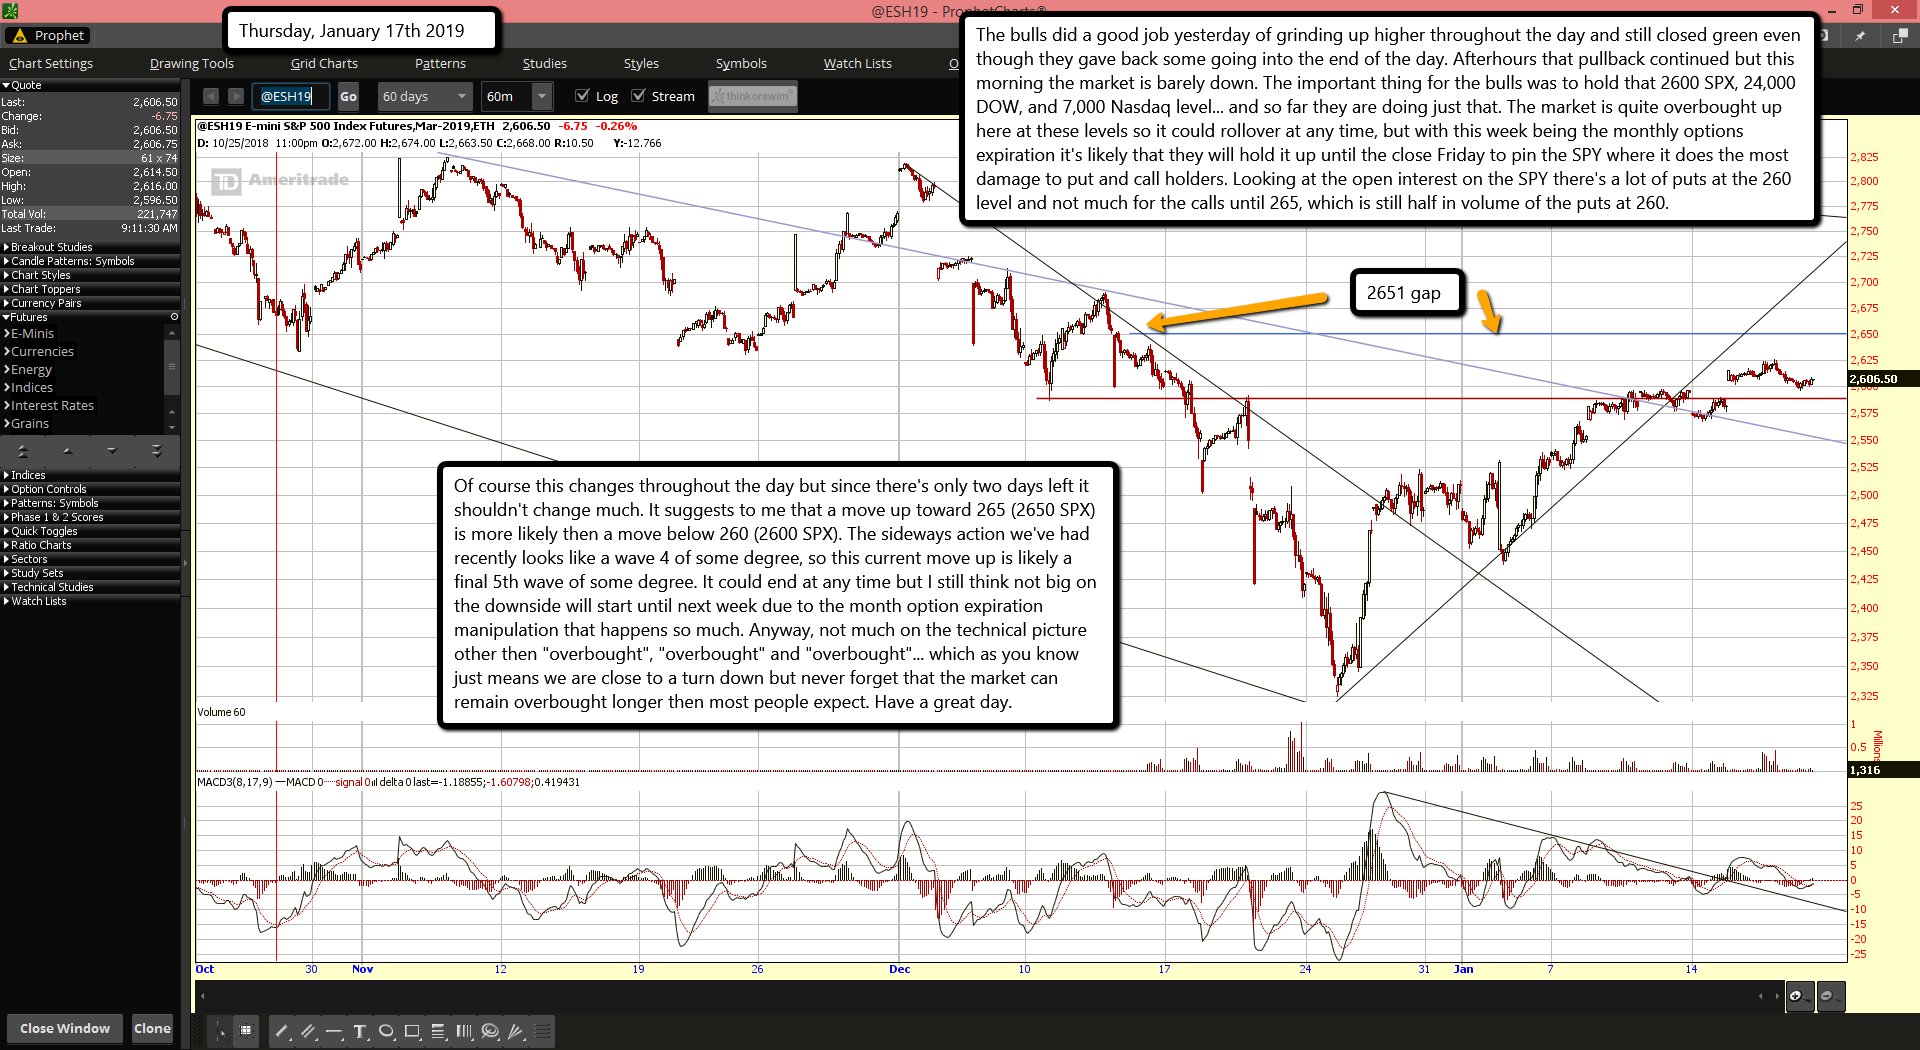
The bulls did a good job yesterday of grinding up higher throughout the day and still closed green even though they gave back some going into the end of the day. Afterhours that pullback continued but this morning the market is barely down. The important thing for the bulls was to hold that 2600 SPX, 24,000 DOW, and 7,000 Nasdaq level... and so far they are doing just that. The market is quite overbought up here at these levels so it could rollover at any time, but with this week being the monthly options expiration it's likely that they will hold it up until the close Friday to pin the SPY where it does the most damage to put and call holders. Looking at the open interest on the SPY there's a lot of puts at the 260 level and not much for the calls until 265, which is still half in volume of the puts at 260.
Of course this changes throughout the day but since there's only two days left it shouldn't change much. It suggests to me that a move up toward 265 (2650 SPX) is more likely then a move below 260 (2600 SPX). The sideways action we've had recently looks like a wave 4 of some degree, so this current move up is likely a final 5th wave of some degree. It could end at any time but I still think not big on the downside will start until next week due to the month option expiration manipulation that happens so much. Anyway, not much on the technical picture other then "overbought", "overbought" and "overbought"... which as you know just means we are close to a turn down but never forget that the market can remain overbought longer then most people expect. Have a great day.
ES Morning Update January 16th 2019
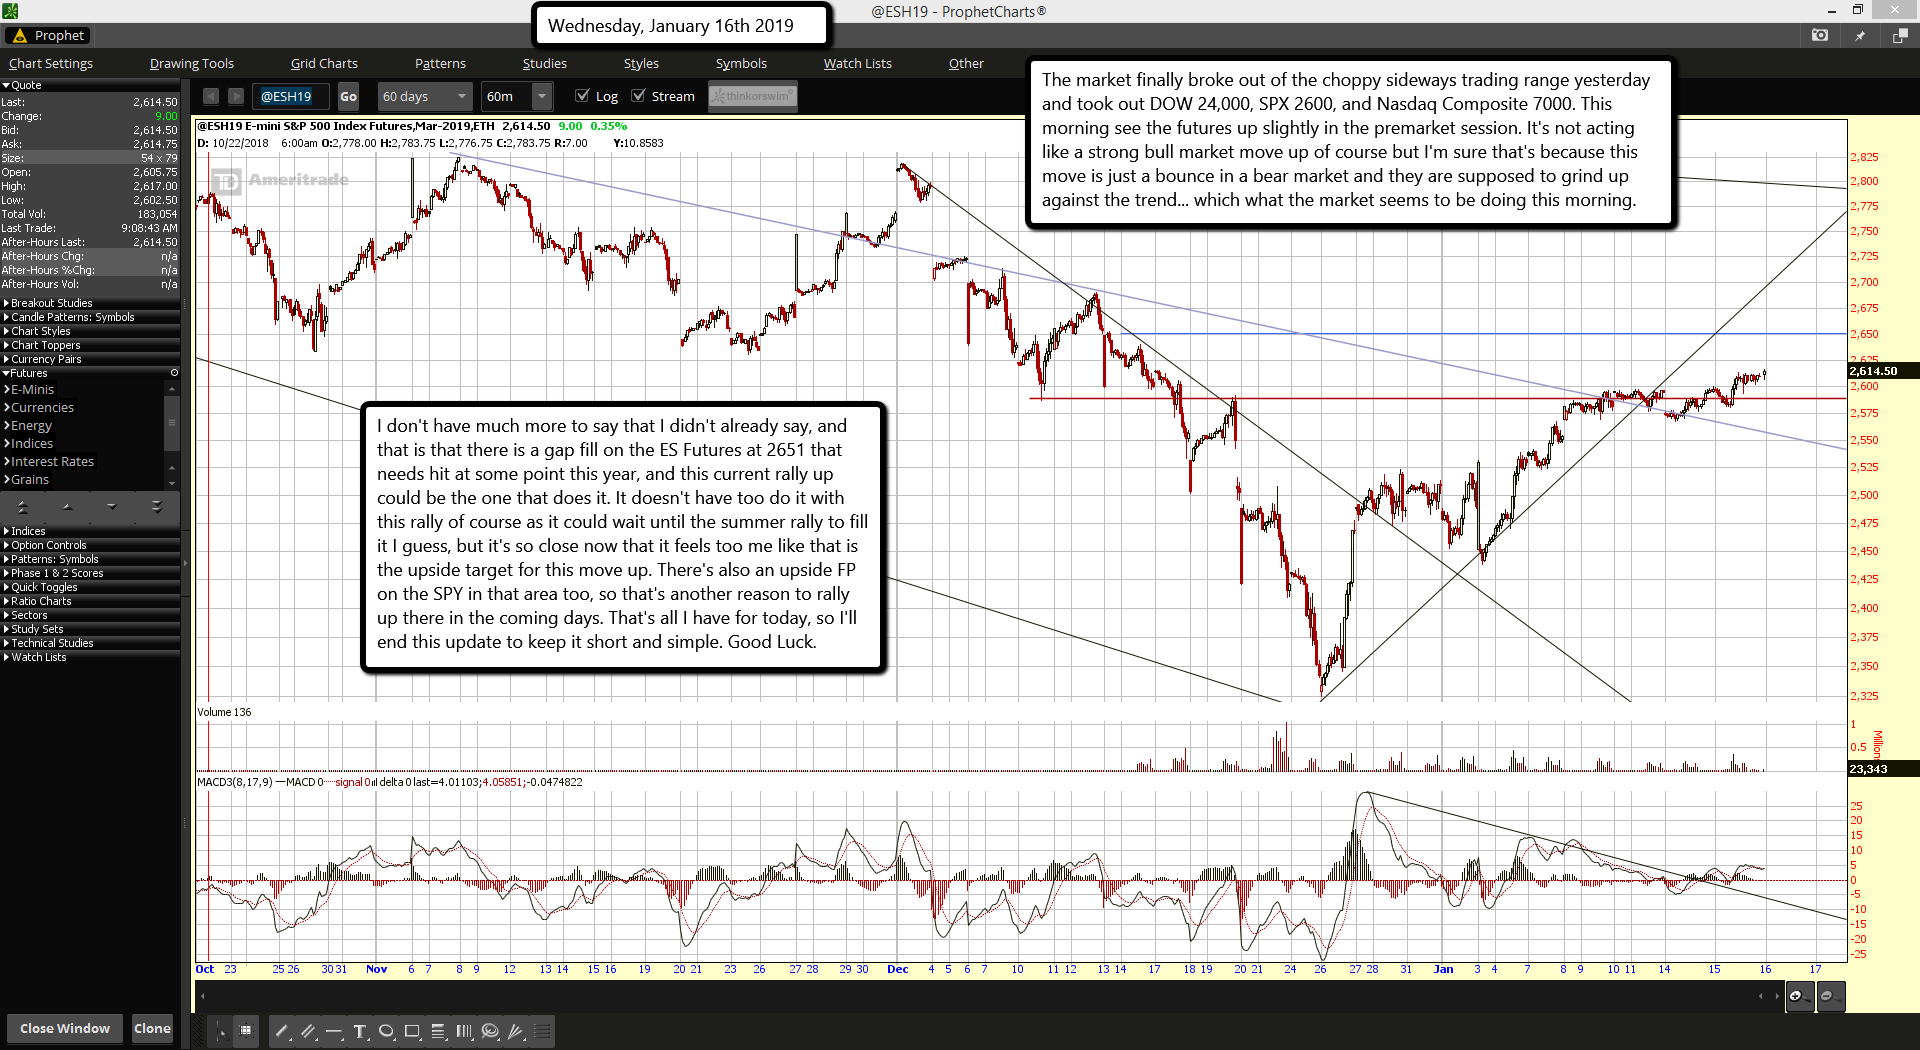
The market finally broke out of the choppy sideways trading range yesterday and took out DOW 24,000, SPX 2600, and Nasdaq Composite 7000. This morning see the futures up slightly in the premarket session. It's not acting like a strong bull market move up of course but I'm sure that's because this move is just a bounce in a bear market and they are supposed to grind up against the trend... which what the market seems to be doing this morning.
I don't have much more to say that I didn't already say, and that is that there is a gap fill on the ES Futures at 2651 that needs hit at some point this year, and this current rally up could be the one that does it. It doesn't have too do it with this rally of course as it could wait until the summer rally to fill it I guess, but it's so close now that it feels too me like that is the upside target for this move up. There's also an upside FP on the SPY in that area too, so that's another reason to rally up there in the coming days. That's all I have for today, so I'll end this update to keep it short and simple. Good Luck.
ES Morning Update January 15th 2019
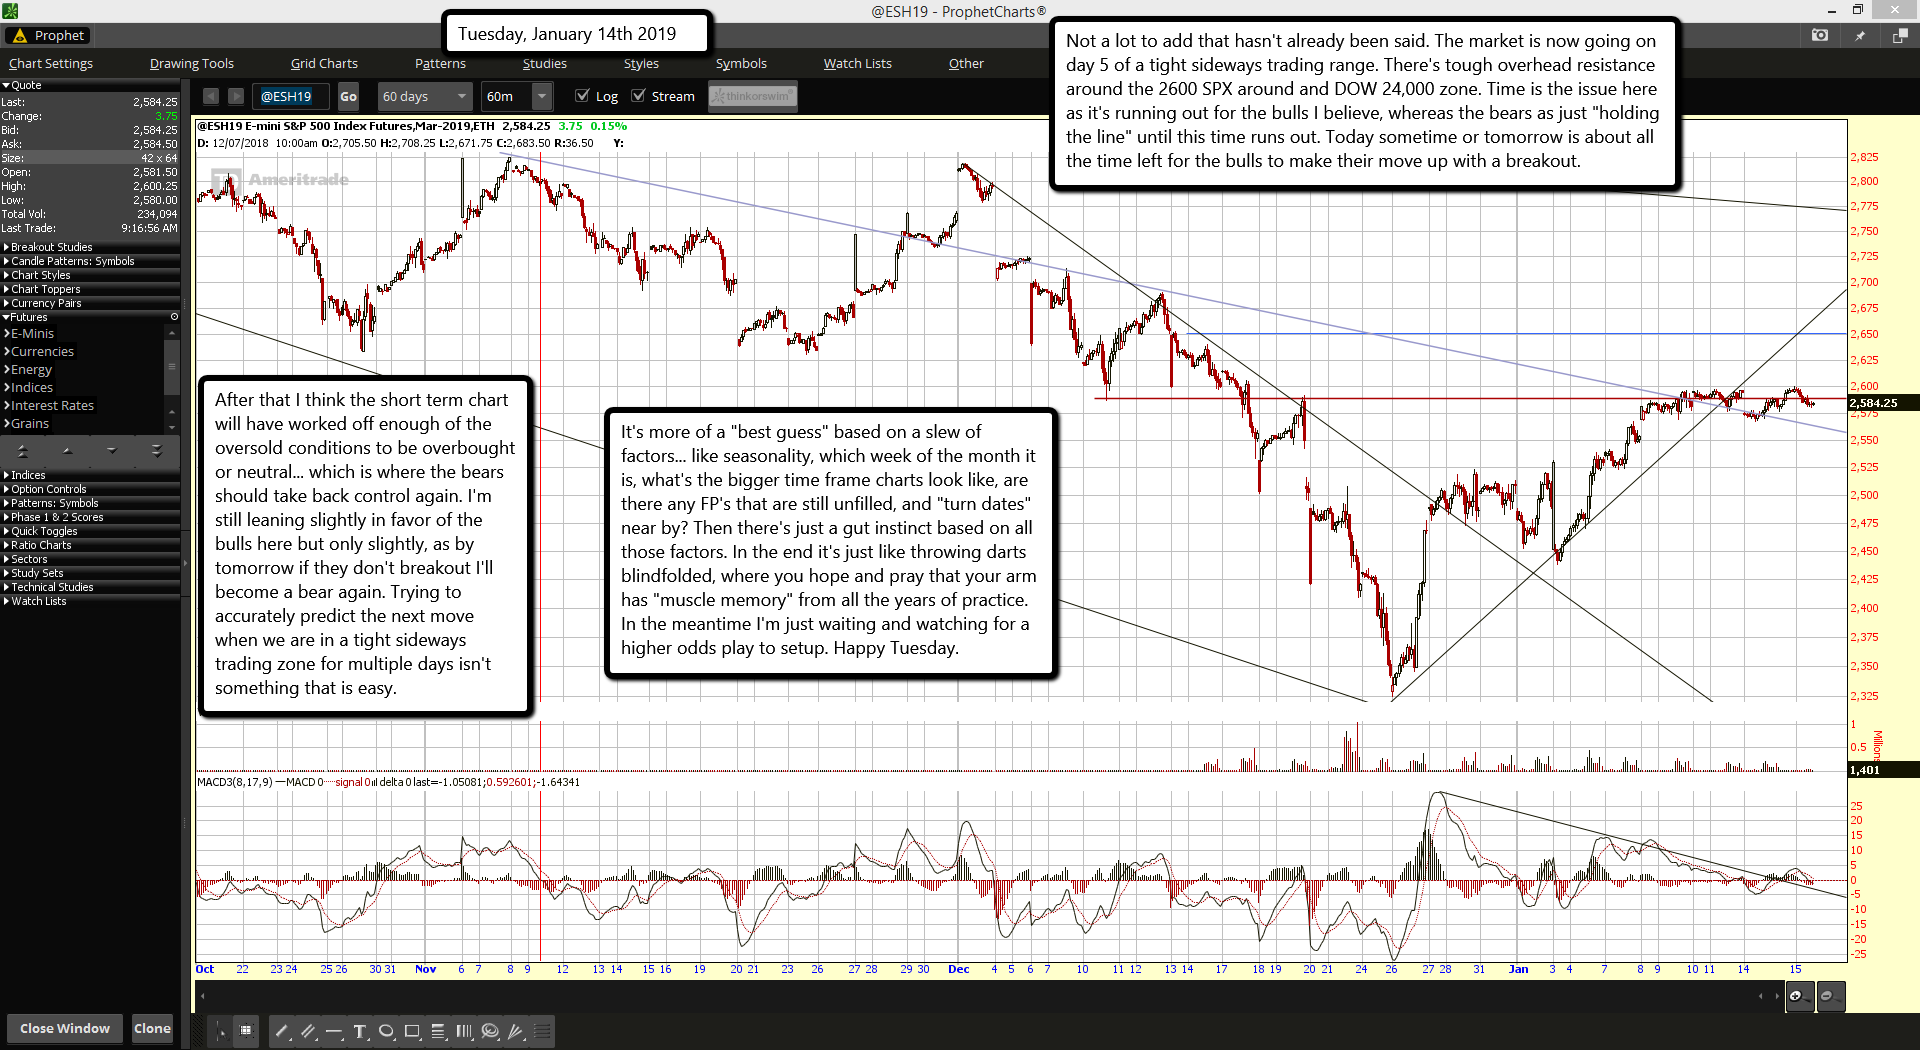
Not a lot to add that hasn't already been said. The market is now going on day 5 of a tight sideways trading range. There's tough overhead resistance around the 2600 SPX around and DOW 24,000 zone. Time is the issue here as it's running out for the bulls I believe, whereas the bears as just "holding the line" until this time runs out. Today sometime or tomorrow is about all the time left for the bulls to make their move up with a breakout.
After that I think the short term chart will have worked off enough of the oversold conditions to be overbought or neutral... which is where the bears should take back control again. I'm still leaning slightly in favor of the bulls here but only slightly, as by tomorrow if they don't breakout I'll become a bear again. Trying to accurately predict the next move when we are in a tight sideways trading zone for multiple days isn't something that is easy.
It's more of a "best guess" based on a slew of factors... like seasonality, which week of the month it is, what's the bigger time frame charts look like, are there any FP's that are still unfilled, and "turn dates" near by? Then there's just a gut instinct based on all those factors. In the end it's just like throwing darts blindfolded, where you hope and pray that your arm has "muscle memory" from all the years of practice. In the meantime I'm just waiting and watching for a higher odds play to setup. Happy Tuesday.
ES Morning Update January 14th 2019
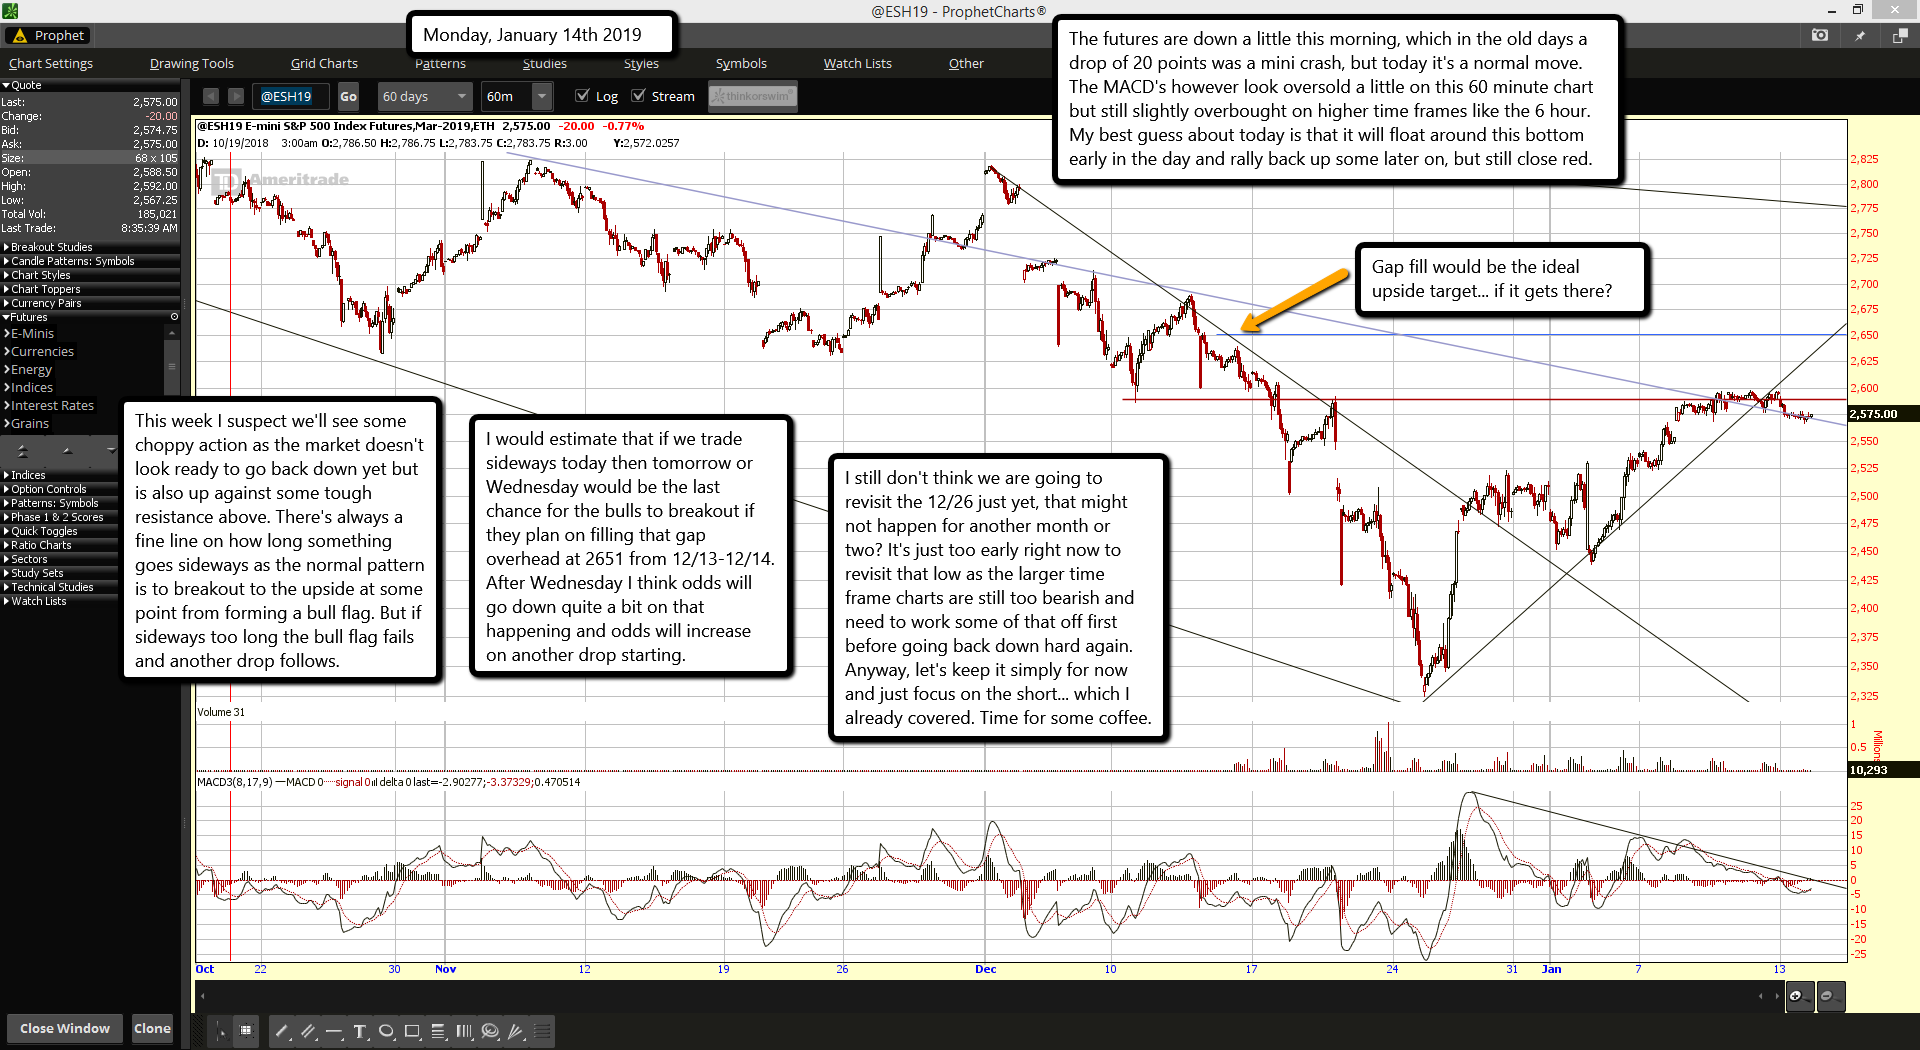
The futures are down a little this morning, which in the old days a drop of 20 points was a mini crash, but today it's a normal move. The MACD's however look oversold a little on this 60 minute chart but still slightly overbought on higher time frames like the 6 hour. My best guess about today is that it will float around this bottom early in the day and rally back up some later on, but still close red.
This week I suspect we'll see some choppy action as the market doesn't look ready to go back down yet but is also up against some tough resistance above. There's always a fine line on how long something goes sideways as the normal pattern is to breakout to the upside at some point from forming a bull flag. But if sideways too long the bull flag fails and another drop follows.
I would estimate that if we trade sideways today then tomorrow or Wednesday would be the last chance for the bulls to breakout if they plan on filling that gap overhead at 2651 from 12/13-12/14. After Wednesday I think odds will go down quite a bit on that happening and odds will increase on another drop starting.
I still don't think we are going to revisit the 12/26 just yet, that might not happen for another month or two? It's just too early right now to revisit that low as the larger time frame charts are still too bearish and need to work some of that off first before going back down hard again. Anyway, let's keep it simply for now and just focus on the short... which I already covered. Time for some coffee.
ES Morning Update January 11th 2019
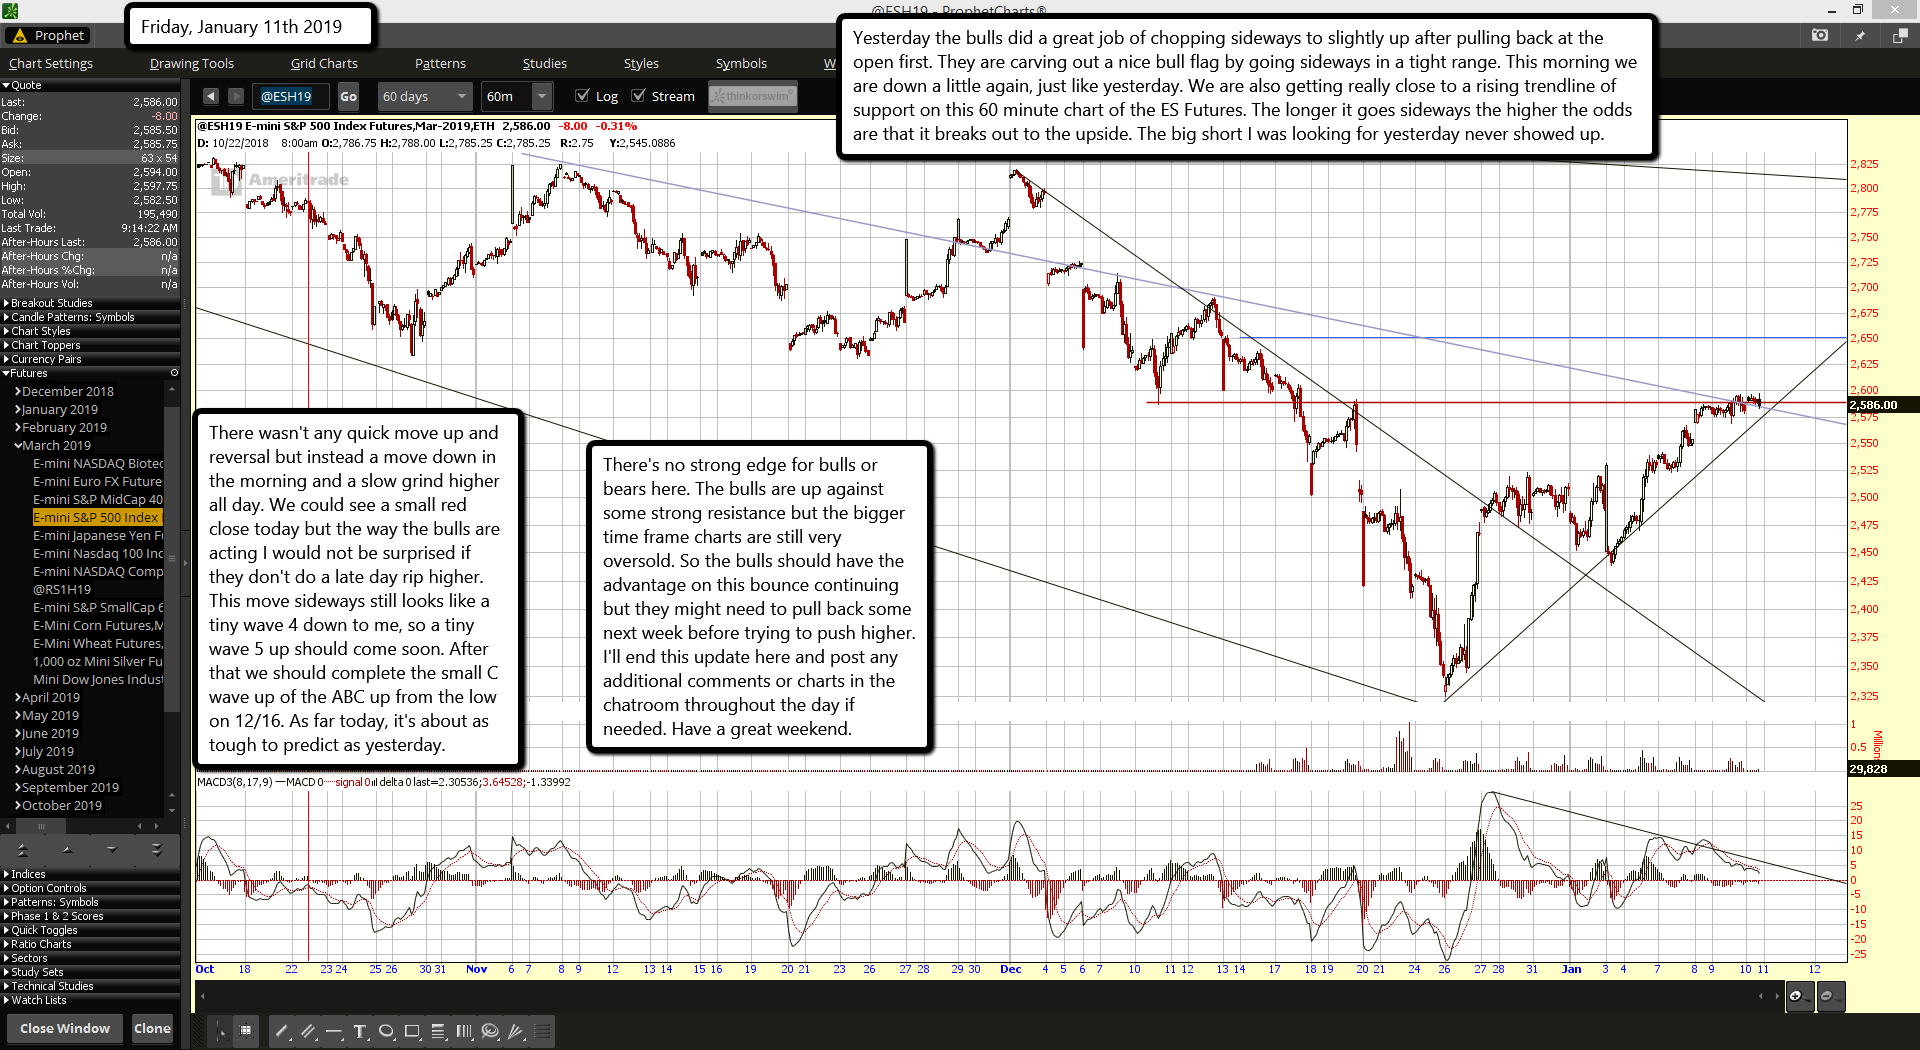
Yesterday the bulls did a great job of chopping sideways to slightly up after pulling back at the open first. They are carving out a nice bull flag by going sideways in a tight range. This morning we are down a little again, just like yesterday. We are also getting really close to a rising trendline of support on this 60 minute chart of the ES Futures. The longer it goes sideways the higher the odds are that it breaks out to the upside. The big short I was looking for yesterday never showed up.
There wasn't any quick move up and reversal but instead a move down in the morning and a slow grind higher all day. We could see a small red close today but the way the bulls are acting I would not be surprised if they don't do a late day rip higher. This move sideways still looks like a tiny wave 4 down to me, so a tiny wave 5 up should come soon. After that we should complete the small C wave up of the ABC up from the low on 12/16. As far today, it's about as tough to predict as yesterday.
There's no strong edge for bulls or bears here. The bulls are up against some strong resistance but the bigger time frame charts are still very oversold. So the bulls should have the advantage on this bounce continuing but they might need to pull back some next week before trying to push higher. I'll end this update here and post any additional comments or charts in the chatroom throughout the day if needed. Have a great weekend.
ES Morning Update January 10th 2019
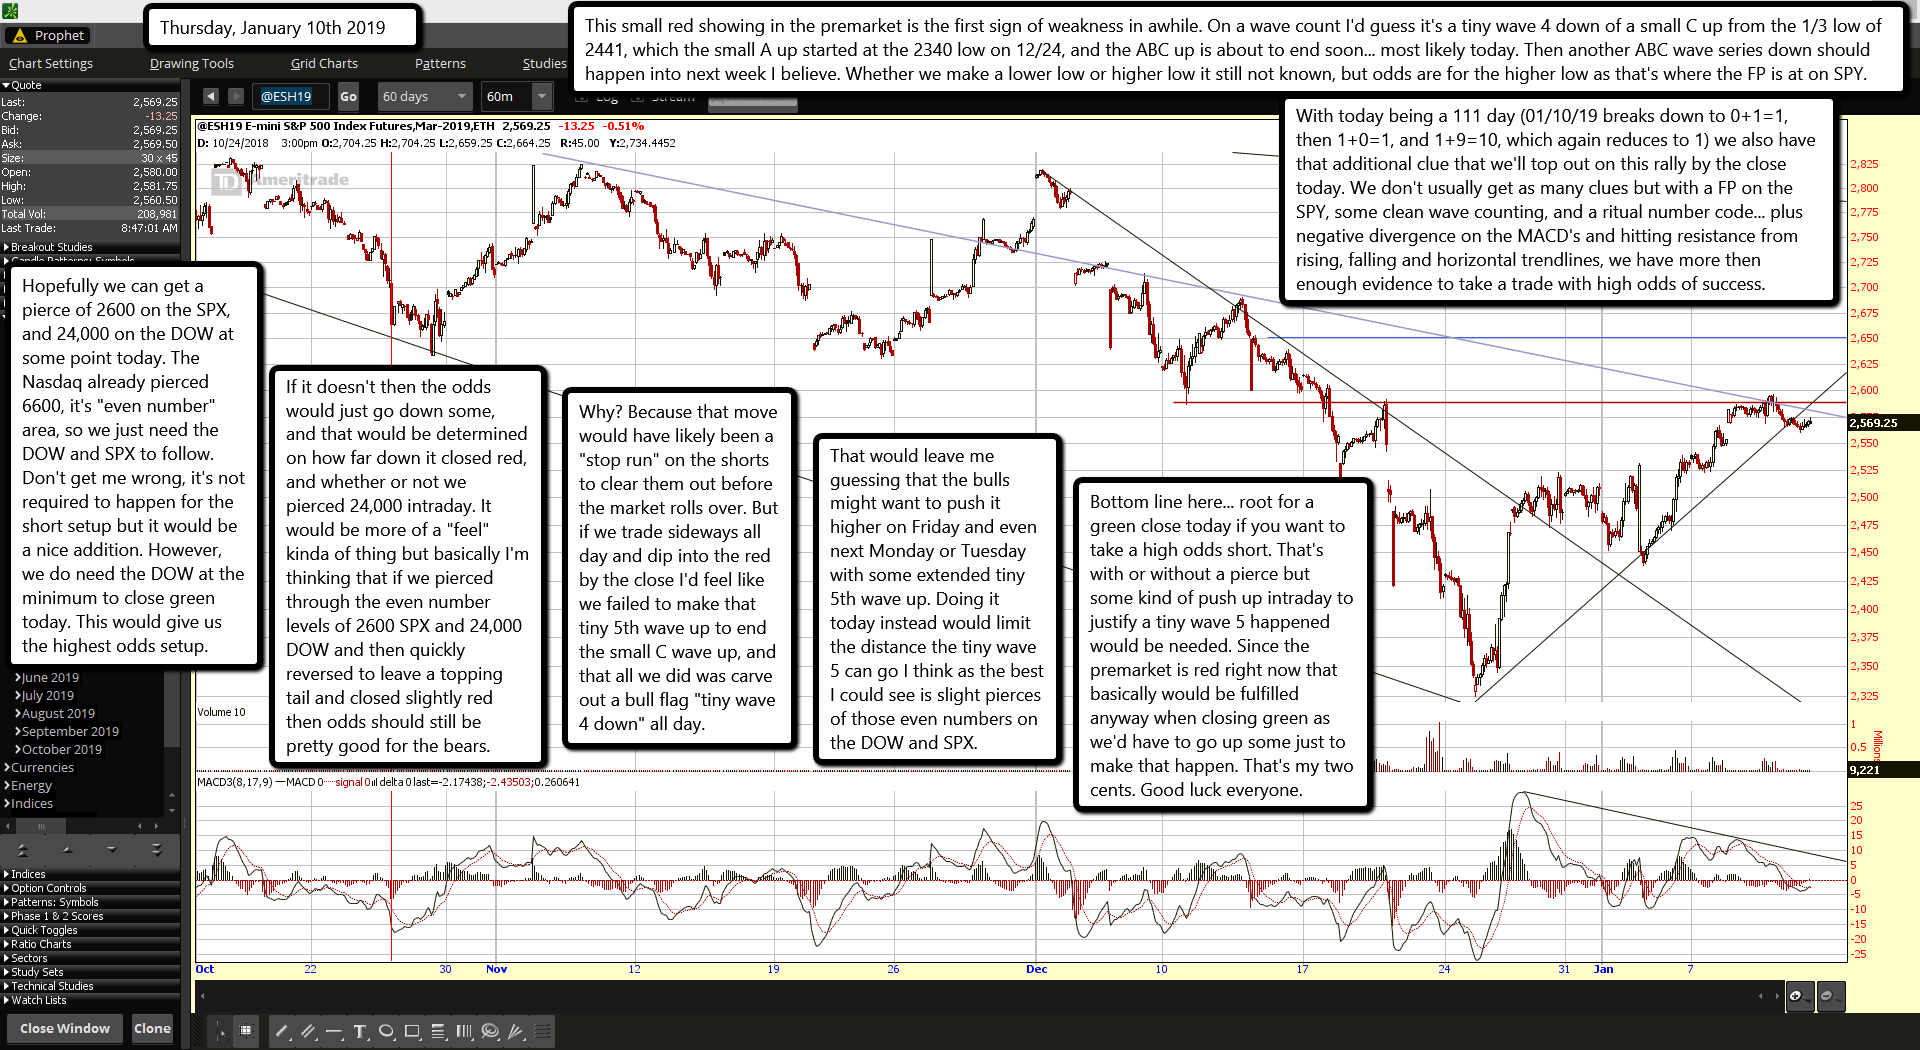
This small red showing in the premarket is the first sign of weakness in awhile. On a wave count I'd guess it's a tiny wave 4 down of a small C up from the 1/3 low of 2441, which the small A up started at the 2340 low on 12/24, and the ABC up is about to end soon... most likely today. Then another ABC wave series down should happen into next week I believe. Whether we make a lower low or higher low it still not known, but odds are for the higher low as that's where the FP is at on SPY.
With today being a 111 day (01/10/19 breaks down to 0+1=1, then 1+0=1, and 1+9=10, which again reduces to 1) we also have that additional clue that we'll top out on this rally by the close today. We don't usually get as many clues but with a FP on the SPY, some clean wave counting, and a ritual number code... plus negative divergence on the MACD's and hitting resistance from rising, falling and horizontal trendlines, we have more then enough evidence to take a trade with high odds of success.
Hopefully we can get a pierce of 2600 on the SPX, and 24,000 on the DOW at some point today. The Nasdaq already pierced 6600, it's "even number" area, so we just need the DOW and SPX to follow. Don't get me wrong, it's not required to happen for the short setup but it would be a nice addition. However, we do need the DOW at the minimum to close green today. This would give us the highest odds setup.
If it doesn't then the odds would just go down some, and that would be determined on how far down it closed red, and whether or not we pierced 24,000 intraday. It would be more of a "feel" kinda of thing but basically I'm thinking that if we pierced through the even number levels of 2600 SPX and 24,000 DOW and then quickly reversed to leave a topping tail and closed slightly red then odds should still be pretty good for the bears.
Why? Because that move would have likely been a "stop run" on the shorts to clear them out before the market rolls over. But if we trade sideways all day and dip into the red by the close I'd feel like we failed to make that tiny 5th wave up to end the small C wave up, and that all we did was carve out a bull flag "tiny wave 4 down" all day.
That would leave me guessing that the bulls might want to push it higher on Friday and even next Monday or Tuesday with some extended tiny 5th wave up. Doing it today instead would limit the distance the tiny wave 5 can go I think as the best I could see is slight pierces of those even numbers on the DOW and SPX.
Bottom line here... root for a green close today if you want to take a high odds short. That's with or without a pierce but some kind of push up intraday to justify a tiny wave 5 happened would be needed. Since the premarket is red right now that basically would be fulfilled anyway when closing green as we'd have to go up some just to make that happen. That's my two cents. Good luck everyone.
ES Morning Update January 9th 2019
The market is looking very tired right now and the futures are trapped at a point of resistance. I'm still rooting for a gap fill by tomorrow from 12/13-12/14, which is the open 2 points between 2649.00-2651.00. That's my ideal shorting spot for the next move down. But we can't see any pullbacks prior to that where the market closes red. We need multiple green closes to continue today and tomorrow for this perfect setup to happen.
Any drop into a red close today can reset this perfect bearish setup and open the door for a lot more upside in the coming days. It's kinda like a game of football where a green close today will be the 3rd down and a green close tomorrow will be the 4th down. Touchdown would be a new all time high, and that's just not happening from this level on the 3rd down.
So the bears need to make sure they don't throw out some penalty (a red close) that gives the bulls another 4 downs to run the market up higher. Make them turn the ball over tomorrow with a green close on the 4th down and bears can run the market back down hard in the coming days.
The DOW is the main leader here and if the various ETF's are mixed between red and green at the end of the day it's the DOW that needs a green close the most. The SPX, Russell and Nasdaq could close red slightly and we should still be ok for the today being the 3rd down for the bulls. Now, as for that gap fill... it doesn't have to close. But if the bears want to take the market deeper in the coming days to weeks then they want it closed.
Having open gaps on the upside just begs for the bulls to return to that spot at sometime in the near future. Best to get it closed so it can be forgotten about and then the bears can just open another can of whipass on the bulls. But don't worry about the bulls as they will get their turn to return the beating on the bears with a nice summer rally.
For the short term though lets see if the bears can take back control this Friday. Their mission is (should they decide to accept it?) to let the market close green today and tomorrow. Can they resist the urge to attack? Only time will tell.
ES Morning Update January 8th 2019
Yesterday after the bell there's a new (possible) FP that showed up on the SPY. It's pointing to 245.29, so once the market tops out today, tomorrow or Thursday I'd expect that to be its first stop on the way back down. Usually the market will go the opposite direction of any FP first (up in this case) and then once it has completed that move it will go to the FP.
And usually these intraday smaller FP's will be hit within a few days. The futures are currently up, which makes sense with my FP theory. I posted a chart in the chatroom yesterday showing a gap on the futures at 2649.00-2651.00, which is also on the SPY from 12/13 to 12/14 and shows a 9 cent gap.
The exact level is 262.59 to 262.50, so that should be filled at some point in the future. Of course it doesn't have to be filled on this first rally up from the low as we could drop back to that possible FP from yesterday first and rally back up later this month to fill both those gaps. That's actually a better plan for SkyNet to fool the most people in my opinion.
Others have zones of 260-262 on the SPY as their upside targets, and you know that when every good trader is on the same page it rarely works out. The falling trendline I drew (light purple) and the horizontal trendline (red), as well as a rising black trendline all point to a zone of resistance.
So while I'd love to see that gap filled overhead SkyNet might have other plans? The bottom line here is we are very likely within 1-2 days of a top and drop (to that new downside FP at least). I'm just playing what the market gives me and not counting on that old gap to be filled right now as it might not get hit until the summer for all I know? Good luck as always.
ES Morning Update January 7th 2019
Charts are pretty mixed today and I don't see any clear direction. I do think we'll get a nice setup at some point this week that will give us a high odds short or long. I've drawn some trendline on the ES 60 minute charts and I'll be watching them to see how the market reacts when (if?) they get hit today or tomorrow. As far as wave counts it's still unclear if the bottom is in or not yet. We have a clear large A wave down from the Sept/Oct high in 2018 to the 10/29/2018 low.
Then a large B up into 11/8/2018 high. Next was the large C down that subdivided into 3 or 5 medium waves.. and that's the part which we don't know yet. If just 3 waves then the low is in, but if 5 waves then medium wave 1 down ended on 11/26, then up for medium wave 2 to end on 12/3, followed by medium wave 3 down into the current low on 12/26 and that puts us in medium wave 4 up with medium wave 5 down still to come.
This is all inside large wave C down which all 3 large waves (ABC) are part of extra large A down. If the low is in for the entire extra large A move down then we are starting the extra large B up that should take 5-6 months or more and top out at 2800+ I'd guess. Again, there's no way to know if we still have a medium wave 5 down of large wave C down of extra large A down... or if there was only 3 waves in large wave C down (which if so, they would have already been completed with the current low).
The important thing to focus on here is first... catch the top of this current wave up, no matter what it ends up being called, and then catch the bottom of it so we can go long. That bottom will either be a higher low or lower low, and that will determine the wave count. With negative divergence on this 60 minute chart I have to think a down move is near... like within a day or two. Lets see what happens.
ES Morning Update January 4th 2019
Not much to add that wasn't said previously either in the morning post or in the free chatroom throughout the day. The bulls and bears are fighting it out in this zone and neither is winning yet. I looks like a series of wave 1's down and wave 2's up, which suggest the bears will win at some point soon (like next week some time) with some wave 3 of 3 down or something. But the sideways action "might" be viewed by others as a bull flag, so that's something to consider too.
The bottom line here as that one could make a case for the bulls just as easily as the bears. The monthly, weekly and daily charts are all still very bearish but the daily is still very oversold and trying to come up from that extreme low. The 60 minute chart became overbought on the MACD's a few days ago, which is likely why the market is struggling in this area. But the MACD's are still very oversold coming up from about -30 to just above -20 right now.
The Full Stochastic's have dropped from +80 to under +20 right now. They suggest a short term bounce (which we see in the futures this morning). My thoughts are that we need to see that Full Stochastic go back up to at least +70 and the MACD's to reach the -10 to -15 zone all while the Histogram stays positive but makes a low high to setup negative divergence.
This could take several more days I think but if that happens and the market doesn't breakout of the current sideways trading zone then the bears will have a perfect setup for another nasty drop. Time frame would be late next week for that to happen. If it did then I'd like to see a lower low in the price of the SPX but higher lows on the MACD's to setup positive divergence afterwards. Then I'd think the bottom would be in for awhile (several months) and the bulls could squeeze the bears into Spring/Summer for a lower high then the all time high last September.
The other scenario that might happen is that the bulls decide that they don't want to give the bears another lower low to setup that positive divergence and a multi-month rally, so they instead snort some crack to give them enough energy to ram it up hard the next few days into the 2550-2600 zone (a C wave up), which will of course exhaust them big time and cause worst damage later on when the bears take it back down even harder. This in my opinion would be very bearish as then I could see a multi-month down move... like into March or so before it bottoms.
If the bulls do this move (which would look like an ABC up from the lows) they are asking for more pain in the near future. They would be wise to continue to chop sideways another few days and let the bears take it down for a slightly lower low so positive divergence will form and then they can have a multi-month rally to have fun with. We should know in a few days which scenario is likely going to play out.
If we stay under the recent prior highs (around 2520-2525) then I'll be looking for that drop to start late next week to make a slightly lower low. It would then be called a 5th wave down (of a larger C wave down) and end the first larger ABC down from the all time high of 2940 SPX last September. Next would be a multi-month ABC up into Spring/Summer. I believe this is how it's going to play out but I won't know for sure until next week. Have a great weekend.
ES Morning Update January 3rd 2019
So far so good for the bears at least. The market took the bearish path yesterday by not taking out last Fridays high and then selling off into the close but closing green. Then afterhours it dropped more and again did not take out the afterhours/premarket low from Monday to Tuesday. Now it's bouncing back up some in the premarket session from a deeper low earlier this morning.
This should be setting up another wave up and wave down, which again if it doesn't take out yesterdays high and closes green again today (preferred but not mandatory) then bears will have pulled off another perfect setup for a wave 3 of 3 (or 3 of C) down to start on Friday. I should know more by midday today but you are a bear you want to root for a green close but just barely, and ideally below the 2520 high yesterday on the SPX.
If you are a bull then you'll root for a down day that closes below the low yesterday as that could kill (or delay to reset it for some future date) the bearish setup forming right now. For example, a drop down to hit the falling trendline (pointing to just below 2400 right now) would be perfect for the bulls to rip it higher on Friday and into next week. But if the bears want to drop it hard they will be working on setting up a wave 3 of 3 down into Friday by closing it up today to get the wave 1's and wave 2's out of the way and all set up in perfect alignment so a big drop will follow. Good luck to both you bulls and bears out there.