Saturday, July 25, 2026
Home Blog Page 44

ES Morning Update September 4th 2018

0

Hope everyone enjoyed the 3 day weekend and worked twice as hard on Labor Day... after all it's supposed too be a day of hard labor right? Kinda reminds me of Life Insurance that doesn't pay anything while you're alive but instead pays out when you're dead. Shouldn't it be called Death Insurance? Just more backward thinking in an upside down world I guess... LOL.

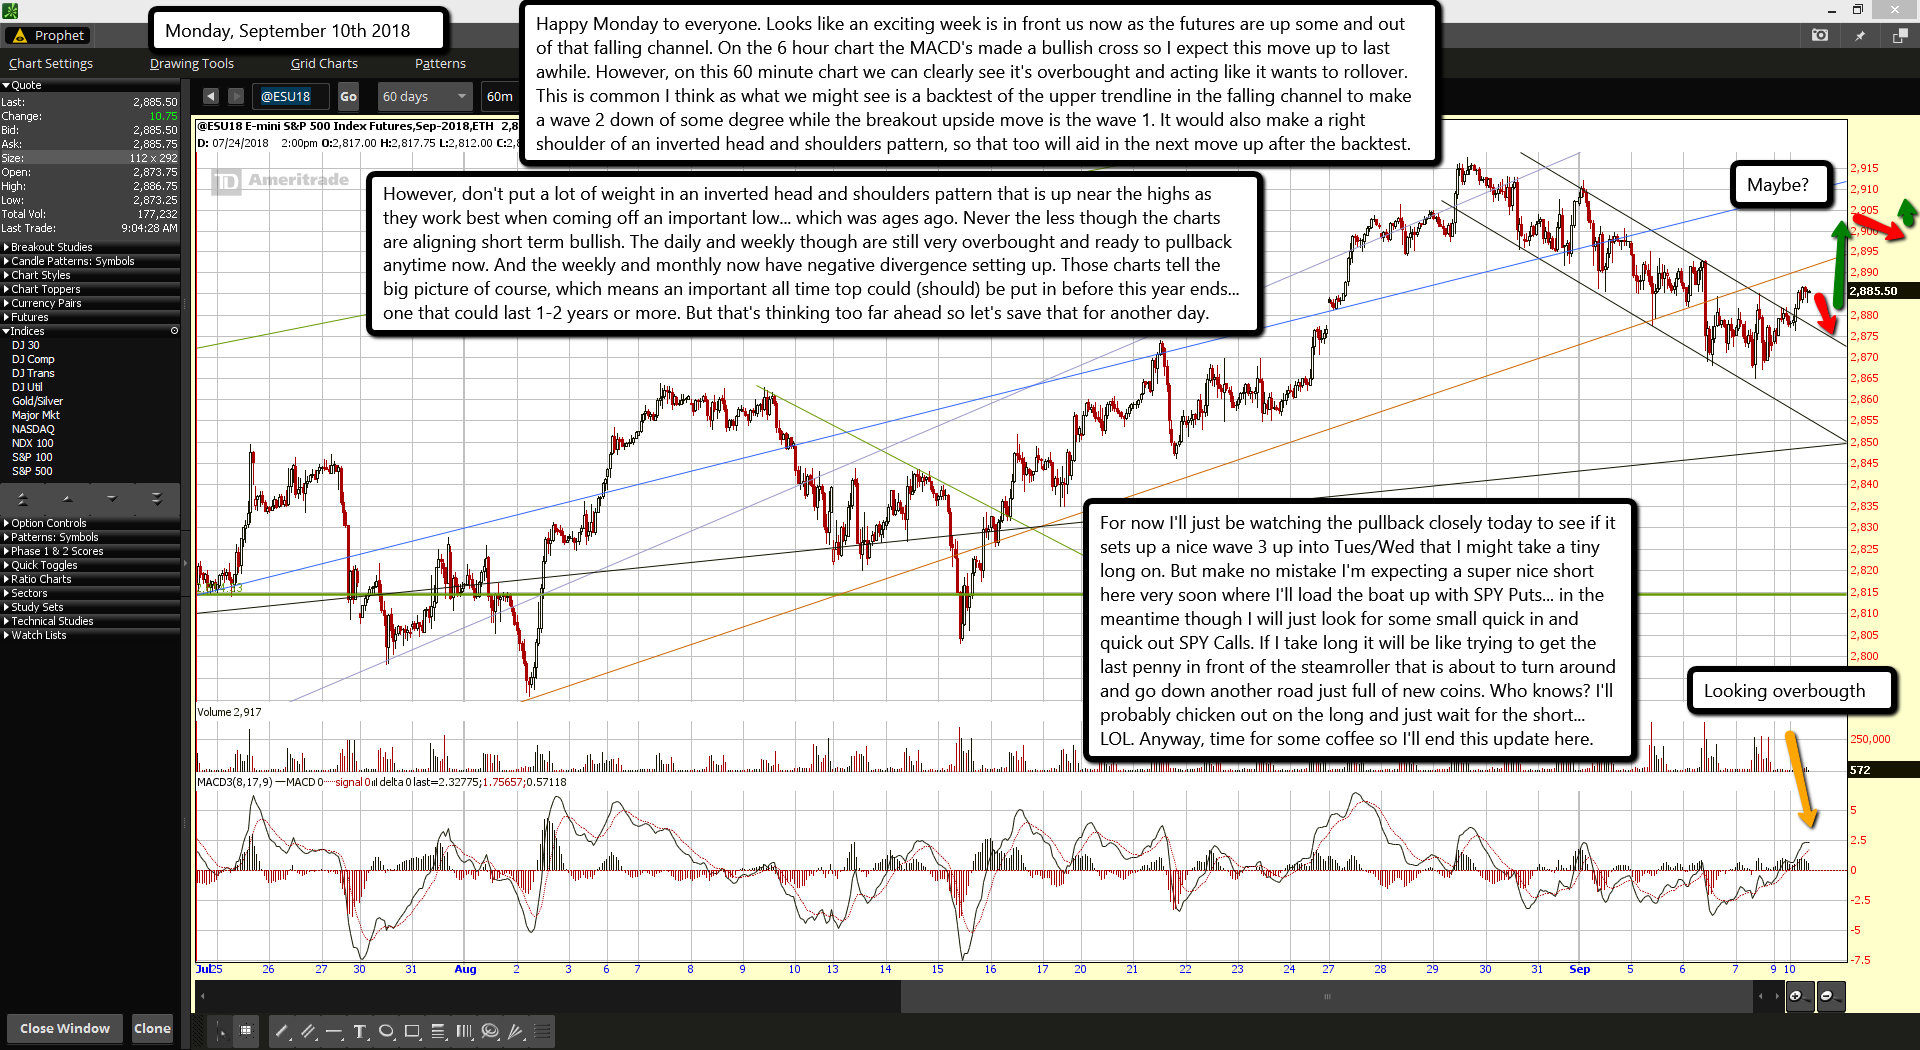
Anyway, this morning we see some early weakness in the futures but nothing big. However the MACD's on the 6 hour chart look super bearish right now and could just fall off a cliff at anytime. On this 2 chart though the MACD's are trying to put in some positive divergence, so we might turn back up in the second half of the day. Since traders will be slow coming back to work this first day back there shouldn't be too much selling pressure at the open... meaning that if the bulls can hold the line the first few hours of the day odds favor them rallying into the close.

I don't expect some breakout high though but the could close today green if they just hold the morning session as time will be on their side. However, that 6 hour chart is quite weak so if the bulls fail to hold the line early today we could see a very nasty drop happen. I'd guess that line in the sand is around the 2885 area where there's that rising brownish orange trendline of support.

Preferably though the bulls should hold the low from Friday of 2891.75 but that might be too hard for them this morning as they have already tested that level exactly in the premarket and another test of it will likely fail to hold. So, for today I'm mixed on whether the bulls will hold on or the bears will drop it hard. I'm leaning toward the bulls because of the expected light volume on the the first trading day back after a long weekend. On the upside though I do not see another higher high as possible for today.

On the downside I previously pointed out support in the 2885 area but if that breaks we could quickly see the 2860-2870's. On the medium scale picture this week should be a critial one. If the bears put too much pressure on the bulls here and decide to drop the market then the bulls could regain enough strength to rally for several more weeks, and then I'd expect them to run for SPX 3000 or much more.

It might last several months if the bears drop it deep enough today. I'd say we'd need to see the 2820's to 2840's to restart the bulls for that kind of run up. I put those odds as low. However, a drop into the 2860-2870's could give the bulls at least two-three weeks of rallying, with SPX 3000 still very possible. In other words, the bears should not try to pounce on the bulls today but instead give them a few more points today and tomorrow to exhaust them to the point where they just rollover and die. Give them 30-40 more points on the upside and that should just about do it for the bulls.

In fact if we closed green today on all the indexes (especially the DOW as it's the lager here that hasn't hit a new all time high yet), and close green again tomorrow (with the SPY hitting the FP from 2/27 of this year) then the bears should bring out the bears and condiments along with firing up the grill as it will be party time for them and bull steaks is what they'll be grilling. It will be a very bearish September and October if the bulls continue to grind up today and tomorrow with two green closes and the FP hit.

But if they allow the bears to take it down today then the bulls will get a nice rest and therefore will be ready to stampede again and the bears will be under their feets when they do. If you are bull you want a deep pullback today. If you are a bear you want a small rally and another little strong rally tomorrow. If neither happens then the charts will remain mixed with no clear direction either way.

ES Morning Update August 31st 2018

0

Well, we finally got the pullback for the wave 4 near the close yesterday. Today it's down a little more in the premarket as it looks for a bottom to end it. Next week I'm expecting a final rally up into the SPY FP area to complete the 5th wave up of many wave 5's. From there we should be heading down for a few months. This coming drop is likely to be a deep one. It's too early to say right now how much but it should end up being some Fibonacci level of the move up from the January 2016 low to the coming September 2018 high... yeah, it's that kind of drop. It might end up being called a crash before it's said and done.

Looking at some estimated levels the 38.2% retracement down would put the SPX around 2500, and that's a scary drop! Even the 23.6% level of 2660's is scary. Now again, it's too early to know as yet. For now we are just waiting and watching for this 5th wave up to end, which I think it will happen sometime next week. The current wave 4 down should end today or over the weekend. The 2880 area is support from a rising brownish orange trendline, but I don't think it will get that low today with such light volume expected.

Possibly we turn up small today and drop over the weekend and into next Tuesday morning to put in that low? Then a nice rally up into the mid-2900's to squeeze out all the bears and lure in the bulls looking for 3000. Today is a hard day to call as it could drift down all day or turn back up small and then drop into early next week so I'm not interested in trading it. I would be interested in the long for a few day trade as I know the upside target area. Anyway, let's keep this post short and just wish you all a happy labor day weekend.

ES Morning Update August 30th 2018

0

Looks another light volume day is upon us and it should be even lighter on Friday. Today I don't expect much more action then yesterday. I'd be shocked if we put in a big down day as at best I don't see anything over 10 points down, and I'm really hoping for another strong up day where we reach that FP on the SPY from 2/27/2018... but I get the feeling that will be pushed out into next week. SkyNet is tracking all the put and call buyers and I'm sure it can keep this market going sideways for another week or so if needed to load up the boat on all call buyers and next to nothing on the put side. Only then will see a top and strong reversal back down.

Next week is the first week of September so the volatility should return. Markets are closed on Monday for Labor Day so tomorrow, (while a full day) we should see traders leave early for the extended weekend. Bottom line here... don't expect much action today or tomorrow. However, if we hit the upside FP today or tomorrow I will certainly be interested in a short, but I just don't expect it to happen before this week ends. Next week (of the week after?) would be more likely. Even when it hits and reverses back down there will be the usual "buy the dippers" come in... meaning we should see a series of wave 1's down and wave 2's up for 2-3 weeks I'd guess before the big drop happens. If this lines up like I think it could we should see another 1000 points drop on the DOW one day late in September.

They could change this plan of course but the charts are lining up now for a nice large drop to happen. A series of small downs (10-30 SPX points) and small up's sets up the large down move, but if the bulls want to avoid this then they will have to give up more ground and allow a few medium drops (like 50-100 SPX points) to happen so as to reset overbought charts and get them bearish enough for too many shorts to pile on and prevent any large drop from happening.

So if you are bear you want small (tiny is even better... like 5-15 points) drops and bounces to happen for several weeks so all the bears throw in the towel thinking it's never going down again as every dip gets bought. Only then can you release some negative news out by the propaganda "fake news" media machine and get a large drop started out of nowhere. Remember that every large drop is pretimed in advance and the bad news is created to get the blame afterwards.

Nothing in this market is random. For example the August 24th, 2015 flash crash was planned 5 years in advance and foretold by two movies. One was called "Inception (2010)" and the other was "Lucy (2014)", which both had passports showing that exact date foretelling the crash. It's been this way forever I can only assume. The 1929 crash was known and planned years in advance as well.

In fact Winston Churchill was so excited about it that he wanted to be there in person to watch the craziness happen on the floor of the trading exchange the day of the crash. Back then you couldn't take a plane to America from England so he boarded a ship, which took two weeks to get to America. He knew in advance the day of the crash and left England two weeks prior so he could witness it live as people lost their entire life savings. The sick old bastard enjoyed seeing people suffer I guess.

But that's common among all the elite pedophiles as screwing the sheep giving them all pleasure. Anyway, enough about that... you get the picture. For this coming large drop I don't have any passport codes unfortunately but I'll be very focused on the September 5th-12th time period as that's when the elites meet in Rome to launder their money threw the Vatican bank during the next Legatus Pilgrimage. They had a similar pilgrimage in October of 2008... coincidence I'm sure. Have a great day.

https://legatus.org/event/rome-pilgrimage/

ES Morning Update August 29th 2018

0

Nothing much has changed since yesterdays post, except that the MACD on this 2 hour chart has fallen from about +8 down to the +2 area... which suggests a turn back up is near. Maybe that turn happens late today or tomorrow? Naturally it should make a lower high on its MACD levels and a higher high on the actual ES Futures price. Since we have very light volume this week and a three day holiday weekend coming up I have to think that they will go up again before the week ends.

And eventhough Friday is open for trading you might as well call it a 4 day weekend as many traders will leave early that day or take it off completely to get started on the Labor Day vacation. What would be a shocker would be to put in a high on Thursday or Friday (I say Thursday as there could be some light selling on Friday as traders close out their long positions before the weekend) and then open up next Tuesday with a nice gap down.

Blame on it something said over the weekend or whatever. We all know it's very overdue for a pullback so it won't be a surprise to us. I'll keep this post short as like I said... nothing has changed. I'm still looking for a little more on the upside to top out this rally and start a pullback/correction. Wave count suggest this sideways action is some kind of wave 4 and a 5th wave up is next. We shall see I guess... have a great day.

ES Morning Update August 28th 2018

0

So far so good. The futures are up small this morning and if they pullback any today should be the day. But again, I'm not expecting any large drop until the upside FP is hit from 2/27, which isn't too far away now. Possibly we are in some kind of wave 3 up since late last week and a tiny pullback today would make the wave 4 down, which leaves the wave 5 up into the FP tomorrow or Thursday from what I can speculate on for a time frame. If no tiny pullback then possibly we are already in the 5th wave up? Really hard too say for sure. Doesn't matter to me as I've seen the FP's work over and over again, so I'll just be waiting for it to hit and pierce through a little and then I'll know there's a turn back down coming afterwards.

How far down you ask? I don't know? Unfortunately I don't have a downside FP to give me that answer, but it should be a minimum of a 100 points with 200 points not out of the question. There should also be something in the news to spark the sell off and take the blame for it. I'm surprised that it's going to happen before the elections this November but if it's fast it could be totally reversed back up before November gets here. So I guess it's better to do it at the end of August or early September then late October... at least from a political point of view.

Back to the short term... for today I really don't see much upside likely. If anything today would be a good day to pullback small or go sideways all day to make a bull flag for tomorrow, or even Thursday. So get your coffee pot working as you are likely to need extra cups today to keep from falling asleep watching the tape go slightly down at best or sideways at most likely... or up at worst.  LOL.


ES Morning Update August 27th 2018

0

Here we go again gang... another rally at the open. I should have put two and two together and figured out that the FP from back on 2/27 was going to be the upside target before any large pullback/correction, but I kept thinking it was the final high for the year. Now it's obvious that we are going to hit it here very soon... like this week possibly. This tells me that the end of the year high is going to be well over SPX 3000 as I do believe the DOW will hit a double top at minimum, if not a slightly higher high before this bull market rally ends.

Based on where the DOW is now that puts the SPX to at least 3000, and this should all happen before 2018 ends. But for the short term I'm just looking for that old FP to be hit this week or next to top out the current rally and allow a nice pullback of 80-100 points or more on the SPX. These 20-30 point pullbacks are probably all we'll see until this FP is hit.

We could see one start day from the looks of the VIX as it has not fallen to match the up move in the futures, and in fact it's actually up from Fridays close. This tells me the gap up open this morning might get reversed. I'm not planning on playing it as I'd rather wait on that upside FP to get hit for a bigger drop to short. Plus there's now way to time it successfully or know how far it will pullback... only that it's possible due to the VIX being elevated this morning.

Also, the VIX being up today could be just one of several days it does this as the market rises. Meaning it could be an early warning sign that a top in near, which again I think will be the 2/27 FP level. Ok, as far as wave counts it looks like some kind of wave 3 of 3 up from the 2803 low on 8/15 is happening. What degree I'm unsure? But it's not looking like a 5th wave too me. So there should be at least one small pullback if not two of them before we end the 5th wave up.   This could drag on all week and even into next week.  But until that upside FP is hit I'm really not interested in a big short.  Anyway, there's not much else to cover this morning. Just another typical rally during the slow summer months.

ES Morning Update August 24th 2018

0

Yesterday one of the members of my free chatroom found another FP (fake print) showing a drop this time of 5.28% while the other FP from a couple of weeks back showed a 6.81% drop. Obviously these are signals that they plan to drop the market hard soon. The big question though is "when"?  They have a nact for dragging it out until the last minute when every bear has given up shorting... and then they drop it. Clearly from looking at the futures this morning it's not looking good for that big drop to start today, and it's been a long time since they closed up at some high level and dropped it hard on a Monday I'll have to guess that we'll see more of the same "shaken' out the bears" moves early next week.

That leaves the middle and the end of the week for the fireworks to start. I believe this delay has been because there's still too many bears in the market. Now I do think this move down starts the bear market that I think is coming. Instead I think it's just a much needed drop to get the next big move up started, which should take us into the end of the year with an upside target of 3000+ on the SPX. Hard too know the level exactly of course as if there's too many bears shorting at that level then who knows, maybe they hit 3100?

Anyway, for today I'm just looking for more of same as yesterday. This is a grinding process where they aren't giving the bulls much more to get excited about but not letting the bears eat either. But, there is a small possibility that they are going to take it up to a FP I found on 2/27 that isn't too much higher... and then they drop it hard. I kinda thought this upside FP was for the end of the year but since we aren't that far away now they could squeeze it up to that level into the middle of next week and then start the next move down. That's it for today... have a great weekend.

ES Morning Update August 23rd 2018

0

Yesterday gave us the move up and a small move down. Today looks like up again but I don't think it will be much. Like looks like a wave 1 up wave 2 down combo times two... meaning that if we close up again today we could see a 3 down of 3 down on Friday. I still do not believe this market is ready to just continue a slow grind higher each day without a significant pullback first. Too many bulls looking for much higher prices in my opinion. Bears are looking for a crash that's delayed the pullback. They need to go to sleep and then the market can drop hard and shake out all the bulls. But for today it looks like a repeat of yesterday, a boring day. Maybe I'll take a nap today (since I'm a bear here) and then wake up to carnage at wall street.

From a technical point of view I really don't see much clues. It's mixed on various time frames and charts as some support the bulls and others the bears. Overall this is just a hard place to predict the next big move... which I think is down. But for today it doesn't look like that's ready to start. I think it's going to happen afterhours or premarket when everyone can't get in or out. A gap down and go type day is what I'm expecting. Will it happen on Friday or Monday... or never? I just don't have the answer but the market is primed for such a move... picking the exact day is something only the insiders know.

ES Morning Update August 22nd 2018

0

Yesterday the market made a new all time high, but late in the day rolled over and sold off a large amount of those points gained. Then afterhours it dropped more. What was the reason? Main stream media is blaming it on a guilty plea of former attorney and admitted “fixer” Michael Cohen, who was the campaign manager for President Trump. Politic's is the blame this time, but we all know that really has nothing to do with the pullback. The market is simply overbought and when it finally hit the double top it decided it was time for a rest.

Afterhours on the SPY we see a "possible" FP of 286.34 around 6pm EST. It's almost the same level as the open so it might not be a real FP but instead just a late fill. However, real or late fill, that target could still be hit today so don't just dismiss it right of the bat. Overall though I think the top is in and we are in a pullback mode until the end of this month.

That rising brownish orange trendline acted as support on the afterhours drop and is still holding. If it breaks I'd look for the 2825-2935 zone for the next support. That zone would make a nice ABC down move if it's hit as it does look like this mornings up move is a B wave of some degree and the A down was yesterdays drop.

Many are expecting this to be a brief pullback and then on up to more new highs, which I can't blame them as the futures would make a nice inverted head and shoulders pattern if it drops for that C wave. But it's up at a top and personally I think IH&S patterns fail just as often as they work when up high or new a top. They work great at bottoms but we are nowhere near any bottom obviously. Regardless of the IH&S pattern forming or not I just don't see another new high anytime soon. That should be the high for a month or more. From here we should be going down into a low by the end of August. Then we rally hard again. Bulls will likely keep buying this pullbacks at that should keep the market from rising much. Good luck to them...

ES Morning Update August 20th 2018

0

This morning we see the futures up a little in the premarket session. Looking at the 6 hour chart of the ES it's still going up nicely on its MACD's with no sign yet of it rolling over. That tells me that we'll need the 60 minute and 2 hour charts to rollover first just to get thist 6 hour MACD to make a hook down. It also means the first move down should be followed by a bounce back up to set up some negative divergence on both the 60 minute and 2 hour MACD's. In simple terms it means we should have a clean wave 1 down and wave 2 up (or A and B) to setup the larger drop that would follow (the wave 3 or C).

I do not think this will happen today but we could see it by Wednesday or Thursday. It depends on how long it takes to carve out the first wave down and second wave up. Of course some news event could speed it up but I can't predict the unknown. There's the FOMC Minutes being read again from the last meeting coming up this Wednesday, but that shouldn't be a market mover. There's more China tariff talks this week too I believe, and that can certainly move the market. But again, timing the release of news events that move the market is really impossible.

But if I were to guess I'd think this market will become overbought and line up that negative divergence and put in the wave 1 down and 2 up (possibly a couple of wave 1-2 series) by this Thursday (maybe Friday) where I think would be the best time to release some negative news to get the bear party started. But early in this week I really don't see much holding for the bears if a drop happens. It should be another "buy the dip" moment and the bulls never skip those feeding times it seems. For resistance the obvious current level is where we are at right now as it's the 6/7 to 6/9 2860's area.

For support we have the rising brownish orange trendline pointing to around 2845 today. Then the 2825 level from a black rising trendline and prior lows from 8/13. That area would make a right shoulder for an inverted head and shoulders pattern if the market pulls back into that level this week. But rarely do we see a nice and obvious H&S Pattern play out perfectly like that. Usually the left or right shoulder is higher or lower then the other.

So if the market wants to make this pattern and take off even higher to the upside then I think the best scenario would be for the bulls to stop around that rising brownish orange trendline of support or a small peirce of it... then another strong move up could happen. Anyway, for today I don't see the overhead resistance being taken out and I think the rising brownish orange trendline of support will hold.... basically it looks like a rangebound Monday. I'd love to see a big drop here but I'm not holding my breath on it. Good luck as always.

ES Morning Update August 17th 2018

0

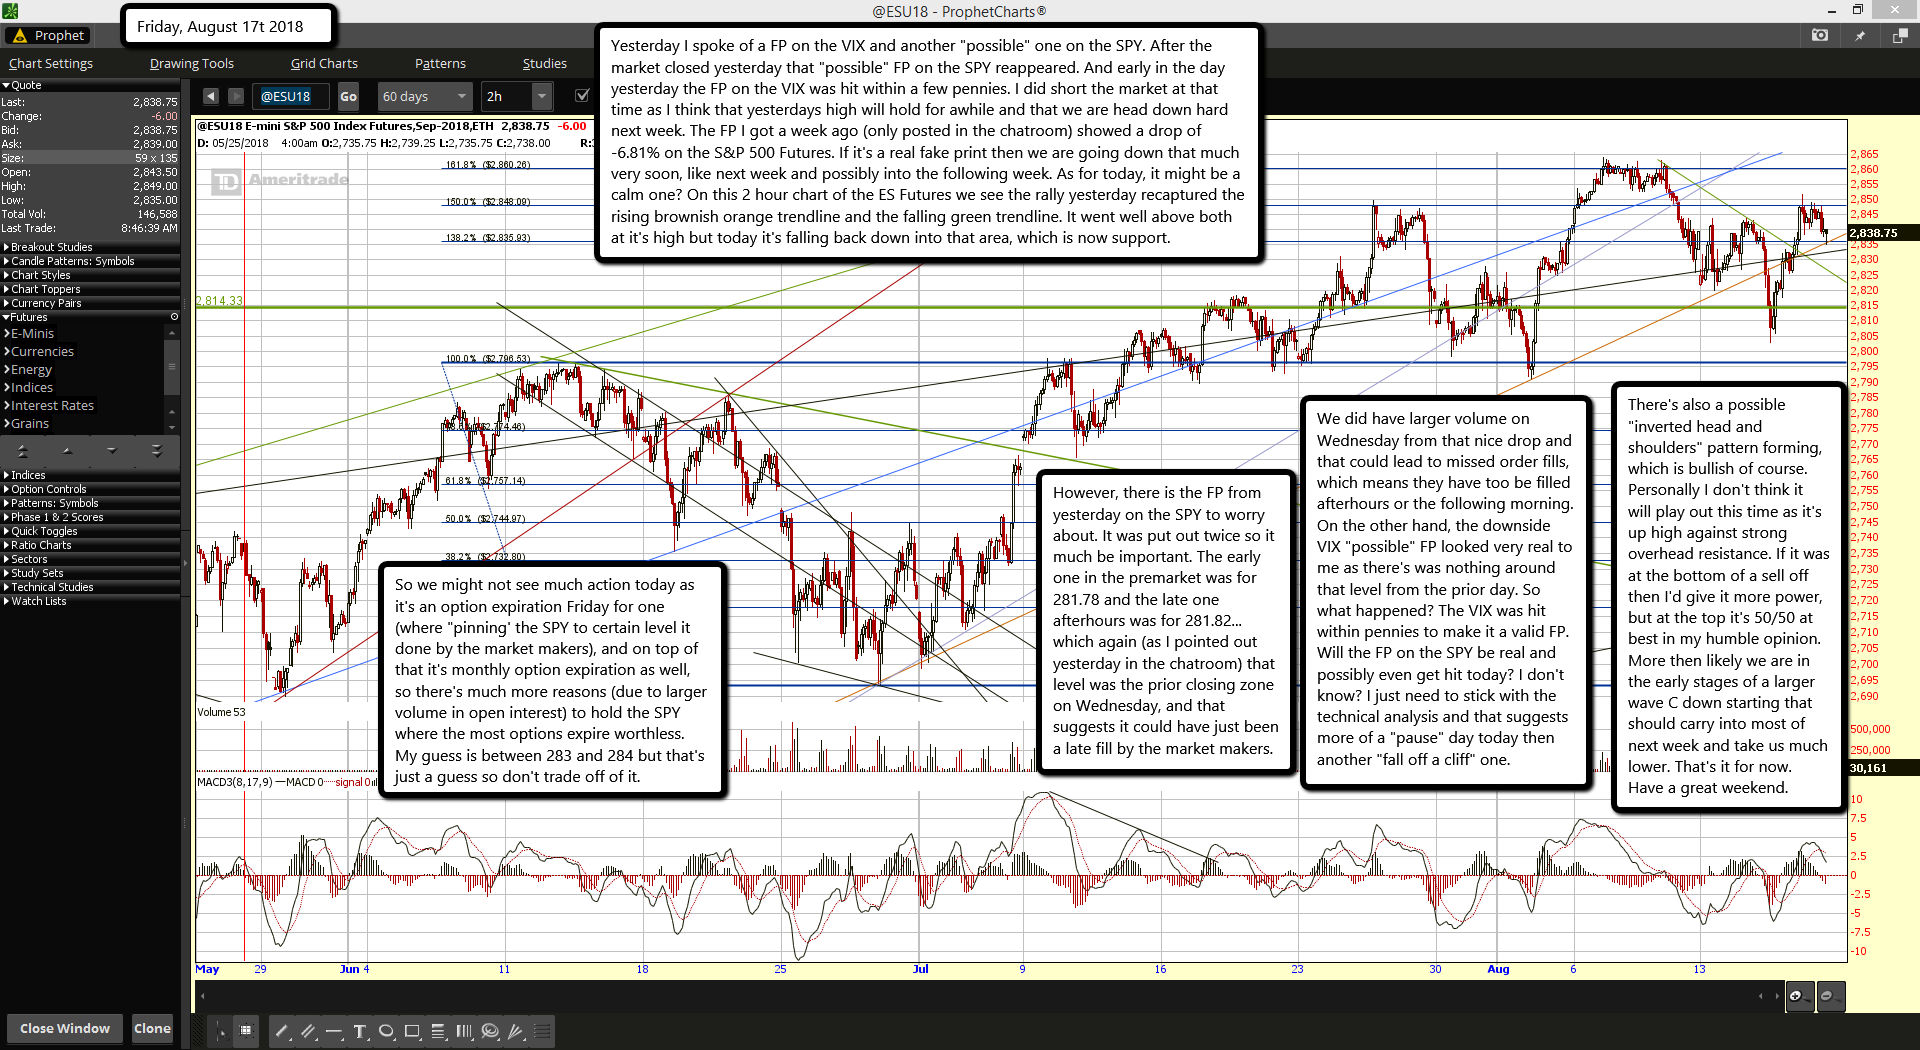
Yesterday I spoke of a FP on the VIX and another "possible" one on the SPY. After the market closed yesterday that "possible" FP on the SPY reappeared. And early in the day yesterday the FP on the VIX was hit within a few pennies. I did short the market at that time as I think that yesterdays high will hold for awhile and that we are head down hard next week. The FP I got a week ago (only posted in the chatroom) showed a drop of -6.81% on the S&P 500 Futures. If it's a real fake print then we are going down that much very soon, like next week and possibly into the following week. As for today, it might be a calm one? On this 2 hour chart of the ES Futures we see the rally yesterday recaptured the rising brownish orange trendline and the falling green trendline. It went well above both at it's high but today it's falling back down into that area, which is now support.

So we might not see much action today as it's an option expiration Friday for one (where "pinning' the SPY to certain level it done by the market makers), and on top of that it's monthly option expiration as well, so there's much more reasons (due to larger volume in open interest) to hold the SPY where the most options expire worthless. My guess is between 283 and 284 but that's just a guess so don't trade off of it.

However, there is the FP from yesterday on the SPY to worry about. It was put out twice so it much be important. The early one in the premarket was for 281.78 and the late one afterhours was for 281.82... which again (as I pointed out yesterday in the chatroom) that level was the prior closing zone on Wednesday, and that suggests it could have just been a late fill by the market makers.

We did have larger volume on Wednesday from that nice drop and that could lead to missed order fills, which means they have too be filled afterhours or the following morning. On the other hand, the downside VIX "possible" FP looked very real to me as there's was nothing around that level from the prior day. So what happened? The VIX was hit within pennies to make it a valid FP. Will the FP on the SPY be real and possibly even get hit today? I don't know? I just need to stick with the technical analysis and that suggests more of a "pause" day today then another "fall off a cliff" one.

There's also a possible "inverted head and shoulders" pattern forming, which is bullish of course. Personally I don't think it will play out this time as it's up high against strong overhead resistance. If it was at the bottom of a sell off then I'd give it more power, but at the top it's 50/50 at best in my humble opinion. More then likely we are in the early stages of a larger wave C down starting that should carry into most of next week and take us much lower. That's it for now. Have a great weekend.

ES Morning Update August 16th 2018

0

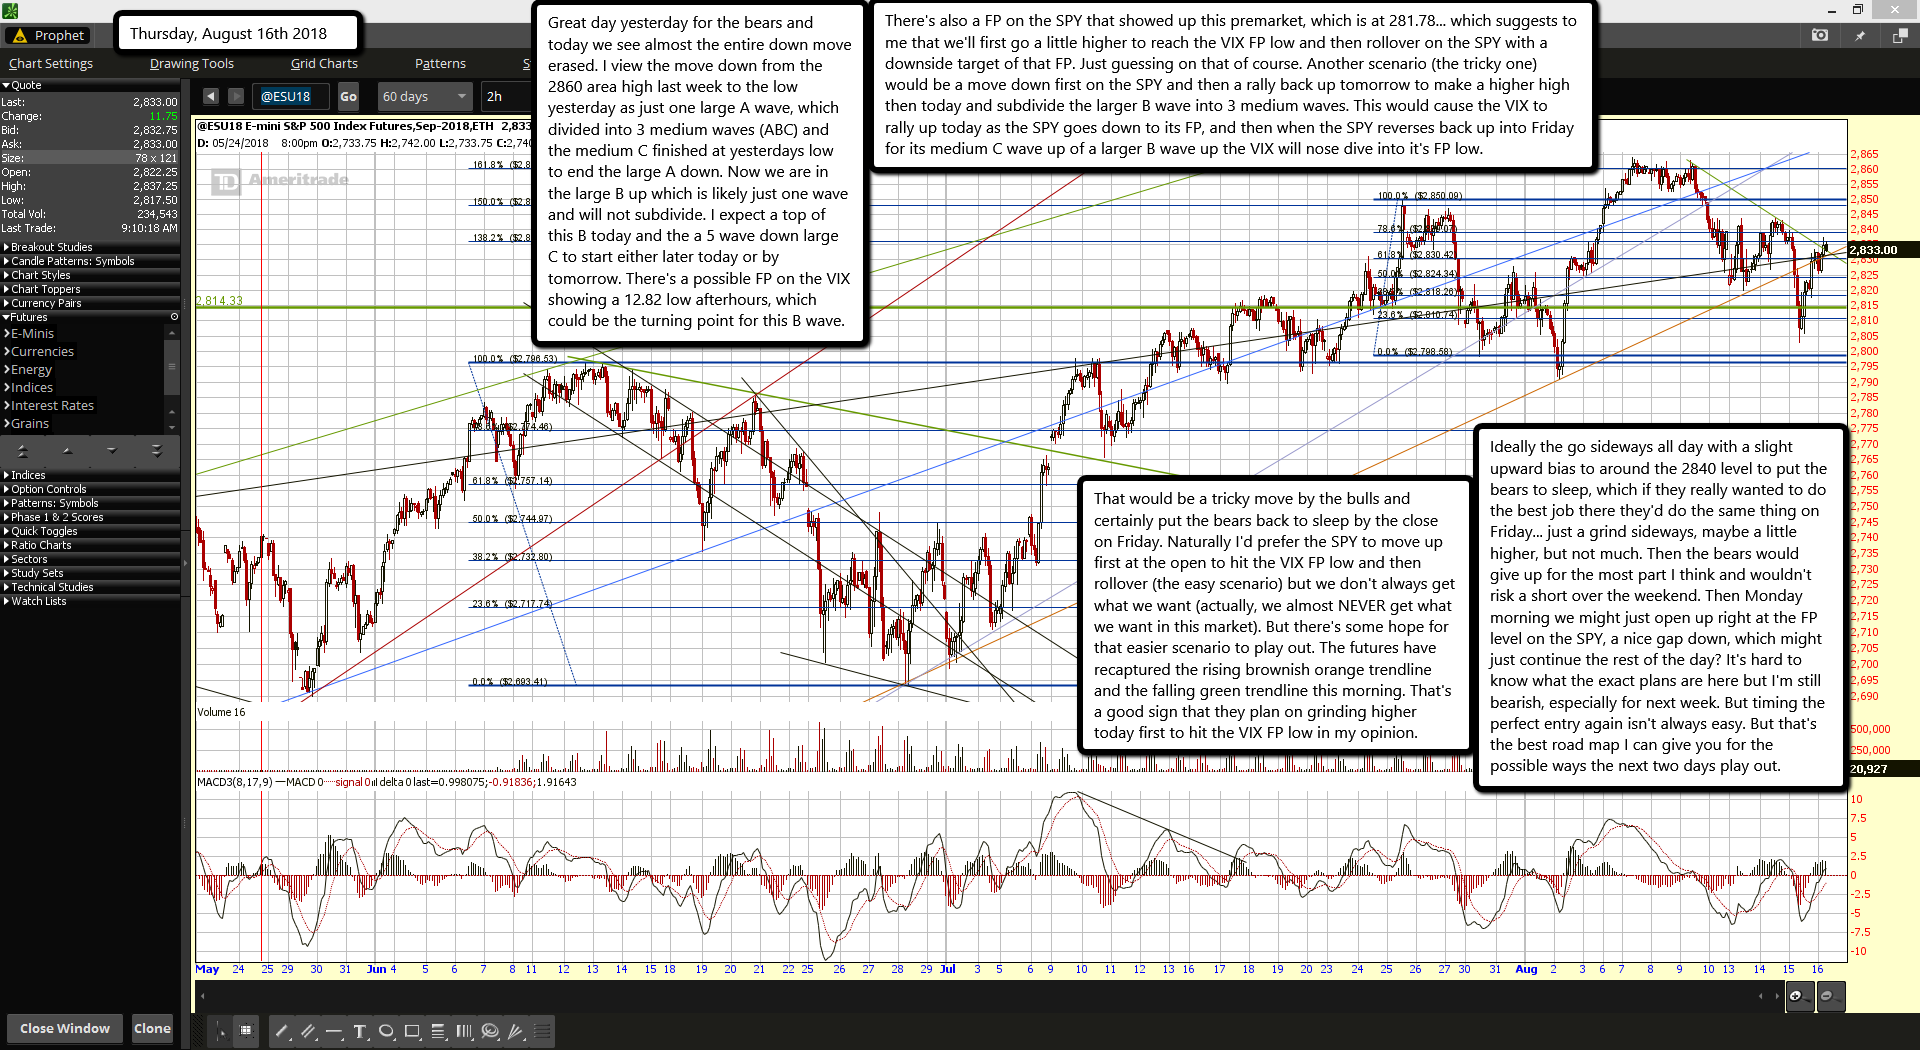
Great day yesterday for the bears and today we see almost the entire down move erased. I view the move down from the 2860 area high last week to the low yesterday as just one large A wave, which divided into 3 medium waves (ABC) and the medium C finished at yesterdays low to end the large A down. Now we are in the large B up which is likely just one wave and will not subdivide. I expect a top of this B today and the a 5 wave down large C to start either later today or by tomorrow. There's a possible FP on the VIX showing a 12.82 low afterhours, which could be the turning point for this B wave.

There's also a FP on the SPY that showed up this premarket, which is at 281.78... which suggests to me that we'll first go a little higher to reach the VIX FP low and then rollover on the SPY with a downside target of that FP. Just guessing on that of course. Another scenario (the tricky one) would be a move down first on the SPY and then a rally back up tomorrow to make a higher high then today and subdivide the larger B wave into 3 medium waves. This would cause the VIX to rally up today as the SPY goes down to its FP, and then when the SPY reverses back up into Friday for its medium C wave up of a larger B wave up the VIX will nose dive into it's FP low.

That would be a tricky move by the bulls and certainly put the bears back to sleep by the close on Friday. Naturally I'd prefer the SPY to move up first at the open to hit the VIX FP low and then rollover (the easy scenario) but we don't always get what we want (actually, we almost NEVER get what we want in this market). But there's some hope for that easier scenario to play out. The futures have recaptured the rising brownish orange trendline and the falling green trendline this morning. That's a good sign that they plan on grinding higher today first to hit the VIX FP low in my opinion.

Ideally the go sideways all day with a slight upward bias to around the 2840 level to put the bears to sleep, which if they really wanted to do the best job there they'd do the same thing on Friday... just a grind sideways, maybe a little higher, but not much. Then the bears would give up for the most part I think and wouldn't risk a short over the weekend. Then Monday morning we might just open up right at the FP level on the SPY, a nice gap down, which might just continue the rest of the day? It's hard to know what the exact plans are here but I'm still bearish, especially for next week. But timing the perfect entry again isn't always easy. But that's the best road map I can give you for the possible ways the next two days play out.

ES Morning Update August 15th 2018

0

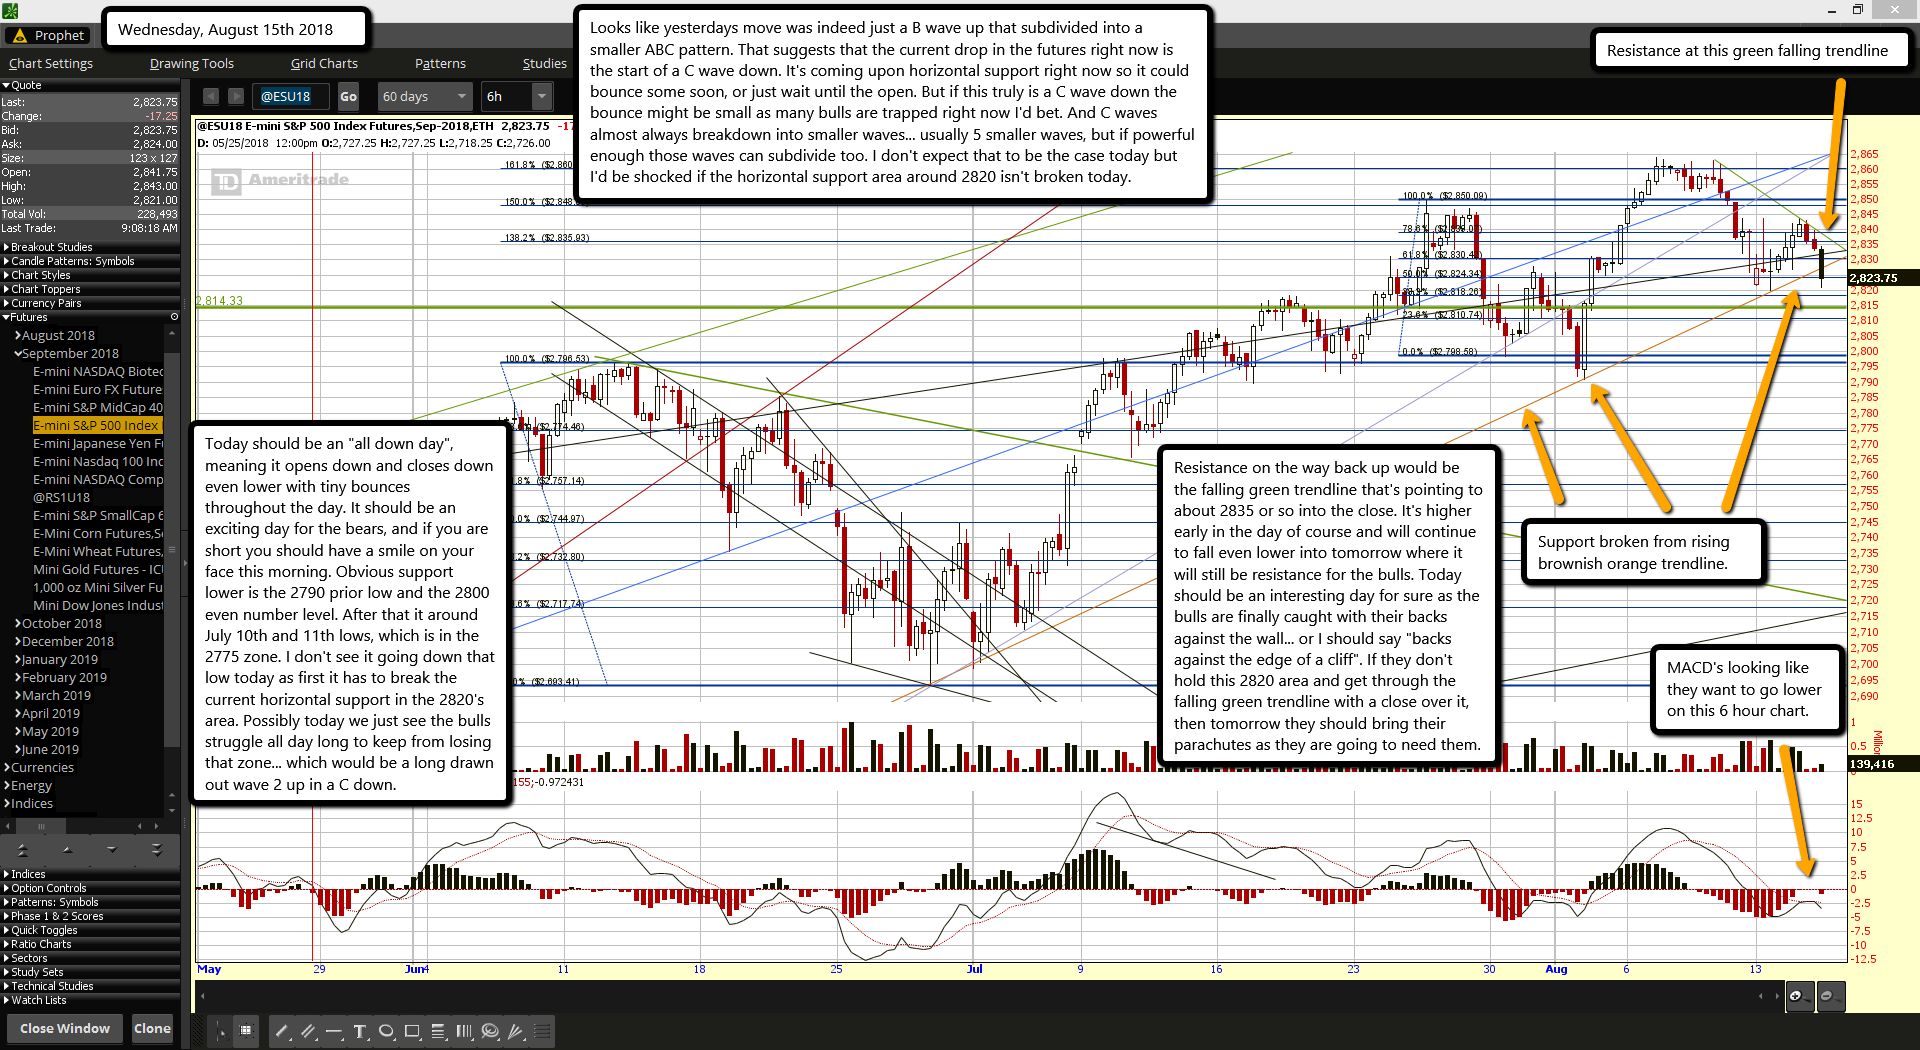
Looks like yesterdays move was indeed just a B wave up that subdivided into a smaller ABC pattern. That suggests that the current drop in the futures right now is the start of a C wave down. It's coming upon horizontal support right now so it could bounce some soon, or just wait until the open. But if this truly is a C wave down the bounce might be small as many bulls are trapped right now I'd bet. And C waves almost always breakdown into smaller waves... usually 5 smaller waves, but if powerful enough those waves can subdivide too. I don't expect that to be the case today but I'd be shocked if the horizontal support area around 2820 isn't broken today.

Today should be an "all down day", meaning it opens down and closes down even lower with tiny bounces throughout the day. It should be an exciting day for the bears, and if you are short you should have a smile on your face this morning. Obvious support lower is the 2790 prior low and the 2800 even number level. After that it around July 10th and 11th lows, which is in the 2775 zone. I don't see it going down that low today as first it has to break the current horizontal support in the 2820's area. Possibly today we just see the bulls struggle all day long to keep from losing that zone... which would be a long drawn out wave 2 up in a C down.

Resistance on the way back up would be the falling green trendline that's pointing to about 2835 or so into the close. It's higher early in the day of course and will continue to fall even lower into tomorrow where it will still be resistance for the bulls. Today should be an interesting day for sure as the bulls are finally caught with their backs against the wall... or I should say "backs against the edge of a cliff". If they don't hold this 2820 area and get through the falling green trendline with a close over it, then tomorrow they should bring their parachutes as they are going to need them.

ES Morning Update August 14th 2018

0

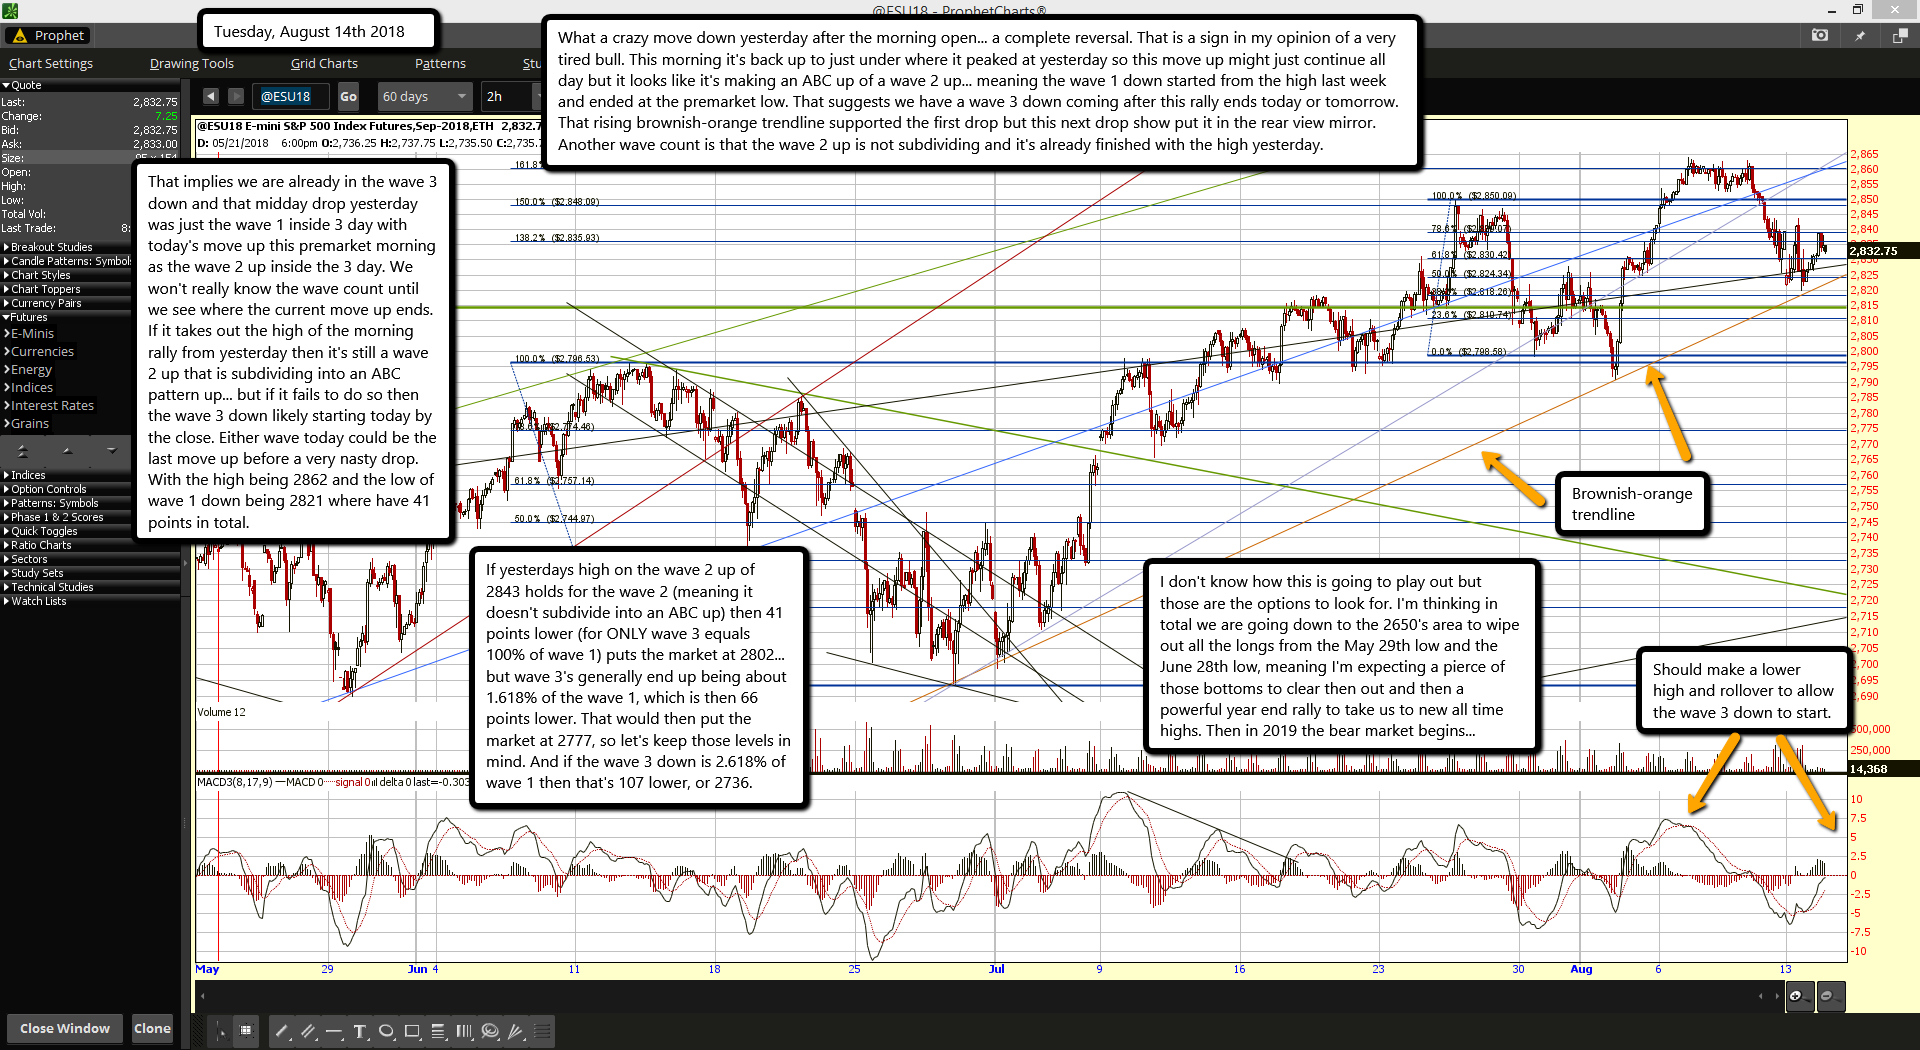
What a crazy move down yesterday after the morning open... a complete reversal. That is a sign in my opinion of a very tired bull. This morning it's back up to just under where it peaked at yesterday so this move up might just continue all day but it looks like it's making an ABC up of a wave 2 up... meaning the wave 1 down started from the high last week and ended at the premarket low. That suggests we have a wave 3 down coming after this rally ends today or tomorrow. That rising brownish-orange trendline supported the first drop but this next drop show put it in the rear view mirror. Another wave count is that the wave 2 up is not subdividing and it's already finished with the high yesterday.

That implies we are already in the wave 3 down and that midday drop yesterday was just the wave 1 inside 3 day with today's move up this premarket morning as the wave 2 up inside the 3 day. We won't really know the wave count until we see where the current move up ends. If it takes out the high of the morning rally from yesterday then it's still a wave 2 up that is subdividing into an ABC pattern up... but if it fails to do so then the wave 3 down likely starting today by the close. Either wave today could be the last move up before a very nasty drop. With the high being 2862 and the low of wave 1 down being 2821 where have 41 points in total.

If yesterdays high on the wave 2 up of 2843 holds for the wave 2 (meaning it doesn't subdivide into an ABC up) then 41 points lower (for ONLY wave 3 equals 100% of wave 1) puts the market at 2802... but wave 3's generally end up being about 1.618% of the wave 1, which is then 66 points lower. That would then put the market at 2777, so let's keep those levels in mind. And if the wave 3 down is 2.618% of wave 1 then that's 107 lower, or 2736.

I don't know how this is going to play out but those are the options to look for. I'm thinking in total we are going down to the 2650's area to wipe out all the longs from the May 29th low and the June 28th low, meaning I'm expecting a pierce of those bottoms to clear then out and then a powerful year end rally to take us to new all time highs. Then in 2019 the bear market begins...

ES Morning Update August 13th 2018

0

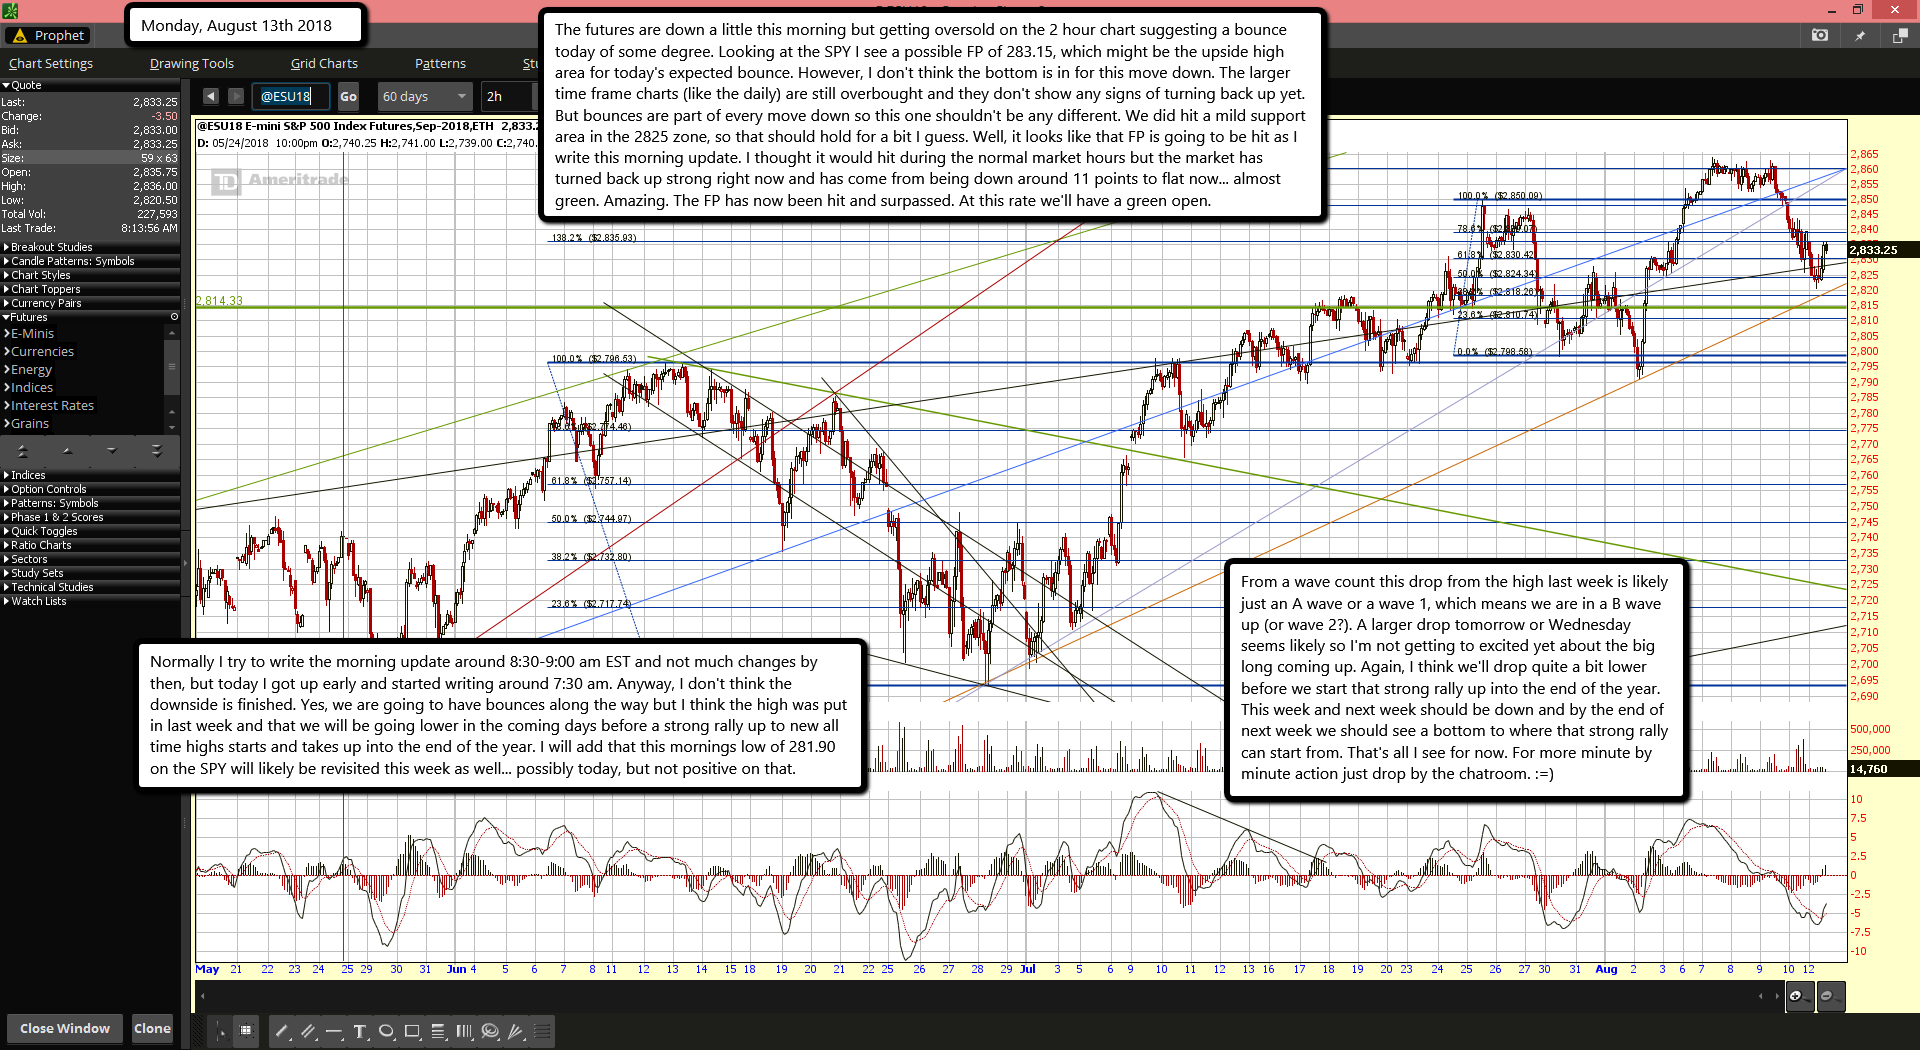
The futures are down a little this morning but getting oversold on the 2 hour chart suggesting a bounce today of some degree. Looking at the SPY I see a possible FP of 283.15, which might be the upside high area for today's expected bounce. However, I don't think the bottom is in for this move down. The larger time frame charts (like the daily) are still overbought and they don't show any signs of turning back up yet. But bounces are part of every move down so this one shouldn't be any different. We did hit a mild support area in the 2825 zone, so that should hold for a bit I guess. Well, it looks like that FP is going to be hit as I write this morning update. I thought it would hit during the normal market hours but the market has turned back up strong right now and has come from being down around 11 points to flat now... almost green. Amazing. The FP has now been hit and surpassed. At this rate we'll have a green open.

Normally I try to write the morning update around 8:30-9:00 am EST and not much changes by then, but today I got up early and started writing around 7:30 am. Anyway, I don't think the downside is finished. Yes, we are going to have bounces along the way but I think the high was put in last week and that we will be going lower in the coming days before a strong rally up to new all time highs starts and takes up into the end of the year. I will add that this mornings low of 281.90 on the SPY will likely be revisited this week as well... possibly today, but not positive on that.

From a wave count this drop from the high last week is likely just an A wave or a wave 1, which means we are in a B wave up (or wave 2?). A larger drop tomorrow or Wednesday seems likely so I'm not getting to excited yet about the big long coming up. Again, I think we'll drop quite a bit lower before we start that strong rally up into the end of the year. This week and next week should be down and by the end of next week we should see a bottom to where that strong rally can start from. That's all I see for now. For more minute by minute action just drop by the chatroom. :=)

ES Morning Update August 10th 2018

0

No long post this morning gang. The market finally rolled over it seems. I don't know if it's going to stick or not but this 6 hour chart of the ES tells me it's got lots of room left to go lower if it chooses to do so? Usually the open is where we see the bounce back up as the "buy the dippers" come in on every pullback. Can't blame them as the 60 minute chart and the 2 hour chart are getting down into oversold territory... meaning a turn up is likely, but I don't think this is the bottom of the move. I do think we are just getting started and next week we'll see this down move continues. That's me keeping it simple and short. Today I turn 54 but still feel like I'm in my 30's... and certainly still act young. So you are only as old as you act and feel I guess. Since I'm short this pig this down move is a nice Happy Birthday gift to me. Have a great weekend everyone.

ES Morning Update August 9th 2018

0

Not a whole to say today that wasn't said yesterday. The market are again about flat and doing a whole lot of nothing this morning. It's a sideways to slightly down move, which on this 6 hour (and shorter time frames) it looks like a bull flag. And that suggests another move higher is yet to come. Personally I think it's going to be a failed bull flag and the high was put in on Tuesday the 7th. If it doesn't fail then I still think the upside is very limited here. Maybe a slight move higher then Tuesday but not much. There's a possible FP on the VIX showing 10.17 that happened last night afterhours. A move down in the VIX to hit that fake print would mean a slightly higher high in the futures and the SPX/SPY... so possible, but I'll remain short regardless. The bigger picture says we are topped or very close to a top and the next 100 points (or more?) is down.

On this 6 hour chart you'll see that the MACD's have crossed from positive to negative now. While that certainly doesn't mean we can't turn back up on them to make a lower high and therefore a negative divergence it does imply a move up is exhausted. Support is still the same as yesterday with those two rising trendlines. But if this market really does turn down here they should not hold as they aren't super strong supports anyway.

Jobless claims come out in half an hour around 8:30 am EST as well as PPI-FD, which might move the market. Usually I start writing the morning update around that time and finish up by 9am or so, then post it. But I got up early this morning and it's now just a little after 8am. Further updates and charts are of course in the free chatroom. I will remain short until August 22nd unless it becomes super clear that the market isn't going to turn down this time around. I think the best odds are tomorrow where there's little "put support" on the open interest of the SPY which could open up the market for a nice drop to get the party started. We shall see...

ES Morning Update August 8th 2018

0

The futures are just trading sideways and don't seem to rollover yet. I still think the top it in basically and we'll start a 2-3 week pullback. Certainly I can be off by a day or two on the "exact" high as it does look like the market wants to go up a little more today. But I still firmly believe we are a topping area and will rollover soon. On this 2 hour chart it appears that the MACD's peaked yesterday and today it looks like it trying to turn back, which should make a lower high on it and a higher high on the price level of the futures. This sideways trading is also a bull flag pattern, so everything is pointing to a little more upside today. Failure to do so is of course bearish.

If there is a pullback the rising light purple trendline pointing to around 2845 as well as the rising blue trendline pointing to 2850 will act as support. On the daily chart of the SPX (not shown here of course) there's clearly negative divergences setup on both the MACD's and Histogram Bars. And as I'm sure you are aware we are almost up to a double top from January of this year. The market might just hover up here for another day or two as it tries to reach that prior high.

I don't think it will reach it and pierce it on the first try in 6 months. A pullback is coming within days, if not today? And this pullback should go deeper then most think. It should below 2700 by the time it's finished. Retesting (and piercing) the prior lows on July 28th and May 29th is likely. There's a lot of chop in that zone where traders went long. They need to be taken out before another before another strong rally up into the end of the year starts.

As far as wave counts I have to say I'm unsure on it so I won't even try to guess. Since I trade from day to day (usually) I just try to catch wave 3's or C's in an obvious ABC or 5 wave patterns. I think we are in some 5th wave up from the 8/2 low just below 2800 a hair. Others think it's some kind of wave 3 up and only the first wave inside it. Which is right I don't know? I'll just look for the short term moves that last hours to days (I like the "days" better but sometimes I do day trades). Anyway, that's all I have for today. I'm short and will stay that way for the next few weeks to see if the market pulls back as I think it will.

ES Morning Update August 7th 2018 – The TOP IS IN

0

Gang I'm looking for a top today for many reasons. One is the VIX fake print (FP) showing 11.07 was hit in the premarket. But more importantly is that the much stronger FP from May 4th, 2018 is almost now hit in the premarket session. It showed a low of 10.91 and we are just a few pennies away from it as I write the post. Also there is the passport code from the movie Assassins Creed that is for today. Then there was a new FP put out yesterday showing a large drop on it, which I think starts after today. Everything is lining up for a big drop gang, and it should be fast. I don't want to say much more then this on this update. If you want to know the level we are going to (which I have double "clues" on it) you'll have to login to the free chatroom to find out. Sorry, but it's some pretty scary stuff and I just don't want to say too much publicly. Good Luck

On the menu bar go to the third one from left to right called "Members Login-Chat-Forum" and hover over it. A pulldown menu will show 5 options. Hover over the "My Account" and a side pullout menu will show 4 options. Choose the "Sign Up" option.

The direct link is: reddragonleo.com/registration/

Sign up

ES Morning Update August 6th 2018

0

For some reason the chart isn't working properly this morning (it's not showing the data from Friday until now) so I'll keep this update short. Looks like we went up a little Sunday when the futures opened but are mostly flat right now. I am looking for a move down to start this week but it might be choppy at first with tricky moves back up to shake everyone out before a bigger drop. The Sunday night high appears to be 2841.50, which is 284.11 on the SPY.

Monday's are usually slow but if there's going to be a pullback I think it will start today and into Tuesday. The rest of the week could be choppy as the bulls and bears fight it out, but by Friday we should see another drop start. I'm not sure if they will breakdown through the 2800 level this week or not but I do see it as coming soon... like next week if it fails to do it this week. For today I'll be looking for 10-20 points down for the pullback to start. Since I don't have an updated chart this morning I'm going to end it here and will update in the free chatroom throughout the day. Hopefully they will get it fixed and we'll be back on schedule for tomorrow. Good luck.

s2Member®