Saturday, July 25, 2026
Home Blog Page 43

ES Morning Update October 2nd 2018

0

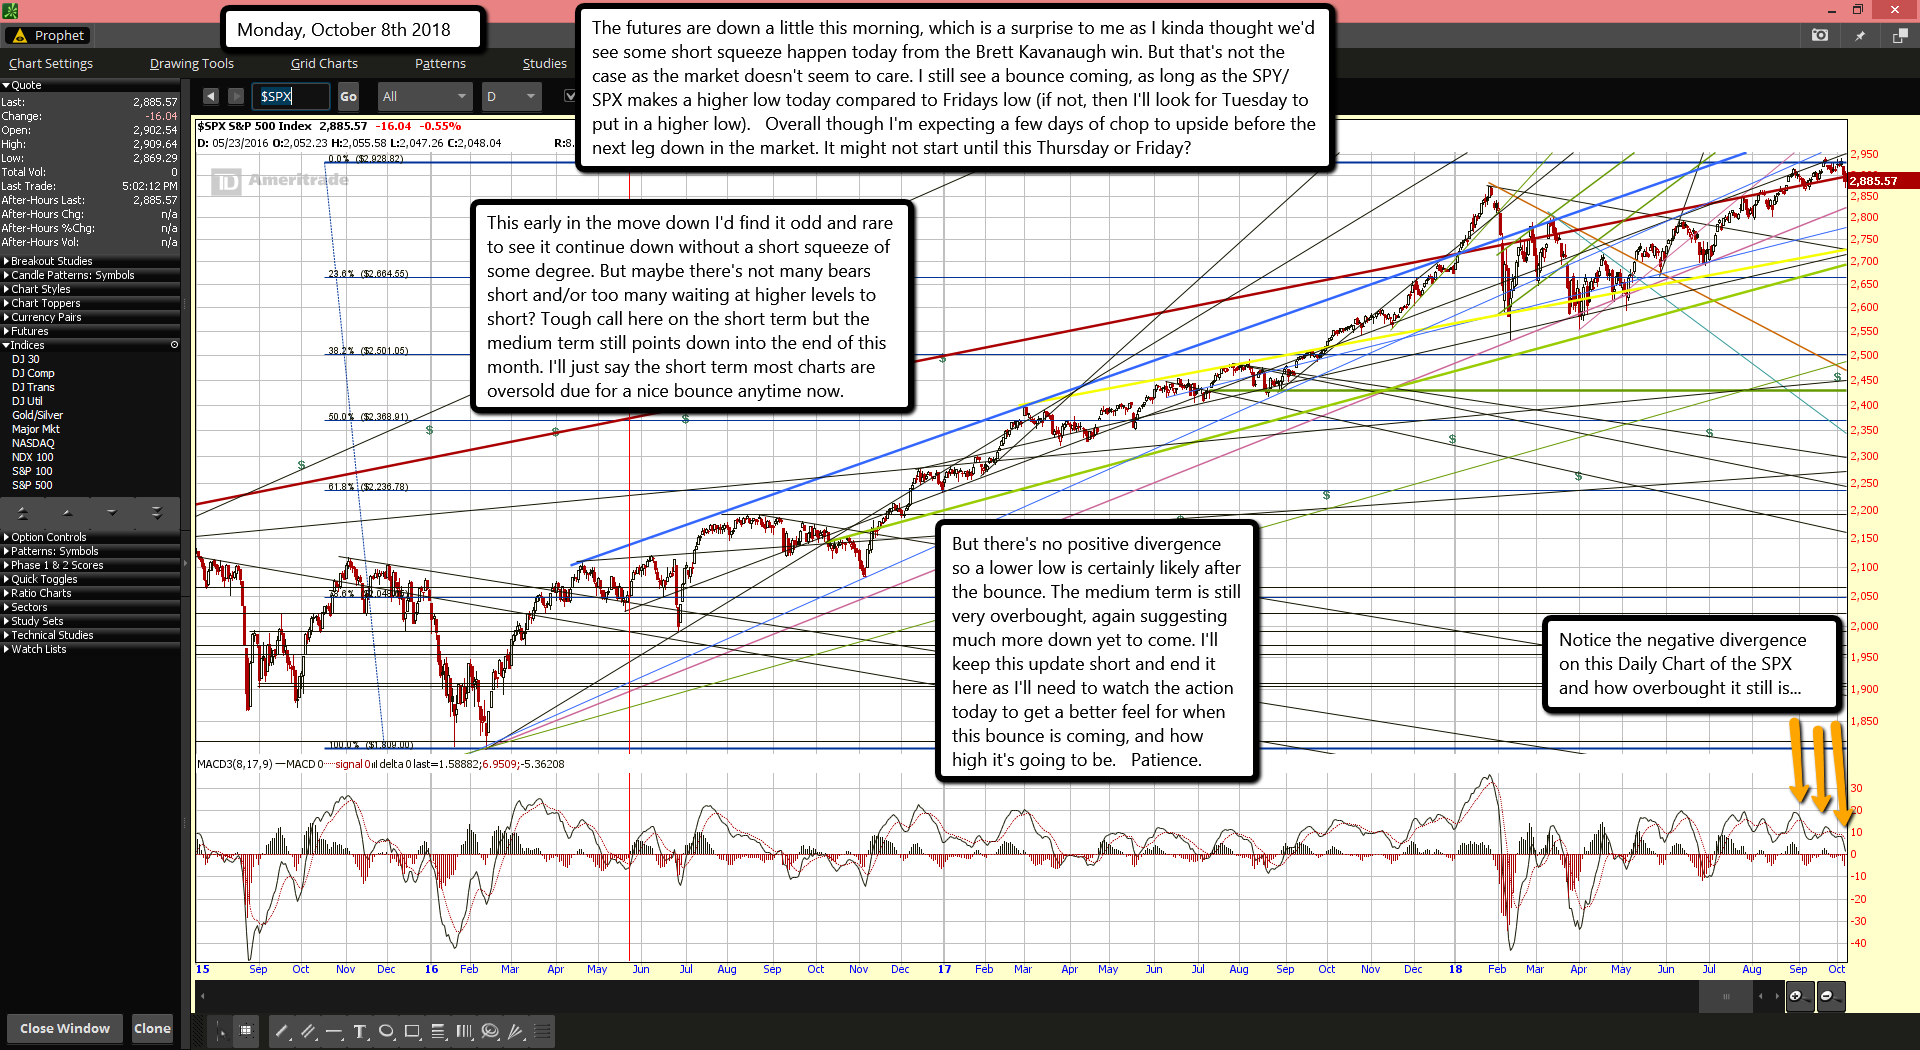
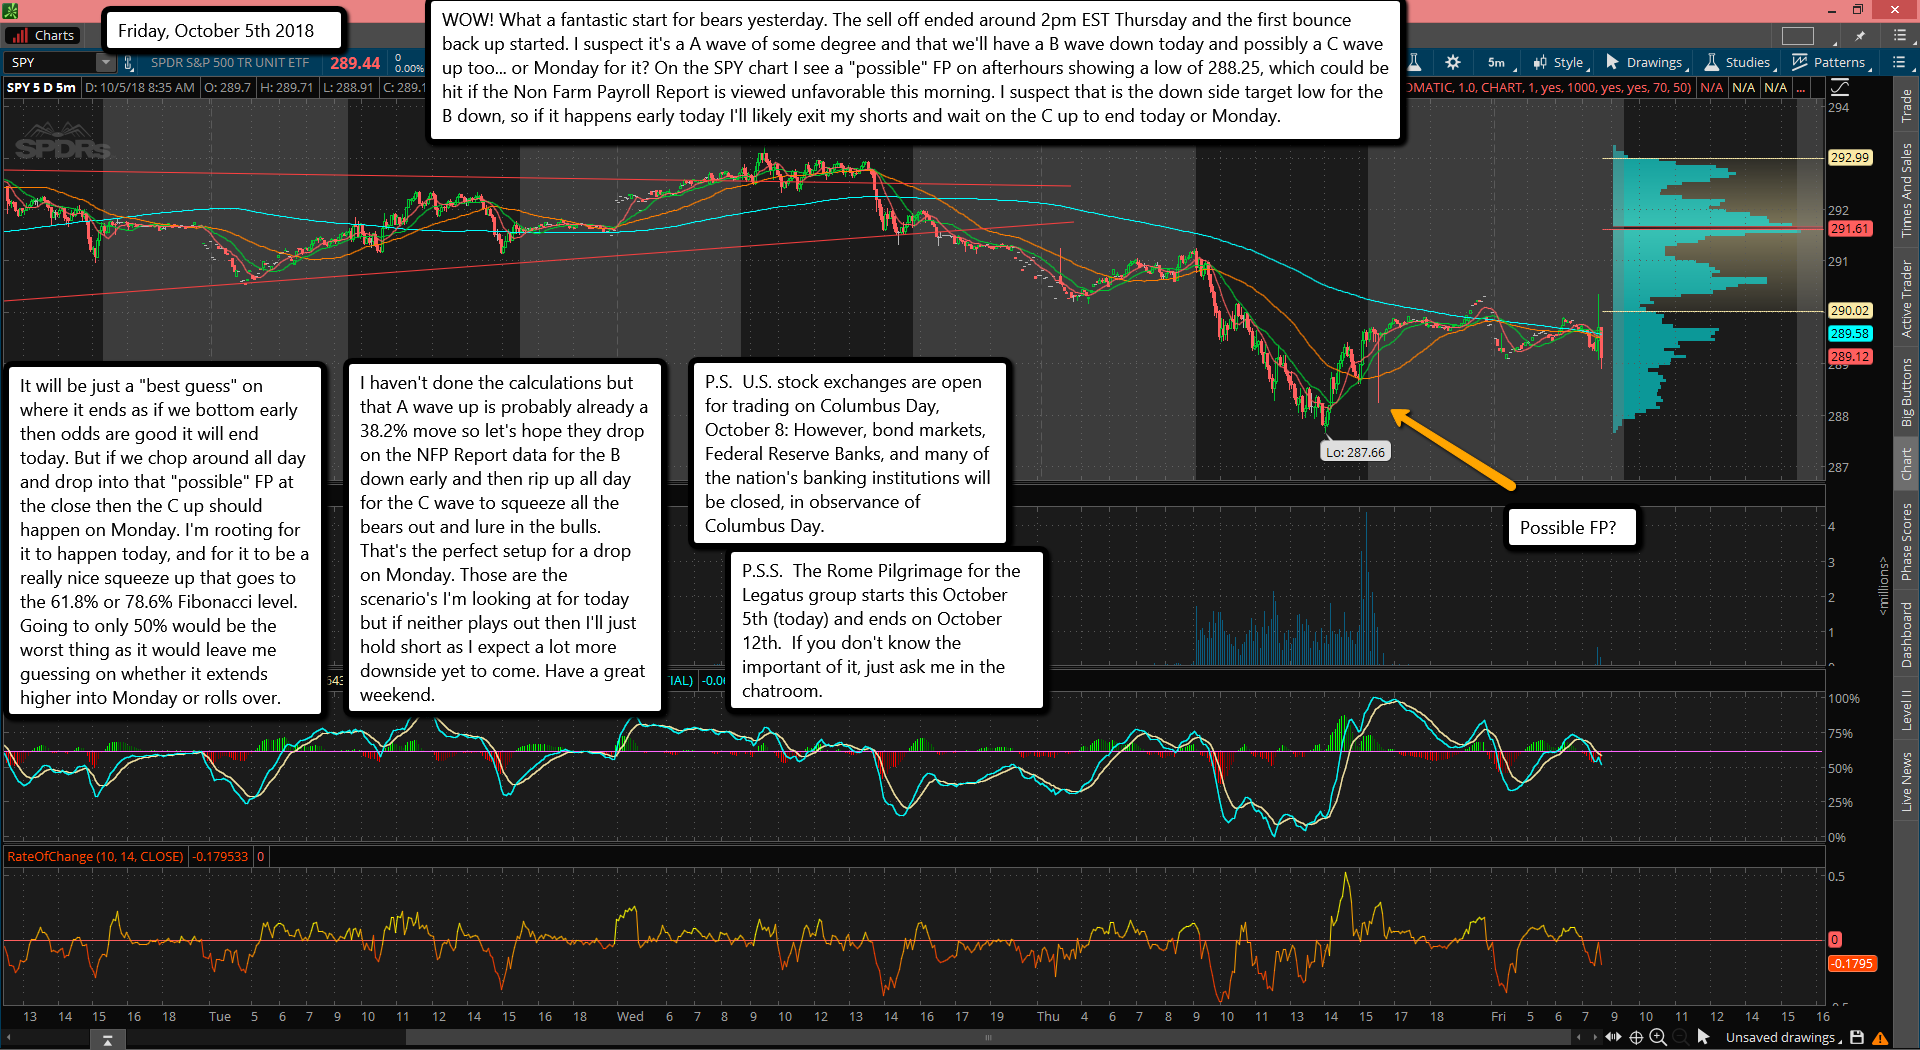
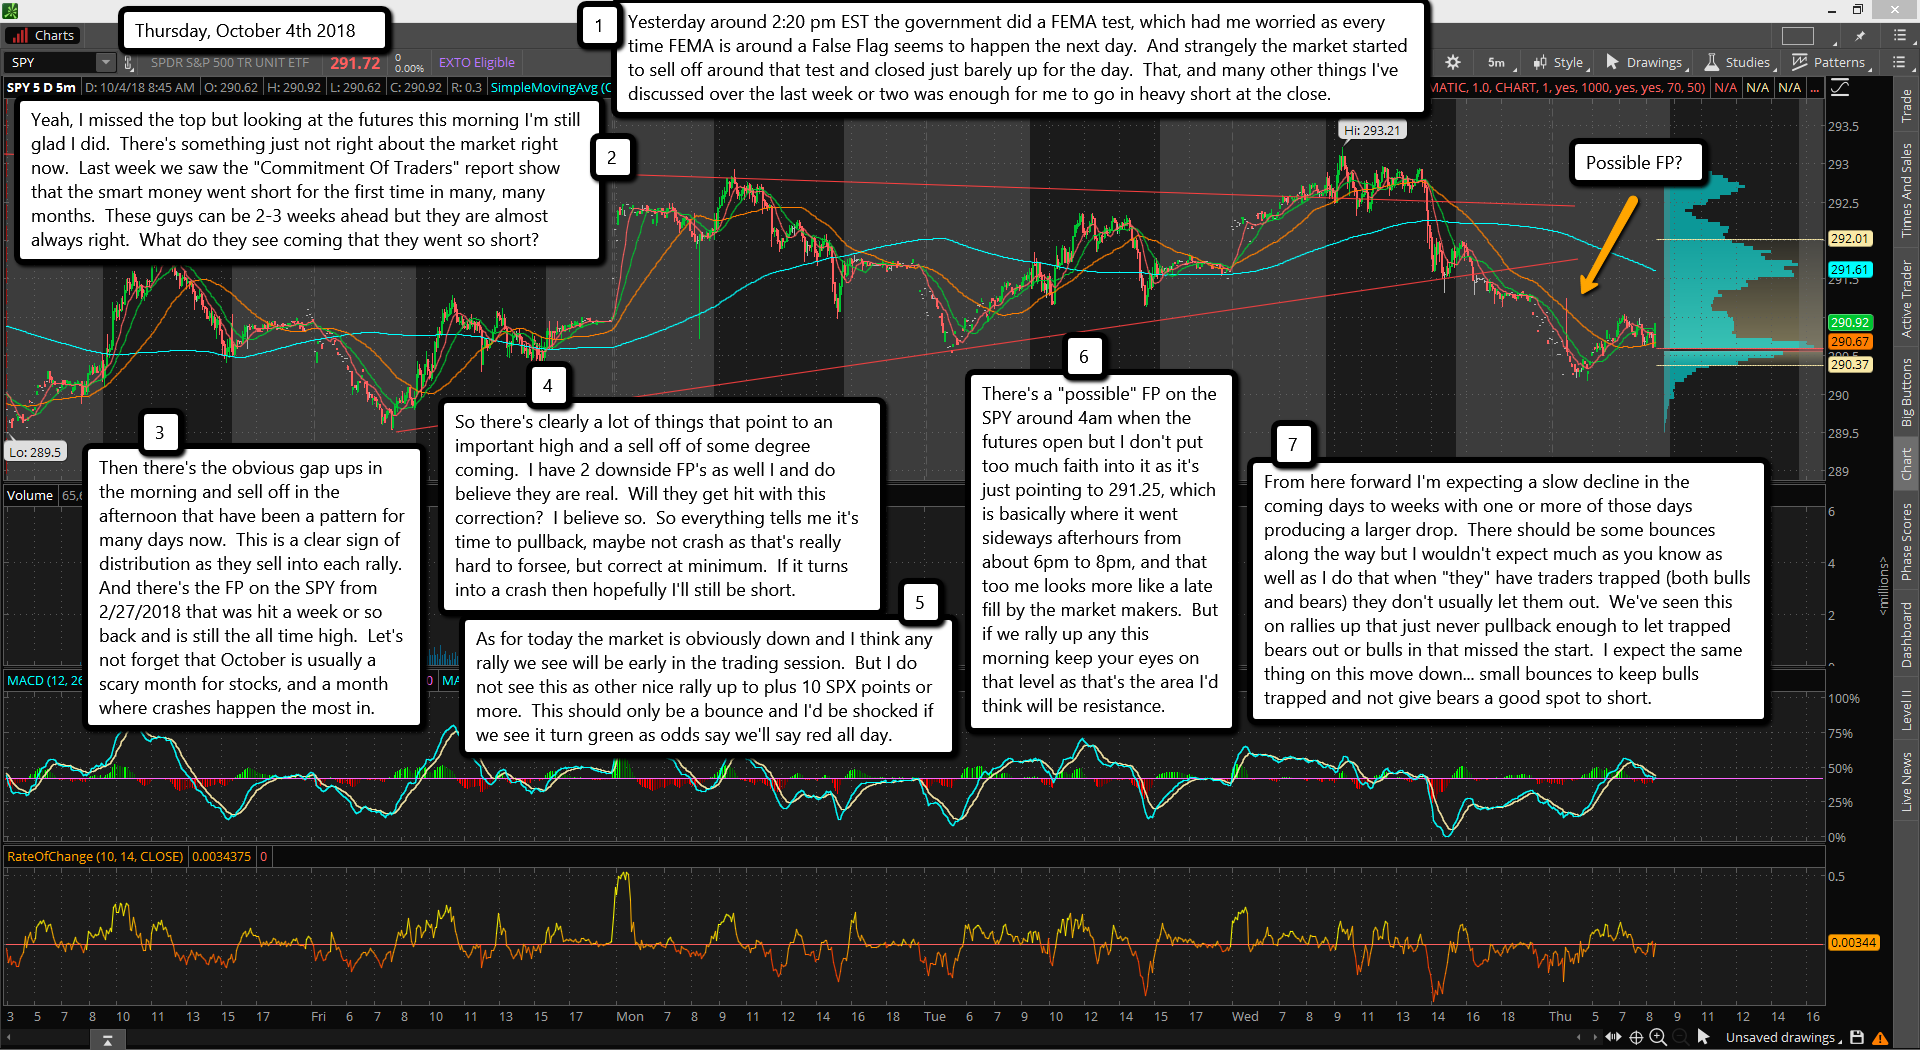
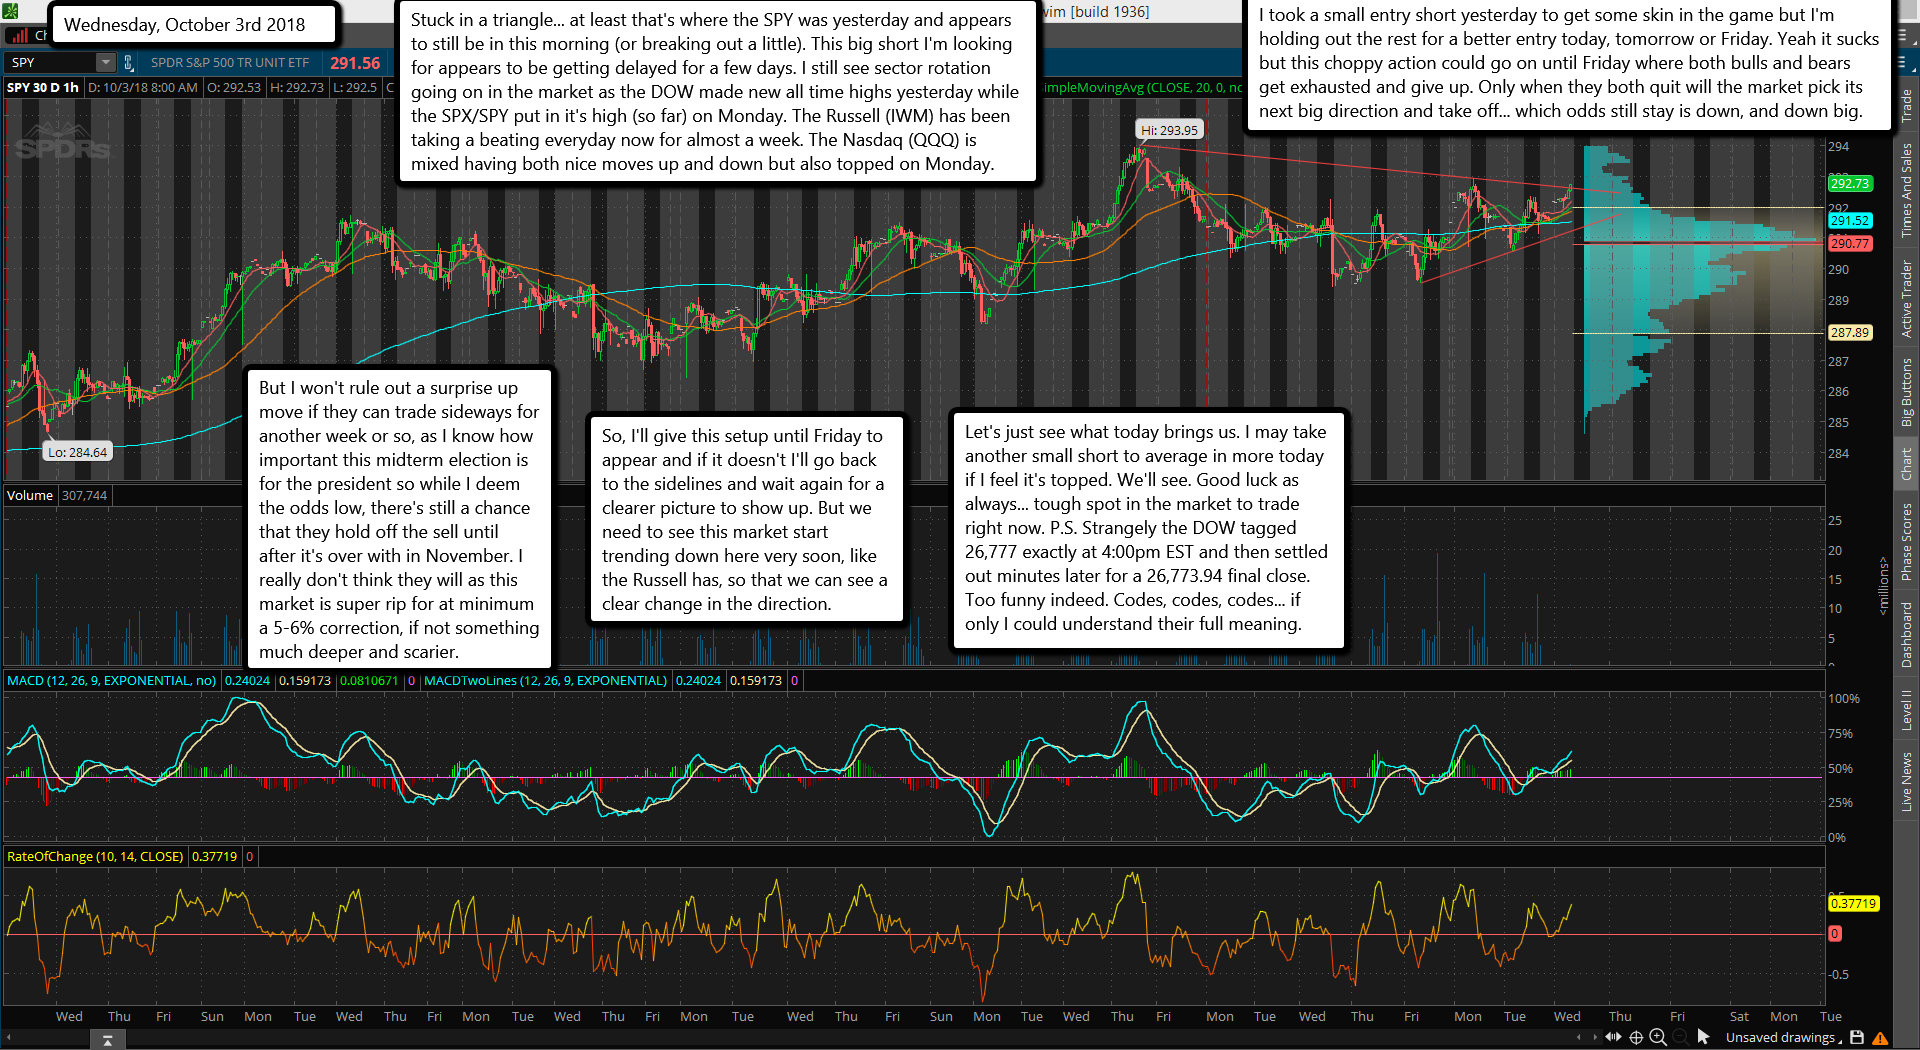
Yesterday was the first sign of weakness I've seen in awhile. But if you wasn't watching the tape all day and only seen the close you would have missed it as the market did close on both the DOW and the SPX. But the Russell is looking ugly and Nasdaq isn't quite far behind. This is a clear sign of a topping process taking place right now. Today and tomorrow should be the last chance to average into shorts before a much larger drop starts. I'm not sure if we'll put in the high today or tomorrow? But after Wednesday I think we'll start seeing the downside action pick up and getting short in the 2900's on the SPX will be a thing of the past.

I'll be playing it by ear of course to see where the best entry short is at, because is might show up today instead of Wednesday, but considering how many weeks in the past we've seen tops (or bottoms) put in on Wednesday I have to root for that to be the case again. We'll see I guess. For the short term we are showing some early weakness in the futures and the SPY has a gap that "almost" got filled yesterday. So it's possible we drop down early in the morning session today to fill it and then turn back up into the close and/or Wednesday for that final high.

Keep your eyes on the DOW today and tomorrow as "codes" might just appear? I know that yesterday right at 4pm (EST) the DOW tagged 26,666 but after it settled out the final close was 26,651... a "coded message" for those watching closely? It could happen again today, and tomorrow we might just see the power of the number "7" show up... like another all high of 26,777? You never know for sure what the elite have planned.

Don't forget that we've never seen any code show up yet with the number 7 in it, yet Christine Lagarde spoke about it in a creepy speech she did back in 2011 or 2012 if I recall? Then there was the movie called "Triple 7" about a runaway train, which really happened in real life but the actual number of the real train was the "8888", whereas in this movie is was the "777" train.

All I can say is that "if" this market is going to dump really hard... like in a 1987 style crash, there will be "code" out there to signal it just like the bottom in 2009 was 666 on the SPX. So keep your eye open as I'm just one guy that can't watch every market to catch every code. If you see something weird get a screen shot and let me know. I'm in the free chatroom everyday and I share everything I find with all the members in a hope that we can all work together better as a team and all benefit from it financially. Thanks.

ES Morning Update October 1st 2018

0

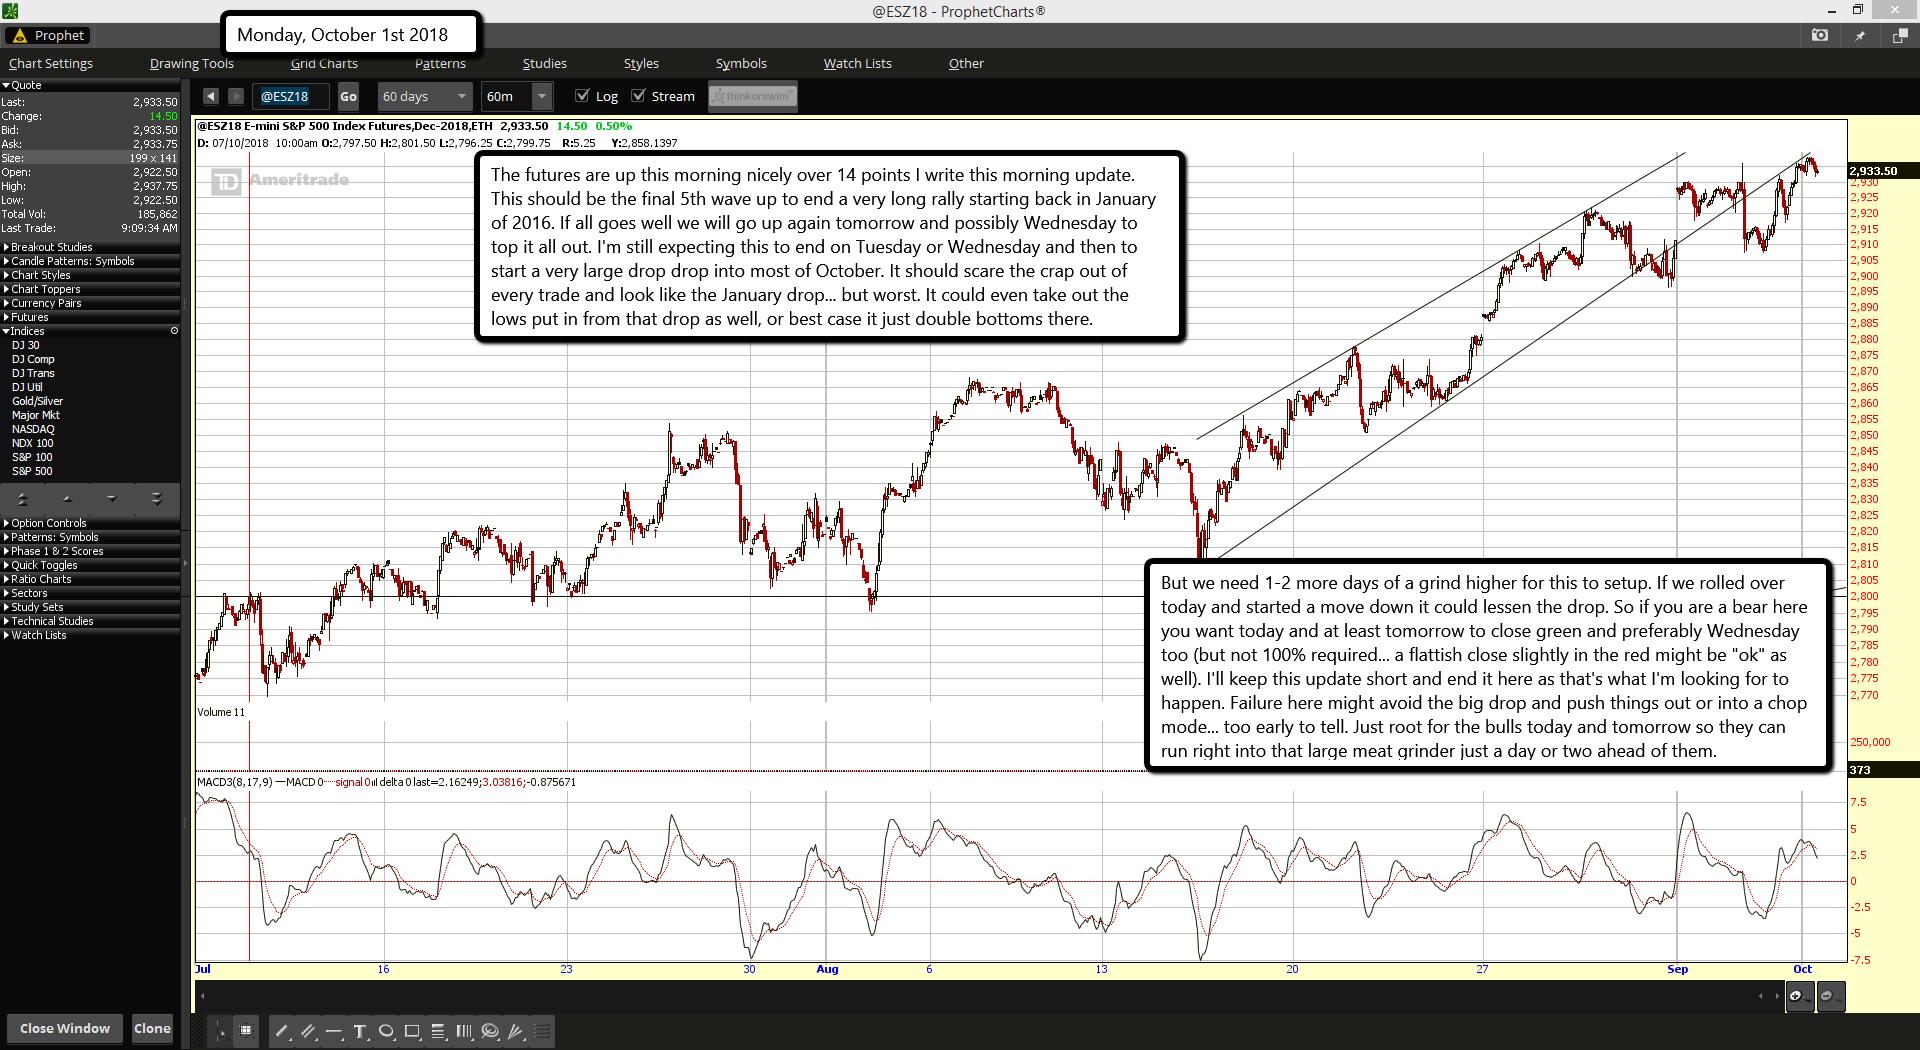
The futures are up this morning nicely over 14 points I write this morning update. This should be the final 5th wave up to end a very long rally starting back in January of 2016. If all goes well we will go up again tomorrow and possibly Wednesday to top it all out. I'm still expecting this to end on Tuesday or Wednesday and then to start a very large drop drop into most of October. It should scare the crap out of every trade and look like the January drop... but worst. It could even take out the lows put in from that drop as well, or best case it just double bottoms there.

But we need 1-2 more days of a grind higher for this to setup. If we rolled over today and started a move down it could lessen the drop. So if you are a bear here you want today and at least tomorrow to close green and preferably Wednesday too (but not 100% required... a flattish close slightly in the red might be "ok" as well). I'll keep this update short and end it here as that's what I'm looking for to happen. Failure here might avoid the big drop and push things out or into a chop mode... too early to tell. Just root for the bulls today and tomorrow so they can run right into that large meat grinder just a day or two ahead of them.

ES Morning Update September 28th 2018

0

This morning I want to look that the SPY 2 hour chart, which suggests a rally is coming soon. The MACD's are around the zero area and merging close together as well. The futures this morning are down some as they retested yesterdays low and bounced back up some from it. From looking at both I think we'll open this morning and find an early bottom and start a rally back up afterwards and close green. I suspect this rally will continue into early next week where I expect the market to top out by Tuesday or Wednesday.

When this top happens I'm expecting a nasty drop that should be labeled just a correction but I won't rule out a crash. I'm saying that only because of the political drama going on around Trump (and few other similarities it has with 1987), as the Democrats would love to see the Republicans lose control during the midterm elections and a crash to blame it on Trump would be a great start for them. I give the crash low odds but the correction I give high odds. Anyway, I'll keep today short as I've already said I'm expecting a bounce today with a green close. Have a great weekend.

ES Morning Update September 27th 2018

0

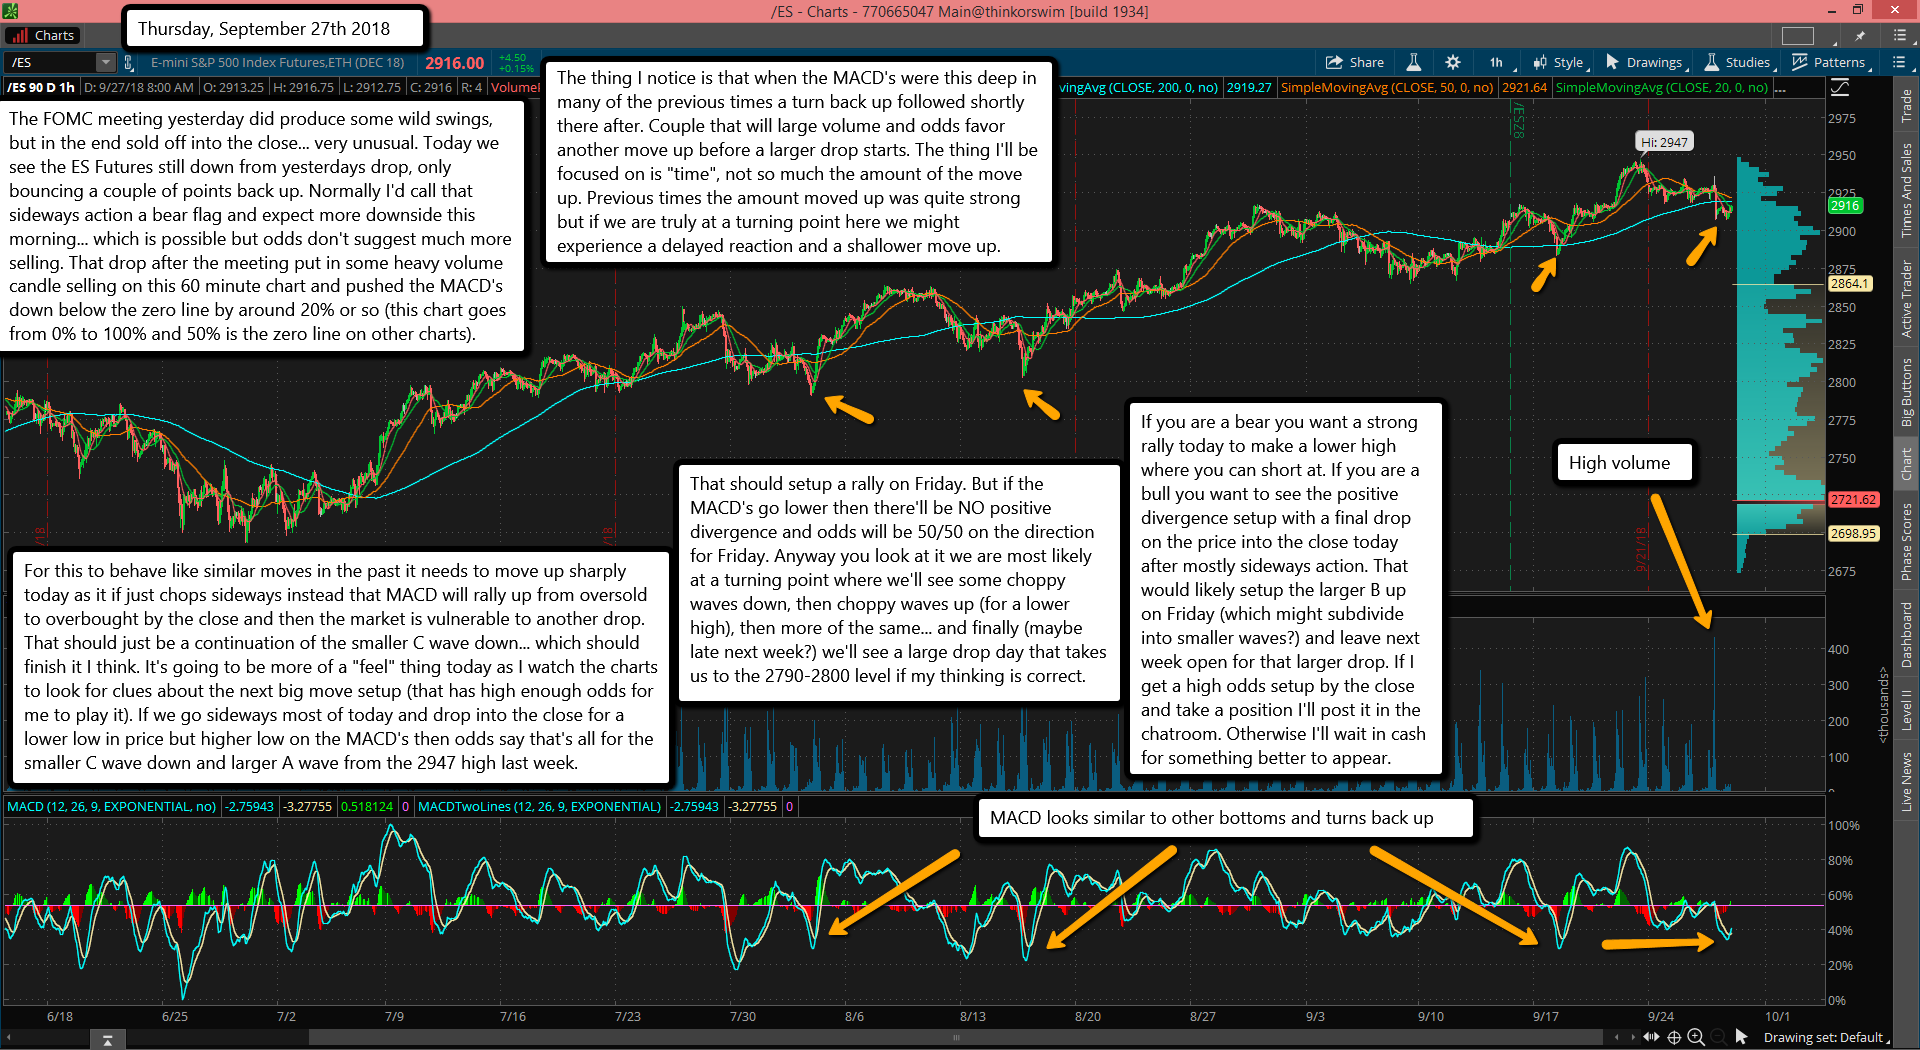
The FOMC meeting yesterday did produce some wild swings, but in the end sold off into the close... very unusual. Today we see the ES Futures still down from yesterdays drop, only bouncing a couple of points back up. Normally I'd call that sideways action a bear flag and expect more downside this morning... which is possible but odds don't suggest much more selling. That drop after the meeting put in some heavy volume candle selling on this 60 minute chart and pushed the MACD's down below the zero line by around 20% or so (this chart goes from 0% to 100% and 50% is the zero line on other charts).

The thing I notice is that when the MACD's were this deep in many of the previous times a turn back up followed shortly there after. Couple that will large volume and odds favor another move up before a larger drop starts. The thing I'll be focused on is "time", not so much the amount of the move up. Previous times the amount moved up was quite strong but if we are truly at a turning point here we might experience a delayed reaction and a shallower move up.

For this to behave like similar moves in the past it needs to move up sharply today as it if just chops sideways instead that MACD will rally up from oversold to overbought by the close and then the market is vulnerable to another drop. That should just be a continuation of the smaller C wave down... which should finish it I think. It's going to be more of a "feel" thing today as I watch the charts to look for clues about the next big move setup (that has high enough odds for me to play it). If we go sideways most of today and drop into the close for a lower low in price but higher low on the MACD's then odds say that's all for the smaller C wave down and larger A wave from the 2947 high last week.

That should setup a rally on Friday. But if the MACD's go lower then there'll be NO positive divergence and odds will be 50/50 on the direction for Friday. Anyway you look at it we are most likely at a turning point where we'll see some choppy waves down, then choppy waves up (for a lower high), then more of the same... and finally (maybe late next week?) we'll see a large drop day that takes us to the 2790-2800 level if my thinking is correct.

If you are a bear you want a strong rally today to make a lower high where you can short at. If you are a bull you want to see the positive divergence setup with a final drop on the price into the close today after mostly sideways action. That would likely setup the larger B up on Friday (which might subdivide into smaller waves?) and leave next week open for that larger drop. If I get a high odds setup by the close and take a position I'll post it in the chatroom. Otherwise I'll wait in cash for something better to appear.

ES Morning Update September 26th 2018

0

Today we'll look as the SPY chart for clues, which too me suggest a pop higher is coming at some point soon. When you ask? Most likely after the FOMC meeting today. The rising red trendline has provided support since it started on 8/15, and it's just around 290 from looks of it right now. In the old days there was a lot of fast "shakeout" swings up and down minutes after an FOMC meeting but the last year or so they seem to be a non-event. So I'm not sure if this is going to be another dull one or a wild one, but I do think that by the end of the day we'll be up some.

I'm not expecting something big on the upside as the old FP from 2/27 was hit last week and has been holding so far. Assuming it still holds then any rally should be contained under the prior high. From a wave count it looks like the first drop was some kind of small A wave and we've been going sideways for the smaller B wave. Maybe a quick drop below the rising red trendline of support to make the smaller C down ends? If so I'd call the whole smaller ABC down a larger A wave.

We then should have a larger B up into Thursday for that possible double top. If that works out (again, guessing here) we'd likely start the first wave 1 down (of 5) for the larger C wave around Friday. I'm still looking for a decent pullback into the middle of October. My target area is around 279 on the SPY, but if it's weak drop then the 2850-2860 SPX area is a logical support area. Anyway, that's keeping is short and simple for today. Good luck.

P.S. My site was down early yesterday due to computer bots attacking it and overloading the server.  It happens a couple times a year it seems.

ES Morning Update September 25th 2018

0

Today I want to look at the ES daily chart flipped upside down. You can see right off the bat how the futures have followed the falling trendline in yellow. You can invert any chart with the Think or Swim platform by putting a "negative" sign in front of the symbol. I sometimes find it interesting to look at it this way as it gives me a different perspective. I can see that all the recent pullbacks since the January high and big drop seems to find support around the green falling trendline... which is pointing to the mid-2700's right now. So over the coming month of October I do expect a pullback into that trendline. The top for now is likely in and won't be taken out until later this year. Of course that trendline is rising and won't be in the mid-2700's by the time this pullback bottoms.

My guess is that we'll be bottoming in mid to late October and then a strong run up again for a new all time high into the end of the year. Short term though we will probably chop around until the FOMC meeting is over with this Wednesday at 2pm EST, with a slightly upward bias (meaning the low yesterday is likely "the low" until after the meeting). There's a gap on the SPX around 2930 that will likely be filled before the next move down, which will likely go to the 2850-2860's area to end the first ABC move down. After that we'll have to wait and see. It should not be some scary drop in front of the midterm elections. The drop in October will likely be a chop one that doesn't scare the public into "crash mode", but deep enough to get very oversold (like the high 2700's) so a strong year end rally can start. If this pullback is allowed then a year end rally to 3100-3200 SPX is very possible.

If it's not allowed and they try to grind higher this week and into next week then they will be lucky to touch 3000 in my opinion... and worst, they will be susceptible for a crash. I'm sure the Republicans don't want that so a controlled pullback seems much more likely I believe. Yesterday in the chatroom I announced that I sold my shorts and went to cash as I expected chop until the Fed meeting was over with. I expect to re-enter my shorts after the meeting, probably on Thursday or Friday. Gap fill could happen today from the looks of the futures but that doesn't mean I'd just blindly go short again. There's still likely more chop until after the meeting and a double top isn't out of the question. I patiently wait...

ES Morning Update September 24th 2018

0

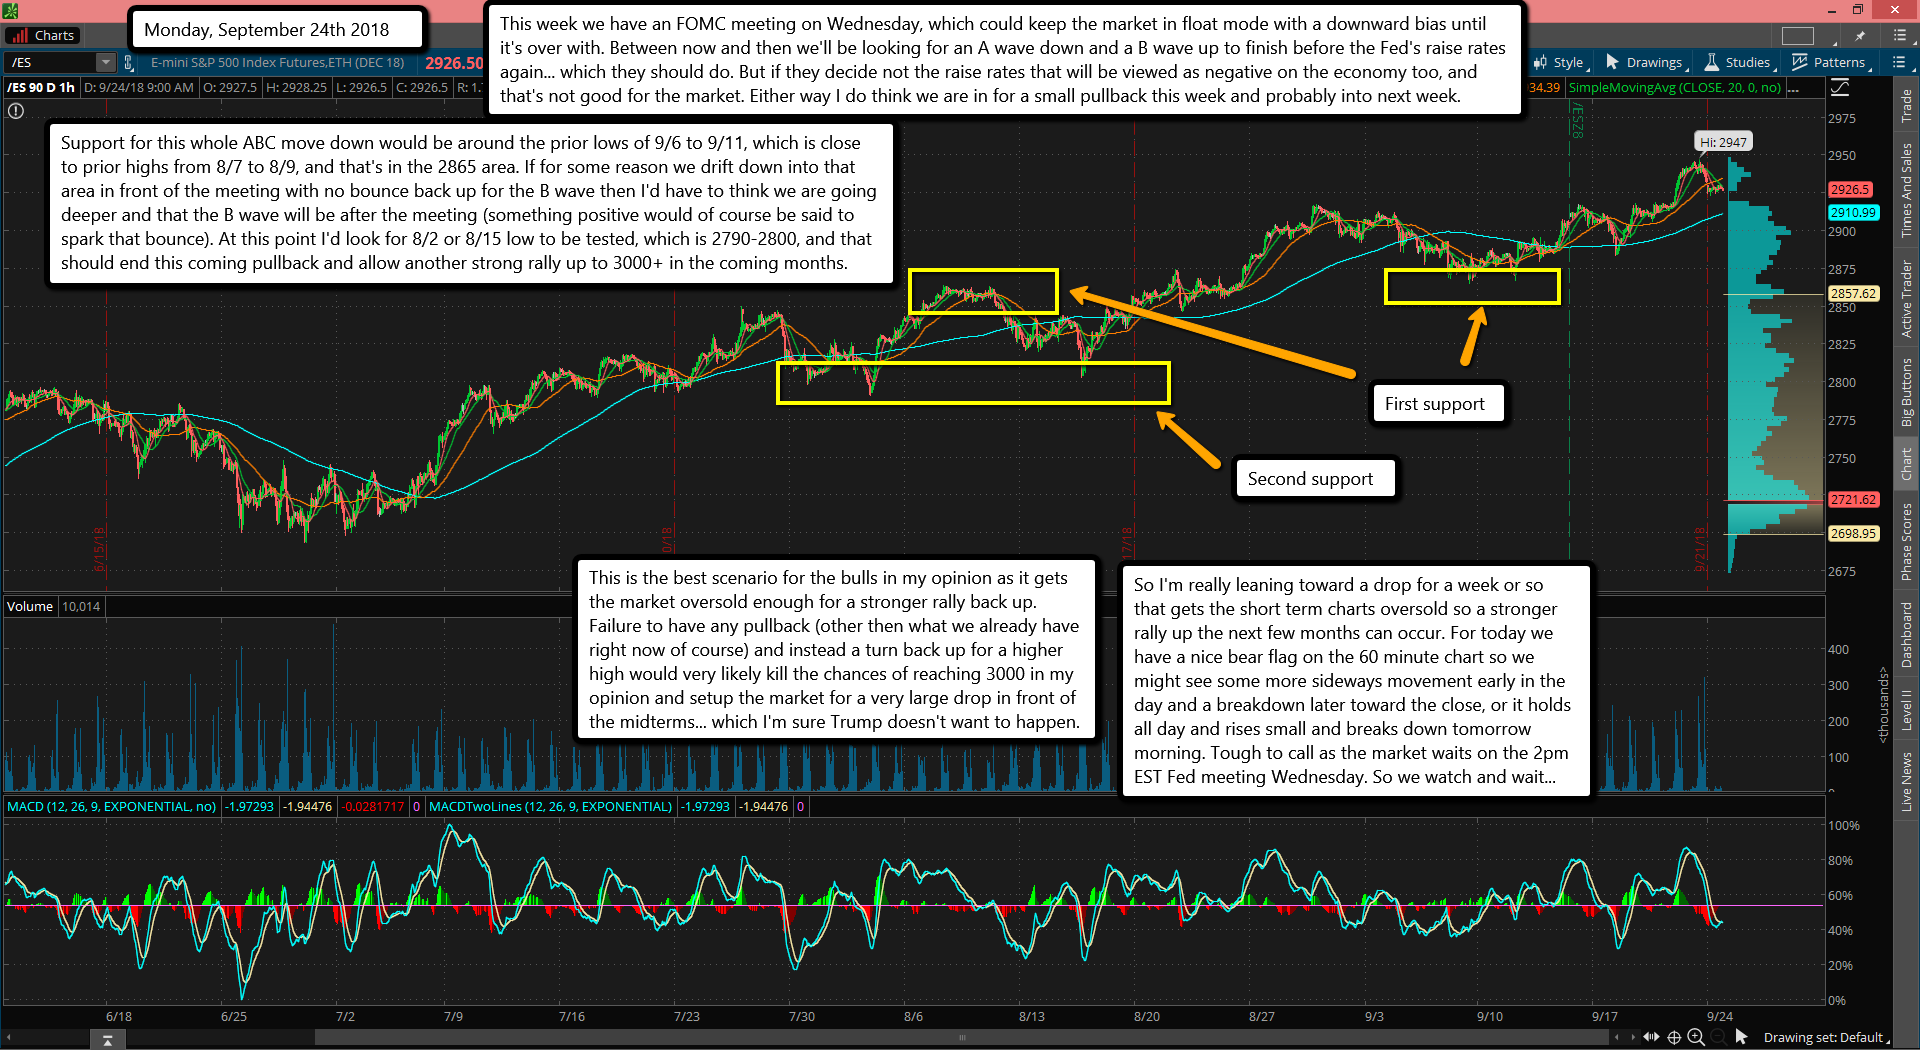
This week we have an FOMC meeting on Wednesday, which could keep the market in float mode with a downward bias until it's over with. Between now and then we'll be looking for an A wave down and a B wave up to finish before the Fed's raise rates again... which they should do. But if they decide not the raise rates that will be viewed as negative on the economy too, and that's not good for the market. Either way I do think we are in for a small pullback this week and probably into next week.

Support for this whole ABC move down would be around the prior lows of 9/6 to 9/11, which is close to prior highs from 8/7 to 8/9, and that's in the 2865 area. If for some reason we drift down into that area in front of the meeting with no bounce back up for the B wave then I'd have to think we are going deeper and that the B wave will be after the meeting (something positive would of course be said to spark that bounce). At this point I'd look for 8/2 or 8/15 low to be tested, which is 2790-2800, and that should end this coming pullback and allow another strong rally up to 3000+ in the coming months.

This is the best scenario for the bulls in my opinion as it gets the market oversold enough for a stronger rally back up. Failure to have any pullback (other then what we already have right now of course) and instead a turn back up for a higher high would very likely kill the chances of reaching 3000 in my opinion and setup the market for a very large drop in front of the midterms... which I'm sure Trump doesn't want to happen.

So I'm really leaning toward a drop for a week or so that gets the short term charts oversold so a stronger rally up the next few months can occur. For today we have a nice bear flag on the 60 minute chart so we might see some more sideways movement early in the day and a breakdown later toward the close, or it holds all day and rises small and breaks down tomorrow morning. Tough to call as the market waits on the 2pm EST Fed meeting Wednesday. So we watch and wait...

ES Morning Update September 21st 2018

0

The long awaited FP from 2/27 was hit yesterday so if it's going to work we should start down from here. Slowly at first of course with bounces along the way, but that should have been the high for awhile. Today is quad witching where 4 different asset classes expire. Dividend on the SPY are out today as well and it causes a drop in the price level to offset the payout. Over on the dividend.com website this morning it shows a $1.3226 payout for 9/21/2018 on the SPY, so we'll open that much lower on it for sure... plus any extra based on the futures price if they too pullback some today.

Right now they are basically flat (up a little) so hard to say where the market is going today. It's overbought of course and should pullback, but with the DOW making a new all time high one has to wonder if there's more upside still coming before a larger drop happens. For me I just have to go with the FP signal and it was fulfilled yesterday, so we should be close to a turn back down now. As far as technical s go, the daily chart of the SPX overbought with negative divergence but that's not a guarantee of a turn back down yet. The allure of the 3000 level could drag this market up or sideways for awhile longer but everyone becomes bullish and then it will rollover, falling short of hitting that level.

From the past when important "big even number" level are close I've noticed the SPX will get up into the XX70-XX90 zone before it dies out and rolls over. We topped at 2940 on the ES yesterday and only 2934 on the SPX, so there could be more upside yet to come before all the bears become bulls. Again, I just went with the FP on this move so I'm already as tall as mini me right now. I could be totally wrong and we could continue up but I had to go with the FP as they have been working really well this year. So, lets see where today takes us as it should be an interesting day with all those assets expiring. Have a great weekend.

ES Morning Update September 20th 2018

0

Slowly but surely the market is continuing to grind higher up toward that FP from 2/27 of this year. At this rate we could see it by the close today or maybe even tomorrow? Either way we are very close to a top in my opinion and then a 5-7% pullback at minimum... which could be just the first large A waved down to be followed by a B wave bounce and a possible crash (the C wave down) afterwards. It's still 50/50 on the crash wave I believe but I'm not overlooking it is possible. The A wave (5-7% correction) has high odds in my view as I've gotten two different FP's showing such a drop. But after it's done we could just as easily rally back up into the end of the year and top out over 3000 on the SPX, maybe even 30,000 on the DOW in early 2019... who knows?

Other good chartist are looking for 3100-3200 on the SPX by the end of this year, so either is possible. But I'll just play this market one move at a time. Right now I'm just waiting on the upside FP to be hit so I can short it for the 5-7% move down afterwards. From there I'd say I'll go long and see how high it goes? Maybe it dies after a 50% retrace and drops into a crash wave, or maybe it keeps going on up for another new all time high into the end of this year or early next? I'll just cross that road when I get there. For now I'm only "short alert" and patiently waiting. Good Luck to everyone.

ES Morning Update September 19th 2018

0

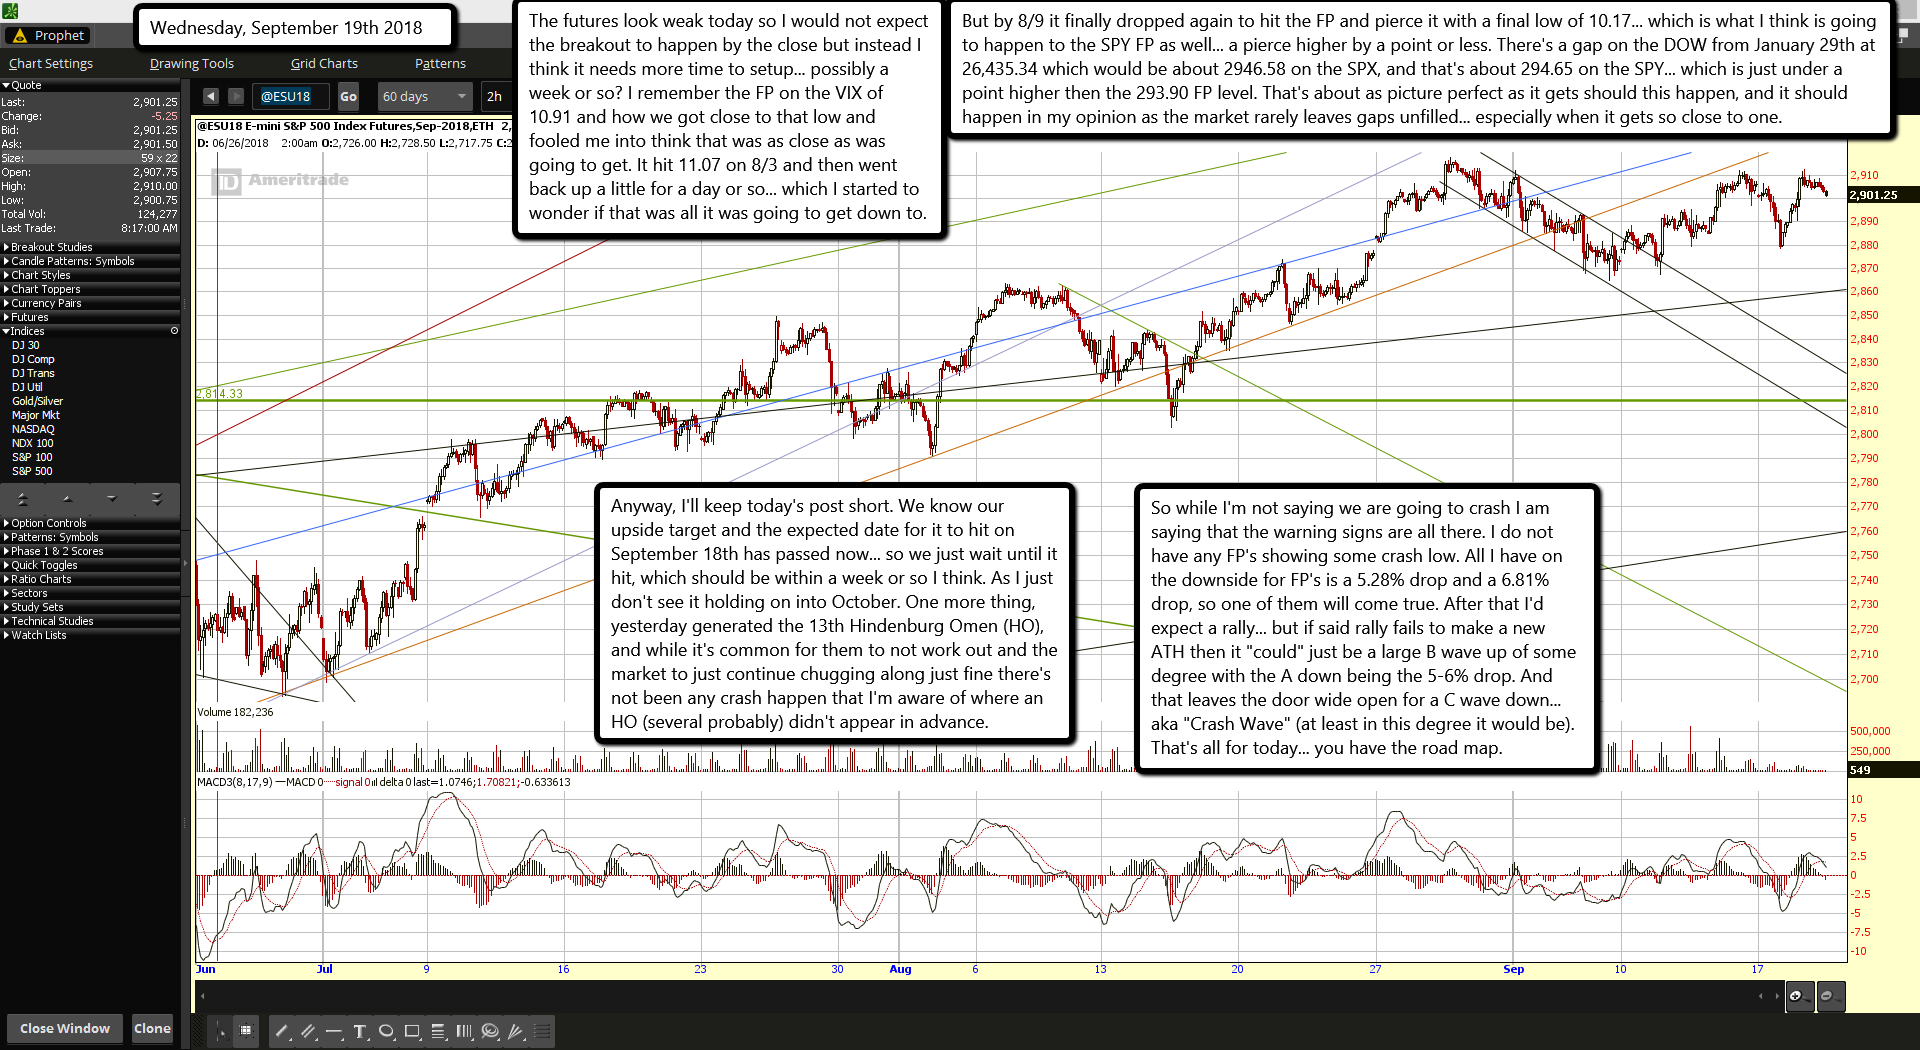
The futures look weak today so I would not expect the breakout to happen by the close but instead I think it needs more time to setup... possibly a week or so? I remember the FP on the VIX of 10.91 and how we got close to that low and fooled me into think that was as close as was going to get. It hit 11.07 on 8/3 and then went back up a little for a day or so... which I started to wonder if that was all it was going to get down to.

But by 8/9 it finally dropped again to hit the FP and pierce it with a final low of 10.17... which is what I think is going to happen to the SPY FP as well... a pierce higher by a point or less. There's a gap on the DOW from January 29th at 26,435.34 which would be about 2946.58 on the SPX, and that's about 294.65 on the SPY... which is just under a point higher then the 293.90 FP level. That's about as picture perfect as it gets should this happen, and it should happen in my opinion as the market rarely leaves gaps unfilled... especially when it gets so close to one.

Anyway, I'll keep today's post short. We know our upside target and the expected date for it to hit on September 18th has passed now... so we just wait until it hit, which should be within a week or so I think. As I just don't see it holding on into October. One more thing, yesterday generated the 13th Hindenburg Omen (HO), and while it's common for them to not work out and the market to just continue chugging along just fine there's not been any crash happen that I'm aware of where an HO (several probably) didn't appear in advance.

So while I'm not saying we are going to crash I am saying that the warning signs are all there. I do not have any FP's showing some crash low. All I have on the downside for FP's is a 5.28% drop and a 6.81% drop, so one of them will come true. After that I'd expect a rally... but if said rally fails to make a new ATH then it "could" just be a large B wave up of some degree with the A down being the 5-6% drop. And that leaves the door wide open for a C wave down... aka "Crash Wave" (at least in this degree it would be). That's all for today... you have the road map.

ES Morning Update September 18th 2018

0

Yesterday showed the first signs of weakness as Amazon dropped sharply and several other tech stocks. But the SPY held on strong the first half of the day fooling people into thinking it was a non-event. In the second half of the day the SPY finally succumbed to selling pressure and dropped fairly nice... at least it was more then what we've seen in a long time. Basically, it's cracks in the walls... which I was hoping it would start after the long foretold upside FP was hit.

Now it's make me wonder if they plan on pushing this turn date around September 18th out to another date unknown. I did not want to see the short term charts get this oversold before that FP was hit. And afterhours we can see that the SPY dropped even further before hitting a bottom and reversing back up this morning. I don't like that at all... feels like a bear trap. I would have liked to see the SPY turn back up afterhours and be overbought at the open but that's not the case. I get the feeling that move down was a wave 4 of some degree and the wave 5 up is about to start today.

If so then we could be in for another week or two of some wild swings both directions before a final squeeze up to the FP (around 2940 on the ES/SPX). Waking up the bears wasn't part of my plan to see the FP hit today and then the big drop to start. Now that the bulls screwed this up the market makers will undoubtedly do the bull-bear shake-and-bake for a week or two so both sides get trapped on the wrong side before the FP is hit and then the big drop starts. It's not a done deal here but my gut tells we are entering the Twilight Zone for bit and no moves in either direction will be real.

Today the bulls will see this move up afterhours and will suspect a new strong move up (like a wave 5) that they think will take out the current high. But if my gut is right the move up will stale and just trap bulls at a double top. Then bears will get on the southbound train and the next move down will stale out as well... probably just below the current low around 2883.50 (give or take a few points). From a wave count that could be labeled a C wave down if yesterday was the A down and today puts in the B up (all of the suspected wave 4 up of course).

Naturally wave C's are usually much bigger then A wave so bears will be expecting a breakdown of the low yesterday afterhours (around 288.20 SPY). So what if it falls short of that prior low on the ES/SPX (and/or SPY), and then rips back up again? I wish I had the exact road map as to how this is all going to play out but I don't unfortunately. So I just have to guess and stay in cash until the upside FP is hit. I've been here before in the past where the market makers take it close to a FP level and then back away for awhile. It's like they know more and more sheep are figuring out the FP's are real future targets so they can't just go straight to one but instead have to get those with itchy fingers to take a position early thinking the FP wasn't real or that it was "close enough" to being hit so they jumped in early.

Every time I did that in the past the market makers would go in my direction for a bit and then reverse and go hit the FP which screwed me (and everyone that went early) on my position. With time decay on options and the actual price going against I'd always have to bail for a loss. Then the FP hits and I don't take it because I already got shaken out and angry. Lesson learned here is that the market makers are really good at their jobs... which is ALWAYS to screw the sheep.

Anyway, my turn date for today seems unlikely now for the top being put in. It could happen but at this point they might have a secondary date planned. I know it's close as we have the Legatus Pilgrimage scheduled for this October 5th-12th and many times in the past big turns happen around them. It's where "they" go (Rome... the Vatican Bank) to launder their stolen money. Meaning that while I'm expecting this to drag out into that meeting it is possible that we drag out for another week or so to hit the FP and start the first wave down in front of the meeting and then the wave back up to top during the meeting, leaving the 3rd wave (the big drop) to happen right afterwards. Anyway... I'm still waiting.

ES Morning Update September 17th 2018

0

Good Monday morning to everyone. I hope that it was a great weekend for you as summer gives way to fall where temperatures are pleasant again and trees shed their leaves after first turning them into beautiful colors. Spending half my life in Jacksonville, FL I'd almost forgot how beautiful the fall period is up north, but now that's I'm here in Ohio I get to see the tree show their beauty again. Anyway, for today I really don't see much in the charts. It's probably going to be another light volume Monday, which favors the bulls.

But they are up against a double top so unless they gap over it afterhours or premarket I doubt if they get through it today... possibly, but not high odds. Doesn't matter to me as I'll just wait another day as I do see one more push higher to hit the FP on the SPY before topping out. So again, September 18th (tomorrow) would be my best guess on this hitting and ending the long rally up from January 2016. A large correction (or crash?) should follow but how large is just anyone's guess.

But 5-6% down should be a given and from there we'll just have to see what happens. If the bounce back up fails then the next move down would turn the correction into a crash with 30-50% down a real possibility. I'm not putting any odds on it as I just don't know? But the 5-6% down does have high odds of happening. This could all be a political move to blame on Trump where we see the first drop in front of the election and the crash afterward in November. It would be a failure of the Republicans to keep control of both houses in the midterms this November election.

Certainly it's already set as the elite know the outcome of the elections and therefore the plans for the stock market. I know, you were told that the elite were surprised by Trump winning as they wanted Hilary... not true. That's just more of the lies they want us sheep to believe. Trump was pre-selected to be president by in the year 2000 as seen on the Simpson show where he walks down an escalator and waves while someone in the crowd above drops a sign he's holding... which was done 16 years latter in real life when Trump really did win. This was foretold back then and it really happened. The stock market correction or crash is planned years in advance as well. This November election is planned and while we don't know the outcome they do.

It's up to us to guess at whether they are done using Trump or not? If they are finished with him then the midterms will go to the Democrats and stock market will crash. If not, then only the correction in October and we'll see another strong leg up into 2019-2020. I have two FP's showing the 5-6% drops but I don't have any for the crash... so maybe it won't happen and all will be well this year. I hope so as a crash of this magnitude (like 1929 or 1987) would really hurt a lot of people and I'd hate to see that happen just for them to make Trump look bad. Better to keep him in so he can arrest more satanist pedophiles and keep draining the swamp.

ES Morning Update September 14th 2018

0

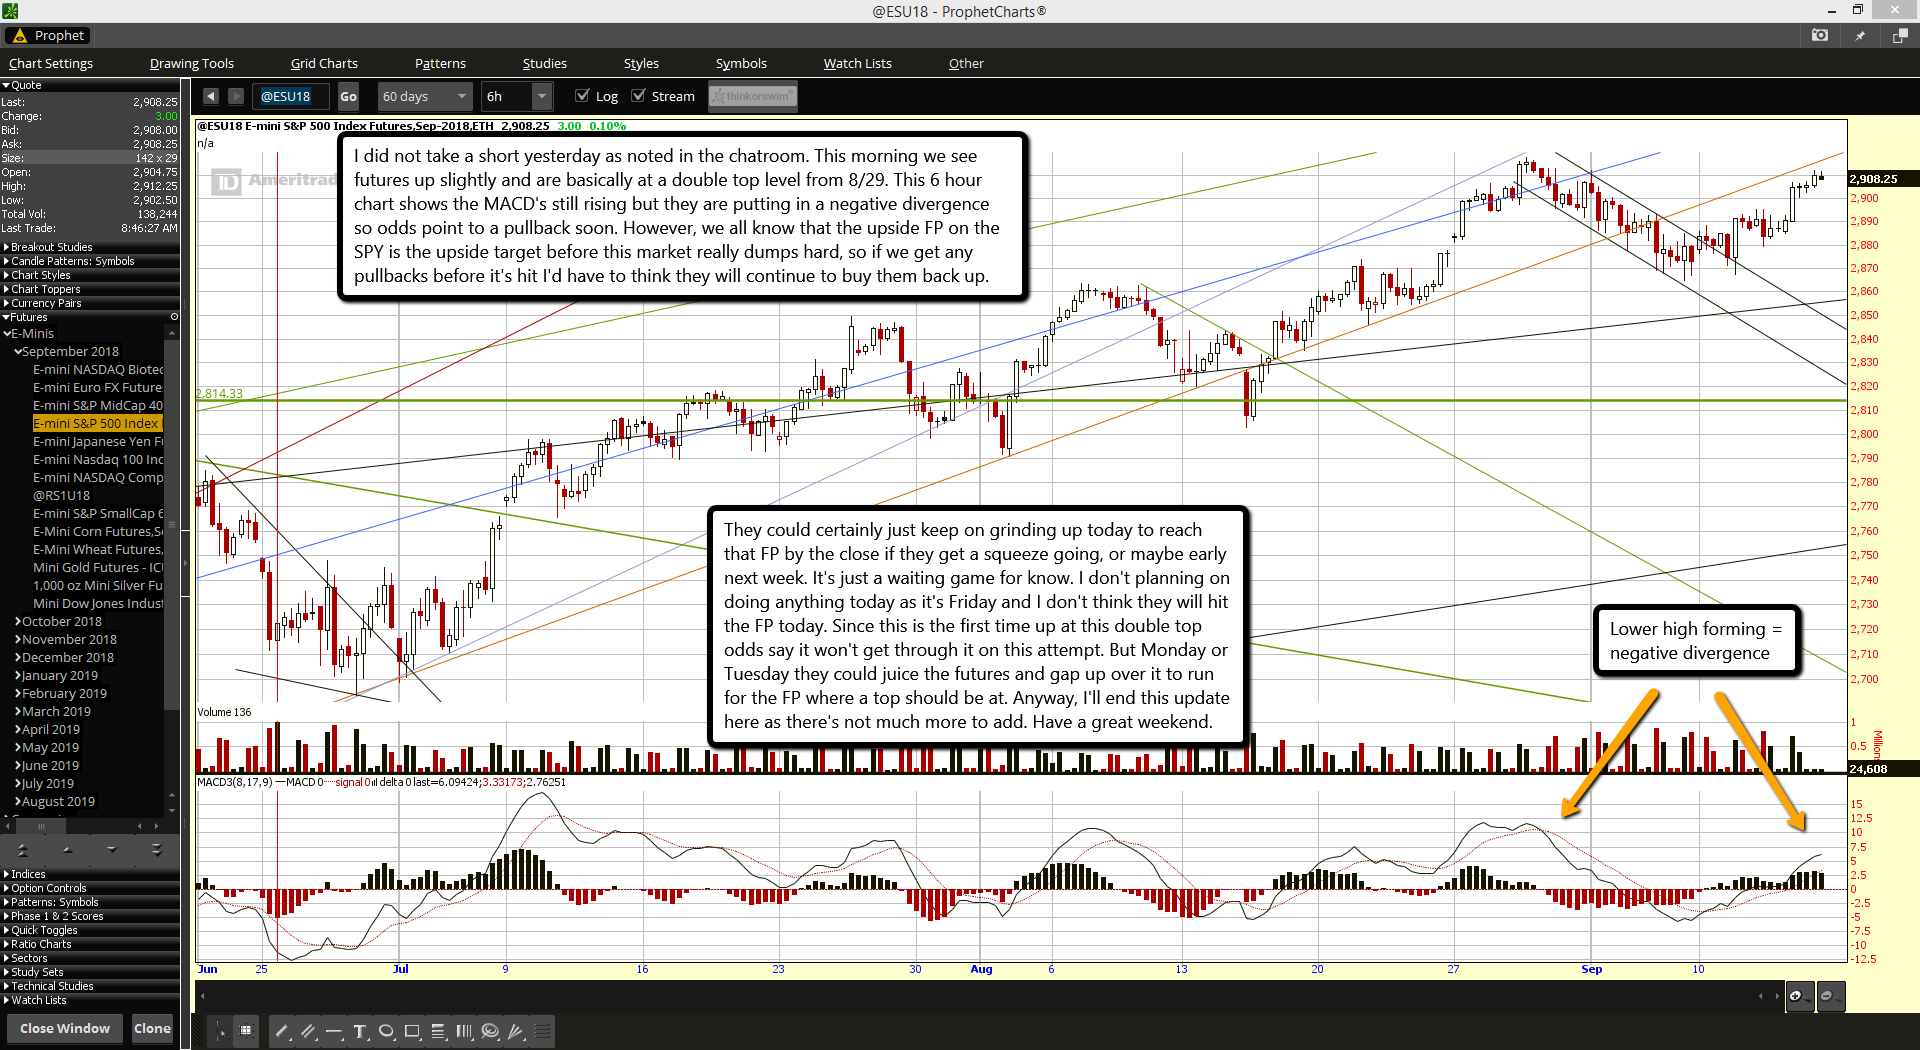
I did not take a short yesterday as noted in the chatroom. This morning we see futures up slightly and are basically at a double top level from 8/29. This 6 hour chart shows the MACD's still rising but they are putting in a negative divergence so odds point to a pullback soon. However, we all know that the upside FP on the SPY is the upside target before this market really dumps hard, so if we get any pullbacks before it's hit I'd have to think they will continue to buy them back up.

They could certainly just keep on grinding up today to reach that FP by the close if they get a squeeze going, or maybe early next week. It's just a waiting game for know. I don't planning on doing anything today as it's Friday and I don't think they will hit the FP today. Since this is the first time up at this double top odds say it won't get through it on this attempt. But Monday or Tuesday they could juice the futures and gap up over it to run for the FP where a top should be at. Anyway, I'll end this update here as there's not much more to add. Have a great weekend.

ES Morning Update September 13th 2018

0

Looking at the futures this morning it's looking like they are making another run up for a double top, which appears to be a hit of the rising brownish-orange trendline. If this rally extends out into Friday then it would be a higher high of course. But it's not looking good for the bulls right now as far as reaching that FP on the SPY from 2/27 this year. Possibly they top out today and drop on Friday several hundred DOW points (maybe 30-50 SPX points?) to wake up the bears and setup a final short squeeze back up into the middle of next week?

It's really a tricky spot here as they gave us the upside target with the FP but they haven't hit it yet and appear to be too weak to keep rallying up for several days to hit it. Believe me, I'd love for them to just rally up today and tomorrow to hit and then I'd take the short. But my gut (and the weak charts) tell me that the bulls are likely too weak here to get past this double top area on the first hit. I hope they do but I wouldn't be surprised if we don't see them rollover tomorrow after failing to get through that zone today. If you look at it from a wave count you could say the first move down from the 8/29 high into the 9/7 low could have been just an A wave of some degree inside a wave 4 down.

Then the rally up from that 9/7 low to a possible double top today would be the B wave up of that wave 4 down. Then tomorrow we could see the C wave down of 4 down to end the ABC 4th wave, which should wake up enough bears for a nice short squeeze into next week for the final 5th wave up into that FP from 2/27. Just a thought there guys as I'm not an expert on wave counts but do follow other experts and include their possible counts from time to time.

So, the question will be... do I short at today's close to catch that C wave down of wave 4 or not? We'll I can't answer that before the market opens in this morning update but I'll post it in the chatroom today at the close if I go short. I'll be looking for the market to close up near the highs for the day and for a double top to have happened. If this works out then the C wave down should go back into the falling channel area before ending is my best guess. So it could be a nice move that should make some good profit if timed right. Good luck as always.

P.S. If I'm wrong on the wave count (and the FP) and the high is put in today then I'll be very glad I shorted. 🙂

ES Morning Update September 12th 2018

0

Nine years ago today I started this blog. It's hard to believe I'm still doing it. Back then using disqus for you comments was the newest "cool" thing that many wordpress users switched to. Today I'm sure it's still around as I see some blogs with it still but others went back to the native wordpress comments as it evolved to allow users to login via twitter, google plus, fackbook, or wordpess... which back then people had to sign up with wordpress to create an account just to post on someones blog.

Things have changes for sure since then. Facebook was just getting started and MySpace was still the hot new thing. The stock market had bottomed earlier that year from crashing in late 2008. I had little to no knowledge about understanding technicals and other charting methods... but I learned as time went on. I discovered my first fake print a few months later on January 11th, 2010... and at the time I didn't know what to call them so I made up the name "Fake Print" and today I've seen many well known sites like ZeroHedge start calling them that name too... LOL. When I saw that FP (fake print) hit a month later I knew then the market was rigged.

Since then I've had to learn more cryptic methods and look for signals via numerology in the price as well as the date, plus the FP's. It's not easy to predict as the people that control the market allow certain technicals to work I'd guess about 80% of the time. Then they completely fail and your only hope is if you caught some FP and/or some codes in the numbers. It is what is is I guess, for if it were a fairly traded the market the elite couldn't get rich as the smart poor traders would start winning too much.

Anyway, enough about that. For today I really don't see anything to lean the market one direction or the other. Odds aren't high for a rally or a deep drop (due to the lack of volume). Both the 2 and 6 hour charts look exhausted and want to rollover but without volume they could just reset back up in another day or two. The daily chart is overbought too and is rolling over on its MACD's. The weekly chart shows negative divergence on it as well. Everything signals a move down is coming soon, but the "when" part is tough to predict. Next Tuesday is 09/18/18, which is 999 or 666 upside down. Possibly that will be the date we top and start the next drop? But this week it's looking more like more light volume chop to tease bears and bulls alike. I'd love to see a blow off top to the FP I got back on 02/27/18 but we're still about 30 points (SPX) below it now... so it's a ways off yet. That's all I have for today.

ES Morning Update September 11th 2018

0

Yesterday I talked about the morning open being some kind of wave 1 up from the Friday low and that it should backtest the upper trendline in the falling channel... which it did early on, and bounced, but since then has rolled back down lower again. That's the reason I wasn't chasing the "potential" wave 3 up as I was unsure of the wave account and didn't like the overall negative vibe for the month of September. Then there was the early Sunday morning FP on the SPY that I didn't mention in yesterdays update but shows a low of 286.45 around 4 am EST, which just might be the downside target low before any rally starts. Of course that changes the wave count as it's lower then Friday's low, so I'll just re-guess at a new count when it appears.

As far as the 2/27/2018 upside FP on the SPY, it's not looking go to be hit right now. The all time could be in? However, I'll give this another week to see if the bulls can get something going or not. But by the early to mid next week they need to rally or else I think it will be too late as the September pullback, correction, or crash will probably be in the starting down waves already. For today though I'll keep it simple... look for that 286.45 FP to be hit on the SPY as your downside target where a turn back up should happen. From there I'll decide if I want to risk a long or just wait for a short. Good Luck.

P.S. It's sad to think that an estimated 20,000 people were murdered by the Bush family 17 years ago when they took down the twin towers and other buildings with explosives as well as flew a missile into the Pentagon all just to steal the assets of another country and spread fear here in America so they could get their "New World Order" of massive freedom violations, privacy invasion, accepted scanning and chipping of people, and who knows what else... off to a great start. People now have to remove their shoes at airports for NO REASON just because the powers that be continue to suppress freedom by the people and want us all as their slaves. May the entire Bush family find a nice warm fire in hell where they all are going to one day. And let's have their friends in the Rockefeller, Rothschilds, Morgan, Soro's, and so many other evil families join them for a fire side picnic.

ES Morning Update September 10th 2018

0

Happy Monday to everyone. Looks like an exciting week is in front us now as the futures are up some and out of that falling channel. On the 6 hour chart the MACD's made a bullish cross so I expect this move up to last awhile. However, on this 60 minute chart we can clearly see it's overbought and acting like it wants to rollover. This is common I think as what we might see is a backtest of the upper trendline in the falling channel to make a wave 2 down of some degree while the breakout upside move is the wave 1. It would also make a right shoulder of an inverted head and shoulders pattern, so that too will aid in the next move up after the backtest.

However, don't put a lot of weight in an inverted head and shoulders pattern that is up near the highs as they work best when coming off an important low... which was ages ago. Never the less though the charts are aligning short term bullish. The daily and weekly though are still very overbought and ready to pullback anytime now. And the weekly and monthly now have negative divergence setting up. Those charts tell the big picture of course, which means an important all time top could (should) be put in before this year ends... one that could last 1-2 years or more. But that's thinking too far ahead so let's save that for another day.

For now I'll just be watching the pullback closely today to see if it sets up a nice wave 3 up into Tues/Wed that I might take a tiny long on. But make no mistake I'm expecting a super nice short here very soon where I'll load the boat up with SPY Puts... in the meantime though I will just look for some small quick in and quick out SPY Calls. If I take long it will be like trying to get the last penny in front of the steamroller that is about to turn around and go down another road just full of new coins. Who knows? I'll probably chicken out on the long and just wait for the short... LOL. Anyway, time for some coffee so I'll end this update here.

ES Morning Update September 7th 2018

0

Looks like the futures are dropping a little more this morning. This is a very controlled descend in a nice falling channel. This doesn't look like the start of a serious drop to me but more of a pullback before another run up to (hopefully) the FP on the SPY sometime next week. It still acts and feels like some degree of a wave 4 down and this coming 5th wave up should end a very long multi-month rally up. I don't see much in the way of high odds setups for today so I'll keep this post short. We might see the bottom of this move down today or it could extend into Monday?

I'm not interested in playing it on the upside unless I can see a clean bottom, then a wave 1 up and 2 down of this 5th wave up. If I see that happen with positive divergence setup too then I might try to catch the wave 3 up inside that 5th wave up. But I doubt if it appears today and is that obvious to catch. Most likely SkyNet will trick people by doing the wave 2 down into the close of a day like today where it can trap shorts over the weekend and then gap up on Monday for the start of the wave 3 up of the 5th wave.

Or it waits until the close on Monday to do it? Ideally we drift down into the close today to end the 4th wave down, then gap up on Monday for the wave 1 up of the 5th wave, and right shortly there after (like within the first 30 minutes of the day would be perfect) we drop for the wave 2 to retest the closing level that will be set in today... but stay slightly above it. That would make for a perfect setup to go long on the wave 3 up of the 5th wave. Will it happen? I doubt it, but it's about the only setup I'm interested in going long on (small long). Anyway, have a great weekend and be on the alert for a top next week and a nasty drop to follow afterwards.

ES Morning Update September 6th 2018

0

Yesterday gave us a small bounce in the morning but it never held and dropped right afterwards to an early low that was followed by a retrace back up to just down a few points. Basically it was a failed up move attempt. I thought it would hold most of the day and possibly sell off in the close but it was too weak I guess. I glad I never took a long as I'd rather wait for a higher odds setup, which right now might end up being a short instead of a long.

I'm beginning to think that the entire move down from the high last week is just some A wave and that if we can get a B wave up today into the close then there's pretty good odds that a C wave down will start as early as tomorrow. It's possible that it gets delayed to Monday so I'll have to watch closely to see how the charts align up and then just guess in the end on whether the B up is complete or not.

This is the ideal setup where I'd be interested in a short but if the market fails to get going to the upside today and continues down then we are likely still in the A wave and any B up would be delayed or completely canceled. What I mean by "canceled" is that I'm only guessing on this wave 4 down subdividing into an ABC pattern and that we are only in the A part now. It's completely possible that the wave 4 down doesn't subdivide and it just ends up being one wave down (a choppy one that could have some tiny ABC's inside it but they are hard too count so I won't). If it ends up being one wave down I'm sure we'll be able to go back after the fact and find some subwaves inside it.

But for now I'm not focused on that as I only want to catch a high odds setup. If it's just one wave down then we should continue down some more today and possibly early Friday too. At that point it should be oversold enough to end the wave 4 and let the wave 5 up start. But a strong bounce here would likely lean more toward this wave 4 down subdividing into an ABC down, which I'd like to short the top of that strong bounce wave (the B up) if possible. It's tricky here so I really can't tell you which way the market is going today. I can just give you the possible outcomes and what I'll be looking for. If you want more updates you can always stop by the free chatroom where I'll post any shorts or longs I take if a high odds setup appears. Good luck.

ES Morning Update September 5th 2018

0

As expected the bulls decided to rest a little yesterday to work off some overbought charts. This morning we are down a little more on what appears to be some degree of a wave 4 down. It's resting right on that rising brownish orange trendline of support and the entire move down looks very controlled, which again suggests bulls are in full control here. This move down should end today (maybe at the open?) and we should see the start of the wave 5 up afterwards.

It shouldn't be an easy rally as there's lots of resistance overhead but the downside seems very limited too... meaning we could be rangebound all week and not breakout and run for that FP overhead on the SPY until next week. Other then quick day trades I just don't see any strong multi-day setup on the long side here. It should be good for a quick 10+ points though but there's no 50-100 points alignments setup here. I do see that coming though, but it should be a down move, not an up move.

For now though the trend is a slow choppy grind up, not a steady short squeeze up everyday like the January 26th top. Why? Because we are having very light volume every day now on this rally and that's not shorts getting squeezed. It's just a float higher due to a lack of sellers. When you look at the December, 2017 to January 26th, 2018 volume on the SPY you'll see it was in the 90's or more and climbed up to over a 150 million into that January high.

Of course the selloff seen even larger volume, but right now we have been in the 40-80 million shares range all summer long... like since April or so. That's not a short squeeze, nor is it health buying by big institutions. So what does it mean you ask? It tells me that the big boys are aren't selling anything from buying the Jan/Feb selloff lows, nor are they adding more longs. They seem to be waiting to see what happens, like if we go on up to SPX 3000+ or if we breakdown through some important support levels. With this lack of conviction on the long side (not much new buying I mean) this bull market rally from the lows early this year will run out of gas soon. When is the question of course.

My guess would be when volume increases like it did just a week or two prior to the January 26th high. That should be the time when the shorts are getting squeezed out and when the last of the retail (dumb money) is going long. It could happen at the FP on the SPY but that might just be a temporary top as I still think we'll see 3000+ on the SPX by the end of this year or early next.

But still, there's a steep correction (or crash) coming before that level is reached in my opinion. Too many sheep see that level and will be all-in long when we get a little closer (like the FP area). For today though I again think we'll bottom early and start back up later today for a decent bounce that could be played for a day trade. But I don't see the current high being taken out just yet... probably not until next week.

s2Member®