Saturday, July 25, 2026
Home Blog Page 45

ES Morning Update August 3rd 2018

0

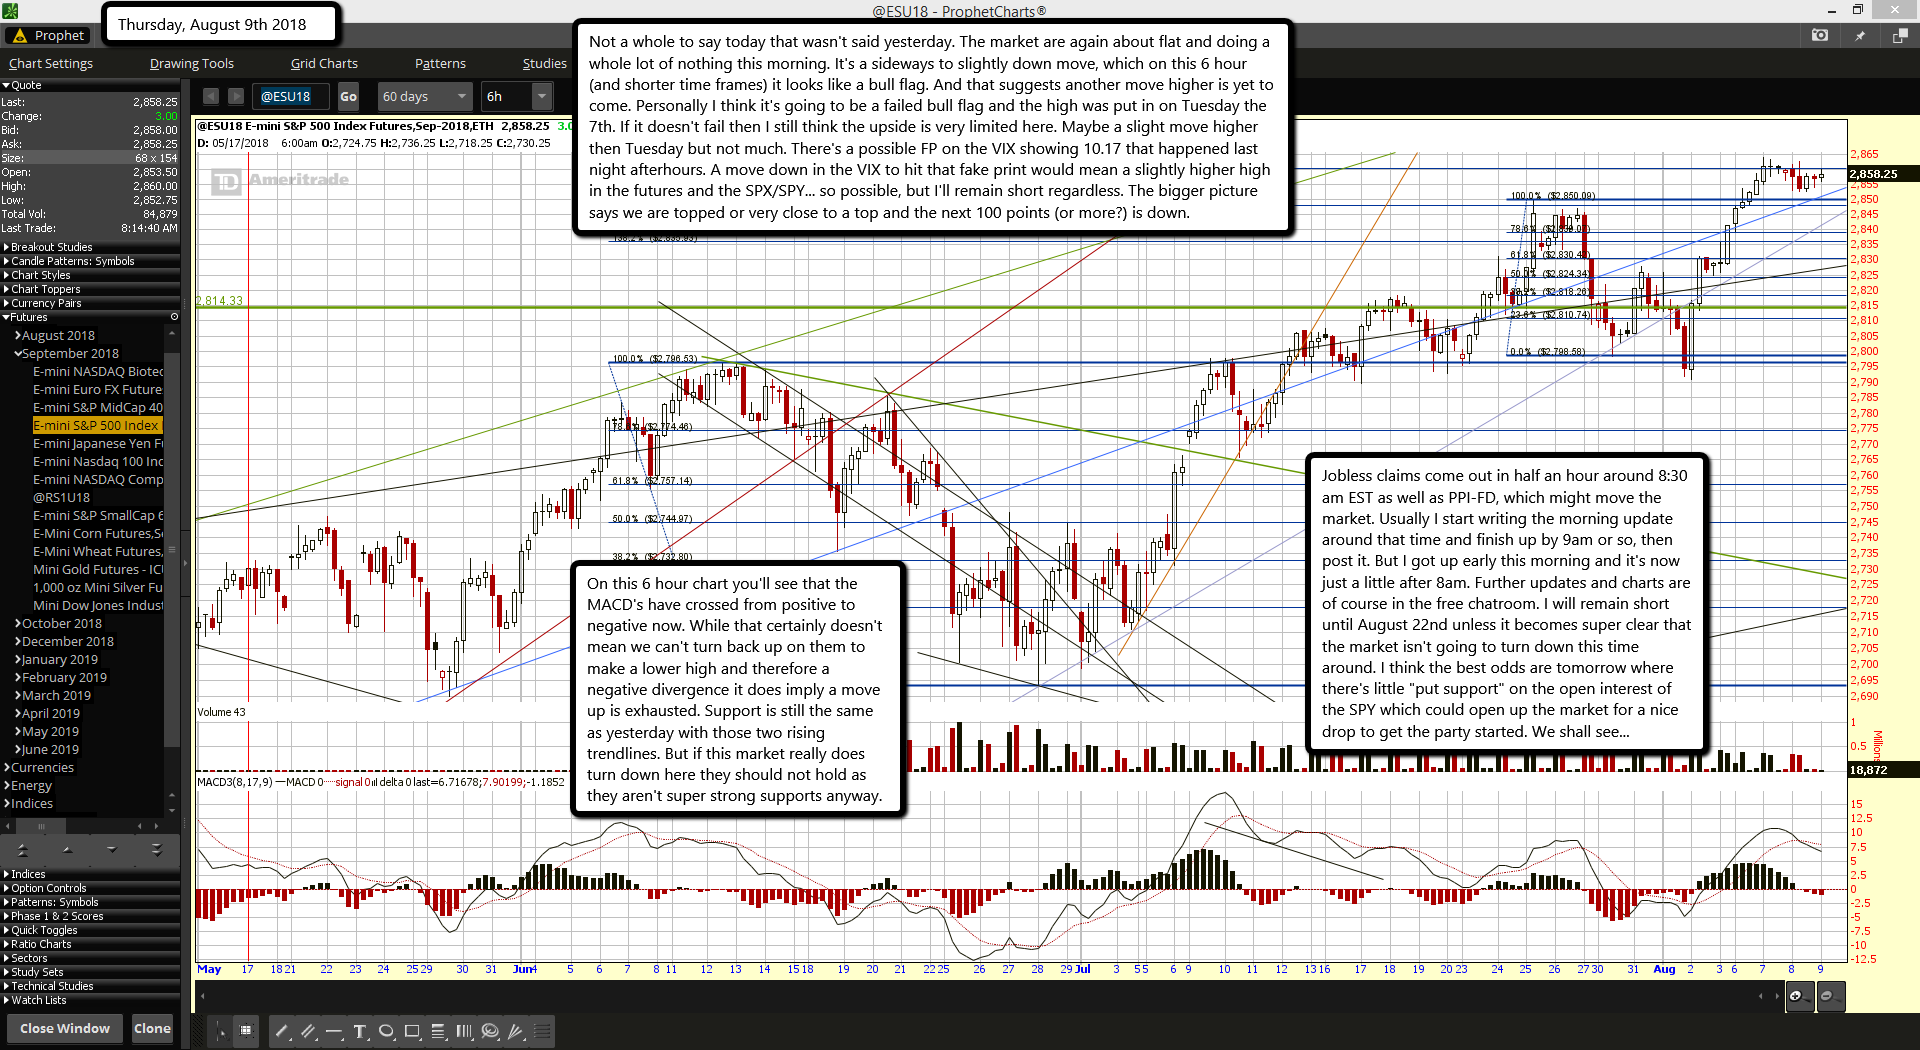
The FP on the SPY from last Friday has now been hit this premarket morning. As for the wave count... it looks like the move up from yesterday was some kind of B wave with the entire move down from the 8/25 high of 2849.50 to the low yesterday at 2791.00 being the A wave. I'm unclear on how it broke down so I won't even bother to try and label all the sub waves.

The most important thing here is that today should put in a top for that B wave and the C wave should start down next week. I'm still not sure about how big of a drop this is going to be so we'll have to play that one by ear... so to speak. It could be just a shallow move down to 2750-2770 area (the baby bear scenario) or a much deeper drop to 2600 or below (mamma bear). The only thing I know for sure is that I fully expect the masses to be fooled.

I'll be shorting today and will be prepared to hold until the end of August if need be. If this turns out to be mamma bear then the 2750-2770 area might just be a large A wave and after some Fibonacci retrace level for the B wave the C takes us down to 2600 or below. If so it should all play out in the month of August.

Typical moves like this take 18-20 calendar days, so let's all try not to get fooled on this move. For today I expect sideways action most of the day within a range of 282.50-284.00 on the SPY. We'll probably close nearer to the low range due to "option pinning". Have a great weekend and if you are a bear go get your dinner table set as the next several weeks you can feast (hopefully... LOL).

ES Morning Update August 2nd 2018

0

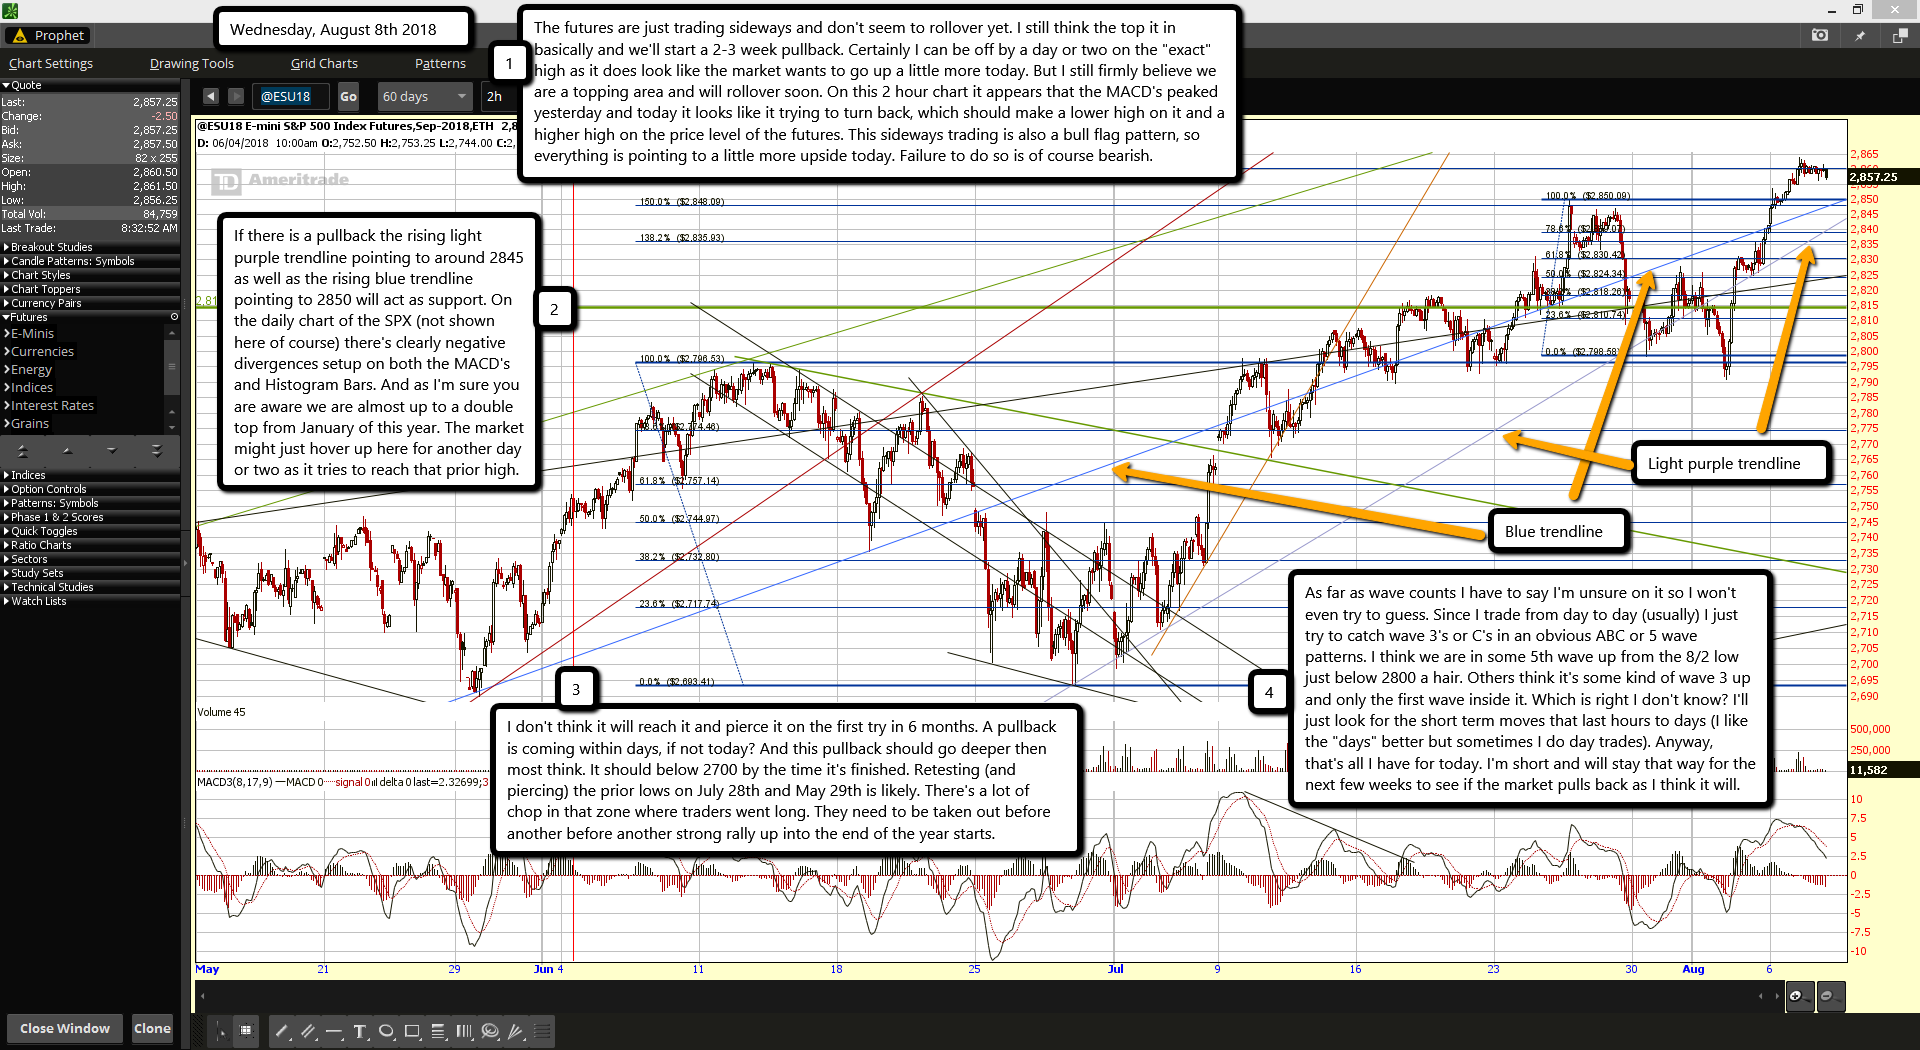
With the future down again this morning the ABC up wave count is now toast. The 7/30 low to the 7/31 high must have been a simple one wave structure to make a B wave up instead of my thoughts that the B wave would sub-divide into 3 smaller waves to make an ABC "B wave" up. So that high of 2827 is where the C wave down started, and since they subdivide a lot into 5 wave patterns (or more) we appear to have had the wave 3 down of 5 in this premarket session.

Any move up today will likely be shorted as it's probably a wave 4 of a C down. Then the wave 5 down should end it all in the next few days. This is now looking like the bear cub sell off from the 2850 recent high and not the momma bear drop. It should bring into play the prior target zones of 2750-2770 as a low for the 5th wave down of the C wave down, which should be hit early next week I'd guess.

This has been a tricky move down for me as I've gotten half the calls wrong from the recent high. The big short got killed yesterday that was going to appear at today's close, as the bulls are stair stepping this market down slowly each day to keep the damage to a minimum thereby allowing the next move up to be a powerful one that takes them to new all time highs and beyond. If they would have closed green yesterday and today they would have brought on mamma bear and we'd seen a much larger drop happen, which would have set the bulls back on their rally up into an October high and push it out a couple of months into December I believe.

But as long as the bulls hold the DOW above 25,000 on a closing basis the rally up should start soon and peak in October. The bottom line here is this move down does not look as bearish now as previously thought. It should end soon and the bulls should take back control. There's been no fear on this drop as every day continues to produce light volume on the SPY, which tells me it's a very controlled move down. So again, a bottom is near. It could be today if I get the wave count wrong again? I'm not an expert at Elliottwave so I could have missed a wave somewhere? Anyway, that's all I see for today.

ES Morning Update August 1st 2018

0

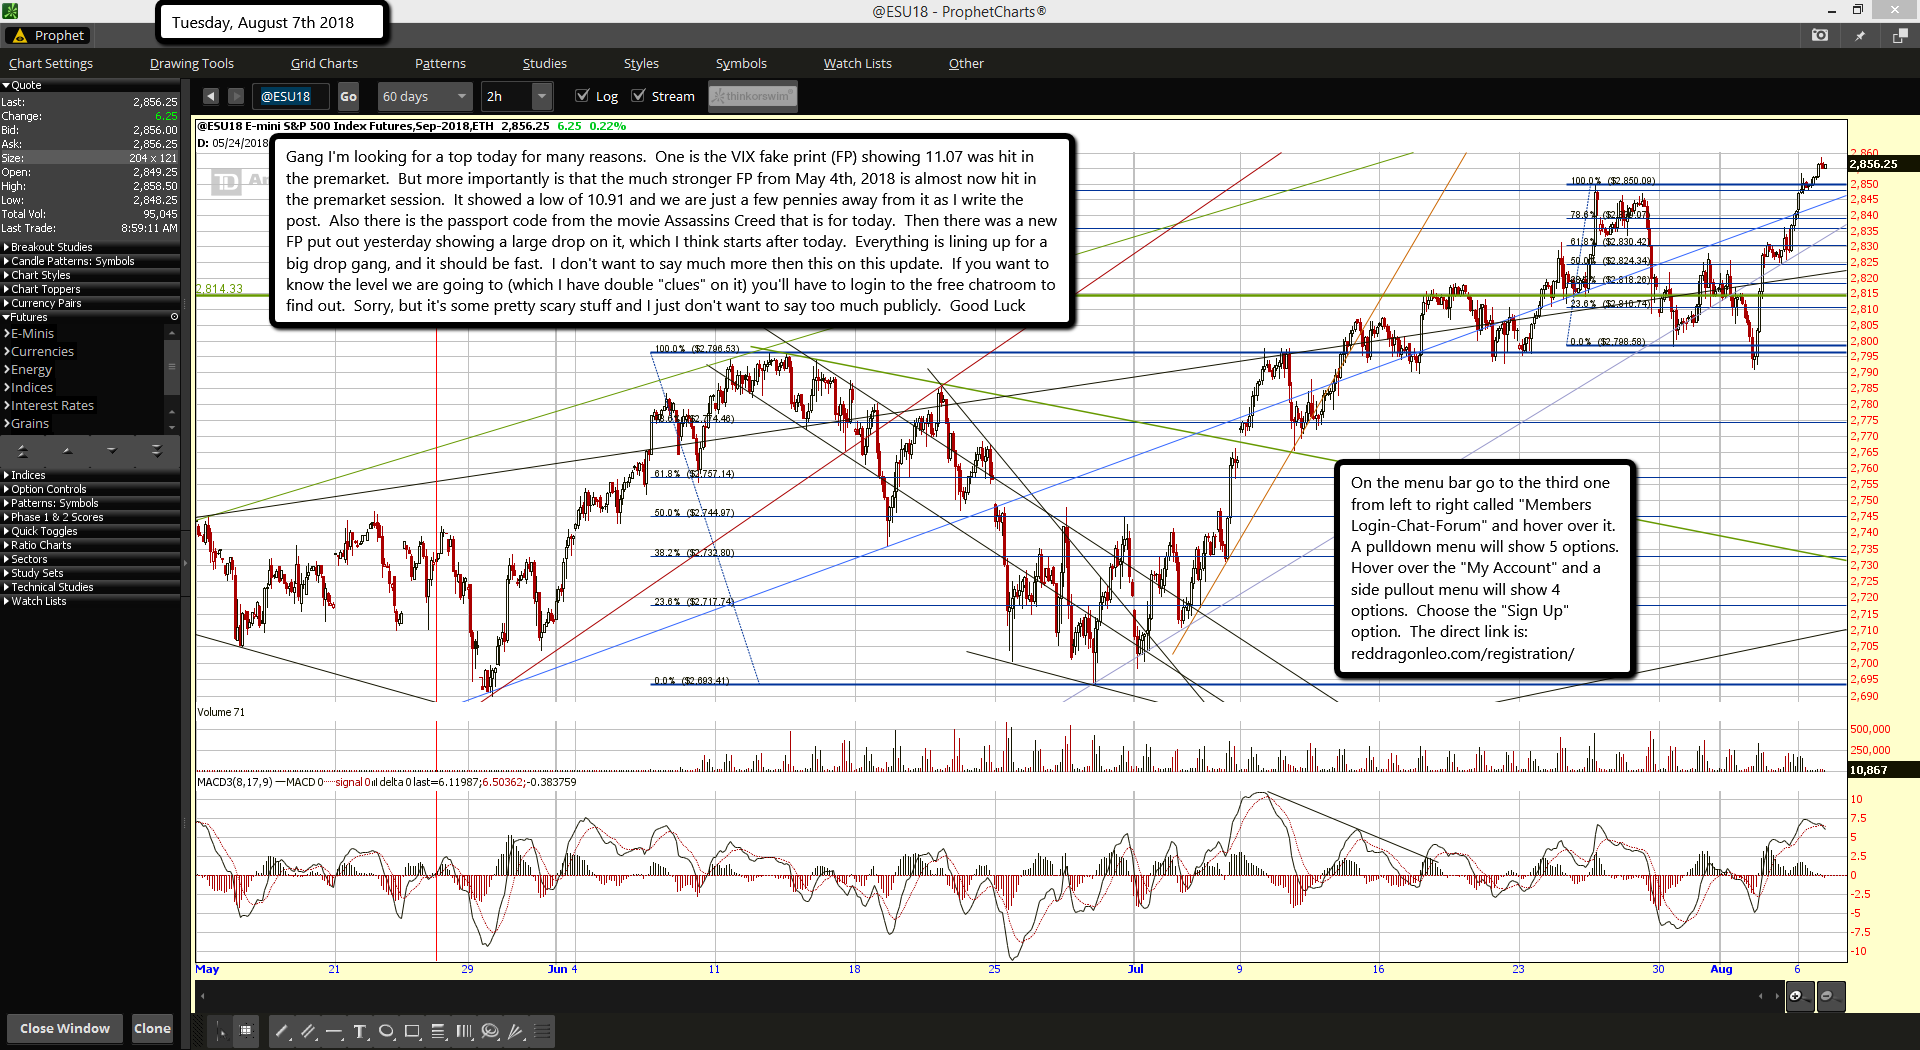
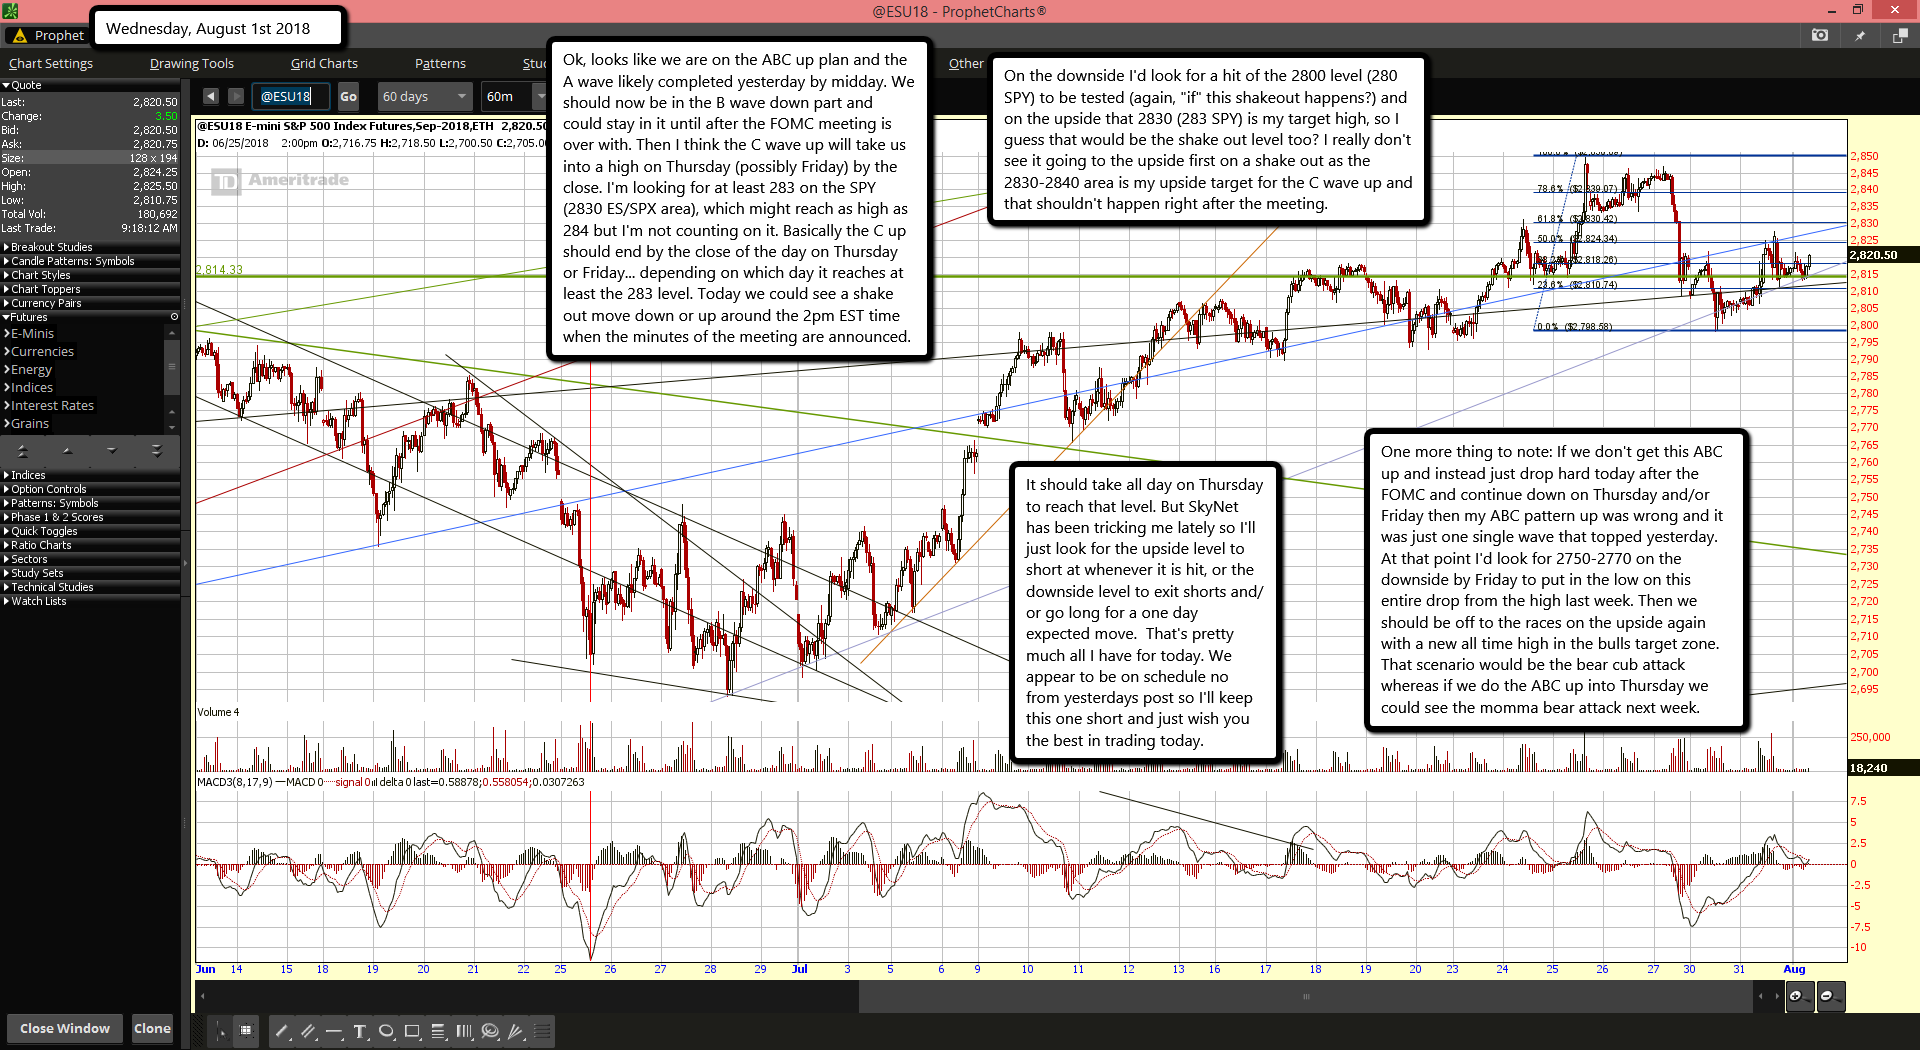
Ok, looks like we are on the ABC up plan and the A wave likely completed yesterday by midday. We should now be in the B wave down part and could stay in it until after the FOMC meeting is over with. Then I think the C wave up will take us into a high on Thursday (possibly Friday) by the close. I'm looking for at least 283 on the SPY (2830 ES/SPX area), which might reach as high as 284 but I'm not counting on it. Basically the C up should end by the close of the day on Thursday or Friday... depending on which day it reaches at least the 283 level. Today we could see a shake out move down or up around the 2pm EST time when the minutes of the meeting are announced.

On the downside I'd look for a hit of the 2800 level (280 SPY) to be tested (again, "if" this shakeout happens?) and on the upside that 2830 (283 SPY) is my target high, so I guess that would be the shake out level too? I really don't see it going to the upside first on a shake out as the 2830-2840 area is my upside target for the C wave up and that shouldn't happen right after the meeting.

It should take all day on Thursday to reach that level. But SkyNet has been tricking me lately so I'll just look for the upside level to short at whenever it is hit, or the downside level to exit shorts and/or go long for a one day expected move.  That's pretty much all I have for today. We appear to be on schedule no from yesterdays post so I'll keep this one short and just wish you the best in trading today.

One more thing to note: If we don't get this ABC up and instead just drop hard today after the FOMC and continue down on Thursday and/or Friday then my ABC pattern up was wrong and it was just one single wave that topped yesterday. At that point I'd look for 2750-2770 on the downside by Friday to put in the low on this entire drop from the high last week. Then we should be off to the races on the upside again with a new all time high in the bulls target zone. That scenario would be the bear cub attack whereas if we do the ABC up into Thursday we could see the momma bear attack next week.

ES Morning Update July 31st 2018

0

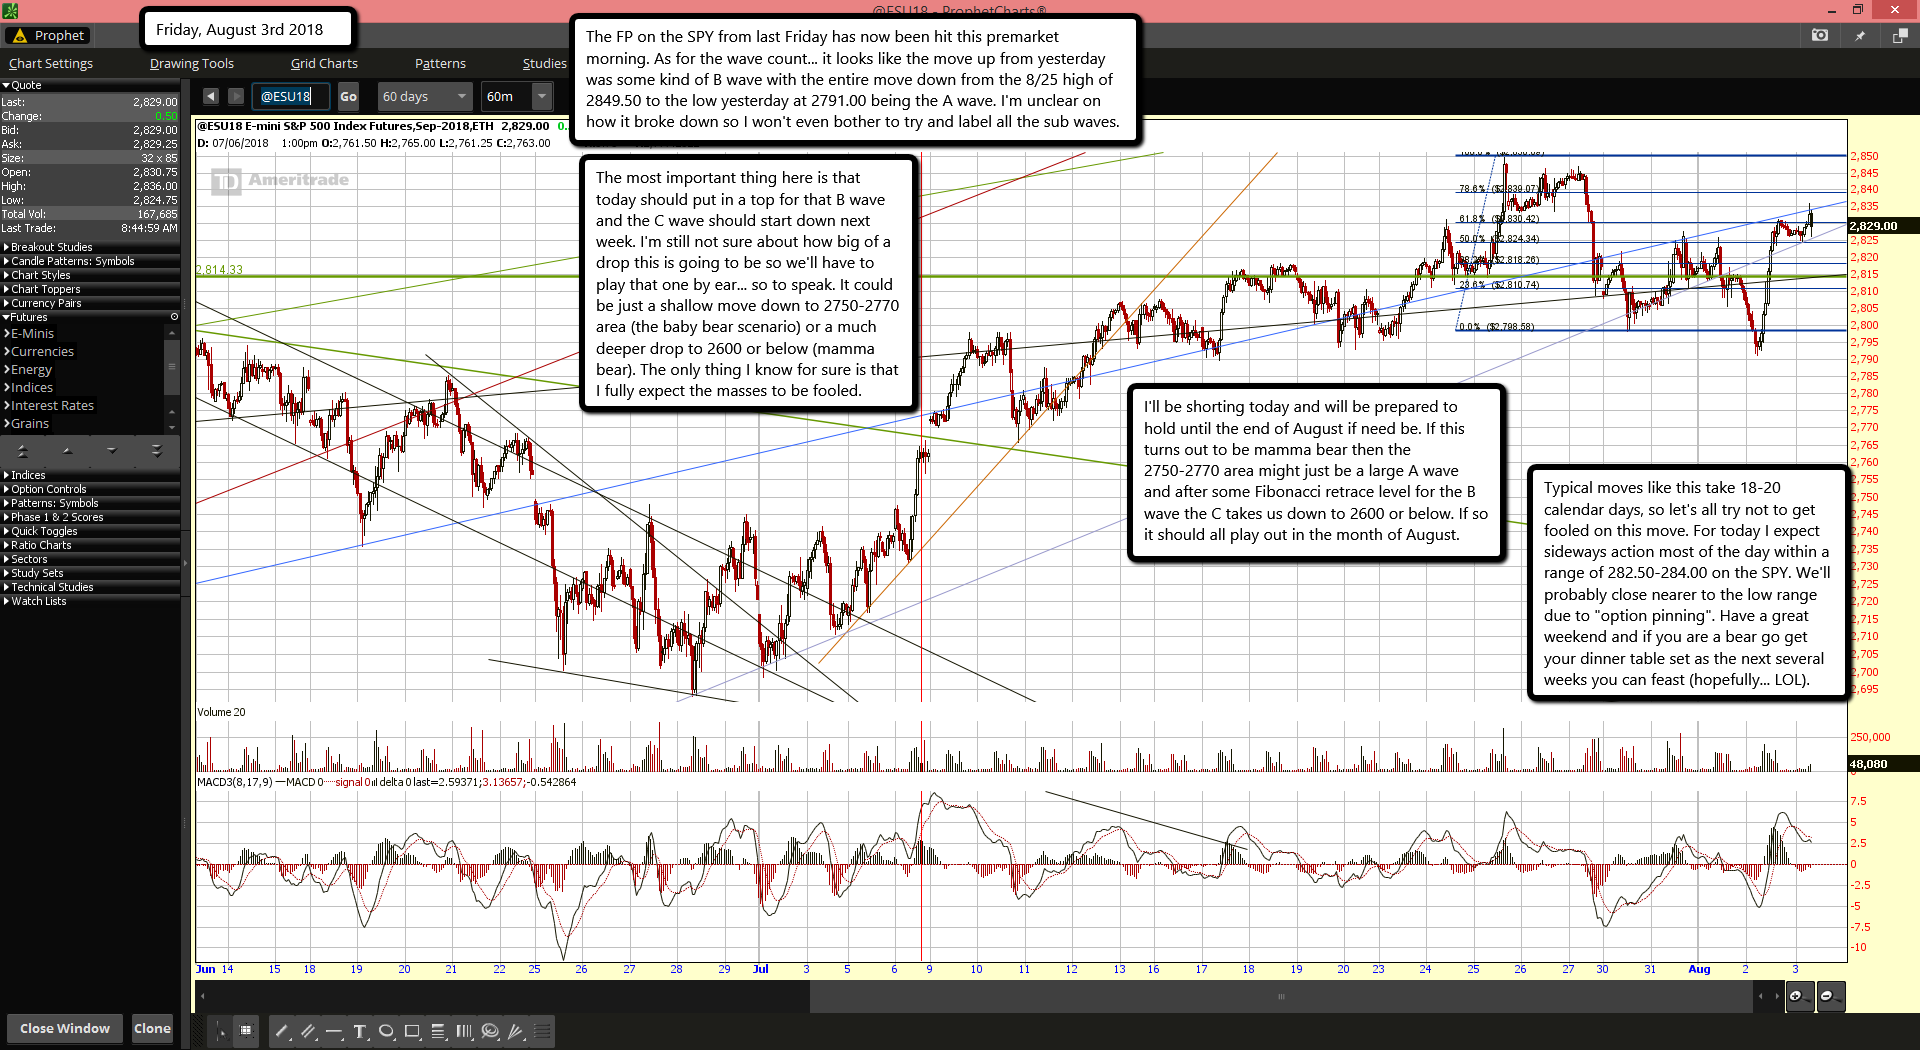
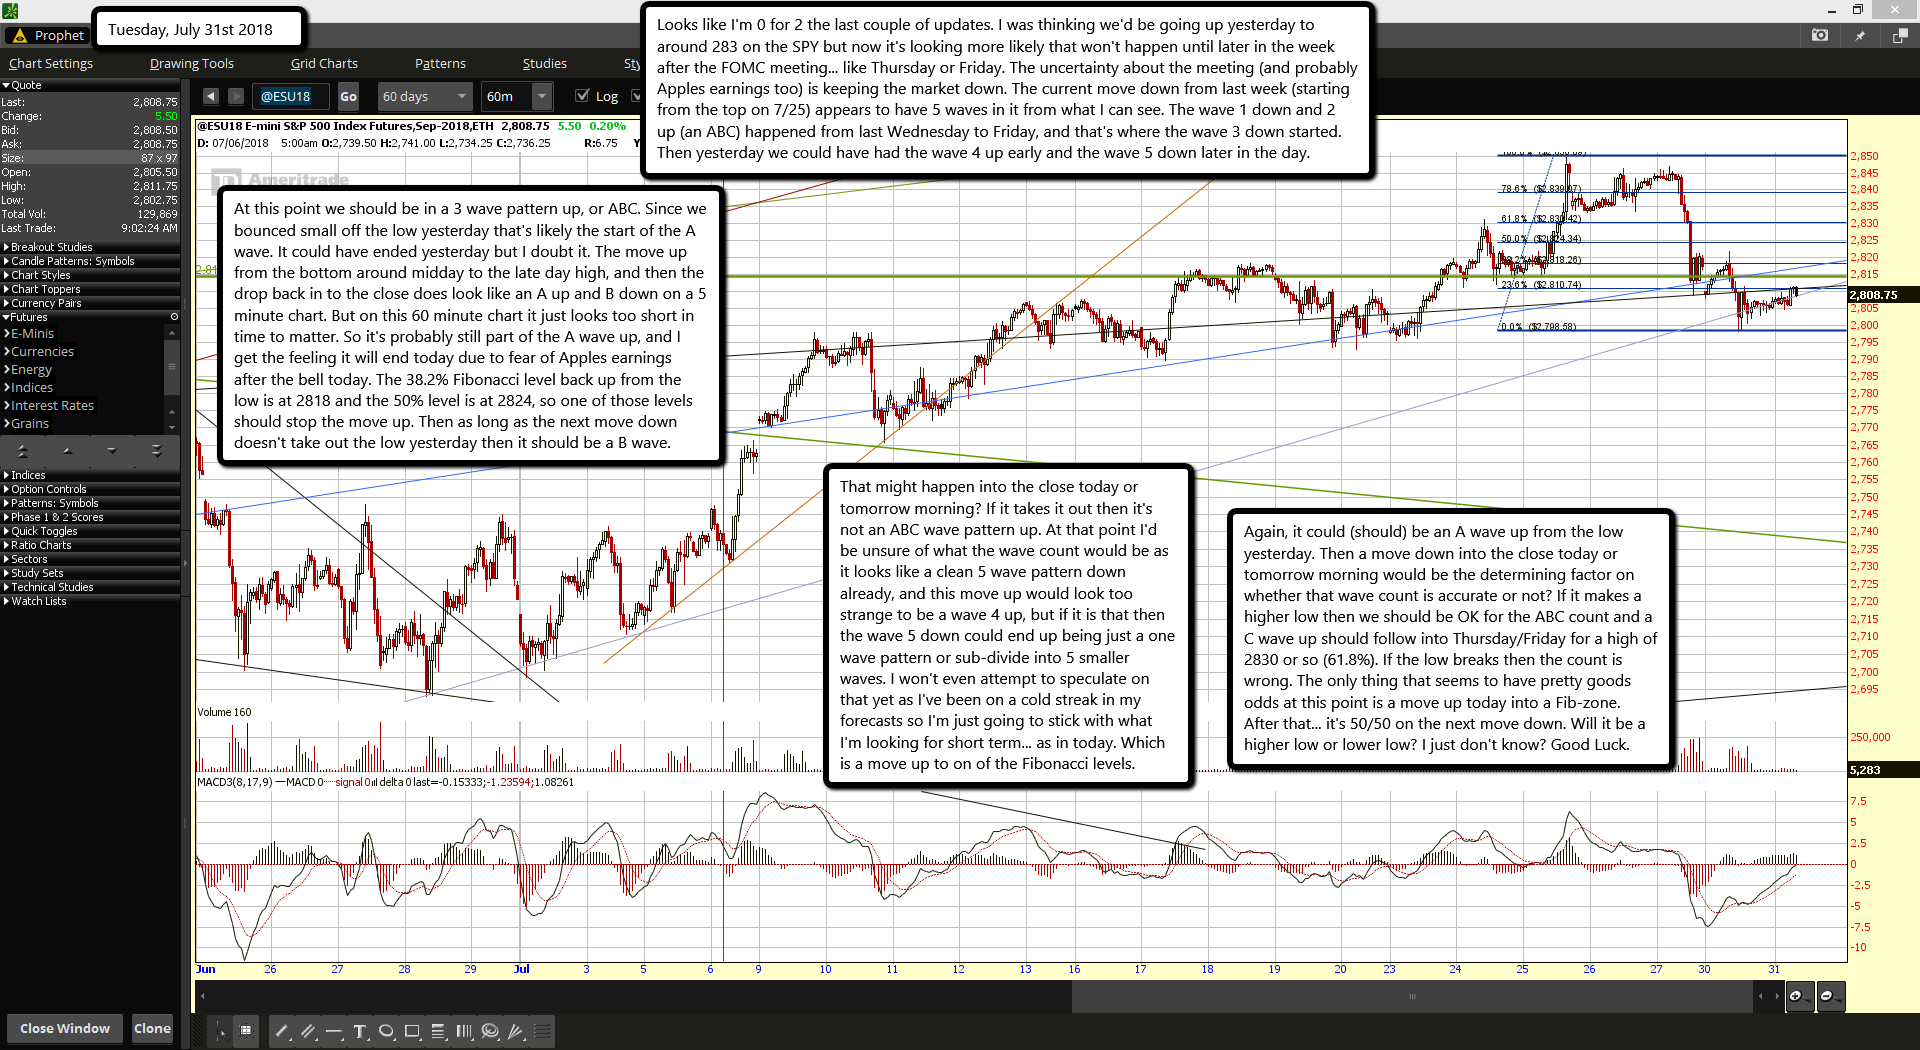
Looks like I'm 0 for 2 the last couple of updates. I was thinking we'd be going up yesterday to around 283 on the SPY but now it's looking more likely that won't happen until later in the week after the FOMC meeting... like Thursday or Friday. The uncertainty about the meeting (and probably Apples earnings too) is keeping the market down. The current move down from last week (starting from the top on 7/25) appears to have 5 waves in it from what I can see. The wave 1 down and 2 up (an ABC) happened from last Wednesday to Friday, and that's where the wave 3 down started. Then yesterday we could have had the wave 4 up early and the wave 5 down later in the day.

At this point we should be in a 3 wave pattern up, or ABC. Since we bounced small off the low yesterday that's likely the start of the A wave. It could have ended yesterday but I doubt it. The move up from the bottom around midday to the late day high, and then the drop back in to the close does look like an A up and B down on a 5 minute chart. But on this 60 minute chart it just looks too short in time to matter. So it's probably still part of the A wave up, and I get the feeling it will end today due to fear of Apples earnings after the bell today. The 38.2% Fibonacci level back up from the low is at 2818 and the 50% level is at 2824, so one of those levels should stop the move up. Then as long as the next move down doesn't take out the low yesterday then it should be a B wave.

That might happen into the close today or tomorrow morning? If it takes it out then it's not an ABC wave pattern up. At that point I'd be unsure of what the wave count would be as it looks like a clean 5 wave pattern down already, and this move up would look too strange to be a wave 4 up, but if it is that then the wave 5 down could end up being just a one wave pattern or sub-divide into 5 smaller waves. I won't even attempt to speculate on that yet as I've been on a cold streak in my forecasts so I'm just going to stick with what I'm looking for short term... as in today. Which is a move up to on of the Fibonacci levels.

Again, it could (should) be an A wave up from the low yesterday. Then a move down into the close today or tomorrow morning would be the determining factor on whether that wave count is accurate or not? If it makes a higher low then we should be OK for the ABC count and a C wave up should follow into Thursday/Friday for a high of 2830 or so (61.8%). If the low breaks then the count is wrong. The only thing that seems to have pretty goods odds at this point is a move up today into a Fib-zone. After that... it's 50/50 on the next move down. Will it be a higher low or lower low? I just don't know? Good Luck.

ES Morning Update July 30th 2018

0


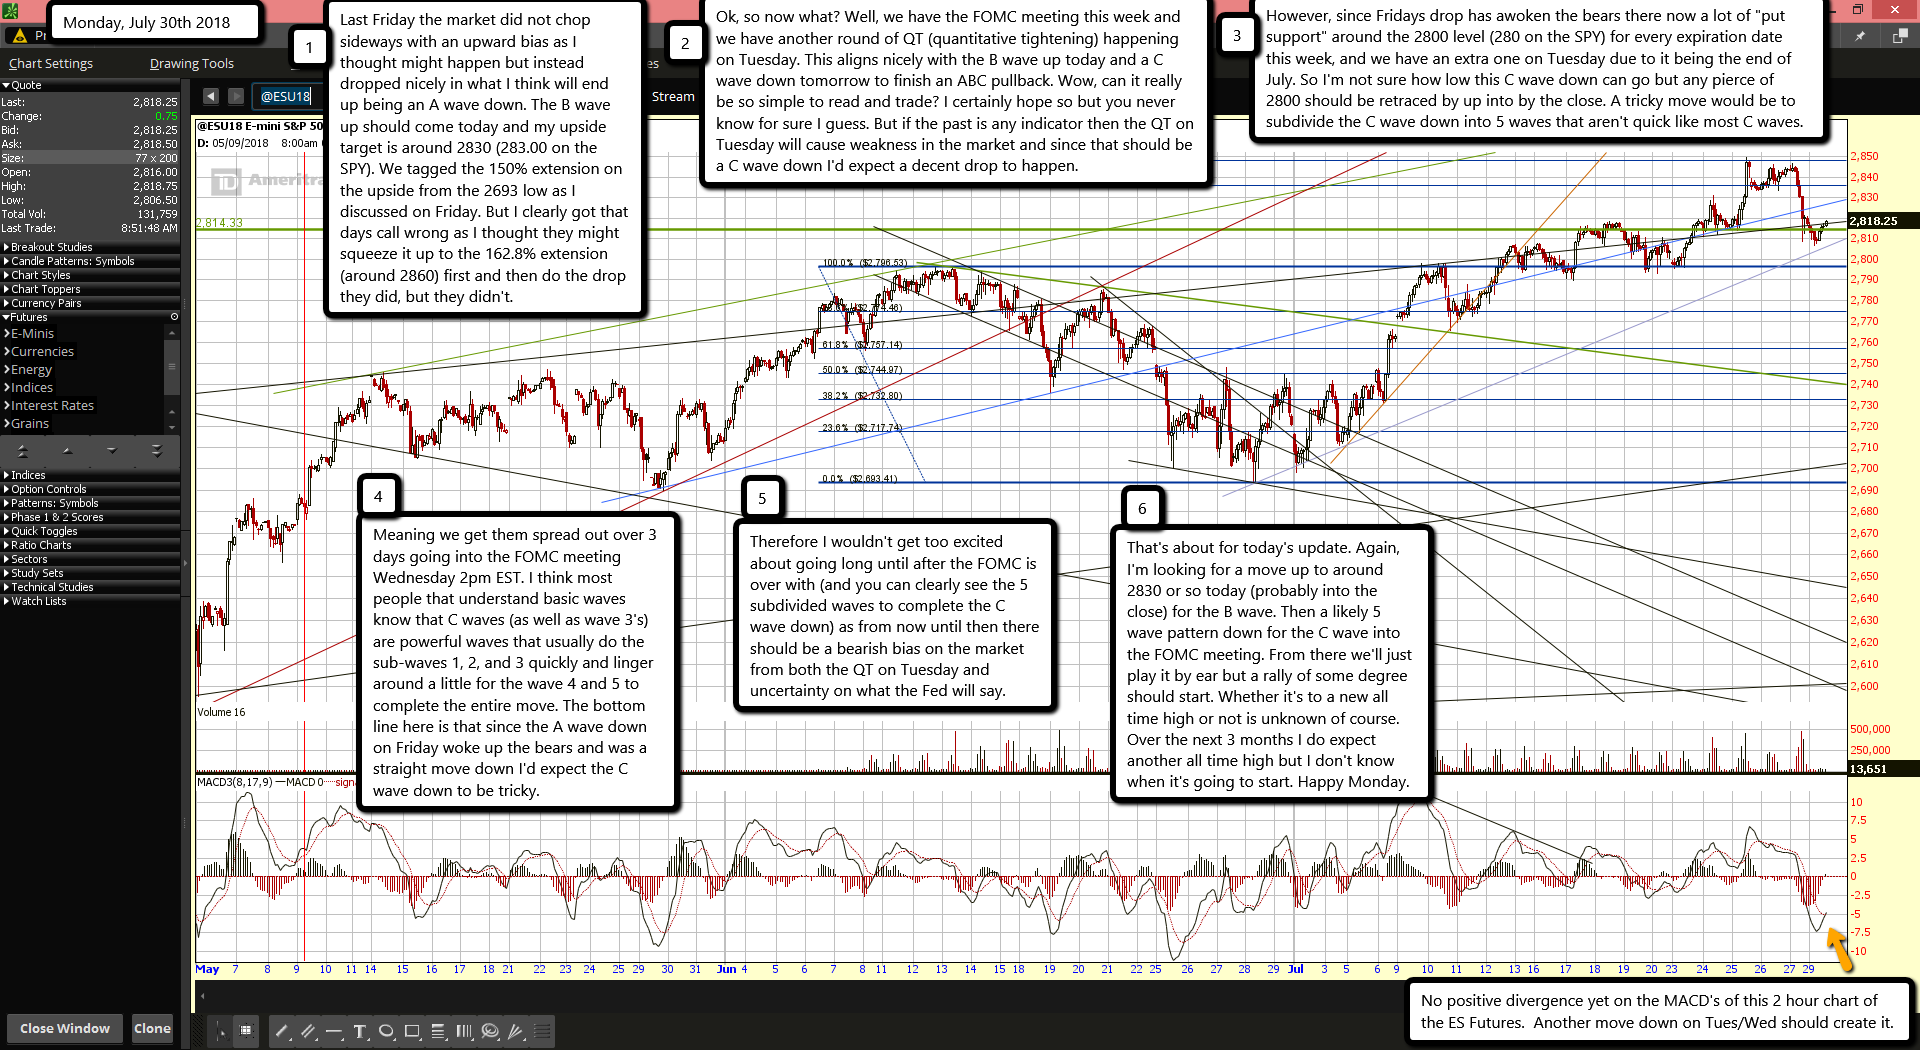
Last Friday the market did not chop sideways with an upward bias as I thought might happen but instead dropped nicely in what I think will end up being an A wave down. The B wave up should come today and my upside target is around 2830 (283.00 on the SPY). We tagged the 150% extension on the upside from the 2693 low as I discussed on Friday. But I clearly got that days call wrong as I thought they might squeeze it up to the 162.8% extension (around 2860) first and then do the drop they did, but they didn't.

Ok, so now what? Well, we have the FOMC meeting this week and we have another round of QT (quantitative tightening) happening on Tuesday. This aligns nicely with the B wave up today and a C wave down tomorrow to finish an ABC pullback. Wow, can it really be so simple to read and trade? I certainly hope so but you never know for sure I guess. But if the past is any indicator then the QT on Tuesday will cause weakness in the market and since that should be a C wave down I'd expect a decent drop to happen.

However, since Fridays drop has awoken the bears there now a lot of "put support" around the 2800 level (280 on the SPY) for every expiration date this week, and we have an extra one on Tuesday due to it being the end of July. So I'm not sure how low this C wave down can go but any pierce of 2800 should be retraced by up into by the close. A tricky move would be to subdivide the C wave down into 5 waves that aren't quick like most C waves.

Meaning we get them spread out over 3 days going into the FOMC meeting Wednesday 2pm EST. I think most people that understand basic waves know that C waves (as well as wave 3's) are powerful waves that usually do the sub-waves 1, 2, and 3 quickly and linger around a little for the wave 4 and 5 to complete the entire move. The bottom line here is that since the A wave down on Friday woke up the bears and was a straight move down I'd expect the C wave down to be tricky.

Therefore I wouldn't get too excited about going long until after the FOMC is over with (and you can clearly see the 5 subdivided waves to complete the C wave down) as from now until then there should be a bearish bias on the market from both the QT on Tuesday and uncertainty on what the Fed will say.

That's about for today's update. Again, I'm looking for a move up to around 2830 or so today (probably into the close) for the B wave. Then a likely 5 wave pattern down for the C wave into the FOMC meeting. From there we'll just play it by ear but a rally of some degree should start. Whether it's to a new all time high or not is unknown of course. Over the next 3 months I do expect another all time high but I don't know when it's going to start. Happy Monday.

ES Morning Update July 27th 2018

0


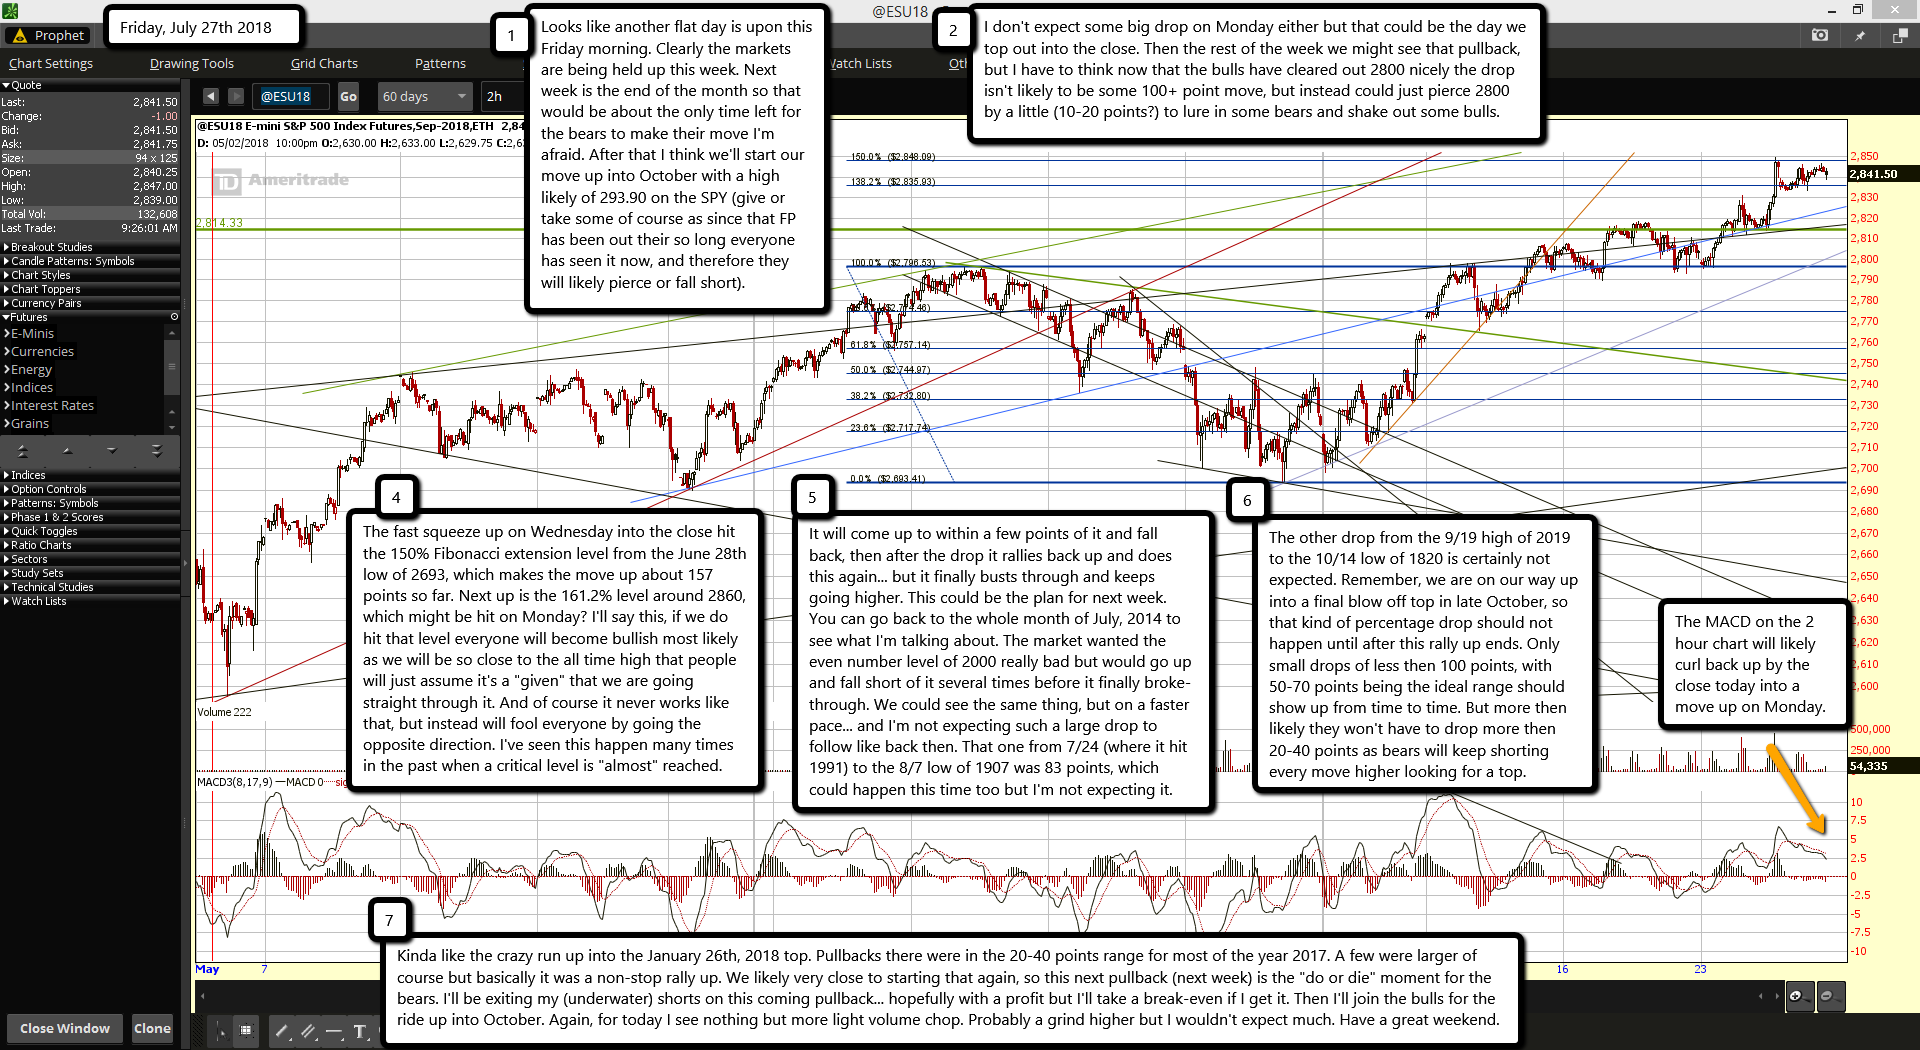
Looks like another flat day is upon this Friday morning. Clearly the markets are being held up this week. Next week is the end of the month so that would be about the only time left for the bears to make their move I'm afraid. After that I think we'll start our move up into October with a high likely of 293.90 on the SPY (give or take some of course as since that FP has been out their so long everyone has seen it now, and therefore they will likely pierce or fall short).

I don't expect some big drop on Monday either but that could be the day we top out into the close. Then the rest of the week we might see that pullback, but I have to think now that the bulls have cleared out 2800 nicely the drop isn't likely to be some 100+ point move, but instead could just pierce 2800 by a little (10-20 points?) to lure in some bears and shake out some bulls.

The fast squeeze up on Wednesday into the close hit the 150% Fibonacci extension level from the June 28th low of 2693, which makes the move up about 157 points so far. Next up is the 161.2% level around 2860, which might be hit on Monday? I'll say this, if we do hit that level everyone will become bullish most likely as we will be so close to the all time high that people will just assume it's a "given" that we are going straight through it. And of course it never works like that, but instead will fool everyone by going the opposite direction. I've seen this happen many times in the past when a critical level is "almost" reached.

It will come up to within a few points of it and fall back, then after the drop it rallies back up and does this again... but it finally busts through and keeps going higher. This could be the plan for next week. You can go back to the whole month of July, 2014 to see what I'm talking about. The market wanted the even number level of 2000 really bad but would go up and fall short of it several times before it finally broke-through. We could see the same thing, but on a faster pace... and I'm not expecting such a large drop to follow like back then. That one from 7/24 (where it hit 1991) to the 8/7 low of 1907 was 83 points, which could happen this time too but I'm not expecting it.

The other drop from the 9/19 high of 2019 to the 10/14 low of 1820 is certainly not expected. Remember, we are on our way up into a final blow off top in late October, so that kind of percentage drop should not happen until after this rally up ends. Only small drops of less then 100 points, with 50-70 points being the ideal range should show up from time to time. But more then likely they won't have to drop more then 20-40 points as bears will keep shorting every move higher looking for a top.

Kinda like the crazy run up into the January 26th, 2018 top. Pullbacks there were in the 20-40 points range for most of the year 2017. A few were larger of course but basically it was a non-stop rally up. We likely very close to starting that again, so this next pullback (next week) is the "do or die" moment for the bears. I'll be exiting my (underwater) shorts on this coming pullback... hopefully with a profit but I'll take a break-even if I get it. Then I'll join the bulls for the ride up into October. Again, for today I see nothing but more light volume chop. Probably a grind higher but I wouldn't expect much. Have a great weekend.

ES Morning Update July 26th 2018-FaceBook Becomes CrashBook

0


WOW! What an exciting last half hour yesterday. I'm stunned, surprised, but shocked as this kind of manipulation has been going on for decades. The media is controlled by the crooks that steal money from the sheep, so does really surprise you when the media releases some positive news timed perfectly near a top in the market, and at the last half hour of the day? It shouldn't as it's planned that way on purpose to squeeze out the bears and trap the bulls before the market turns back down. Then afterhours the news becomes negative and the market sells off when no sheep can get out. This has been done hundreds of times over the past decades. All the bad news is timed out to be released right when the market has topped.

Then there's Facebook... whoa! Not sure what to say there other then to start calling it Crashbook now. I think keep this post short this morning as I try to figure out what all this means? The ES Futures didn't get hit that hard like the Nasdaq did so I'm not sure if this means the top is in for awhile or not? Certainly could be for the Nasdaq, and the Russell may have topped early this week already. It's hard to say what's going to happen now as it looks like the powers that be are holding the market in place for now. I guess they don't want to take blame for their planned fake news release to run the stops on the bears. Maybe they want to take it higher? I'm really just not sure at this point. It looks like a blow off top, smells like a blow off top, so it must be a blow off top... right? LOL. If only it was as easy as that. Anyway, that's all for today. Sorry, I just can't find the words this morning.

ES Morning Update July 25th 2018

0


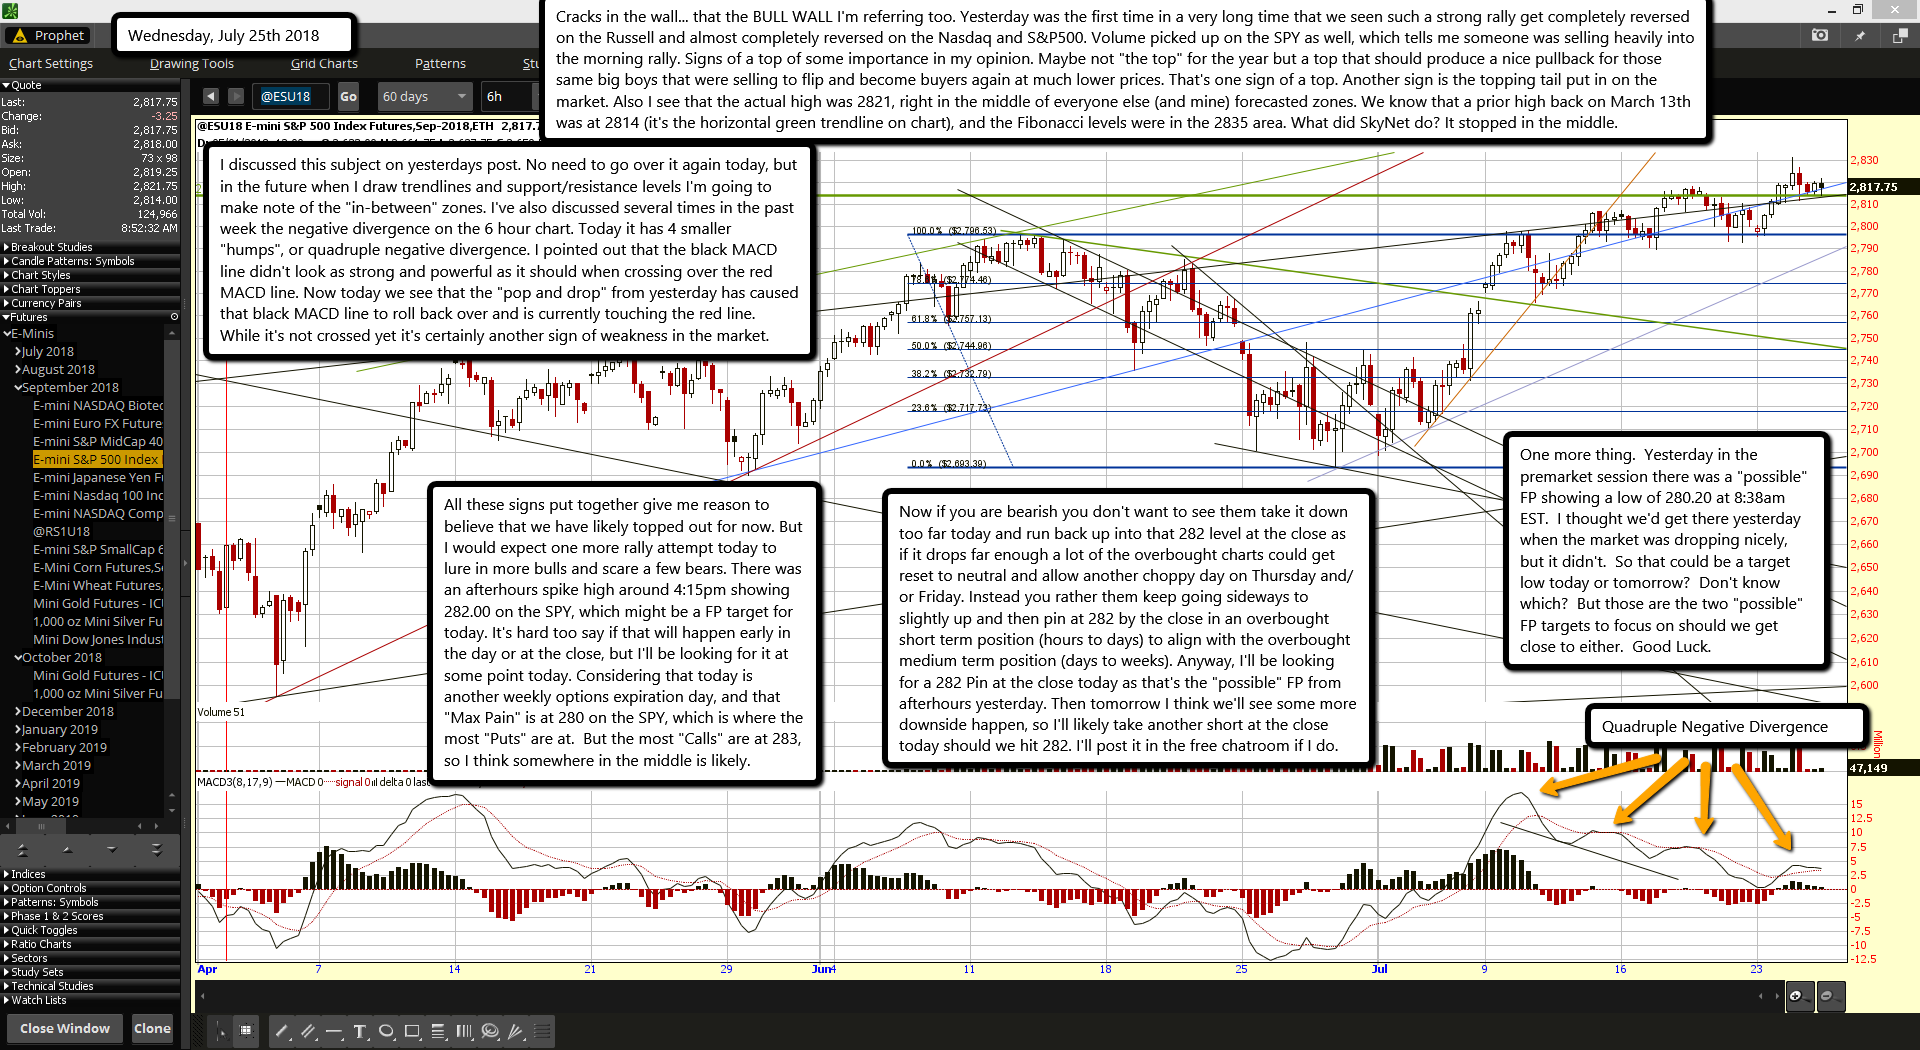
Cracks in the wall... that the BULL WALL I'm referring too. Yesterday was the first time in a very long time that we seen such a strong rally get completely reversed on the Russell and almost completely reversed on the Nasdaq and S&P500. Volume picked up on the SPY as well, which tells me someone was selling heavily into the morning rally. Signs of a top of some importance in my opinion. Maybe not "the top" for the year but a top that should produce a nice pullback for those same big boys that were selling to flip and become buyers again at much lower prices. That's one sign of a top. Another sign is the topping tail put in on the market. Also I see that the actual high was 2821, right in the middle of everyone else (and mine) forecasted zones. We know that a prior high back on March 13th was at 2814 (it's the horizontal green trendline on chart), and the Fibonacci levels were in the 2835 area. What did SkyNet do? It stopped in the middle.

I discussed this subject on yesterdays post. No need to go over it again today, but in the future when I draw trendlines and support/resistance levels I'm going to make note of the "in-between" zones. I've also discussed several times in the past week the negative divergence on the 6 hour chart. Today it has 4 smaller "humps", or quadruple negative divergence. I pointed out that the black MACD line didn't look as strong and powerful as it should when crossing over the red MACD line. Now today we see that the "pop and drop" from yesterday has caused that black MACD line to roll back over and is currently touching the red line. While it's not crossed yet it's certainly another sign of weakness in the market.

All these signs put together give me reason to believe that we have likely topped out for now. But I would expect one more rally attempt today to lure in more bulls and scare a few bears. There was an afterhours spike high around 4:15pm showing 282.00 on the SPY, which might be a FP target for today. It's hard too say if that will happen early in the day or at the close, but I'll be looking for it at some point today. Considering that today is another weekly options expiration day, and that "Max Pain" is at 280 on the SPY, which is where the most "Puts" are at.  But the most "Calls" are at 283, so I think somewhere in the middle is likely.

Now if you are bearish you don't want to see them take it down too far today and run back up into that 282 level at the close as if it drops far enough a lot of the overbought charts could get reset to neutral and allow another choppy day on Thursday and/or Friday. Instead you rather them keep going sideways to slightly up and then pin at 282 by the close in an overbought short term position (hours to days) to align with the overbought medium term position (days to weeks). Anyway, I'll be looking for a 282 Pin at the close today as that's the "possible" FP from afterhours yesterday. Then tomorrow I think we'll see some more downside happen, so I'll likely take another short at the close today should we hit 282. I'll post it in the free chatroom if I do.

One more thing.  Yesterday in the premarket session there was a "possible" FP showing a low of 280.20 at 8:38am EST.  I thought we'd get there yesterday when the market was dropping nicely, but it didn't.  So that could be a target low today or tomorrow?  Don't know which?  But those are the two "possible" FP targets to focus on should we get close to either.  Good Luck.

ES Morning Update July 24th 2018

0


Never underestimate the bulls is the lesson for this morning. Yesterday I suggested that we'd go up and make a lower high early this week before rolling over but this mornings premarket now has put in a higher high on the back of googles good earnings. That MACD on the 6 hour chart turned back up from hitting the zero area like it's done many times in the past. But strangely when I look at it right now it doesn't appear as strong as it should be. The black MACD line did cross over the red line but they are so close together now that there's no way to be sure this is the start of another strong rally up.

It suggests caution as a truly strong move up would have the black line and red line be very far apart. When they are close like they are now it tells me the rally isn't as it appears. Good moves up also point more vertical, like at least at a 45 degree angle, while this cross it more like a horizontal one. It goes back to what I said yesterday that we could "should" see a blow off move to the upside before rolling over later this week. I guessed that it would be a lower high but that's obviously not the case.

So, how high will this go? We had a prior horizontal resistance around 2814 (green trendline) and that is now busted through. Next up is the 2835 level which is the 138.2% Fibonacci extension from the 2796 high to 2693 low (or vice-versa... not sure if you say high to low or low to high?). After that is the 150% extension around 2848, and then 161.8% at 2860. My thoughts are that we'll fall below the 138.2% to fool everyone that is looking for that level to get hit.

I've noticed over time that many of the trendlines I've drawn and support/resistance levels (that were from prior highs/lows, Fibonacci levels, or Elliottwave counts) seem to get pierced through or fell short of hitting. My theory on this is that with today's modern computer charting software available to every retail trader now instead of just the big institutions the game has changed. Meaning now that everyone see's the same area and is placing the same trades as the big boys the unknown force that runs the market (I like to call it SkyNet) is forced to make changes and those changes mean that the market must go to a level no one see's as important and stop and reverse there.

Remember that in order for the insiders to make money they must have the retail public (aka, the sheep) on the opposite side of the market as them. If the public every woke up and figured out that stocks never move up and down on fundamentals or earnings but instead move in both directions for the sole purpose of extracting money from the sheep who buy the top and sell the bottom they would probably quit investing. But the masses are still mostly blind as very few people took the red pill and understand the "churn" of the market.

Today we'll see how many bears (retail sheep only as the wolves aren't short yet) throw in the towel and become bulls. I'll be focusing on the volume on the SPY as if we see it a lot higher then usual we'll know that the bears got squeezed out. If it's normal light volume then today will not put in the top. The "TOP" will be put in on some heavy volume day as the bears get squeezed out. When will that happen? I don't know? I see SKEW levels at major extremes. I see "Bearish Sentiment" levels at extreme lows. I see negative divergences on many charts with some now being "Triple" or "Quadruple" divergences.

I can only guess that there is enough sheep out there that see the same and are shorting the market enough to make SkyNet want to squeeze them out before a big drop starts. No doubt the blue pill taker retail sheep are long, but getting the red pill takers to bail on their shorts is tough I guess so SkyNet is hard at work trying to squeeze them out. It's why short term swing trading has become so hard now, as the market goes to extremes in both directions to get the last bull or bear to capitulate.

So if we don't turn down this week or early next week I'll have to think that the market is going to skip the pullback and just continue to grind up into the expected high of 293.90 SPY by mid-October. Overbought indicators can just get more and more overbought if bears keep shorting, and therefore keep getting squeezed. I don't think the bears are done yet but time is running out for a big drop to happen. Failure to pullback here this week or early next, and instead a grind up, will just confirm more to me that they plan to crash it later this year.

If they would drop it some first they could work of the extremes on the various charts and start a new long lasting rally. But a continued move up from here will put put the extreme reading into territories so extreme they will make the January high and extreme readings look like a monkey compared to a gorilla. I'd prefer they don't crash but I feel that's exactly what they have planned. Multi-month grinds up with little to no pullbacks always result in large drops. The January high it a perfect example. Anyway, for today I don't have much to say. The market is in squeeze mode until it's not.

ES Morning Update July 23rd 2018

0


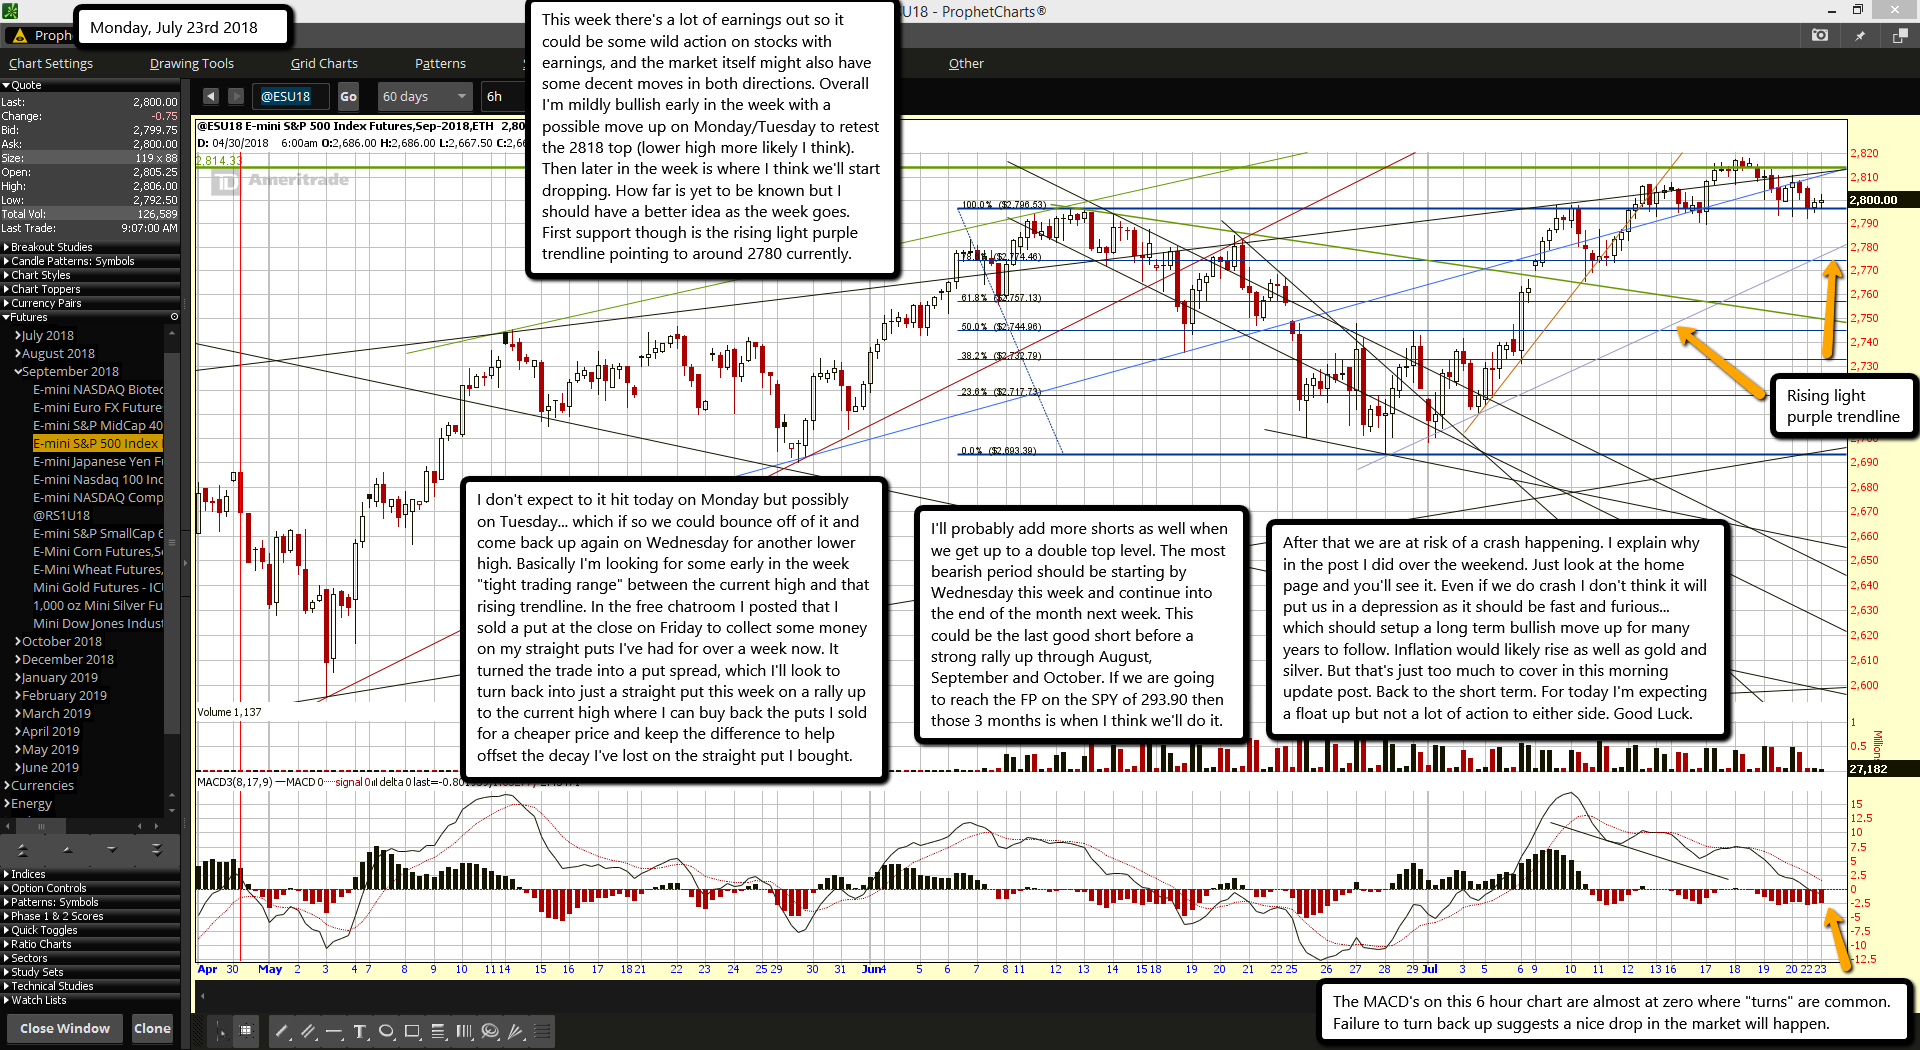
This week there's a lot of earnings out so it could be some wild action on stocks with earnings, and the market itself might also have some decent moves in both directions. Overall I'm mildly bullish early in the week with a possible move up on Monday/Tuesday to retest the 2818 top (lower high more likely I think). Then later in the week is where I think we'll start dropping. How far is yet to be known but I should have a better idea as the week goes. First support though is the rising light purple trendline pointing to around 2780 currently.

I don't expect to it hit today on Monday but possibly on Tuesday... which if so we could bounce off of it and come back up again on Wednesday for another lower high. Basically I'm looking for some early in the week "tight trading range" between the current high and that rising trendline. In the free chatroom I posted that I sold a put at the close on Friday to collect some money on my straight puts I've had for over a week now. It turned the trade into a put spread, which I'll look to turn back into just a straight put this week on a rally up to the current high where I can buy back the puts I sold for a cheaper price and keep the difference to help offset the decay I've lost on the straight put I bought.

I'll probably add more shorts as well when we get up to a double top level. The most bearish period should be starting by Wednesday this week and continue into the end of the month next week. This could be the last good short before a strong rally up through August, September and October. If we are going to reach the FP on the SPY of 293.90 then those 3 months is when I think we'll do it.

After that we are at risk of a crash happening. I explain why in the post I did over the weekend. Just look at the home page and you'll see it. Even if we do crash I don't think it will put us in a depression as it should be fast and furious... which should setup a long term bullish move up for many years to follow. Inflation would likely rise as well as gold and silver. But that's just too much to cover in this morning update post. Back to the short term. For today I'm expecting a float up but not a lot of action to either side. Good Luck.

Here's that post: https://reddragonleo.com/2018/07/21/high-odds-that-the-next-stock-market-crash-happens-on-this-date/

High Odds That The Next Stock Market Crash Happens On This Date

0

That's right, the next stock market crash could be on November 11th, 2018!

But before I explain why I want to throw in a follow up post to the most recent one I just did about Doug Kass liquidating all his long holding is the stock market.  It came today in an email I got.

Here's a quote from a newsletter message I received today...

Start Quote...

The world's largest hedge fund has been preaching caution for months... and now, time is running out.

Ray Dalio, founder of Bridgewater Associates - the largest hedge fund in the world - previously told The Wall Street Journal that some of the factors fueling increasing prices could potentially exhaust financial development in the upcoming years.

And in a recent message issued to their clients, the firm delivered this warning message: "2019 is setting up to be a dangerous period for the economy... for investors, the danger is already here."

Even Bloomberg has warned that our nation is barreling toward something that could be even more devastating than the Great Recession.

This time, though, it's more than just a housing or credit bubble about to burst.

End Quote...

Here's some of what they said in the link to a website in the email.  (Note: They are of course trying to sell something but that's not what I'm interested it).

Start Quote...

On the morning of October 29, 1929, the Opening Bell of the New York Stock Exchange was drowned out beneath the shouts of panicked traders.

“Sell, sell, sell!” they screamed.

As the day wore on, the Dow tumbled by 11 points…

Then by 23 points…

Then by 48 points.

By the close of the markets at 3 p.m., more than $319 billion worth of the American economy had simply evaporated.

Investors lost their life savings. Rumors of brokers jumping from the windows of New York skyscrapers spread across Wall Street.

And that day – known as Black Tuesday – would be forever marked as the moment the United States began its slide into the Great Depression.

Historians still look back on the crash of 1929 and ask themselves, “Could it have been predicted? Could it have been avoided?”

End Quote...

Back to my forecast...

I went over the reason briefly of why I think November 11th, 2018 is the next crash date in a post I did early today, and you can read it here: https://reddragonleo.com/2018/07/21/doug-kass-liquidates-all-long-holdings.

And as I mentioned above the date of November 11th, 2018 as the most likely crash date I want to cover the reasons why I think that... and it has to do with ritual number codes!

First you see that 11-11-11 adds up to "33".  And you probably know that 33 is the number of the Free Masons, as in "33rd degree".  I'll let you do your own research on them and the importance of the number "33", but if you go back to the first great depression you'll find something interesting the "numbers" of the date as it too added up to "33" just like this coming November date does.

Coincidence? Maybe... Maybe NOT

The date that the big crash happened was October 29th, 1929... which is 10-29-1929, and that is (1+0)+(2+9)+(1+9+2+9), and that makes "33" again.  See how important the number is to those that control the market?  It's really about the number "11", and multiples of it.  So "22", "33", "666", etc... are the ritual numbers.  Also the number 23 and 322 as that is the number for the "Skull and Bones" cult organization.

It's not always obvious to the untrained eye but the clues are given for everyone to see... it's just that most aren't trained to see them.  For example, let's look at the 1987 stock market crash.  It happened on October 19th, 1987... so that's 10-19-1987, which is (1+0)+(1+9)+(1+9+8+7), or 36.  What is 3 "Sixes" (666)?  Again, not obvious to all, but it is to those looking.

The more important clue was given on the day the market topped that year, but not on the DOW.  It was given on the SPX at that time.  The "clue" was first put out on August 24th, 1987 and again the next day where the market put in its final high before the crash.  On the 24th the SPX opened at 333.33 and went up a few points and down a few points but closed out at 333.33 exactly... which was the signal to the insiders.

It opened the following day again at 333.33 went up a little higher and closed a few points higher as well.  It did one more day closing over the 333.33 level, but by the 27th it closed below that ritual code.  So at that point everyone that was "in the club" knew the high was "in" and the crash was coming later that year.

Next lets look at the 2008 crash.  The top came on October 11th, 2007... which really only has the number "11" in the day of the month that stands out, so it's not as strong as the 1929 ritual number codes, so it's hard too have known back then if that was a code for "the top is in" or not.  I'm probably just not seeing it as I'm not one of the insiders, therefore I have to guess.

But the low that came in the market was a very obvious ritual number.  Even the date of the low could be used as "double conformation" that the low was "in".  That day was March 6th, 2009.  March is the 3rd month so that's (0+3)+(0+6)+(2+0+0+9) or 20, which breaks down to a 2.  Now that clue isn't an obvious one but when you see that the low price on that day for the SPX was 666 you have your first code (666.79 to be exact but I dropped the .79 due to the "in your face" 666 code).  Everyone knows that the "mark of the beast" number of 666 is used to represent satan.

Now I'll look at the date closer.  It's got a 3 in it, a 6 for the day of the month and an "11" for the year (2+0+0+9=11).  What is 3 "Sixes" again?  You guessed it... 666!  Then the 11 for the year is their master number as ever other number is a multiple of "eleven".

I agree that you have to play with the numbers a little on that one but since you already have the first conformation with the price low of 666 you can find another 666 in the date.  (NOTE: I didn't cover the actual 2008 crash date as it didn't really have one big drop day that would be called the "crash day".  So I just focused on top date and the bottom date).

On the 1999 top of the dotcom bubble and crash that followed we again didn't really see one certain day that would have been called the "crash day", so we have to examine other clues in the numbers... which I've done many times but I've not been able to find anything that "stands out" on the DOW, SPX, or the NASDAQ (which had the largest drop).  So maybe there's some clues I'm not seeing the top date or bottom date?

On another thought... possibly "they" only put out ritual codes on very important tops and crashes that follow?  After all the 1999 top to the 2002 bottom wasn't exactly one big drop.  It was just a steady move lower over those 3 years.  The only obvious date that stands out as an "insider job" was the attack on 911, but we'll skip that in this post.

There's no way to be 100% sure that a crash is coming this November 11th, 2018 but with the mid-term elections just a few days prior to it and the FP (Fake Print) I posted on the previous post I did today (about Doug Kass), which showed a high of 293.90 on the SPY, I have to think that "if" we hit that target by mid-October and rollover into the end of the month... then rally into the elections for a "lower high", I'd be watching closely on November 11th.

Red

P.S.  I'm probably crazy and "ritual numbers" don't really exist in the stock market... as this "777" is another coincidence I'm sure.


Doug Kass Liquidates All Long Holdings

0

Submitted by Doug Kass of Seabreeze Partners

After a great deal of thought and following a discussion with my investors and limited partners I have decided to liquidate all of my long holdings (which include many which I believe have a favorable intermediate term outlook).

I am now undertaking my across-the-board long selling program.

I will have an extensive discussion of my rationale in Monday's opener - and I will also make the case for an approximate (and playable) 10% market correction over the next six months.

The S&P now stands at about 2805 - that's right at the top end of my long standing 2018 trading range.

I will continue to hold onto my gold and short (SPY) positions.

This is not a recommended course of action for most investors - indeed, it's too extreme for 99.9% of all investors.

It is even a rare move for me.

But, it is a bet that I will be able to buy back my favorite stocks and sectors at a reasonably large discount to current stock price levels - after all a 10% market pullback means that numerous stocks will decline by twice that amount.

But it is the course of action I am undertaking now and directly modifies my intentions and leanings described earlier this morning in my opening missive, "Risk Happens Fast":

Among other things my objective in my Diary is to produce hard hitting and contrarian analysis that is transparent in delivery.

I am generally an anticipative rather than a reactionary thinker and investment manager.

I don't kowtow to consensus and I resist "Group Think" - not for the sole purpose of disagreeing but because I hold to certain analytical beliefs and I develop a risk/reward calculation.

This morning I hope that I have continued this exercise of candidness and independence.

We have experienced a lengthy economic expansion and a bull market cycle over the last decade - but there are rising signposts of interruption (which I will discuss on Monday morning).

The S&P Index has climbed back to the upper end of the top of my projected trading range for 2018.

As the market advanced (and in light of the rapidly deteriorating upside reward vs downside risk) I expanded my short exposure on a scale.

My net short exposure is now large and it got larger yesterday.

My view, which appears to be in a minority (and which runs counter to the momentum crowd) is that the 2018 high in the S&P Index was possibly reached in late January and will not be eclipsed for the remainder of the year

That view is based on a number of fundamental, valuation, technical and other reasons - many of which I have routinely compiled recently in my Diary.

In the extreme, a case can now be made - which I will outline over the weekend and deliver in my opening missive on Monday morning - that the downside dwarf the upside and that few stocks currently meet the risk/reward standards in a political, economic and policy backdrop that has rarely been more uncertain.

Yesterday (as I moved to a larger net short exposure) and as I communicated to several of our subscribers privately, I even considered selling my ENTIRE long book - an admittedly unusual move for a money manager.

While I did sell down a portion of my long portfolio late yesterday (including a number of stocks that I favor over the intermediate term) I have not yet moved to such an extreme market position and exposure.

Though I would caution that few should engage in such timing, I am still thinking about it as I have had a very good year and have a large "cushion" of investment performance thanks to good stock selection (long and short) and my success in trading the S&P ranges with Spyders.

The above is a statement of how concerned I am regarding the market's outlook over the balance of the year and in the abundance of possible political, geopolitical and economic outcomes (many of them adverse).

Position: Long SPY puts, SDS, GLD (large), Short SPY (large)


Personally I think the top isn't in yet but I understand that it takes several months for a large hedge fund or institution to unload everything so starting now isn't a bad idea at all.  As for the final top in the market, it's 293.90 on the SPY.  Why?  Because the rulers of the market told us so via a FP (fake print) back on February 27, 2018.

When will it hit you ask?  Well... just using some logic I'd say it will hit shortly before the November mid-term elections, like in the middle of October or so.  Then you can drop it down for the first wave in late October and rally back up for the second wave into the election.  Once the election is over with the third and most powerful wave down should happen.

To narrow it down further I think Sunday night on November 11th will be the most likely date for a limit down move prior to the open on Monday.  Why?  Because once again those that control the market told us to watch out for 11-11-11 via a crappy movie with the same title (https://www.imdb.com/title/tt1712159/?ref_=nv_sr_1).

Notice that this year is an "11" year as 2+0+1+8=11 in numerology.  Then November is the 11th month.  So on November 11th, 2018 you have an 11-11-11 date, just like the movie.  I love the "catch phrase" in the movie... "The End Is Now".

Red

ES Morning Update July 20th 2018

0


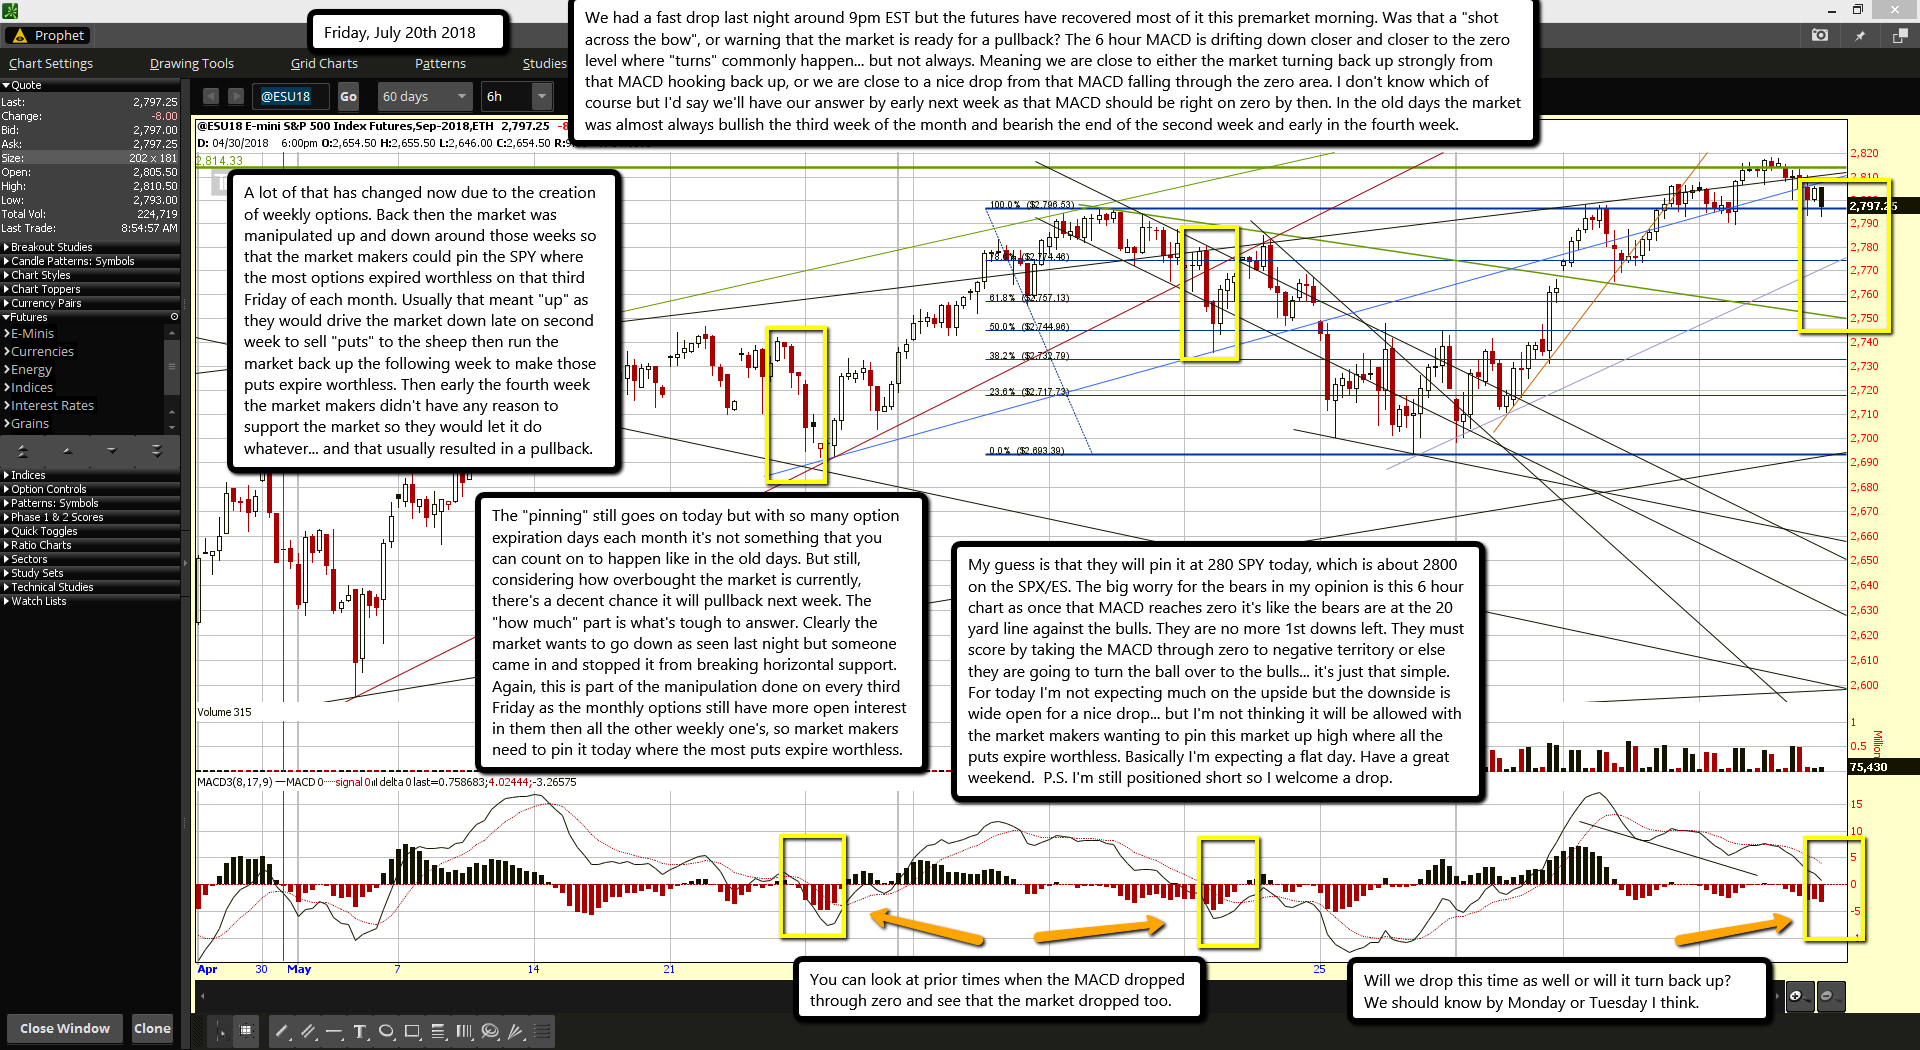
We had a fast drop last night around 9pm EST but the futures have recovered most of it this premarket morning. Was that a "shot across the bow", or warning that the market is ready for a pullback? The 6 hour MACD is drifting down closer and closer to the zero level where "turns" commonly happen... but not always. Meaning we are close to either the market turning back up strongly from that MACD hooking back up, or we are close to a nice drop from that MACD falling through the zero area. I don't know which of course but I'd say we'll have our answer by early next week as that MACD should be right on zero by then. In the old days the market was almost always bullish the third week of the month and bearish the end of the second week and early in the fourth week.

A lot of that has changed now due to the creation of weekly options. Back then the market was manipulated up and down around those weeks so that the market makers could pin the SPY where the most options expired worthless on that third Friday of each month. Usually that meant "up" as they would drive the market down late on second week to sell "puts" to the sheep then run the market back up the following week to make those puts expire worthless. Then early the fourth week the market makers didn't have any reason to support the market so they would let it do whatever... and that usually resulted in a pullback.

The "pinning" still goes on today but with so many option expiration days each month it's not something that you can count on to happen like in the old days. But still, considering how overbought the market is currently, there's a decent chance it will pullback next week. The "how much" part is what's tough to answer. Clearly the market wants to go down as seen last night but someone came in and stopped it from breaking horizontal support. Again, this is part of the manipulation done on every third Friday as the monthly options still have more open interest in them then all the other weekly one's, so market makers need to pin it today where the most puts expire worthless.

My guess is that they will pin it at 280 SPY today, which is about 2800 on the SPX/ES. The big worry for the bears in my opinion is this 6 hour chart as once that MACD reaches zero it's like the bears are at the 20 yard line against the bulls. They are no more 1st downs left. They must score by taking the MACD through zero to negative territory or else they are going to turn the ball over to the bulls... it's just that simple. For today I'm not expecting much on the upside but the downside is wide open for a nice drop... but I'm not thinking it will be allowed with the market makers wanting to pin this market up high where all the puts expire worthless. Basically I'm expecting a flat day. Have a great weekend.  P.S. I'm still positioned short so I welcome a drop.

ES Morning Update July 19th 2018

0


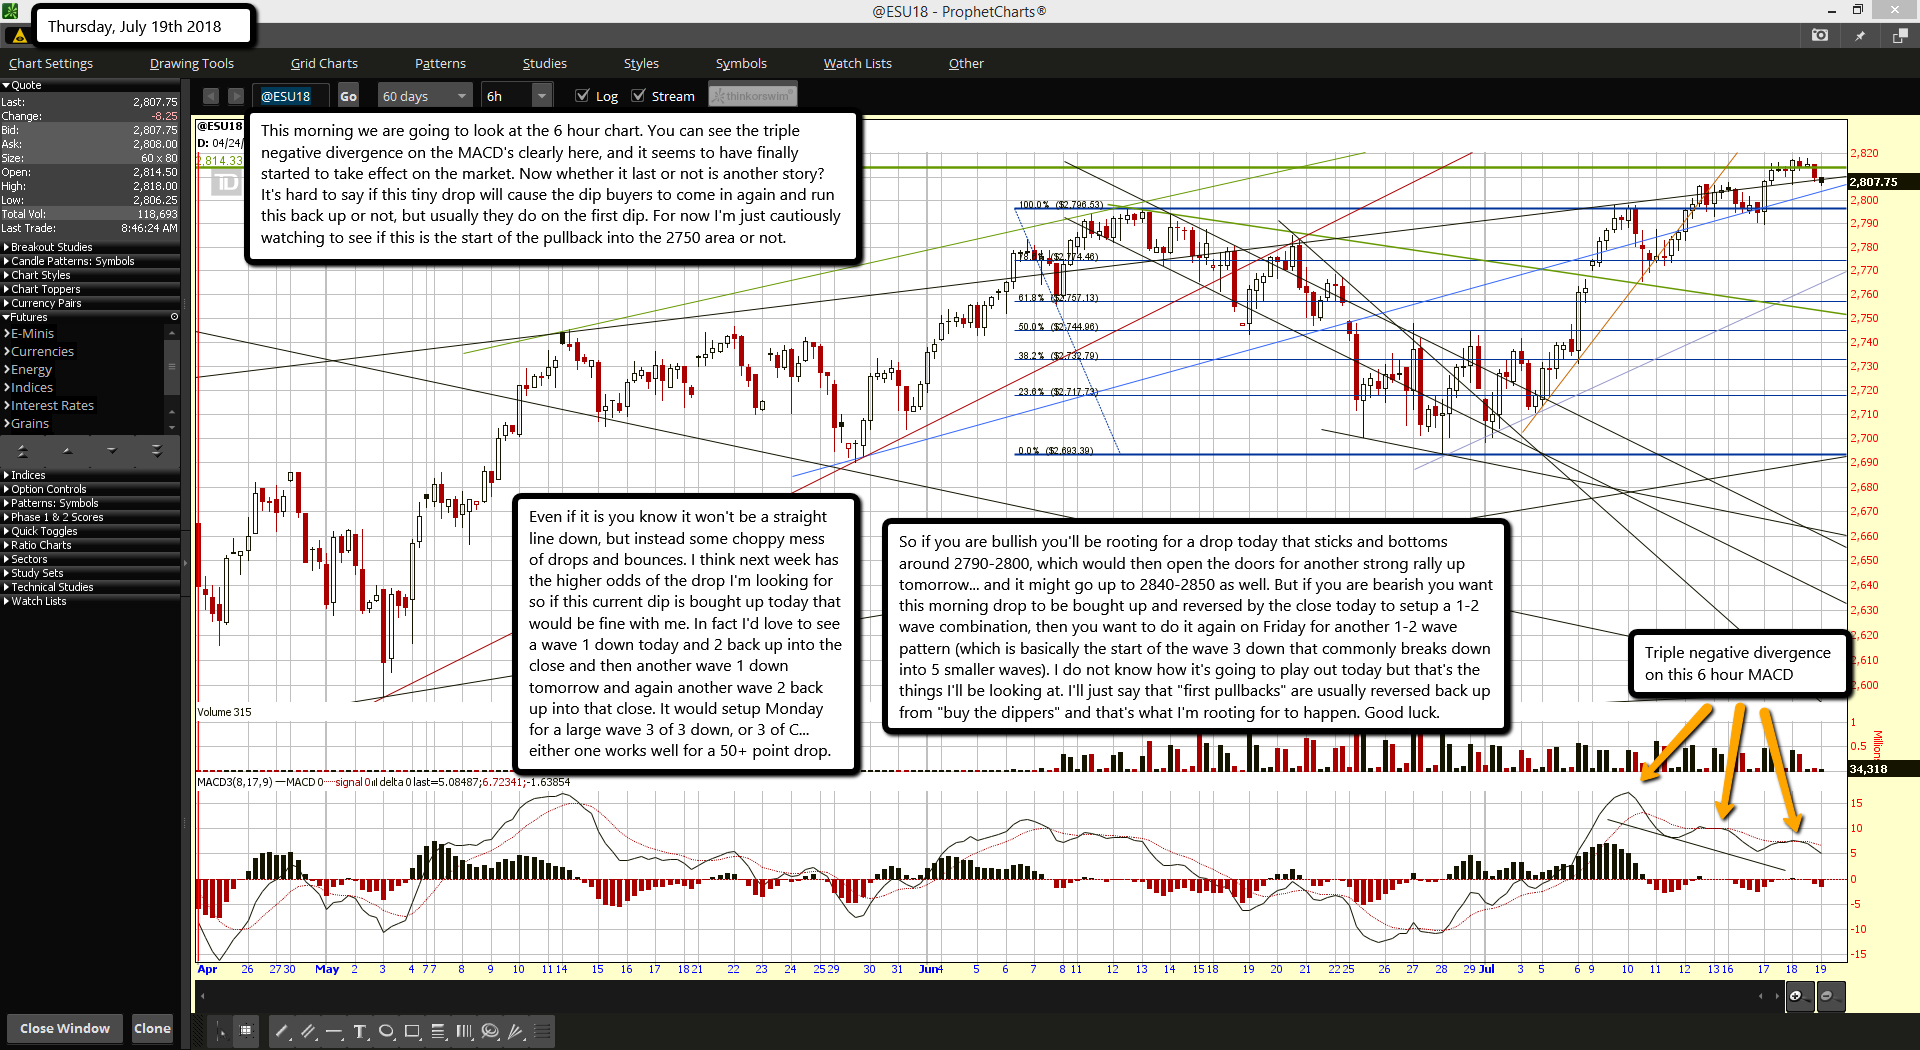
This morning we are going to look at the 6 hour chart. You can see the triple negative divergence on the MACD's clearly here, and it seems to have finally started to take effect on the market. Now whether it last or not is another story? It's hard to say if this tiny drop will cause the dip buyers to come in again and run this back up or not, but usually they do on the first dip. For now I'm just cautiously watching to see if this is the start of the pullback into the 2750 area or not.

Even if it is you know it won't be a straight line down, but instead some choppy mess of drops and bounces. I think next week has the higher odds of the drop I'm looking for so if this current dip is bought up today that would be fine with me. In fact I'd love to see a wave 1 down today and 2 back up into the close and then another wave 1 down tomorrow and again another wave 2 back up into that close. It would setup Monday for a large wave 3 of 3 down, or 3 of C... either one works well for a 50+ point drop.

So if you are bullish you'll be rooting for a drop today that sticks and bottoms around 2790-2800, which would then open the doors for another strong rally up tomorrow... and it might go up to 2840-2850 as well. But if you are bearish you want this morning drop to be bought up and reversed by the close today to setup a 1-2 wave combination, then you want to do it again on Friday for another 1-2 wave pattern (which is basically the start of the wave 3 down that commonly breaks down into 5 smaller waves). I do not know how it's going to play out today but that's the things I'll be looking at. I'll just say that "first pullbacks" are usually reversed back up from "buy the dippers" and that's what I'm rooting for to happen. Good luck.

ES Morning Update July 18th 2018

0


Yesterdays update certainly was wrong as the bulls ripped the bears to pieces all day starting right at the open. At this point I can only guess that the bulls plan on running up for that 2840's zone as they cleared the 2800 level cleanly now. But I don't see much more upside today, as after suggest a strong push yesterday today should be a "pause" day where the market goes sideways or drifts lower some. I'm surprised there hasn't been a decent pullback yet as there really needs to be one from looking at the "now" triple negative divergence... and on the 6 hour chart to boot! I feel like from looking at the charts that yesterday was just a "shake out the bears" move and that there's still a move down yet to come, and it should be one to "shake out the bulls"... meaning a drop of as much as yesterdays gains, or more.

I can clearly see we've had 5 waves up at least (there's more but I think some of the waves subdivided into smaller waves), so an ABC down should happen at some point before another 5+ wave series up starts again. The overnight low at 8 pm EST on the futures of 2765 on 7/10 was never revisited during the regular session the next day, and still hasn't been tested since then. It's rare to see that happen as at some point they do go retest it. Of course that doesn't mean we can't go up to 2840's first and then on the next move down we test it, as that could happen.

But it does give me reason to believe that we will at some point drop back down that level... the "when" part is what I don't know. Anyway, for today I'm not expecting much, just some sideways action most likely as the bulls digest their gains and prepare for another move up in the coming days. But I won't be surprised if I don't wake up one more to see a nice gap down that drops all day and revisits that prior low. If it happens soon it will likely be one last bull shakeout before a strong rally up toward 3000 starts, as we are getting toward the end of the multi-month chop I believe and the next large direction should be up. I'm looking for a high in early October, (around the 10th), to end this multi-year rally.

After that we should see a large correction, which may or may not turn into a bear market. Too early to know. But for now let's just focus on today and the rest of this week. So again I'm not expecting much today to happen but I am expecting to wake up one morning with a gap down that revisits those lows on the futures. Maybe it happens this week or next? Don't know but I would not get too cozy being a bull here, as after that flush out happens it's "then" that I feel the super strong rally up to 3000 area will really begin.

ES Morning Update July 17th 2018

0


Looks like the bearish alignment of the 6 hour MACD is keep downward pressure on the market this morning. The 60 minute MACD did indeed dip below the zero level as I suspected it would do. That was from both the 6 hour and 2 hour MACD's I'd guess as they both are bearishly aligned and don't appear ready to turn back up anytime soon. In fact the 2 hour MACD is also below the zero line this morning. With everyone looking for a little more on the upside to short from I have to think that even when the 60 minute and 2 hour MACD's turn back up the market won't do much more then double top (or lower high) the last high on Friday.

Mr. Market loves to trick the sheep and with everyone have similar upside targets of 2814 (the March 13th high) and the 2834-2840 area (trendline resistance) it seems like those folks might miss the boat this time around. In fact todays pattern looks similar to the mid-June top (around the 12th to the 28th) where the market just reach a high of 2796 before rolling over slowing and dropping into a 2693 low two weeks later. It was fast or scary but it was steady. Looking at the previous period closely and comparing it to today it suggests that we'll close slight red today and slight green tomorrow. From there the following days seem too be a steady drift lower with more red closing days then green. Call it a slow build up of wave 1's down and wave 2's up until it sets up a wave 3 of 3 (of 3) down.

I'd have to think that from looking at the MACD's this morning (on the shorter time frames) a turn back up tomorrow for a green close seems likely. But with that 6 hour MACD rolling down nicely I don't see any new high. It should look similar to June 14th I think if this pattern continues to play out. It's still too early to assume we are repeating that pattern but it's something to be aware of. My thoughts for awhile have been to only pullback to the falling green trendline and/or the rising light purple trendline... which are pointing to around 2750-2760. That previous pattern would suggest a drop to the 2660-2670 area for a lower low then the 6/28 low. I'm not getting all excited about that happening yet as we are too early in this move to really know much at all.

For today lets just focus on whether the market can take out the Friday high or not. That 60 minute MACD could turn up at anytime today (or tomorrow?) and that's what I'll be watching closely. When it turns up and the market turns with it that's when the bulls get their last chance to make another higher high. Failure here will certainly put a cap on the high for this week at least, as that 6 hour MACD will keep enough downward pressure to keep the bears in control. And if the daily turns to (it's close) then we could see downward pressure until the end of this month.

It doesn't mean we are dropping to that 2660-2670 area of course, but it does suggest my first downside target of 2750-2760 should be hit. In summary I'll be looking for that bounce back up today or tomorrow from the 60 minute MACD's turning back up. I'll take another short if we get it. I'm just playing the odds here as in my humble opinion the odds tell me a pullback of some degree is very likely to happen before another 50-100 point rally up happens.

ES Morning Update July 16th 2018

0


I hope everyone had a great weekend. This week looks to me like it's going to put in some kind of top in the market and allow a decent pullback, which could last until the end of the month or early August. On a rising trendline (not shown here) I've drawn on another chart of the ES Futures it's pointing to the 2835-2840 area as "where" the current rally up should hit it. Of course that will be resistance when it does and could easily mark a pullback spot. But I'm not confident that it will get there this first trip back through 2800, as too many charts show negative divergences and overbought stochastic... and we've already had the "higher high" to create those conditions.

So we might not see much more then 2814, where a prior high was made back on March 13th of this year, before we rollover. Hard too say at this point but I really am not expecting that 2835-2840 area to be hit on this go-a-round. Probably today will be one of those "pause" days where it doesn't go up much or down, but fools everyone on both sides. That's about the best read I can get on it this morning. There is support at the rising blue trendline and if that breaks (I doubt it today) there's the green falling channel that is now merging with the rising light purple trendline. That is double support if it did drop there today... but again, I really doubt it. Over on the 6 hour chart the MACD's still have room to go on the upside, while this 60 minute chart is showing negative divergence.

My guess is we'll drift nowhere to slightly down in the first few hours of the day and turn back up with this 60 minute MACD. It's already at the zero line where turns are common but the 2 hour chart isn't quite there yet. I'd guess this 60 minute MACD will fall through the zero line a little while it wait on it's old brother (the 2 hour MACD) to reach zero and make a turn back up. Common times for this to happen are around the 11:30 am EST period when the European market closes. It's also lunch time in America so many traders will have finished up their position swapping and therefore the volume dries up... and the market floats up.

The point I'm trying to make is to NOT expect much today in either direction. I'm positioned short and would love a big drop but I'm not expecting it. If today does chop sideways then there could still be another move higher tomorrow to hit that prior high of 2814, and that's where I think the bulls will run out of energy. Of course there's nothing stating for sure that we are going up to that level as we might have already topped? Happy trading.

ES Morning Update July 13th 2018

0


Welcome to Friday the 13th guys and gals. Stay away from people named Jason is my advice for today. Yesterday I did take a short and will add to that if we go up more into the close today. So far this morning the futures are flat. They hit a high of 2807 and have since pulled back to just under 2800... was that a stop run? Now that they've cleared 2800 it's no longer resistance, and it some support. I don't see it as good support until they run back up a second time for another higher high.

Then the 2800 level will be good support. For now though it's 50/50 support, meaning that if we open under it then it might have just been a stop run on the bears and not a true breakout. I do believe it will be taken out cleanly soon but I don't really see the current push through as the clean and stable one just yet. It's coming though, and soon. But first they need to shake out some bulls, and another nice drop to retest the Tuesday night low on the futures would do just that. Basically I still think we'll go back down one more time and find support at the falling green trendline pointing to around 2760 right now. Possibly it doesn't happen today and instead it waits until Monday or Tuesday? I'm not sure?

Wave count wise I think we completed the smaller 5th wave up now (inside larger wave 3 up) at the current 2807 afterhours/premarket highs. Next should be the larger wave 4 down, and then a larger 5th wave up... which could reach 2830-2850 area. Now that's where the trouble starts as far as predicting the next move, because the move down follow could start a series of waves that will all be part of a large C wave with a target below the 2/9 low. Or we only see a small drop before a monster rally up into October that reachs for 3000... not sure which will happen?

That's too far out to even think about right now, so let's just keep focusing on day to day moves. So, if we end up today doing a whole lot of nothing (meaning not much downside or upside) then I'd expect it to be just market makers pinning the SPY at some level that makes the most puts and calls expire worthless. That would leave Monday or Tuesday open for the pullback to happen and complete the larger wave 4 down.

After that we are going into earnings season and I suspect a lot of the reports will be bullish for the various stocks, thereby lifting the overall market up into that mid-2800's area. Then the last week of July should be the weak one where any rally made into the third week has a good chance of getting reversed back down. Again, too far away to worry about but did want to note the seasonality patterns. I think I've covered everything, I'm short and looking for a pullback into the falling green trendline today, Monday or Tuesday... then up for a couple weeks for earnings and down the last week of July. Have a great weekend and stop by the free chatroom for intraday updates.

ES Morning Update July 12th 2018

0


Ok gang, this move up this morning looks to me like the smaller 5th wave inside the larger 3rd wave. Meaning that yesterdays' premarket drop was likely the smaller wave 4 down. So after this smaller wave 5 ends, which I think it will do so at some point today, we should see the larger wave 4 down happen. I suspect that... first, this smaller wave 5 up will truncate short of the recent high of 2797 that smaller wave 3 up hit, and second that larger wave 4 down take out the premarket low yesterday from smaller wave 4 by just a hair, not some huge drop.

Support is at the falling green trendline pointing to around 2760 today, and that's where I suspect we are heading to end larger wave 4 down. That leaves larger wave 5 up for Friday (again, this assumes small wave 5 up and and larger wave 4 down all happen today). So, I'm going to look to short at some point today as I think we are going to drop at some point today to retest the premarket lows from yesterday.

It could hold up all day and drop afterhours I guess but I really feel like the trickiest move is to drop sometime today and close near that falling green trendline. Then use the fuel you'll get from the bears shorting the bottom to squeeze them up tomorrow for larger wave 5... which I think will take out 2800 by a little and top out into the close on Friday. That setups up Monday for a gap down for the next drop, but I'll discuss that tomorrow.

ES Morning Update July 11th 2018

0


Yesterday about an hour after the bell the futures started down hard. Apparently more talks about the trade wars came out and caused the drop. Of course we all know it was in the charts and will be labeled a smaller wave 4 down inside a larger wave 3 up that started on 7/2 at the 2702 low. The smaller wave 1 up inside the larger wave 3 up topped out from that starting point on 7/3 around 2741, then smaller wave 2 down bottomed that same day around 2712, where smaller wave 3 up inside larger wave 3 started.

Yesterday topped out that 3 of 3 wave and last night we saw the smaller wave 4 down inside larger wave 3 up happen. As you can see on the chart the sell off bottomed right into support from the falling green trendline and the rising orange trendline. As long as that area holds we should rally back up today in the smaller wave 5 up of larger wave 3, and if all goes well it should also take out the June 11th-14th resistance and head up toward the prior 2814 high back on 3/13 (I posted a daily chart showing that area on yesterdays update). Of course there no guarantee that this smaller wave 5 up will make a new high up there as it could fall short and truncate. But I find that doesn't usaully happen until the last 5th wave up... which would be the larger wave 5 up.

The way we'll know is if the market grinds up today slowly and choppy and then does the same part of tomorrow before it finally runs out of room and falls back down through the rising blue trendline of support and the rising orange trendline... which are pointing to around 2790 right now. If we grind up into that area today and tomorrow and do not take out that 2797 high yesterday for smaller wave 3 then I'd be worried about a gap down on Monday that starts larger wave 4 down as that move up into just under 2797 could be a truncated smaller wave 5 up. That's two days from now and I can foresee how the charts will be lined up at that point so I just can't know what will happen on Monday. If the charts algin bullish looking then we could gap up on Monday and continue that smaller wave 5 up of larger wave 3 up into the 2814 area and then rollover for the larger wave 4 down. The only thing that looks pretty sure right now is that we had a smaller wave 4 down last night of larger wave 3 up.

And there's also good odds that it ended as one simple wave down and isn't breaking down into some ABC pattern down. I say that based on the depth of the wave and the importance of the rising orange trendline. So that therefore suggests we are in a smaller wave 5 up right now of larger wave 3 up. This could get tricky going into Friday as I have to say that if I were SkyNet the way I'd move the market from here is exactly how I just discussed... a slow grind up into (or over slightly) the rising blue trendline for a close there on Friday. I'd keep it under the 2797 high from yesterday and just over 2790, which would leave everyone guessing about Monday.

Will it continue up to 2814 to complete the smaller 5th wave up of larger wave 3 up, or will smaller wave 5 up truncate short at Fridays close leaving Monday open for a gap down for larger wave 4 down?  I don't know the answer but I get a feeling that's what we are going to see the next three days. As for larger wave 4 down, my guess is that by Monday the green falling trendline of support and the light purple rising trendline will intersect around the 2750 area... which is where I think larger wave 4 down will bottom. It would also make a nice right shoulder with the left shoulder being the 6/19 low of 2755 and the head of course being the 2693 low on 6/28. This is all just me trying to think like SkyNet to make the market fool the most sheep. Anyway, I posted another chart in the chatroom last night when I saw the market drop unexpectedly for anyone interested. Have a wonderful day.

s2Member®