
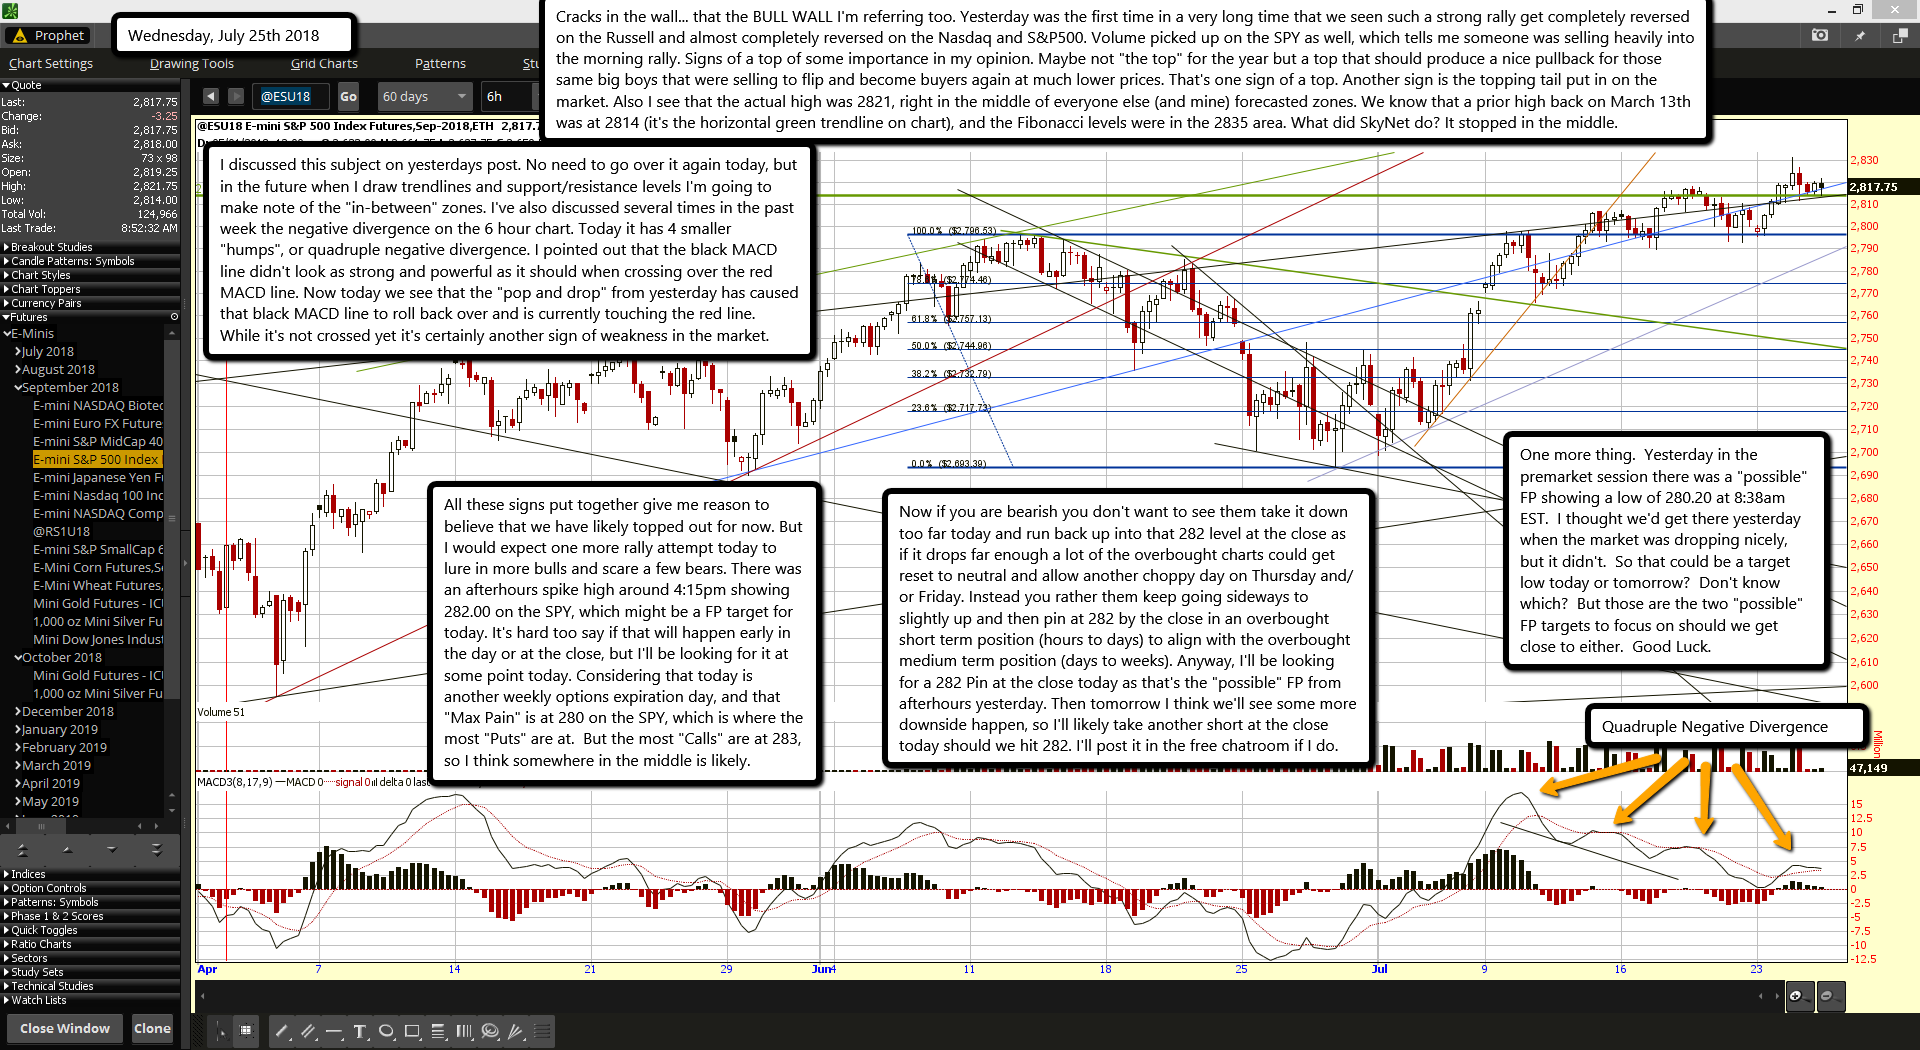
Cracks in the wall... that the BULL WALL I'm referring too. Yesterday was the first time in a very long time that we seen such a strong rally get completely reversed on the Russell and almost completely reversed on the Nasdaq and S&P500. Volume picked up on the SPY as well, which tells me someone was selling heavily into the morning rally. Signs of a top of some importance in my opinion. Maybe not "the top" for the year but a top that should produce a nice pullback for those same big boys that were selling to flip and become buyers again at much lower prices. That's one sign of a top. Another sign is the topping tail put in on the market. Also I see that the actual high was 2821, right in the middle of everyone else (and mine) forecasted zones. We know that a prior high back on March 13th was at 2814 (it's the horizontal green trendline on chart), and the Fibonacci levels were in the 2835 area. What did SkyNet do? It stopped in the middle.
I discussed this subject on yesterdays post. No need to go over it again today, but in the future when I draw trendlines and support/resistance levels I'm going to make note of the "in-between" zones. I've also discussed several times in the past week the negative divergence on the 6 hour chart. Today it has 4 smaller "humps", or quadruple negative divergence. I pointed out that the black MACD line didn't look as strong and powerful as it should when crossing over the red MACD line. Now today we see that the "pop and drop" from yesterday has caused that black MACD line to roll back over and is currently touching the red line. While it's not crossed yet it's certainly another sign of weakness in the market.
All these signs put together give me reason to believe that we have likely topped out for now. But I would expect one more rally attempt today to lure in more bulls and scare a few bears. There was an afterhours spike high around 4:15pm showing 282.00 on the SPY, which might be a FP target for today. It's hard too say if that will happen early in the day or at the close, but I'll be looking for it at some point today. Considering that today is another weekly options expiration day, and that "Max Pain" is at 280 on the SPY, which is where the most "Puts" are at. But the most "Calls" are at 283, so I think somewhere in the middle is likely.
Now if you are bearish you don't want to see them take it down too far today and run back up into that 282 level at the close as if it drops far enough a lot of the overbought charts could get reset to neutral and allow another choppy day on Thursday and/or Friday. Instead you rather them keep going sideways to slightly up and then pin at 282 by the close in an overbought short term position (hours to days) to align with the overbought medium term position (days to weeks). Anyway, I'll be looking for a 282 Pin at the close today as that's the "possible" FP from afterhours yesterday. Then tomorrow I think we'll see some more downside happen, so I'll likely take another short at the close today should we hit 282. I'll post it in the free chatroom if I do.
One more thing. Yesterday in the premarket session there was a "possible" FP showing a low of 280.20 at 8:38am EST. I thought we'd get there yesterday when the market was dropping nicely, but it didn't. So that could be a target low today or tomorrow? Don't know which? But those are the two "possible" FP targets to focus on should we get close to either. Good Luck.

