Saturday, July 25, 2026
Home Blog Page 46

ES Morning Update July 10th 2018

0


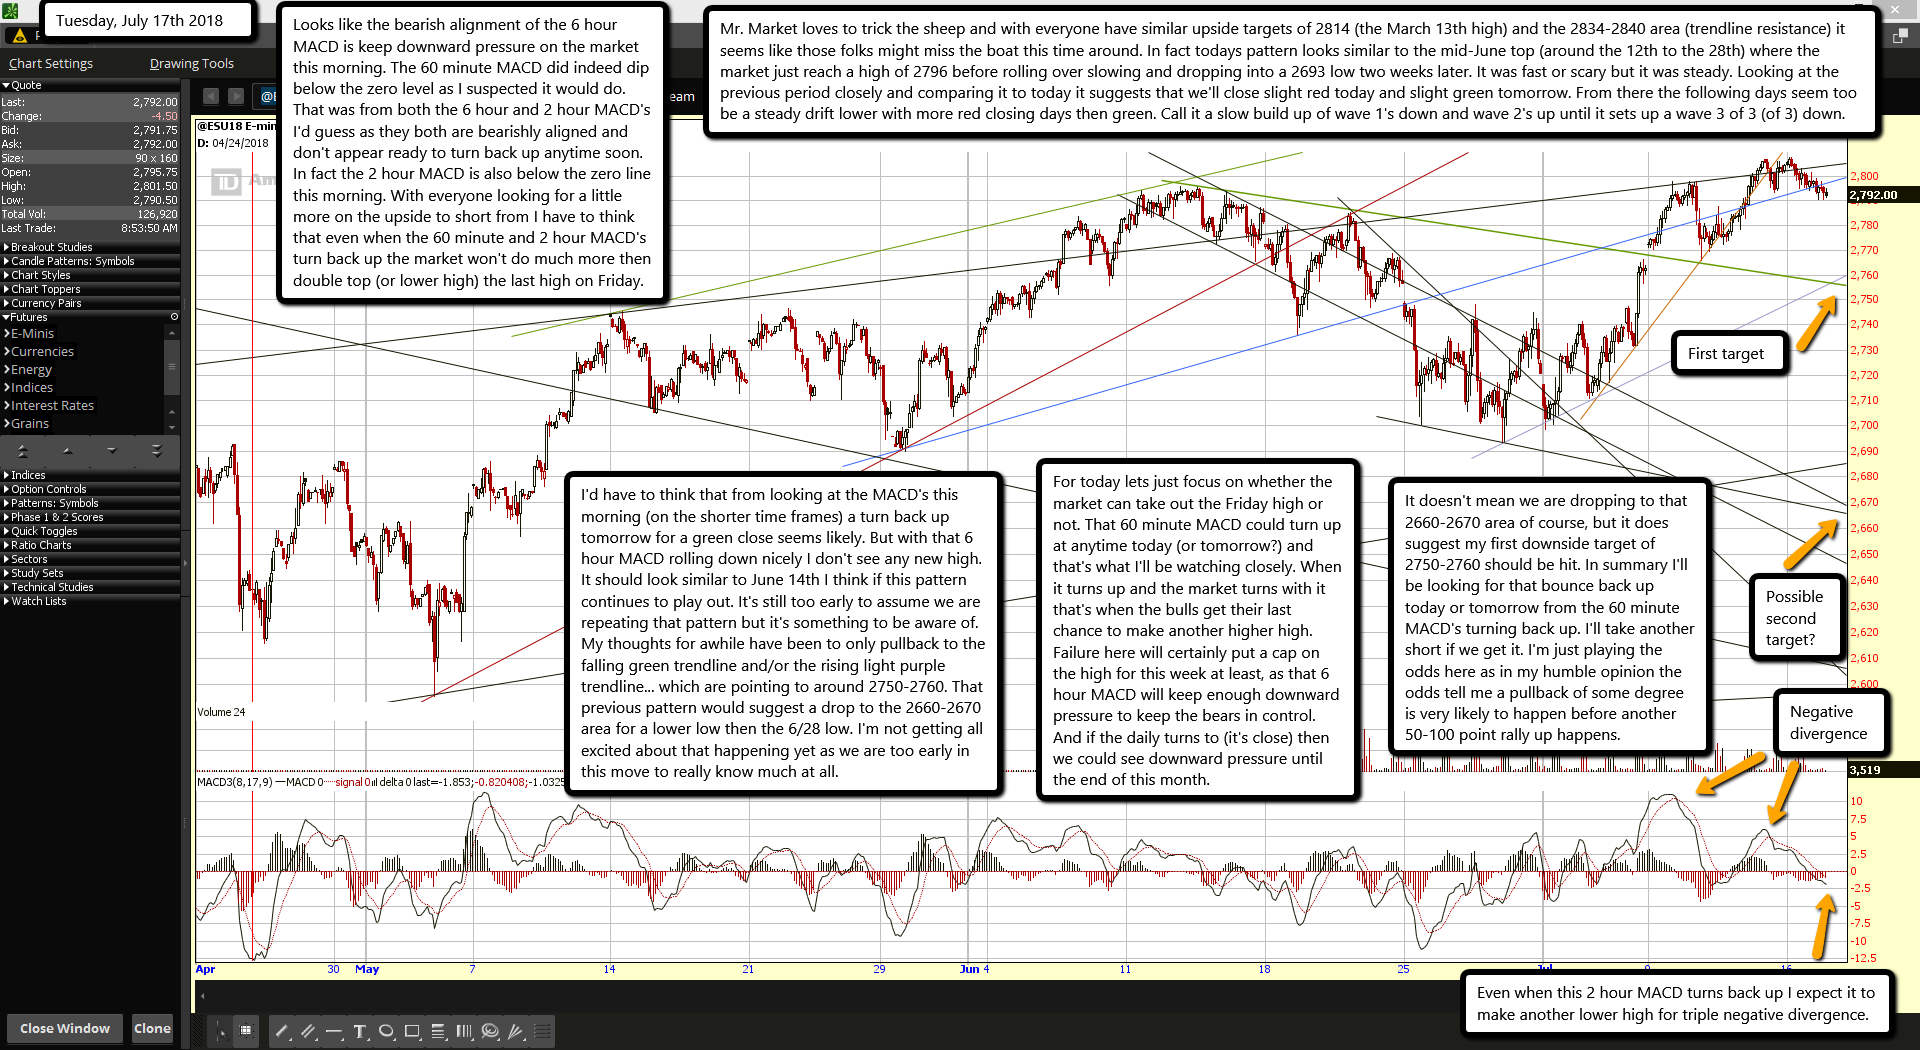
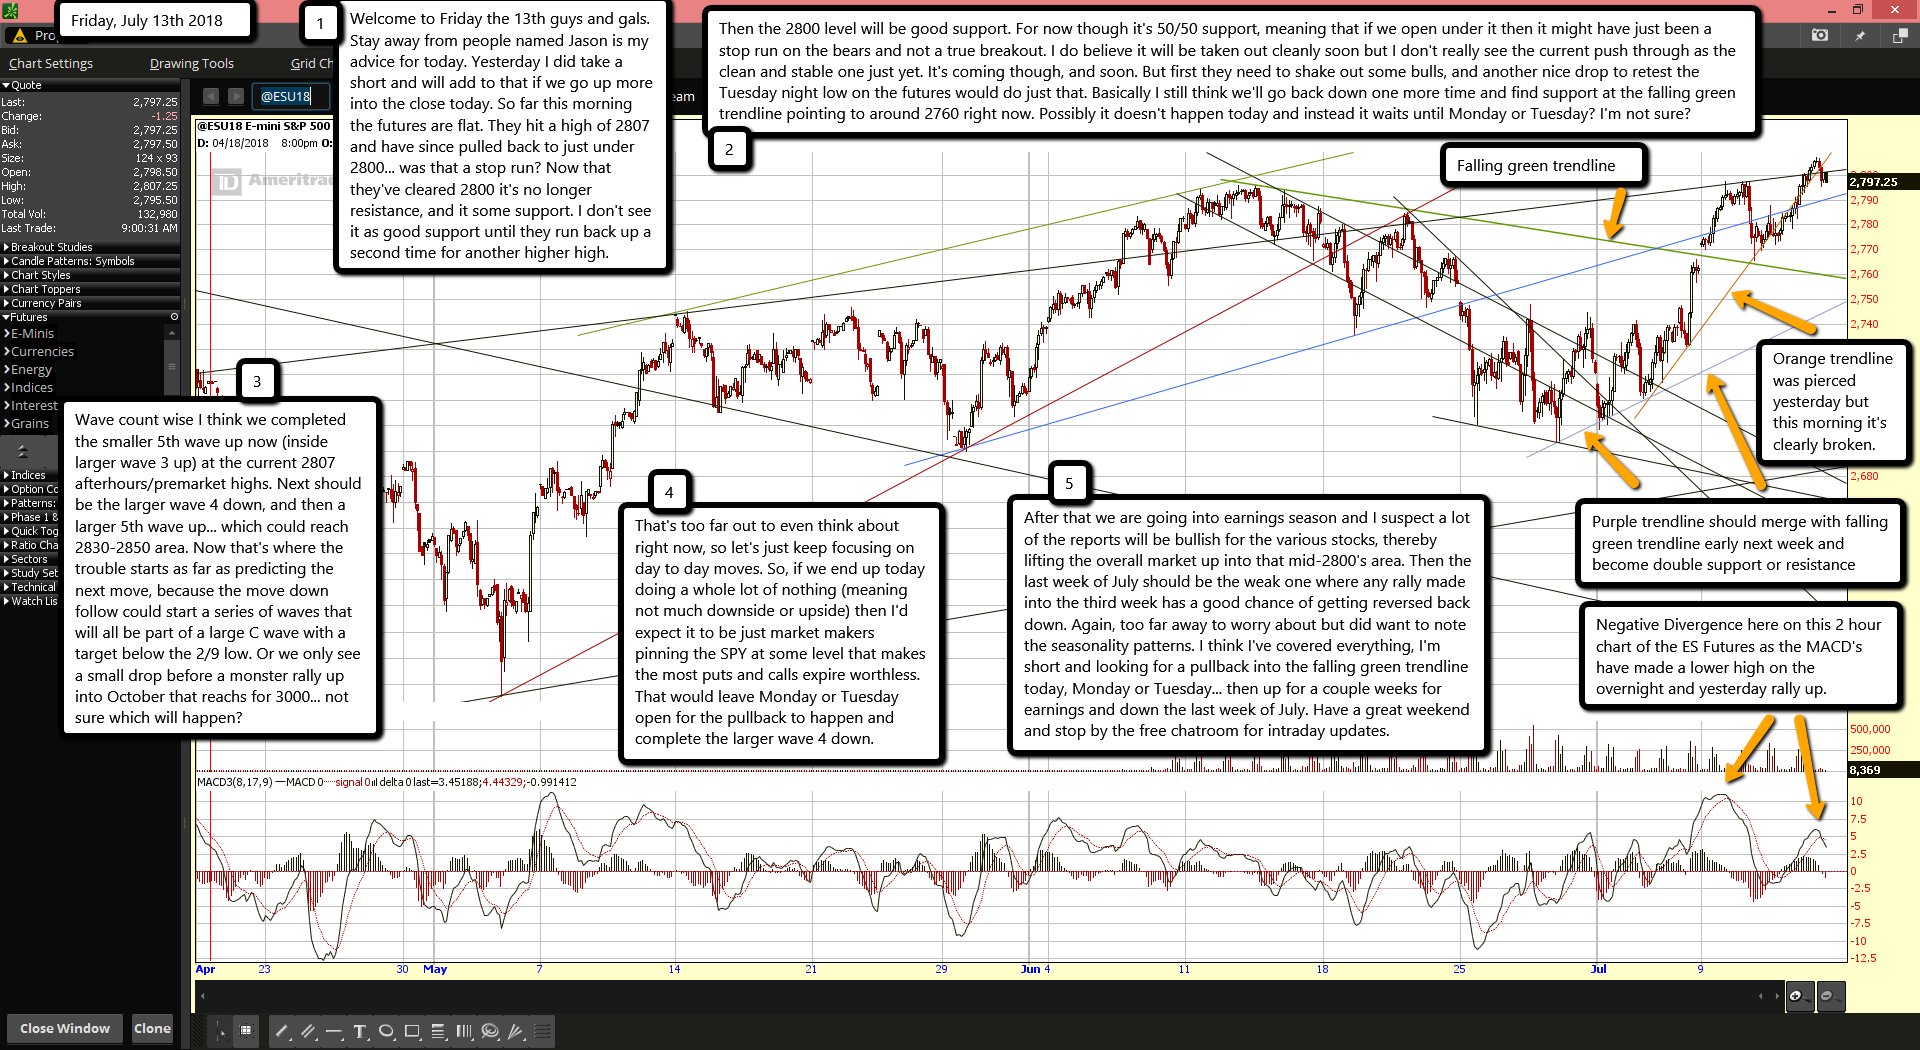
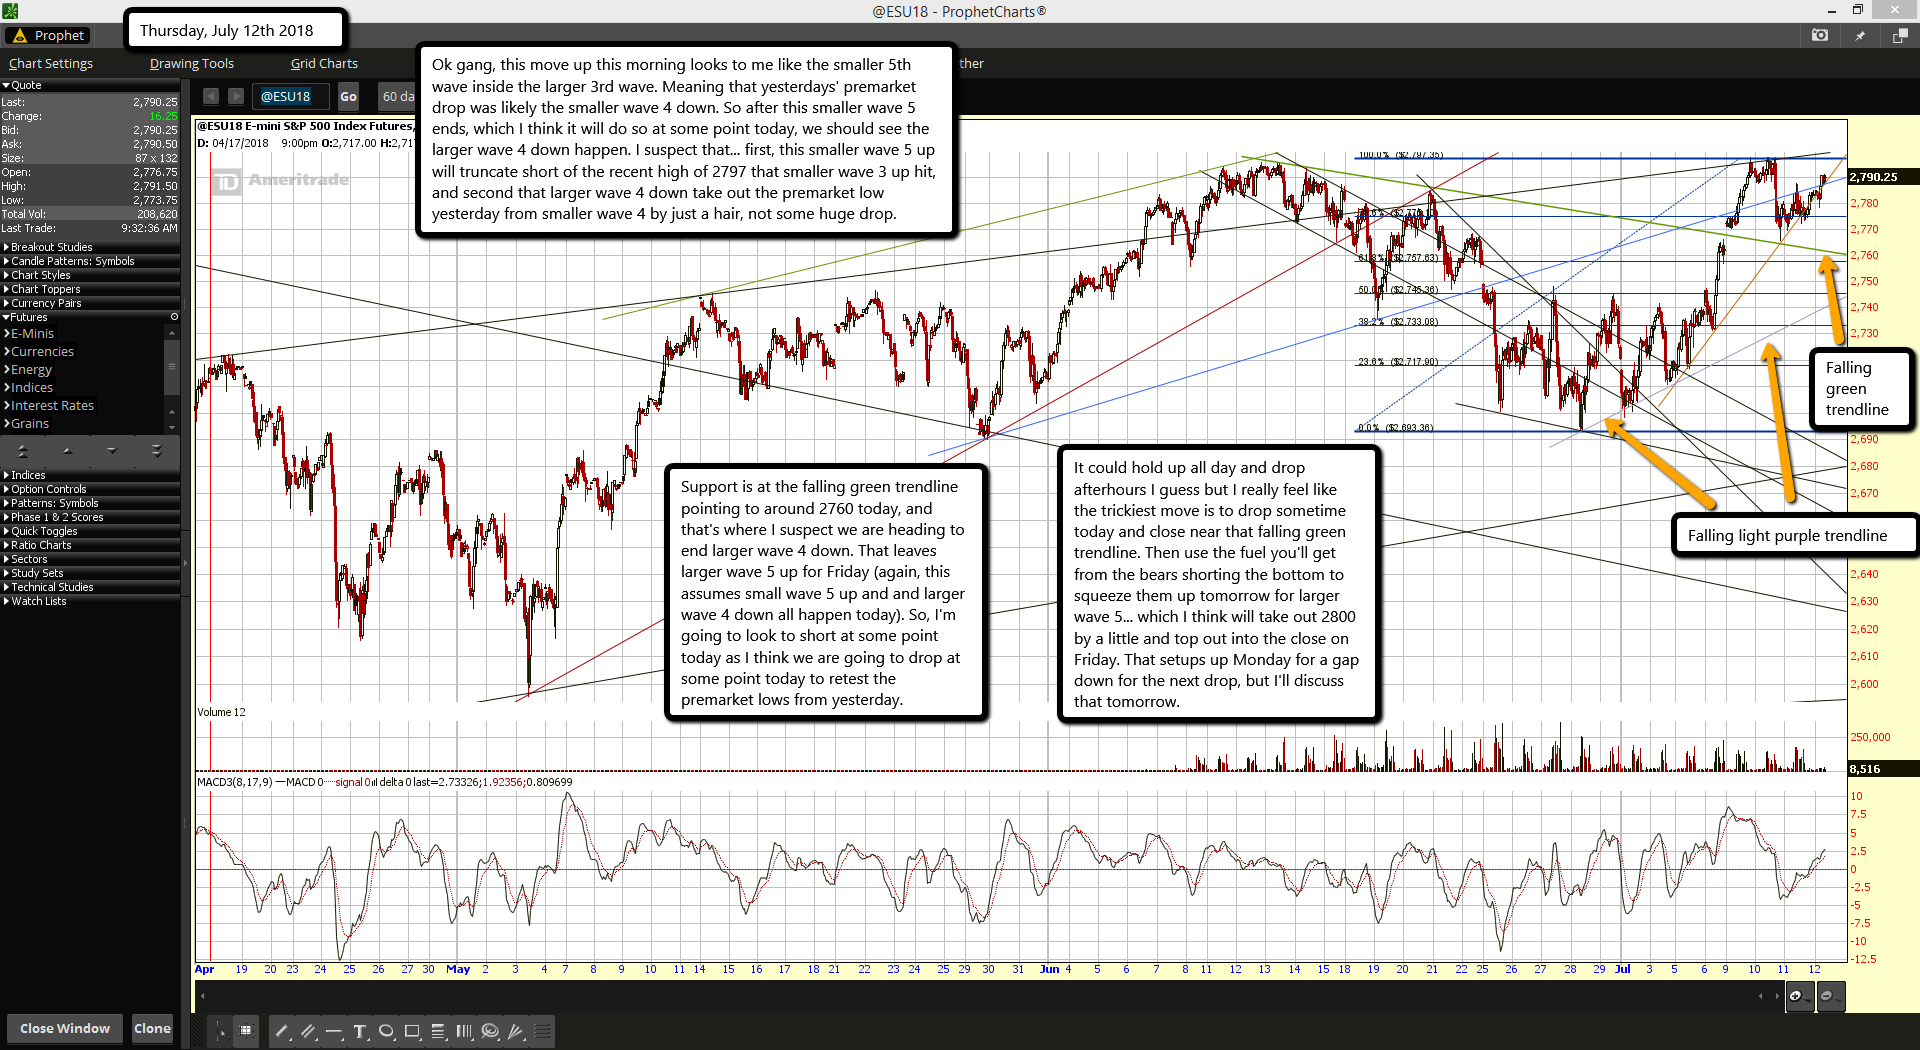
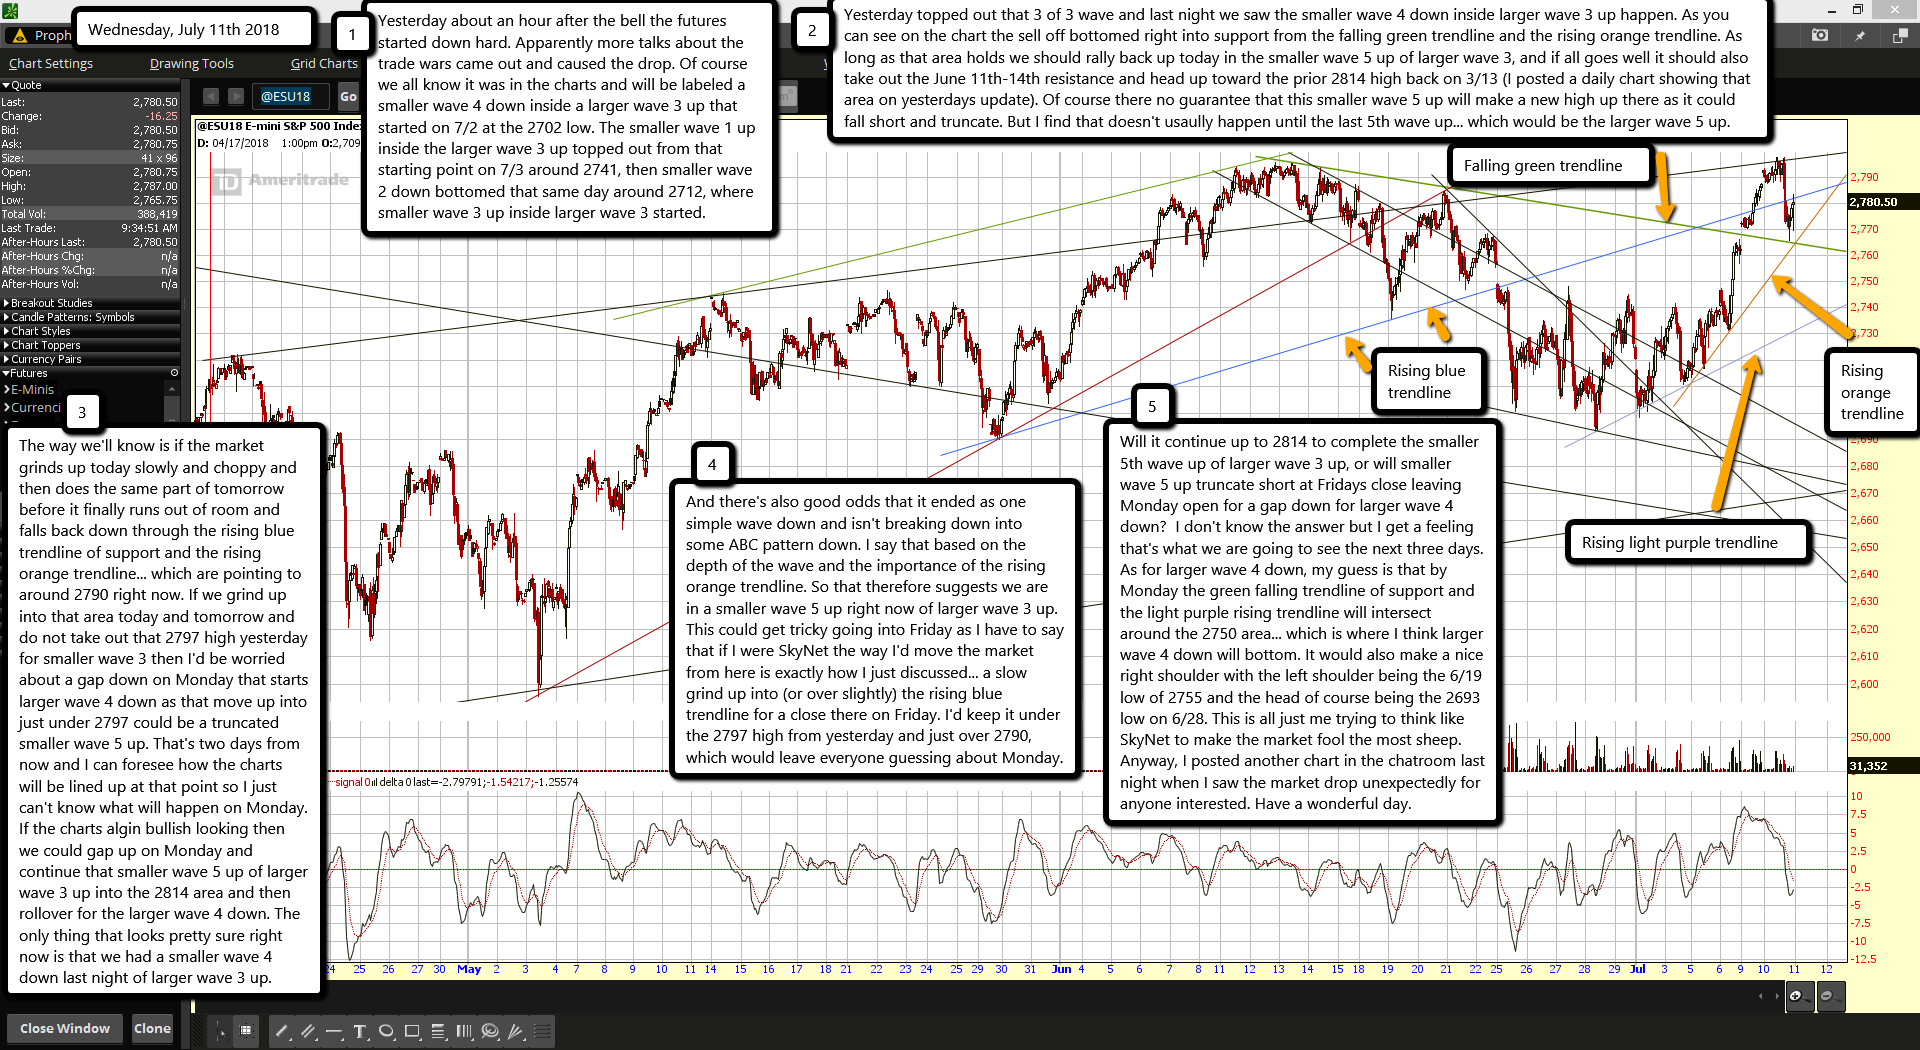
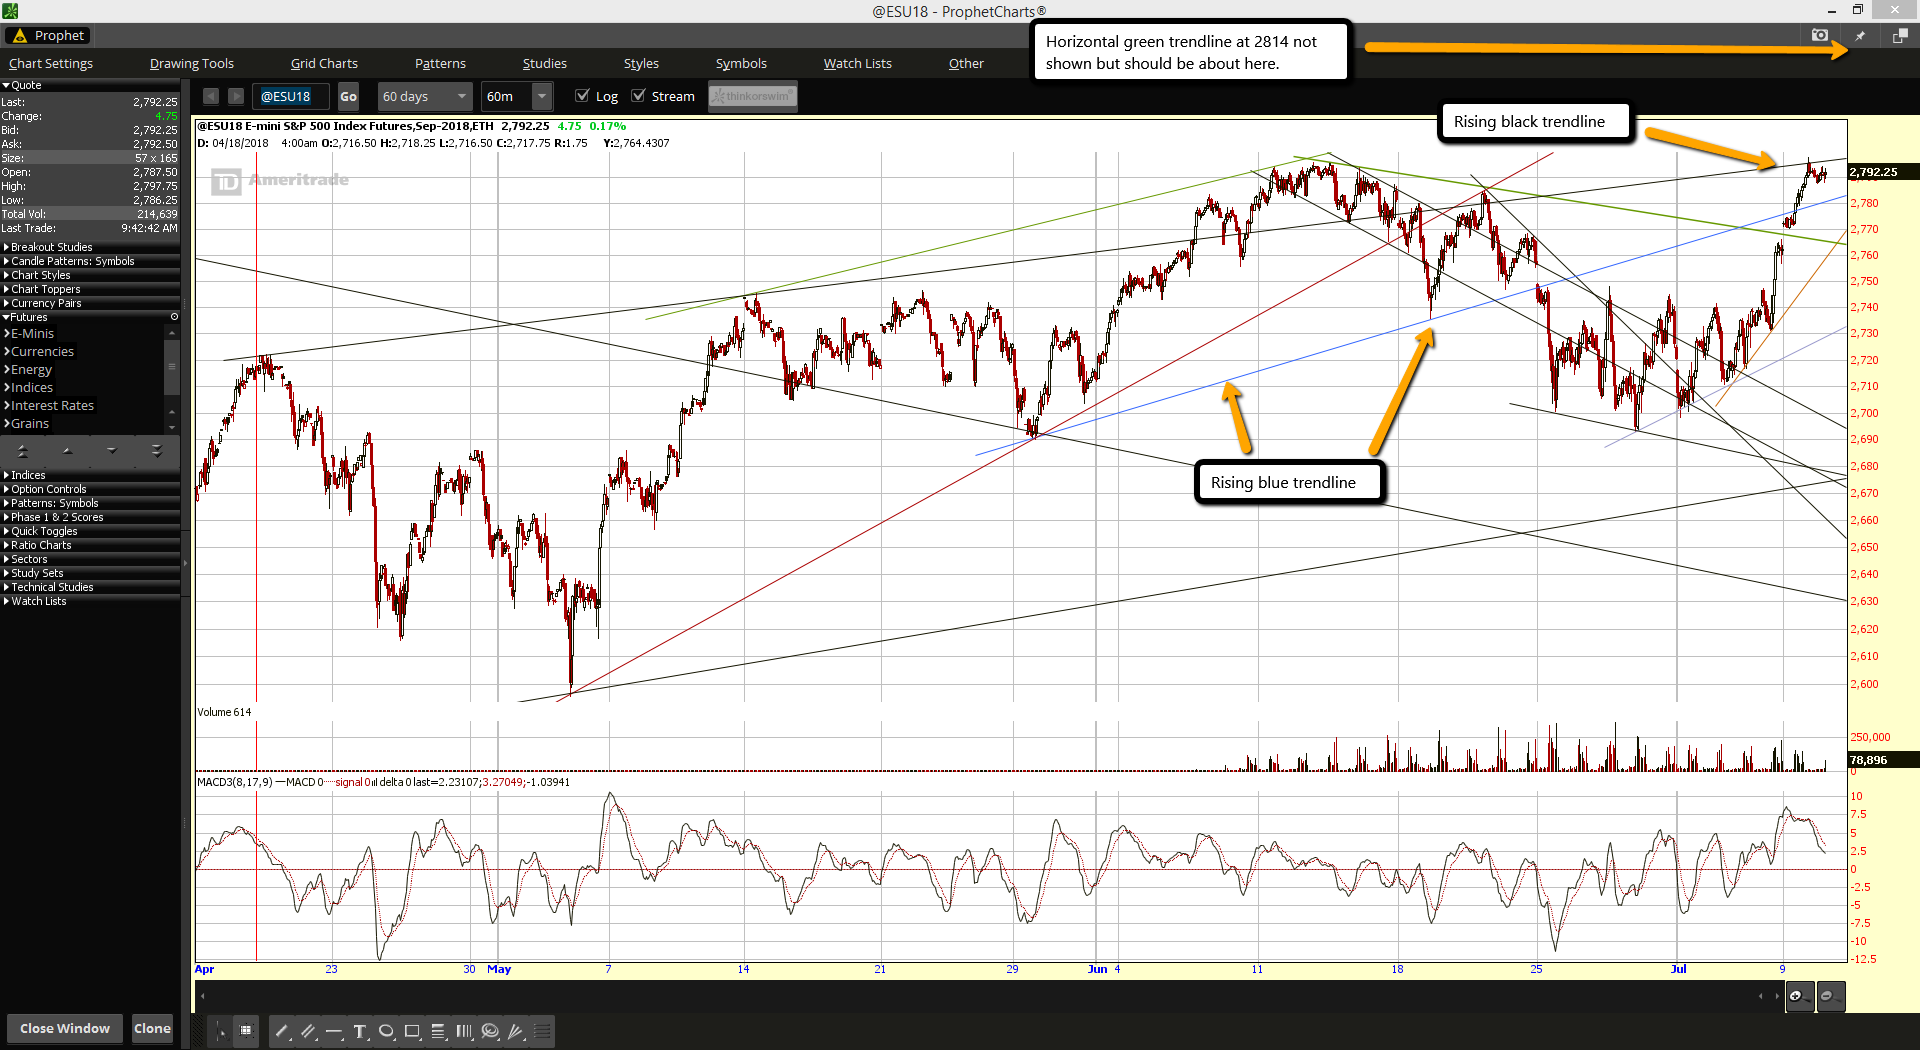
Looks like yesterdays thoughts on the bulls continuing to control the market was right as they put in another nice up day. But today they are up against some tough resistance levels so I don't see this day being like yesterday. A chop drifting sideways day is more likely. Since I think the entire move up from around 2710 on 7/3 some kind of wave 3 then I'm expecting to see a wave 4 appear today or tomorrow.

Most likely we started on 6/28 at around 2694 for a wave 1 up that ended at 2744 on 6/29, then down to 2700 for the wave 2... which then started the wave 3 up, and it subdivided into 5 smaller waves. The first wave 1 up of that wave 3 up went from 2700 to a high of 2745 on 7/3, then down to 2710 for the wave 2 of the wave 3 up. That's where the fun began for the bulls as that's where the wave 3 up of wave 3 up happened. You could subdivide it further but it's not important as it's still a wave 3 of a wave 3 up and that's why it's been so strong.

Now since the move down for the wave 2 of wave 3 up was a normal straight wave pullback I expect the wave 4 down of wave 3 up (yet to happen) to do the opposite. It should take the path of a more sideways move (like a bull flag) or an ABC move. Now this wave 4 down is still inside a wave 3 up, so that means that a wave 5 up of wave 3 up should follow it. So for example let's say that today we drift down about 10 points but it's mostly a sideways pattern. As you know that's a bull flag pattern, which suggests that it will breakout to the upside afterwards.

Ok, so about 10 points down or sideways would put us right into the rising blue trendline of support (was resistance yesterday). From there we'd see the wave 5 up of wave 3 up to breakthrough the June 11th-14th horizontal resistance zone, and most likely move up to the horizontal trendline of resistance around 2814 where the market topped back on 3/13 of this year. That should end all five waves up of this wave 3 up, then next would be a wave 4 down which I'd guess will be an ABC move and one that would be in the 20-30 point range.

Oddly, the rising trendline that the market hit this morning before the open (and backed off) will likely be the pullback target in the future for that wave 4 down. Then there should be a wave 5 up to end the entire 5 wave move from the 6/28 starting point of 2694. I'd guess that would end at the rising green trendline pointing to around 2845 right now. All in all the bulls have this market right now and any drops should be temporary.

ES Morning Update July 9th 2018

0


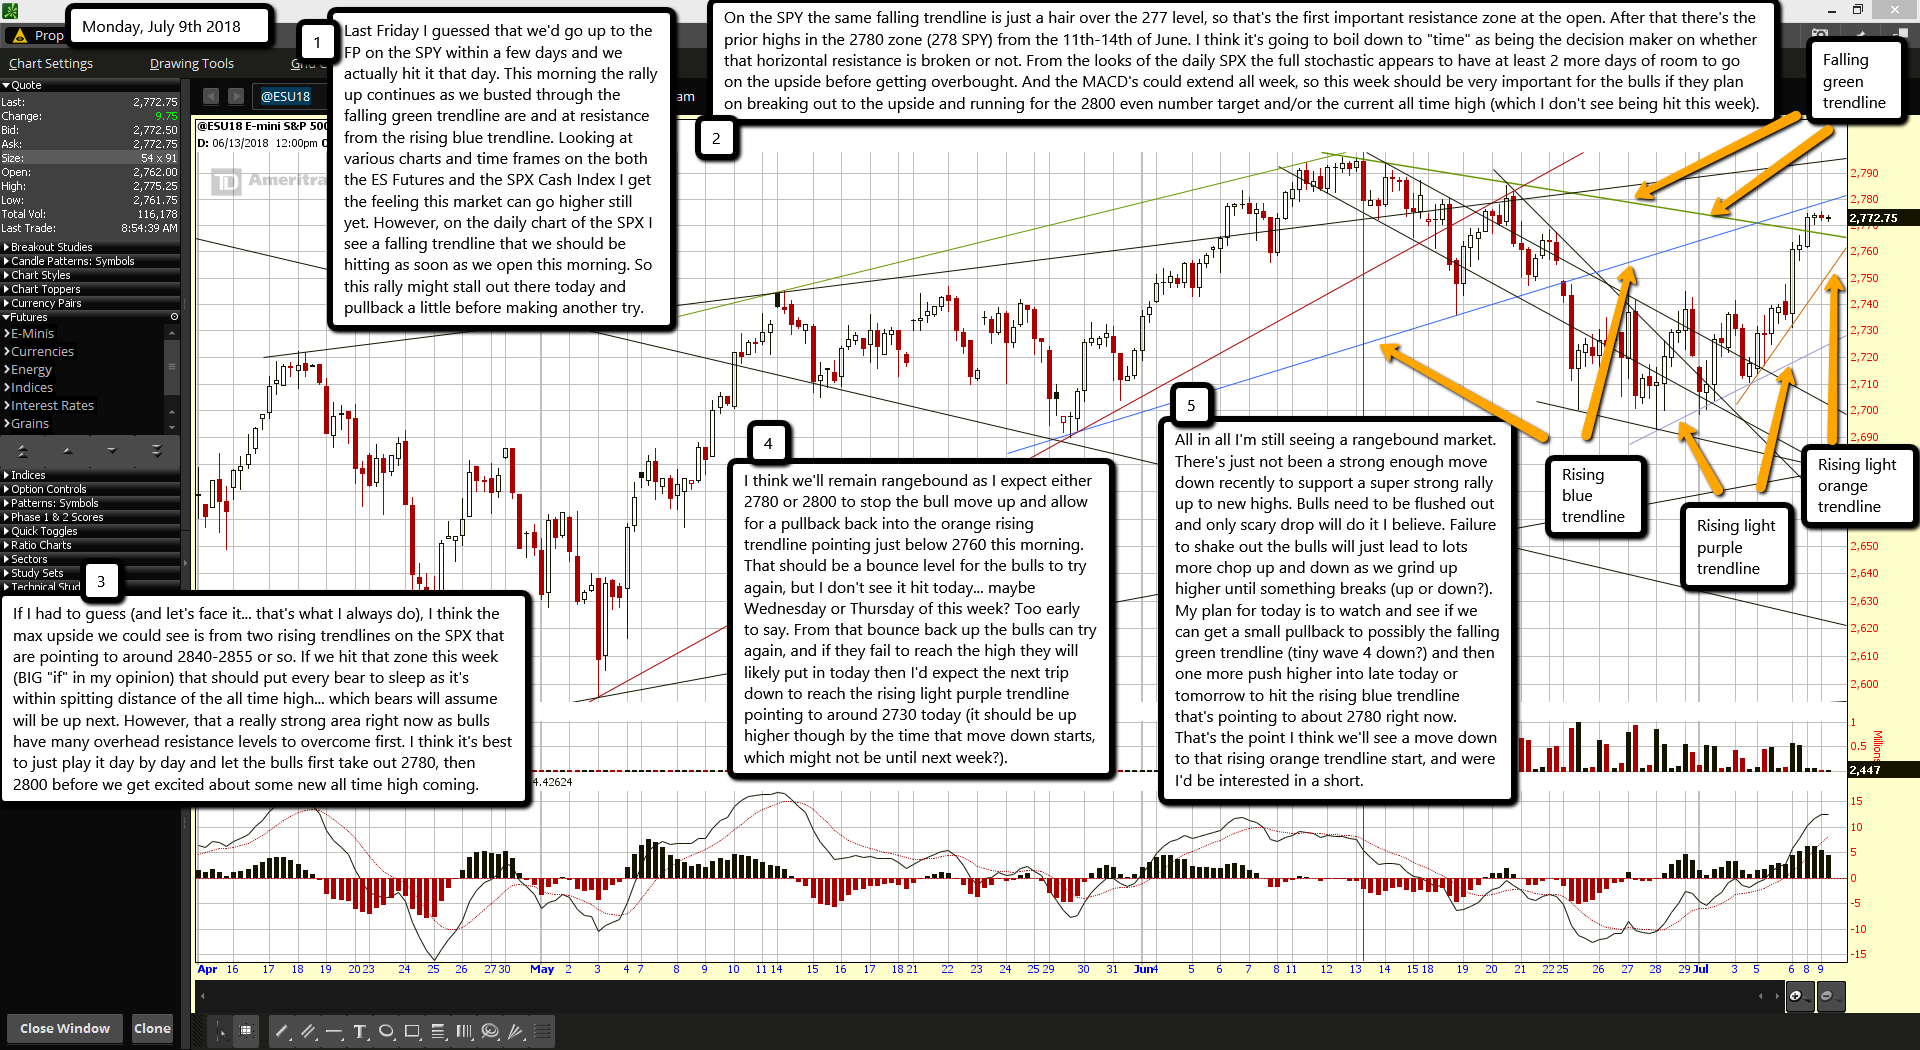
Last Friday I guessed that we'd go up to the FP on the SPY within a few days and we actually hit it that day. This morning the rally up continues as we busted through the falling green trendline are and at resistance from the rising blue trendline. Looking at various charts and time frames on the both the ES Futures and the SPX Cash Index I get the feeling this market can go higher still yet. However, on the daily chart of the SPX I see a falling trendline that we should be hitting as soon as we open this morning. So this rally might stall out there today and pullback a little before making another try.

On the SPY the same falling trendline is just a hair over the 277 level, so that's the first important resistance zone at the open. After that there's the prior highs in the 2780 zone (278 SPY) from the 11th-14th of June. I think it's going to boil down to "time" as being the decision maker on whether that horizontal resistance is broken or not. From the looks of the daily SPX the full stochastic appears to have at least 2 more days of room to go on the upside before getting overbought. And the MACD's could extend all week, so this week should be very important for the bulls if they plan on breaking out to the upside and running for the 2800 even number target and/or the current all time high (which I don't see being hit this week).

If I had to guess (and let's face it... that's what I always do), I think the max upside we could see is from two rising trendlines on the SPX that are pointing to around 2840-2855 or so. If we hit that zone this week (BIG "if" in my opinion) that should put every bear to sleep as it's within spitting distance of the all time high... which bears will assume will be up next. However, that a really strong area right now as bulls have many overhead resistance levels to overcome first. I think it's best to just play it day by day and let the bulls first take out 2780, then 2800 before we get excited about some new all time high coming.

I think we'll remain rangebound as I expect either 2780 or 2800 to stop the bull move up and allow for a pullback back into the orange rising trendline pointing just below 2760 this morning. That should be a bounce level for the bulls to try again, but I don't see it hit today... maybe Wednesday or Thursday of this week? Too early to say. From that bounce back up the bulls can try again, and if they fail to reach the high they will likely put in today then I'd expect the next trip down to reach the rising light purple trendline pointing to around 2730 today (it should be up higher though by the time that move down starts, which might not be until next week?).

All in all I'm still seeing a rangebound market. There's just not been a strong enough move down recently to support a super strong rally up to new highs. Bulls need to be flushed out and only scary drop will do it I believe. Failure to shake out the bulls will just lead to lots more chop up and down as we grind up higher until something breaks (up or down?). My plan for today is to watch and see if we can get a small pullback to possibly the falling green trendline (tiny wave 4 down?) and then one more push higher into late today or tomorrow to hit the rising blue trendline that's pointing to about 2780 right now. That's the point I think we'll see a move down to that rising orange trendline start, and were I'd be interested in a short.

Why Are Tesla Executives Are Fleeing… Is It The Next Enron?

0

Is Tesla The New Theranos Or Next Enron?

I originally started following Tesla as I felt it was a structurally unprofitable business nearing a cash crunch as hundreds of competing products were about to enter the market.

As I’ve studied Tesla more closely, I’ve come to realize that Elon Musk appears to be running a Ponzi Scheme disguised as an auto-manufacturer; where he has to keep unveiling new products, many of which will never come to market, in order to raise new capital (equity/debt/customer deposits) to keep the scheme alive. The question has always been; when will Tesla collapse?


Tesla’s Bullshit Conversion Cycle is the key financial metric underlying this scheme (from @ProphetTesla)

As part of my research on Tesla, I decided to read Bad Blood by John Carreyrou, the journalist who first uncovered the Theranos fraud. It is the story of how Elizabeth Holmes created Theranos and then lurched between publicity events in order to raise additional capital and keep the fraud going, despite the fact that the technology did not work. The key lesson from Theranos for determining when a fraud will implode is that there are always idiots willing to put fresh money into a well marketed fraud - so you need a catalyst for when the funding dries up.

The other salient fact was that most senior employees actually knew that something wasn’t quite right, but feared losing their jobs or getting sued if they did anything about it. Therefore, employee turnover was off the charts but no one was willing to risk their career by saying anything publicly. However, when Theranos started risking customers’ lives, the secret got out pretty fast. This is because most people are inherently ethical - especially when they know that their employer is doing something immoral, like releasing flawed lab results to sick patients. Eventually, some employees felt compelled to become whistle-blowers and started to reach out to journalists and regulators. This started a cascading event.

First, one intrepid journalist took the career risk to write about the Theranos fraud. Then other whistle-blowers felt emboldened to step forward and contact this first journalist, as they also wanted their story told - especially as they had already reached out to government regulators who were too scared to investigate a politically powerful company.

Once a few good articles had been written about Theranos, the dam broke open and the feeding frenzy began. Other journalists, smelling page-clicks rapidly descend on Theranos; more workers spoke out, more incriminating evidence came to light and then there was a sense of voter outrage. Finally, the regulators who were first contacted by the whistle-blowers many months previously, felt compelled to act - at which point the fraud collapsed and the money spigot shut off.

Executives Fleeing Tesla Is A True Bull Market “Up And To The Right”

We’ve already seen the mass exodus of senior Tesla executives. When they say they “want to spend time with their family,” it really means they “want to spend less time in prison.” Next, we have the first whistle-blowers—there will be MANY more. Currently there are at least 3 different ones feeding information to journalists. Using past frauds as a guide, once we get to this point of the media cycle, the fraud usually unravels pretty fast.  Given the perilous state of Tesla’s finances, they are in urgent need of new capital. The question is; who would want to invest new capital when Tesla is now admitting to knowingly selling cars without testing the brakes in order to hit some arbitrary one week production target? When a company admits that it will sacrifice vehicle quality and even risk killing its customers to win a twitter feud and start a short squeeze, regulators must step in. The question is; what else has Tesla done illegally to hit its targets? We know that Tesla long ago passed over the ethical threshold of selling faulty products that have killed people—what other allegations will soon come to light? Elon Musk demanded that Tesla stop testing brakes on June 26. Doug Field, chief engineer, resigned on June 27. Is this a coincidence? Of course not—Doug Field doesn’t want to be responsible for killing people. I think Tuesday’s article will speed up the pace of Tesla’s bankruptcy quite dramatically and I purchased some shorter dated puts after reading it.

Tesla is the fluke stock-promote that found a way to address society’s fascination with ‘green technology’ and the ‘next Steve Jobs.’ Elon Musk eagerly stepped into the role of mad scientist and investors gave him a free pass. It now increasingly seems that everything he’s done for the past few years was simply designed to keep the share price up, keep the dream alive and raise more capital - as opposed to creating shareholder value. Along the way, customer safety has been ignored in order to hit production targets and appease the stock market. In addition to not testing brakes, a recent whistle-blower has accused Tesla of installing over 700 dangerously defective batteries into Model 3 vehicles.

I suspect there will be many more allegations as whistle-blowers come out of the woodwork. It really is the Theranos of auto makers. I suspect it will all end soon. Theranos and Enron both collapsed within 90 days of the journalists getting up to speed. The reporters now know the right questions to ask and Tesla will be out of cash by the time they are all answered.

Stock Promotion In Overdrive Lately. What’s Elon Trying To Distract People From?

Besides, Elon Musk isn’t even all that innovative. Hitler already tried this same automotive customer deposit scam 80 years ago (From Wages of Destruction)


WELL, Well, well... seems like we might have just discovered our next Enron and therefore the next Stock Market Crash window!

I've highlighted in yellow the part about 90 days as this would put us out into September or October, depending on when this gets enough exposure by whistleblowers and the news reporters to start that 90 day countdown. It funny as this lines up nicely with a final 5th wave up in the market going into late September or early October to end a 5 wave move higher starting from the January low in 2016, which was around 15,500 on the DOW Jones Index and about 1800 on the S&P500.

We also have the November mid-term elections that might serve as another catalyst to blame the crash on.  After all, everything is Trumps fault according to the Propaganda Mind Controlling Media.  So let's crash the market so all the sheep will vote for the Democrats this go around as it must be the Republicans fault for the crash... right?  LOL!

Folks, all crashes are planned years in advance and the next one will be no different.  While I think the market is bullish right now and that the trend will be up into late September or early October I do think we have another nasty drop coming afterwards.  Will it be called a crash or just a large correction?  Who knows but if they want maximum effect they should make it a full blown "wipeout"in my opinion.

We'll see I guess...

Red

ES Morning Update July 6th 2018

0


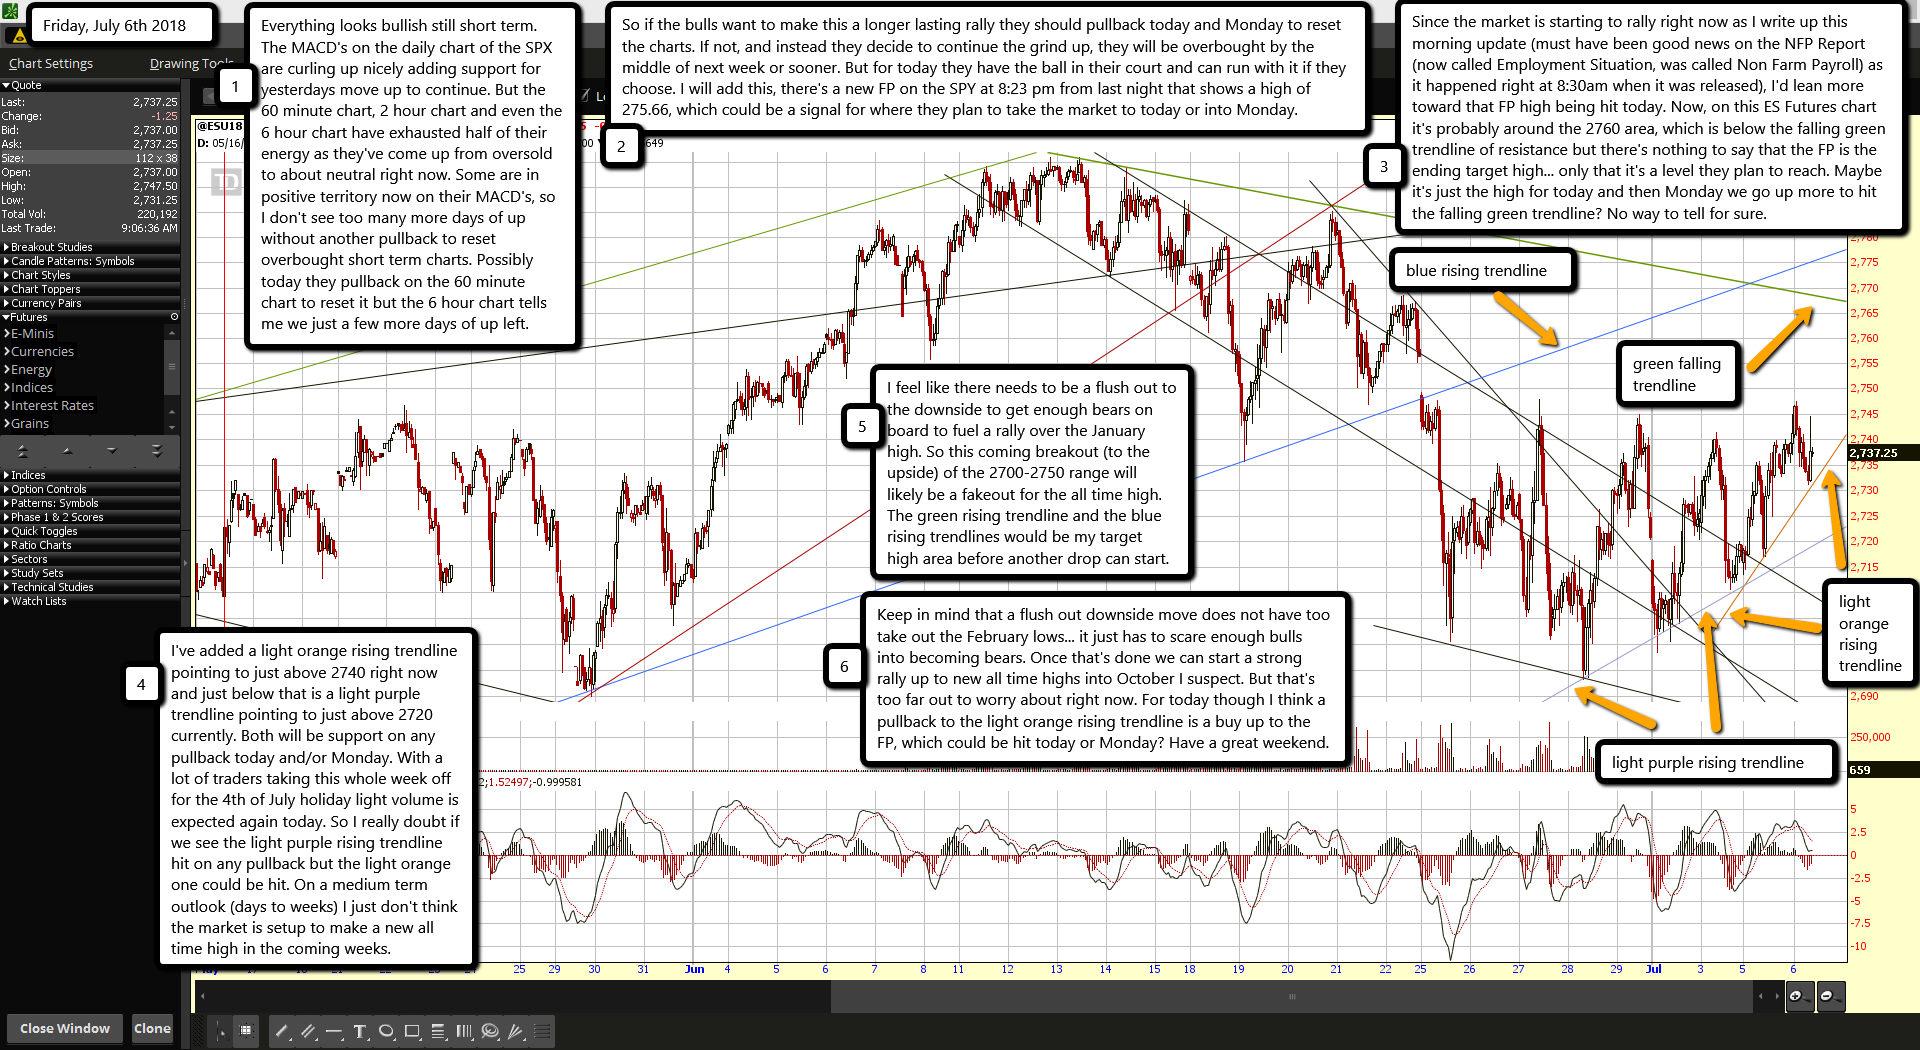
Everything looks bullish still short term. The MACD's on the daily chart of the SPX are curling up nicely adding support for yesterdays move up to continue. But the 60 minute chart, 2 hour chart and even the 6 hour chart have exhausted half of their energy as they've come up from oversold to about neutral right now. Some are in positive territory now on their MACD's, so I don't see too many more days of up without another pullback to reset overbought short term charts. Possibly today they pullback on the 60 minute chart to reset it but the 6 hour chart tells me we just a few more days of up left.

So if the bulls want to make this a longer lasting rally they should pullback today and Monday to reset the charts. If not, and instead they decide to continue the grind up, they will be overbought by the middle of next week or sooner. But for today they have the ball in their court and can run with it if they choose. I will add this, there's a new FP on the SPY at 8:23 pm from last night that shows a high of 275.66, which could be a signal for where they plan to take the market to today or into Monday.

Since the market is starting to rally right now as I write up this morning update (must have been good news on the NFP Report (now called Employment Situation, was called Non Farm Payroll) as it happened right at 8:30am when it was released), I'd lean more toward that FP high being hit today. Now, on this ES Futures chart it's probably around the 2760 area, which is below the falling green trendline of resistance but there's nothing to say that the FP is the ending target high... only that it's a level they plan to reach. Maybe it's just the high for today and then Monday we go up more to hit the falling green trendline? No way to tell for sure.

I've added a light orange rising trendline pointing to just above 2740 right now and just below that is a light purple trendline pointing to just above 2720 currently. Both will be support on any pullback today and/or Monday. With a lot of traders taking this whole week off for the 4th of July holiday light volume is expected again today. So I really doubt if we see the light purple rising trendline hit on any pullback but the light orange one could be hit. On a medium term outlook (days to weeks) I just don't think the market is setup to make a new all time high in the coming weeks.

I feel like there needs to be a flush out to the downside to get enough bears on board to fuel a rally over the January high. So this coming breakout (to the upside) of the 2700-2750 range will likely be a fakeout for the all time high. The green rising trendline and the blue rising trendlines would be my target high area before another drop can start.

Keep in mind that a flush out downside move does not have too take out the February lows... it just has to scare enough bulls into becoming bears. Once that's done we can start a strong rally up to new all time highs into October I suspect. But that's too far out to worry about right now. For today though I think a pullback to the light orange rising trendline is a buy up to the FP, which could be hit today or Monday? Have a great weekend.

ES Morning Update July 5th 2018

0


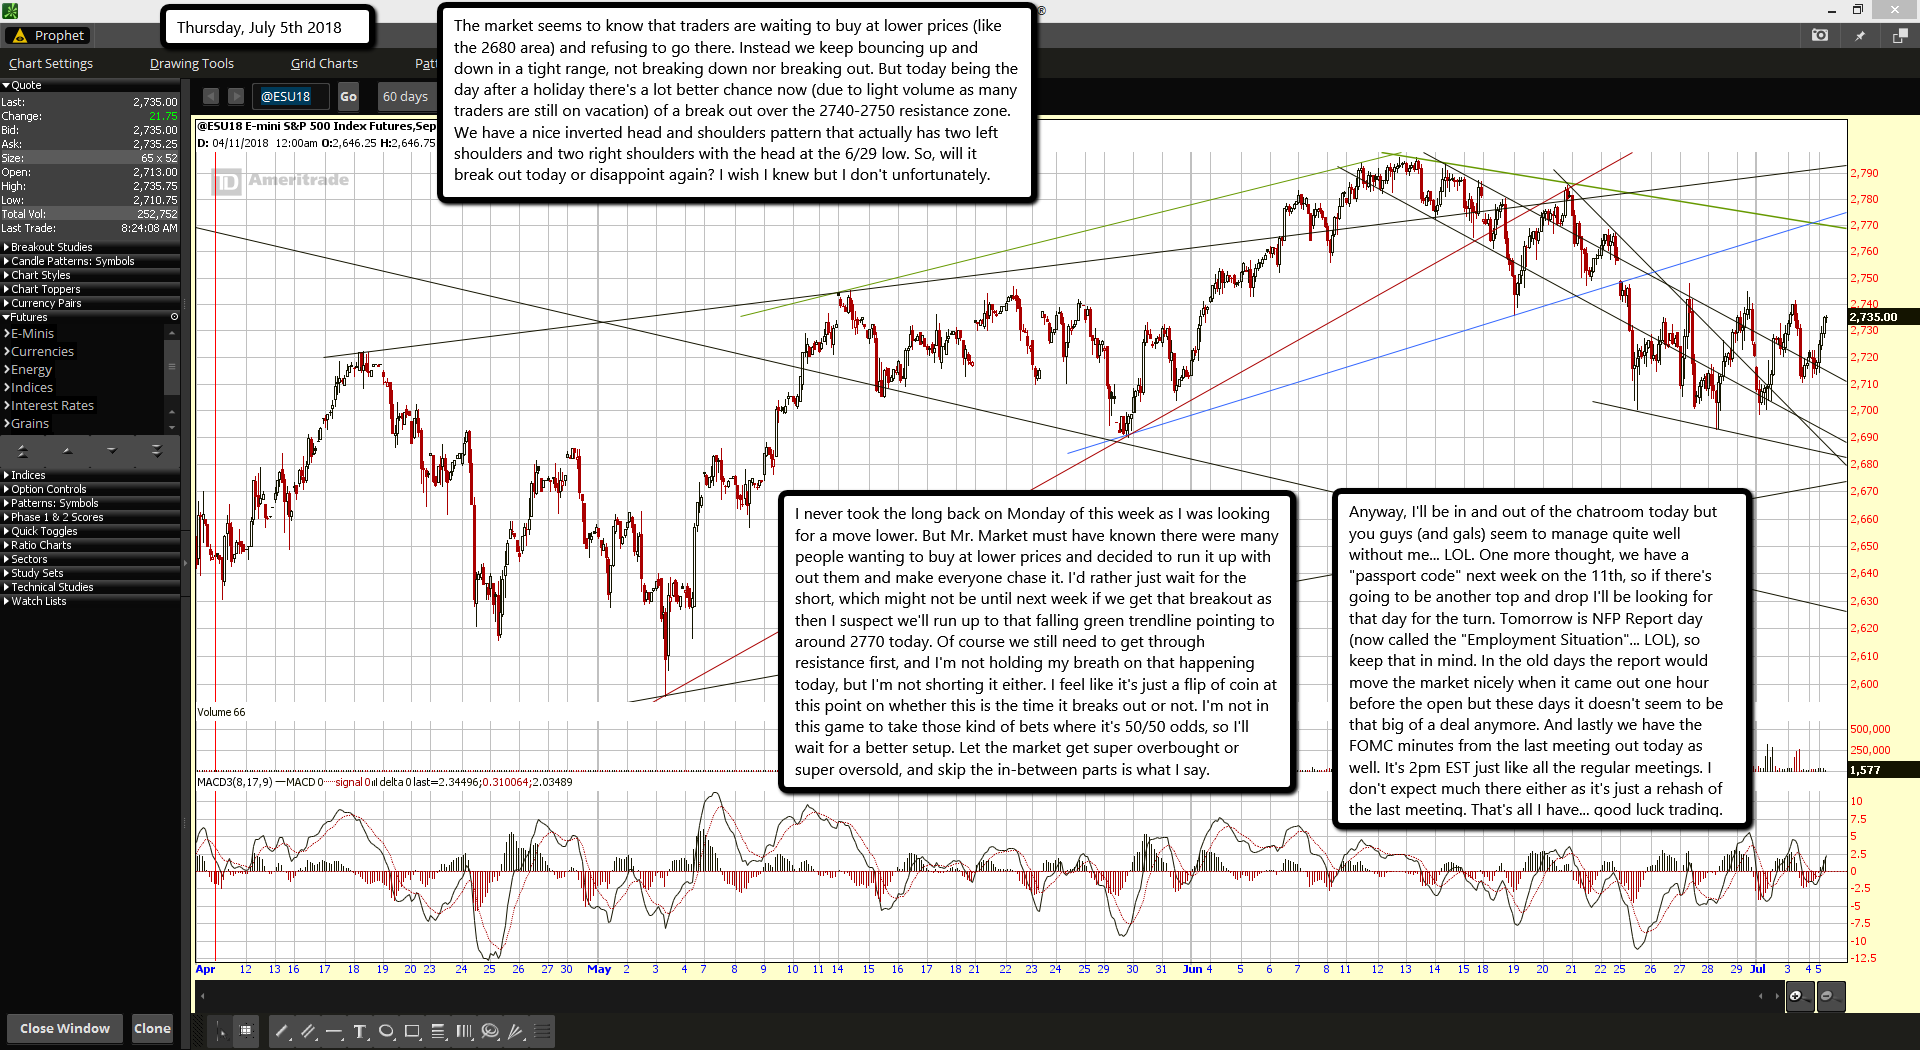
The market seems to know that traders are waiting to buy at lower prices (like the 2680 area) and refusing to go there. Instead we keep bouncing up and down in a tight range, not breaking down nor breaking out. But today being the day after a holiday there's a lot better chance now (due to light volume as many traders are still on vacation) of a break out over the 2740-2750 resistance zone. We have a nice inverted head and shoulders pattern that actually has two left shoulders and two right shoulders with the head at the 6/29 low. So, will it break out today or disappoint again? I wish I knew but I don't unfortunately.

I never took the long back on Monday of this week as I was looking for a move lower. But Mr. Market must have known there were many people wanting to buy at lower prices and decided to run it up with out them and make everyone chase it. I'd rather just wait for the short, which might not be until next week if we get that breakout as then I suspect we'll run up to that falling green trendline pointing to around 2770 today. Of course we still need to get through resistance first, and I'm not holding my breath on that happening today, but I'm not shorting it either. I feel like it's just a flip of coin at this point on whether this is the time it breaks out or not. I'm not in this game to take those kind of bets where it's 50/50 odds, so I'll wait for a better setup. Let the market get super overbought or super oversold, and skip the in-between parts is what I say.

Anyway, I'll be in and out of the chatroom today but you guys (and gals) seem to manage quite well without me... LOL. One more thought, we have a "passport code" next week on the 11th, so if there's going to be another top and drop I'll be looking for that day for the turn. Tomorrow is NFP Report day (now called the "Employment Situation"... LOL), so keep that in mind. In the old days the report would move the market nicely when it came out one hour before the open but these days it doesn't seem to be that big of a deal anymore. And lastly we have the FOMC minutes from the last meeting out today as well. It's 2pm EST just like all the regular meetings. I don't expect much there either as it's just a rehash of the last meeting. That's all I have... good luck trading.

ES Morning Update July 2nd 2018

0

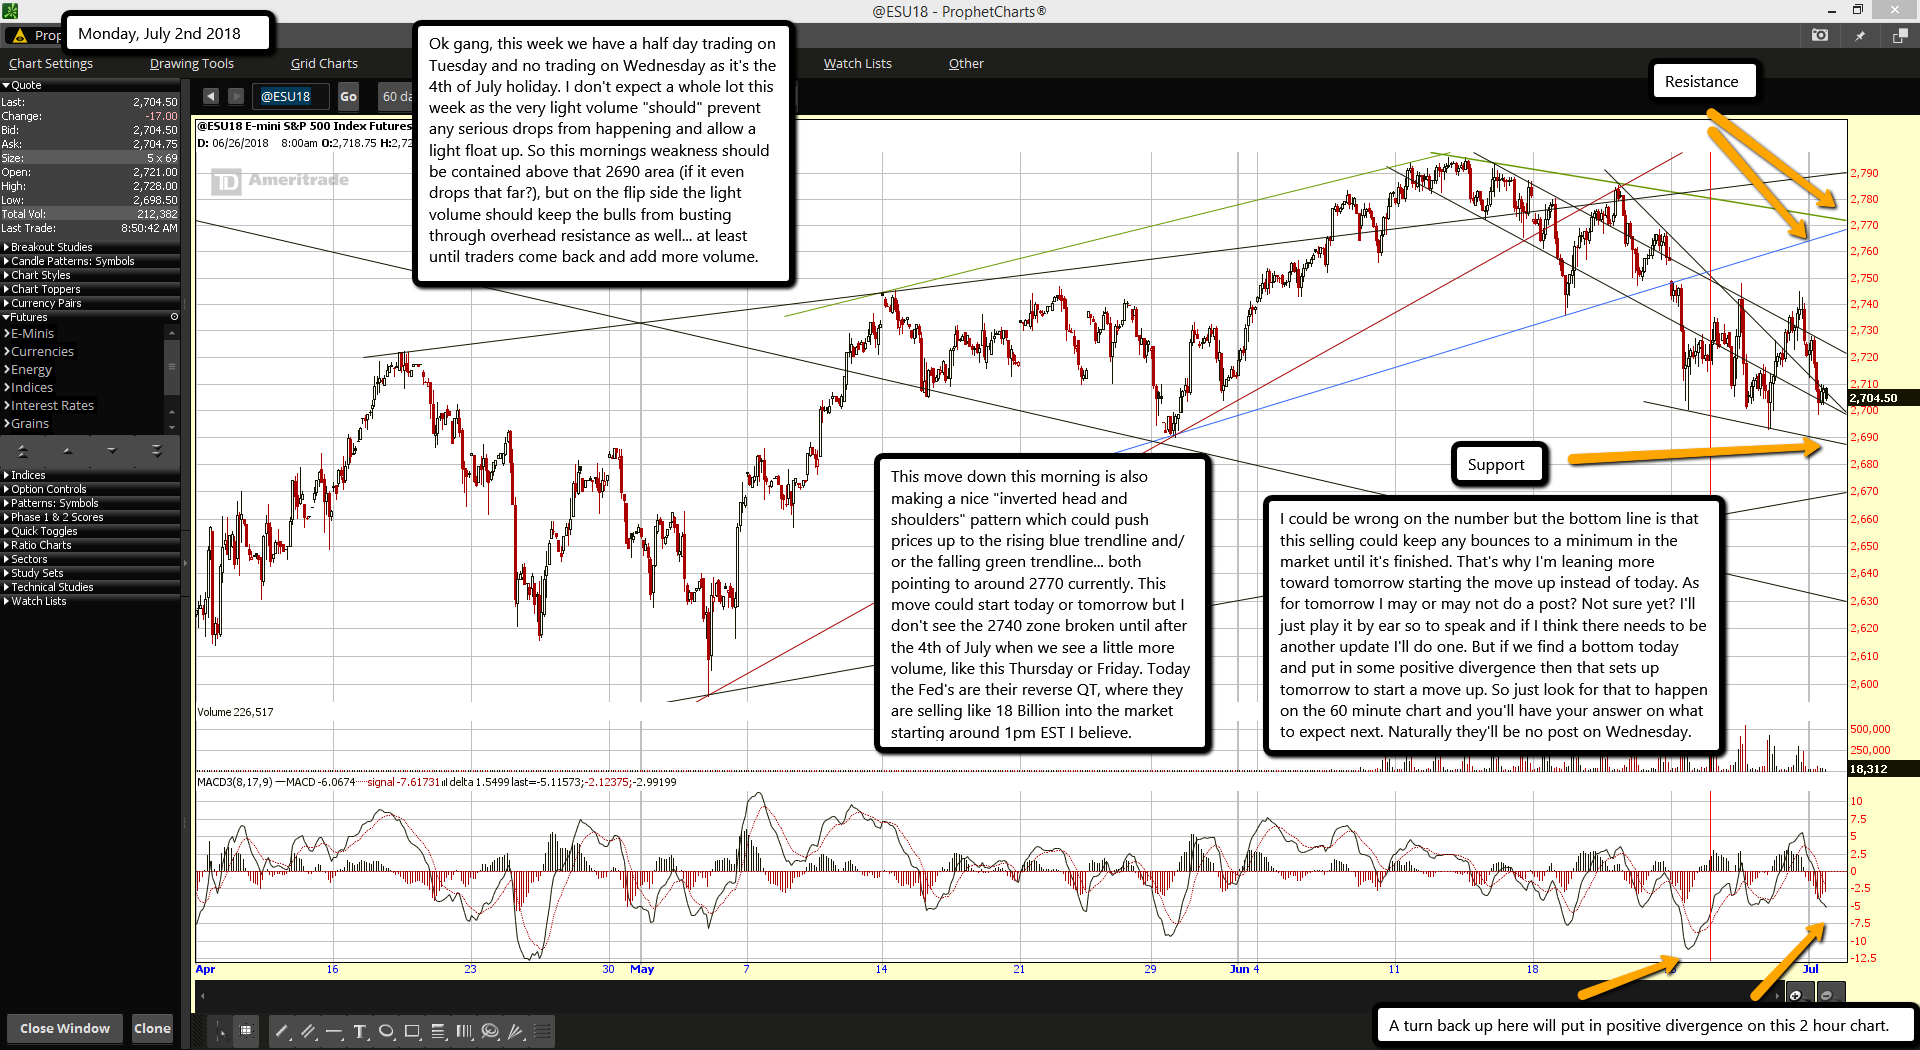
Ok gang, this week we have a half day trading on Tuesday and no trading on Wednesday as it's the 4th of July holiday. I don't expect a whole lot this week as the very light volume "should" prevent any serious drops from happening and allow a light float up. So this mornings weakness should be contained above that 2690 area (if it even drops that far?), but on the flip side the light volume should keep the bulls from busting through overhead resistance as well... at least until traders come back and add more volume.

This move down this morning is also making a nice "inverted head and shoulders" pattern which could push prices up to the rising blue trendline and/or the falling green trendline... both pointing to around 2770 currently. This move could start today or tomorrow but I don't see the 2740 zone broken until after the 4th of July when we see a little more volume, like this Thursday or Friday. Today the Fed's are their reverse QT, where they are selling like 18 Billion into the market starting around 1pm EST I believe.

I could be wrong on the number but the bottom line is that this selling could keep any bounces to a minimum in the market until it's finished. That's why I'm leaning more toward tomorrow starting the move up instead of today. As for tomorrow I may or may not do a post? Not sure yet? I'll just play it by ear so to speak and if I think there needs to be another update I'll do one. But if we find a bottom today and put in some positive divergence then that sets up tomorrow to start a move up. So just look for that to happen on the 60 minute chart and you'll have your answer on what to expect next. Naturally they'll be no post on Wednesday.

ES Morning Update June 28th 2018

0


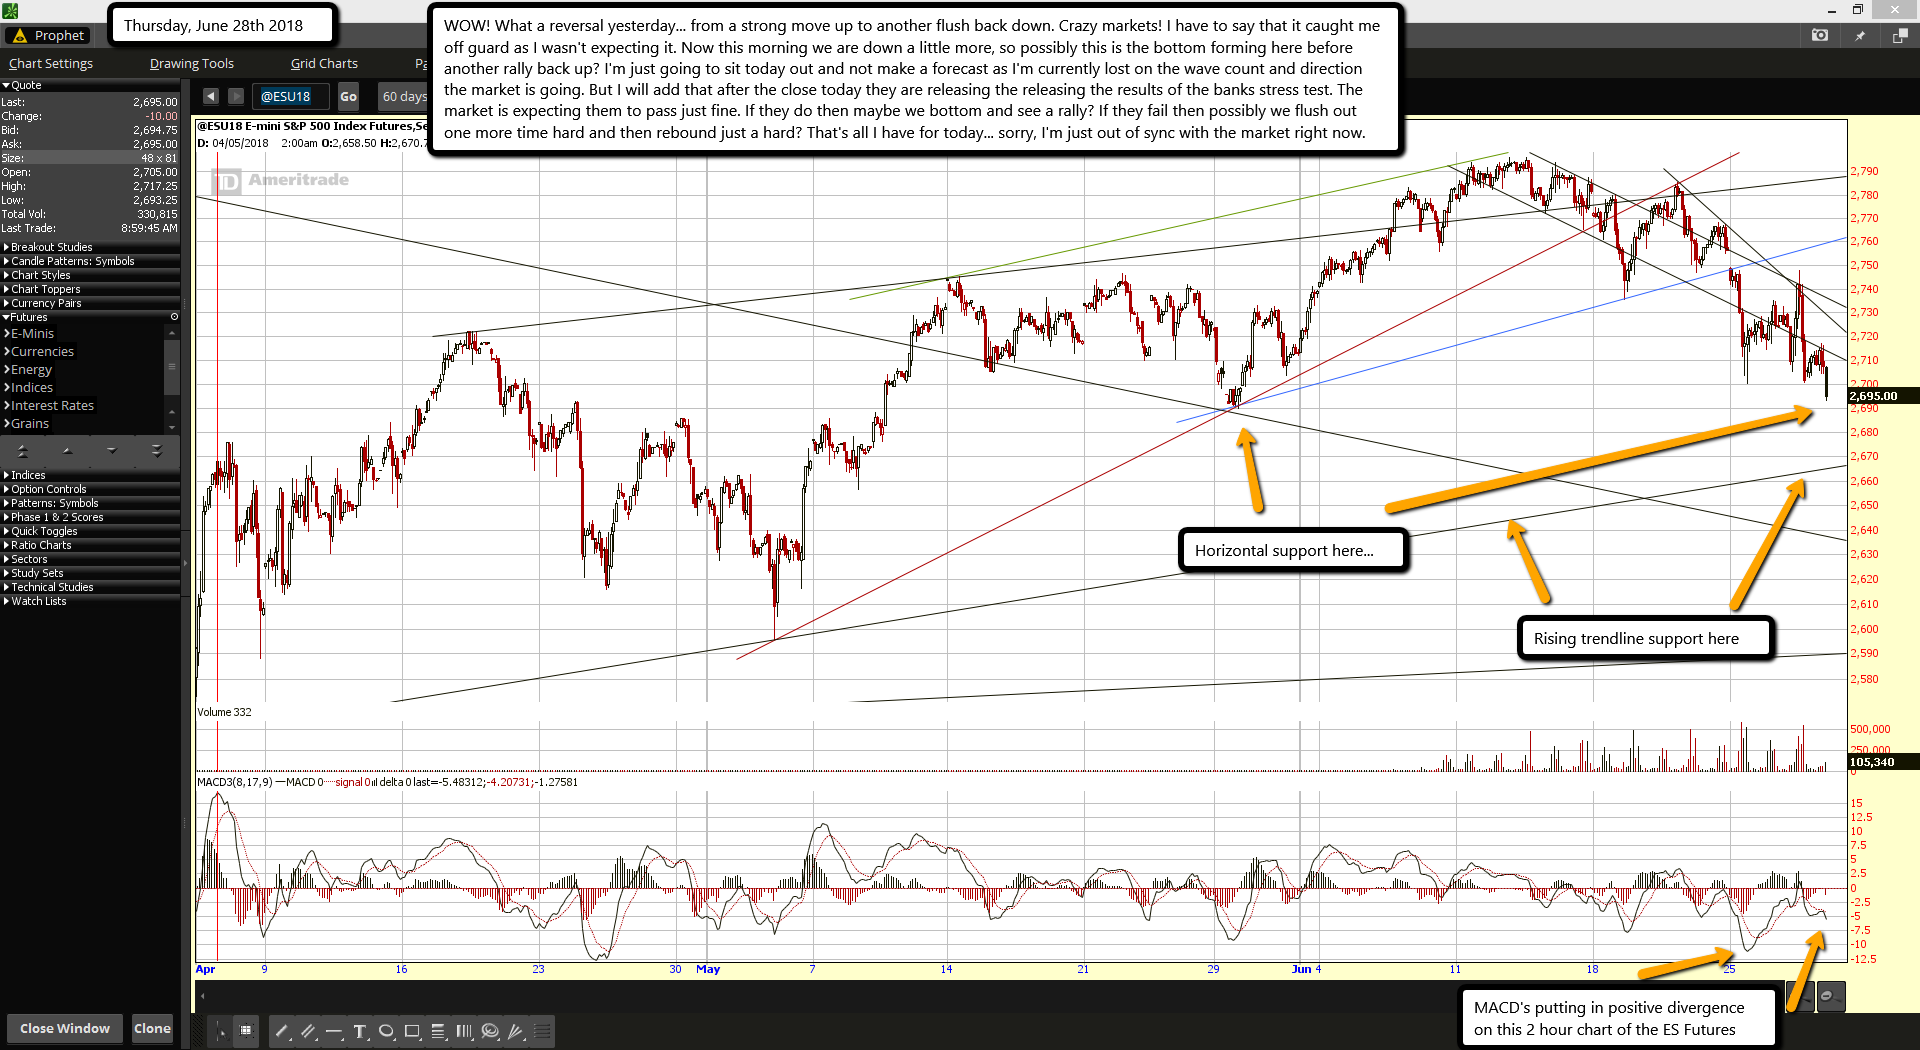
WOW! What a reversal yesterday... from a strong move up to another flush back down. Crazy markets! I have to say that it caught me off guard as I wasn't expecting it. Now this morning we are down a little more, so possibly this is the bottom forming here before another rally back up? I'm just going to sit today out and not make a forecast as I'm currently lost on the wave count and direction the market is going. But I will add that after the close today they are releasing the releasing the results of the banks stress test. The market is expecting them to pass just fine. If they do then maybe we bottom and see a rally? If they fail then possibly we flush out one more time hard and then rebound just a hard? That's all I have for today... sorry, I'm just out of sync with the market right now.

ES Morning Update June 27th 2018

0


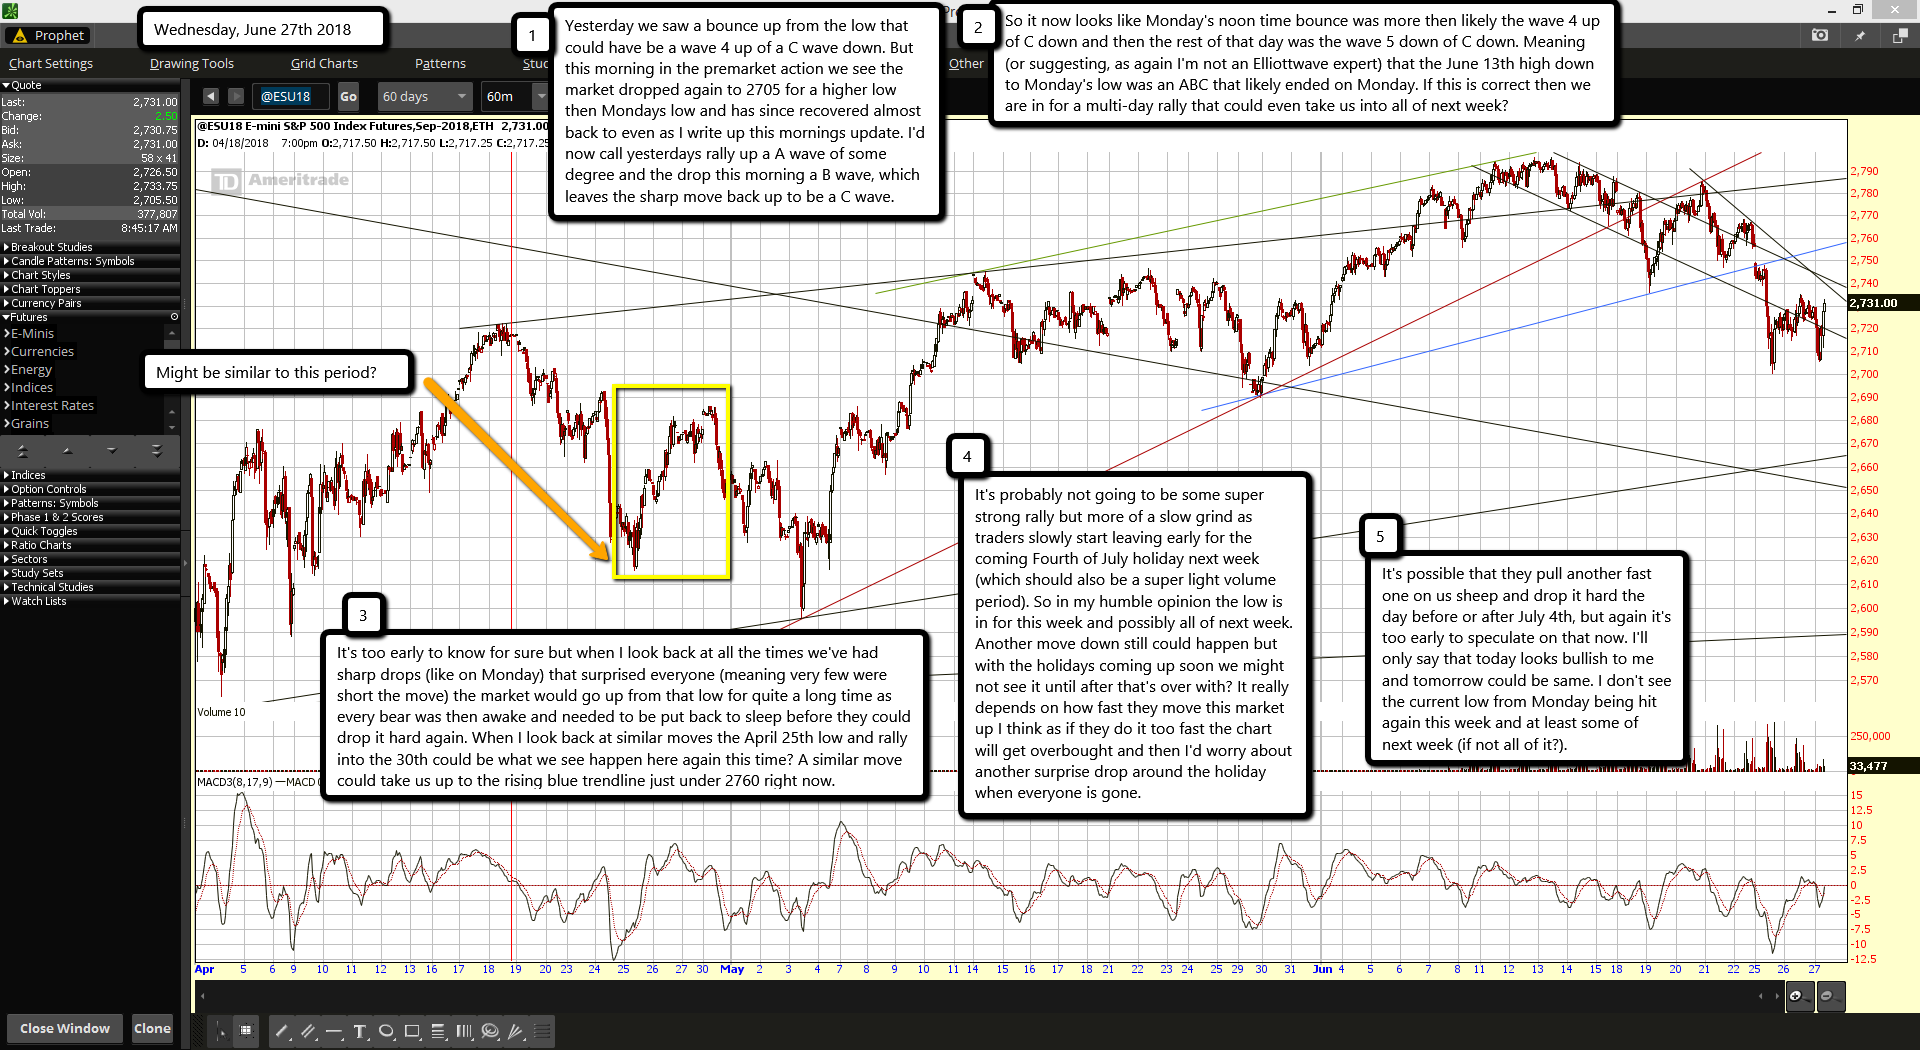
Yesterday we saw a bounce up from the low that could have be a wave 4 up of a C wave down. But this morning in the premarket action we see the market dropped again to 2705 for a higher low then Mondays low and has since recovered almost back to even as I write up this mornings update. I'd now call yesterdays rally up a A wave of some degree and the drop this morning a B wave, which leaves the sharp move back up to be a C wave.

So it now looks like Monday's noon time bounce was more then likely the wave 4 up of C down and then the rest of that day was the wave 5 down of C down. Meaning (or suggesting, as again I'm not an Elliottwave expert) that the June 13th high down to Monday's low was an ABC that likely ended on Monday. If this is correct then we are in for a multi-day rally that could even take us into all of next week?

It's too early to know for sure but when I look back at all the times we've had sharp drops (like on Monday) that surprised everyone (meaning very few were short the move) the market would go up from that low for quite a long time as every bear was then awake and needed to be put back to sleep before they could drop it hard again. When I look back at similar moves the April 25th low and rally into the 30th could be what we see happen here again this time? A similar move could take us up to the rising blue trendline just under 2760 right now.

It's probably not going to be some super strong rally but more of a slow grind as traders slowly start leaving early for the coming Fourth of July holiday next week (which should also be a super light volume period). So in my humble opinion the low is in for this week and possibly all of next week. Another move down still could happen but with the holidays coming up soon we might not see it until after that's over with? It really depends on how fast they move this market up I think as if they do it too fast the chart will get overbought and then I'd worry about another surprise drop around the holiday when everyone is gone.

It's possible that they pull another fast one on us sheep and drop it hard the day before or after July 4th, but again it's too early to speculate on that now. I'll only say that today looks bullish to me and tomorrow could be same. I don't see the current low from Monday being hit again this week and at least some of next week (if not all of it?).

ES Morning Update June 26th 2018

0


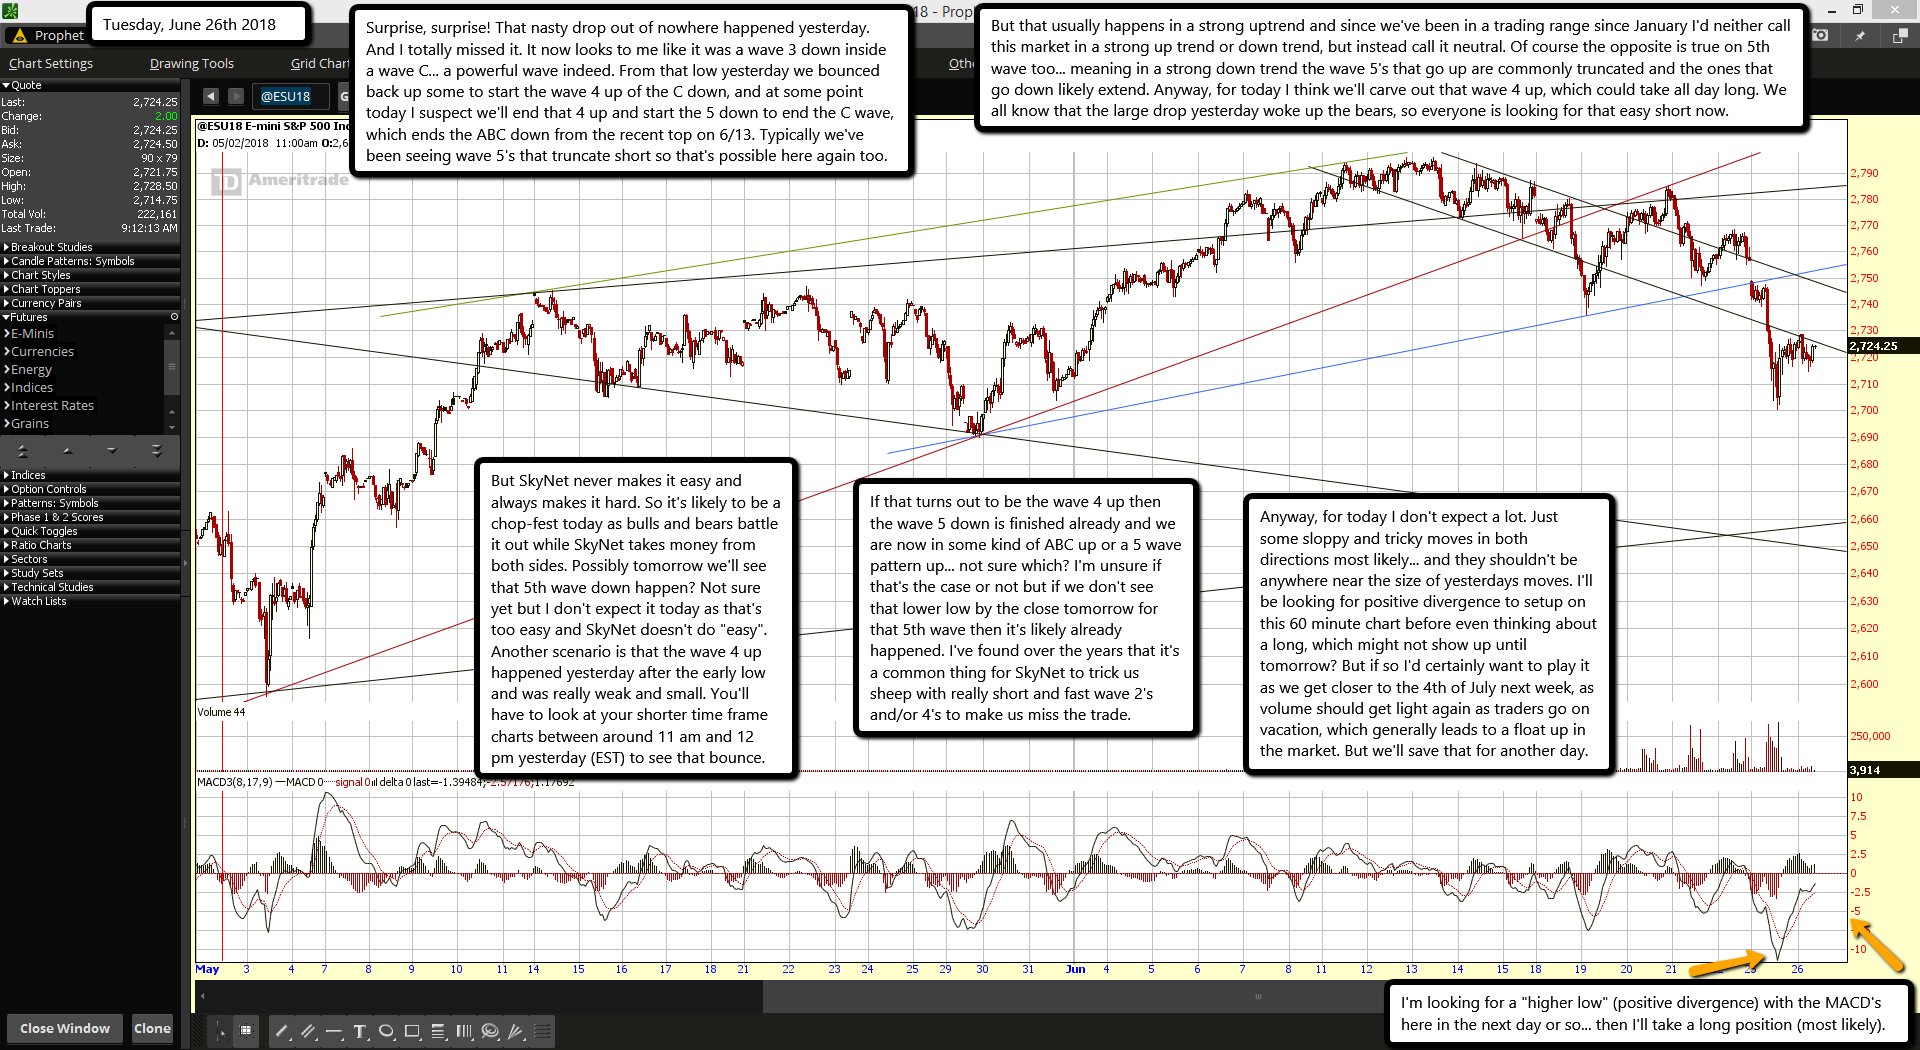
Surprise, surprise! That nasty drop out of nowhere happened yesterday. And I totally missed it. It now looks to me like it was a wave 3 down inside a wave C... a powerful wave indeed. From that low yesterday we bounced back up some to start the wave 4 up of the C down, and at some point today I suspect we'll end that 4 up and start the 5 down to end the C wave, which ends the ABC down from the recent top on 6/13. Typically we've been seeing wave 5's that truncate short so that's possible here again too.

But that usually happens in a strong uptrend and since we've been in a trading range since January I'd neither call this market in a strong up trend or down trend, but instead call it neutral. Of course the opposite is true on 5th wave too... meaning in a strong down trend the wave 5's that go up are commonly truncated and the ones that go down likely extend. Anyway, for today I think we'll carve out that wave 4 up, which could take all day long. We all know that the large drop yesterday woke up the bears, so everyone is looking for that easy short now.

But SkyNet never makes it easy and always makes it hard. So it's likely to be a chop-fest today as bulls and bears battle it out while SkyNet takes money from both sides. Possibly tomorrow we'll see that 5th wave down happen? Not sure yet but I don't expect it today as that's too easy and SkyNet doesn't do "easy". Another scenario is that the wave 4 up happened yesterday after the early low and was really weak and small. You'll have to look at your shorter time frame charts between around 11 am and 12 pm yesterday (EST) to see that bounce.

If that turns out to be the wave 4 up then the wave 5 down is finished already and we are now in some kind of ABC up or a 5 wave pattern up... not sure which? I'm unsure if that's the case or not but if we don't see that lower low by the close tomorrow for that 5th wave then it's likely already happened. I've found over the years that it's a common thing for SkyNet to trick us sheep with really short and fast wave 2's and/or 4's to make us miss the trade.

Anyway, for today I don't expect a lot. Just some sloppy and tricky moves in both directions most likely... and they shouldn't be anywhere near the size of yesterdays moves. I'll be looking for positive divergence to setup on this 60 minute chart before even thinking about a long, which might not show up until tomorrow? But if so I'd certainly want to play it as we get closer to the 4th of July next week, as volume should get light again as traders go on vacation, which generally leads to a float up in the market. But we'll save that for another day.

ES Morning Update June 25th 2018

0


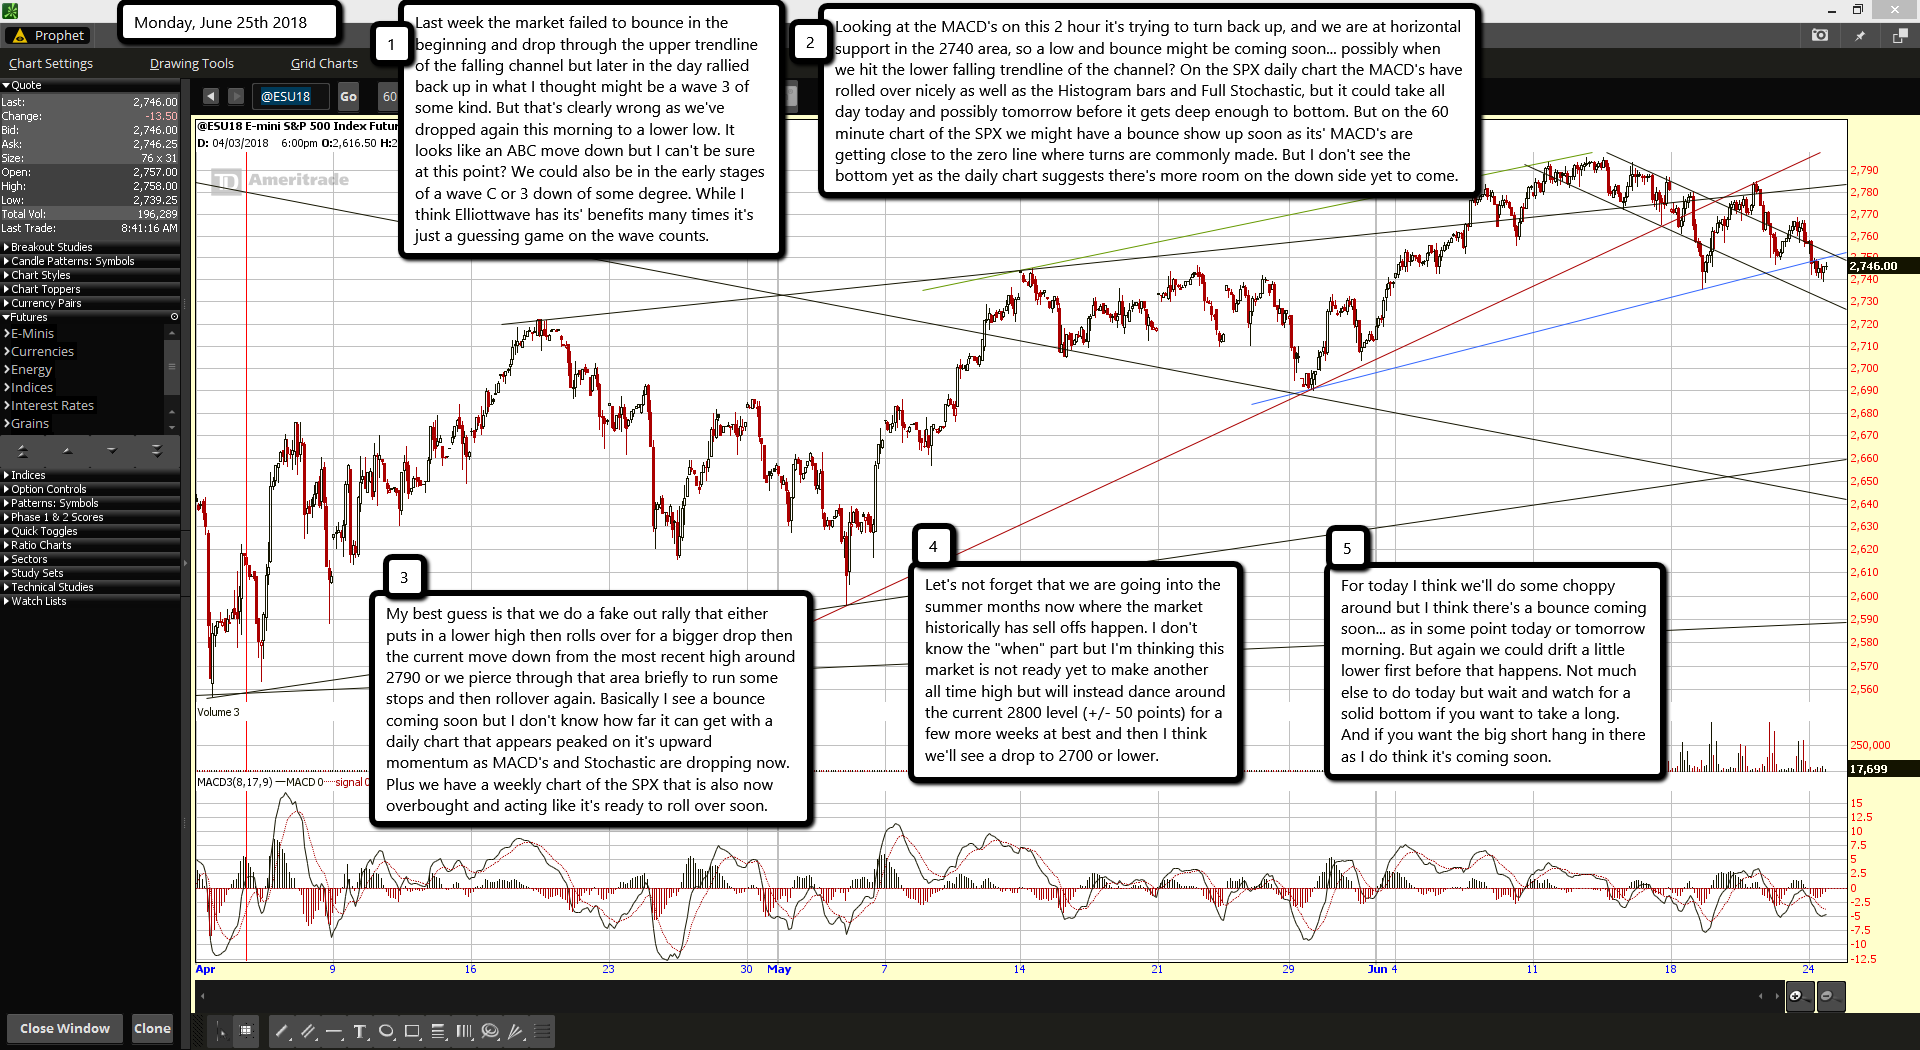
Last week the market failed to bounce in the beginning and drop through the upper trendline of the falling channel but later in the day rallied back up in what I thought might be a wave 3 of some kind. But that's clearly wrong as we've dropped again this morning to a lower low. It looks like an ABC move down but I can't be sure at this point? We could also be in the early stages of a wave C or 3 down of some degree. While I think Elliottwave has its' benefits many times it's just a guessing game on the wave counts.

Looking at the MACD's on this 2 hour it's trying to turn back up, and we are at horizontal support in the 2740 area, so a low and bounce might be coming soon... possibly when we hit the lower falling trendline of the channel? On the SPX daily chart the MACD's have rolled over nicely as well as the Histogram bars and Full Stochastic, but it could take all day today and possibly tomorrow before it gets deep enough to bottom. But on the 60 minute chart of the SPX we might have a bounce show up soon as its' MACD's are getting close to the zero line where turns are commonly made. But I don't see the bottom yet as the daily chart suggests there's more room on the down side yet to come.

My best guess is that we do a fake out rally that either puts in a lower high then rolls over for a bigger drop then the current move down from the most recent high around 2790 or we pierce through that area briefly to run some stops and then rollover again. Basically I see a bounce coming soon but I don't know how far it can get with a daily chart that appears peaked on it's upward momentum as MACD's and Stochastic are dropping now. Plus we have a weekly chart of the SPX that is also now overbought and acting like it's ready to roll over soon.

Let's not forget that we are going into the summer months now where the market historically has sell offs happen. I don't know the "when" part but I'm thinking this market is not ready yet to make another all time high but will instead dance around the current 2800 level (+/- 50 points) for a few more weeks at best and then I think we'll see a drop to 2700 or lower.

For today I think we'll do some choppy around but I think there's a bounce coming soon... as in some point today or tomorrow morning. But again we could drift a little lower first before that happens. Not much else to do today but wait and watch for a solid bottom if you want to take a long. And if you want the big short hang in there as I do think it's coming soon.

ES Morning Update June 22nd 2018

0


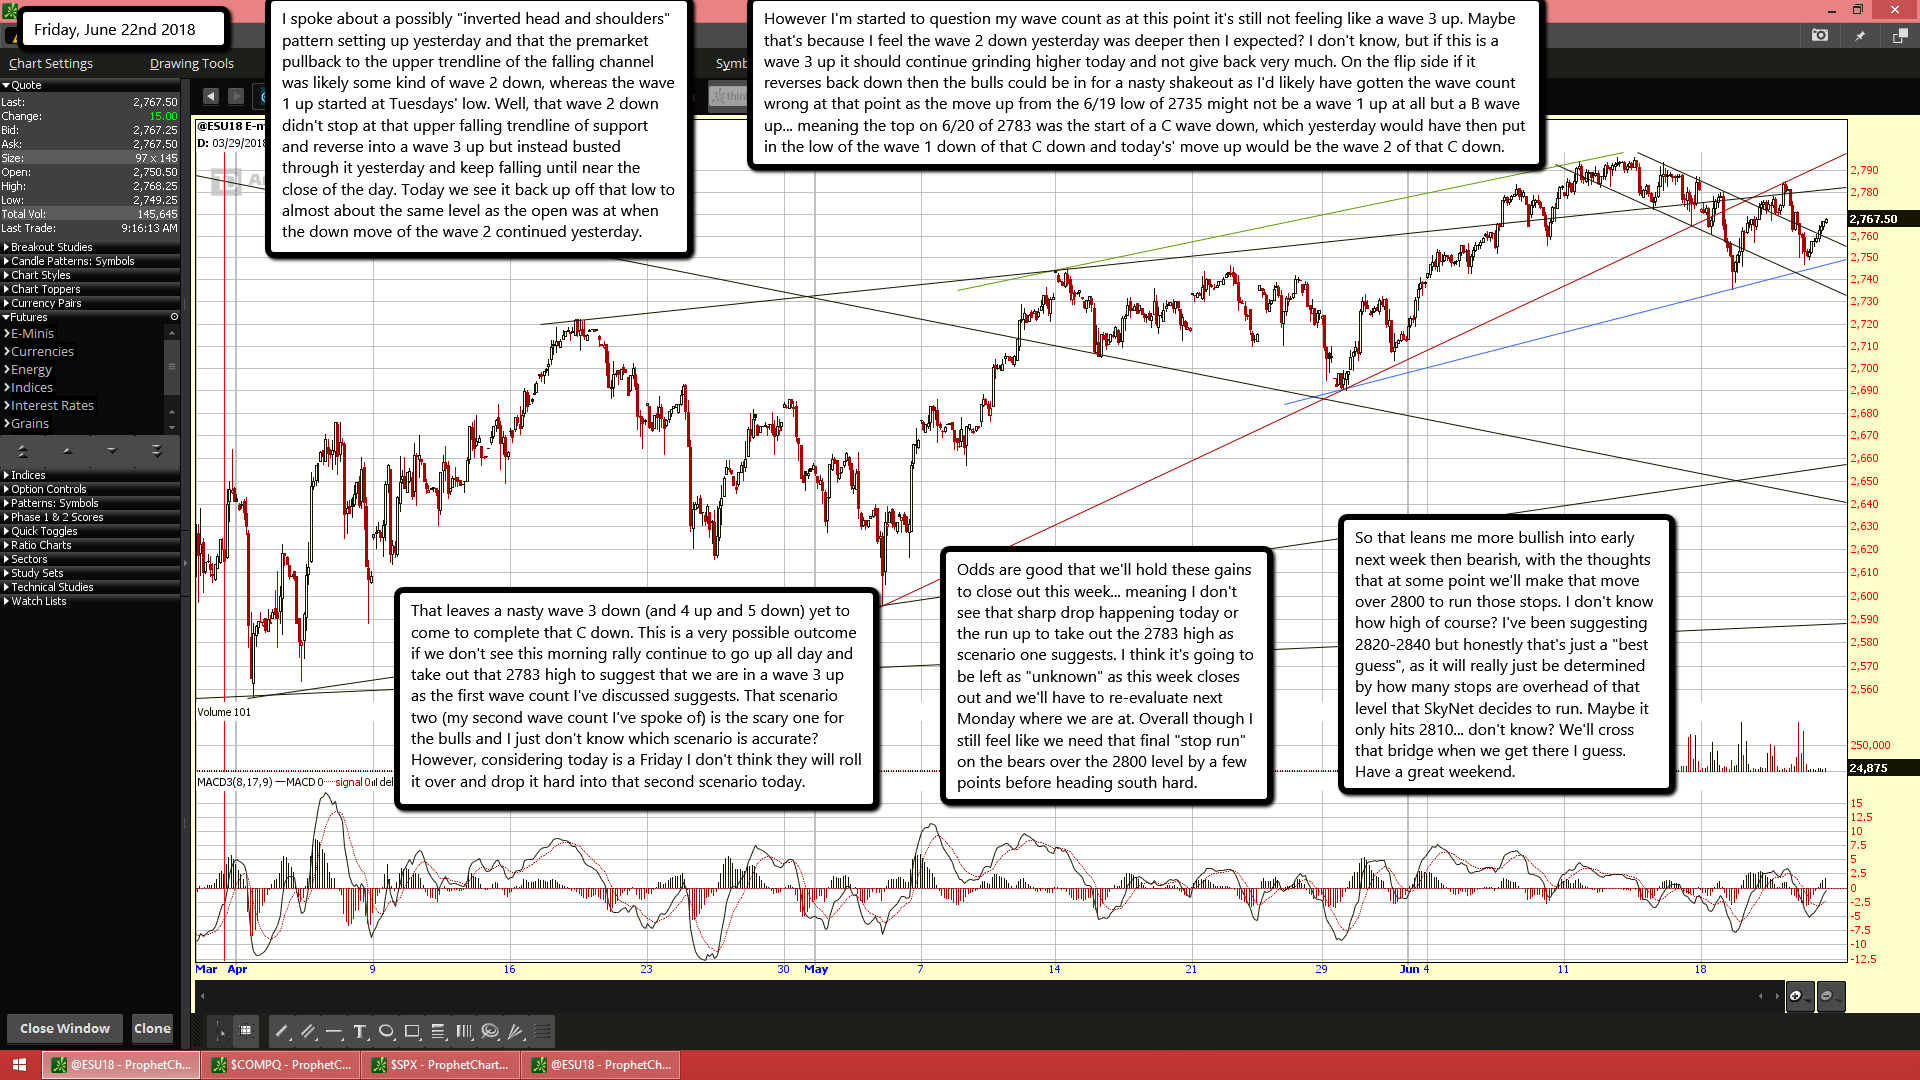
I spoke about a possibly "inverted head and shoulders" pattern setting up yesterday and that the premarket pullback to the upper trendline of the falling channel was likely some kind of wave 2 down, whereas the wave 1 up started at Tuesdays' low. Well, that wave 2 down didn't stop at that upper falling trendline of support and reverse into a wave 3 up but instead busted through it yesterday and keep falling until near the close of the day. Today we see it back up off that low to almost about the same level as the open was at when the down move of the wave 2 continued yesterday.

However I'm started to question my wave count as at this point it's still not feeling like a wave 3 up. Maybe that's because I feel the wave 2 down yesterday was deeper then I expected? I don't know, but if this is a wave 3 up it should continue grinding higher today and not give back very much. On the flip side if it reverses back down then the bulls could be in for a nasty shakeout as I'd likely have gotten the wave count wrong at that point as the move up from the 6/19 low of 2735 might not be a wave 1 up at all but a B wave up... meaning the top on 6/20 of 2783 was the start of a C wave down, which yesterday would have then put in the low of the wave 1 down of that C down and today's' move up would be the wave 2 of that C down.

That leaves a nasty wave 3 down (and 4 up and 5 down) yet to come to complete that C down. This is a very possible outcome if we don't see this morning rally continue to go up all day and take out that 2783 high to suggest that we are in a wave 3 up as the first wave count I've discussed suggests. That scenario two (my second wave count I've spoke of) is the scary one for the bulls and I just don't know which scenario is accurate? However, considering today is a Friday I don't think they will roll it over and drop it hard into that second scenario today.

Odds are good that we'll hold these gains to close out this week... meaning I don't see that sharp drop happening today or the run up to take out the 2783 high as scenario one suggests. I think it's going to be left as "unknown" as this week closes out and we'll have to re-evaluate next Monday where we are at. Overall though I still feel like we need that final "stop run" on the bears over the 2800 level by a few points before heading south hard.

So that leans me more bullish into early next week then bearish, with the thoughts that at some point we'll make that move over 2800 to run those stops. I don't know how high of course? I've been suggesting 2820-2840 but honestly that's just a "best guess", as it will really just be determined by how many stops are overhead of that level that SkyNet decides to run. Maybe it only hits 2810... don't know? We'll cross that bridge when we get there I guess. Have a great weekend.

ES Morning Update June 21st 2018

0


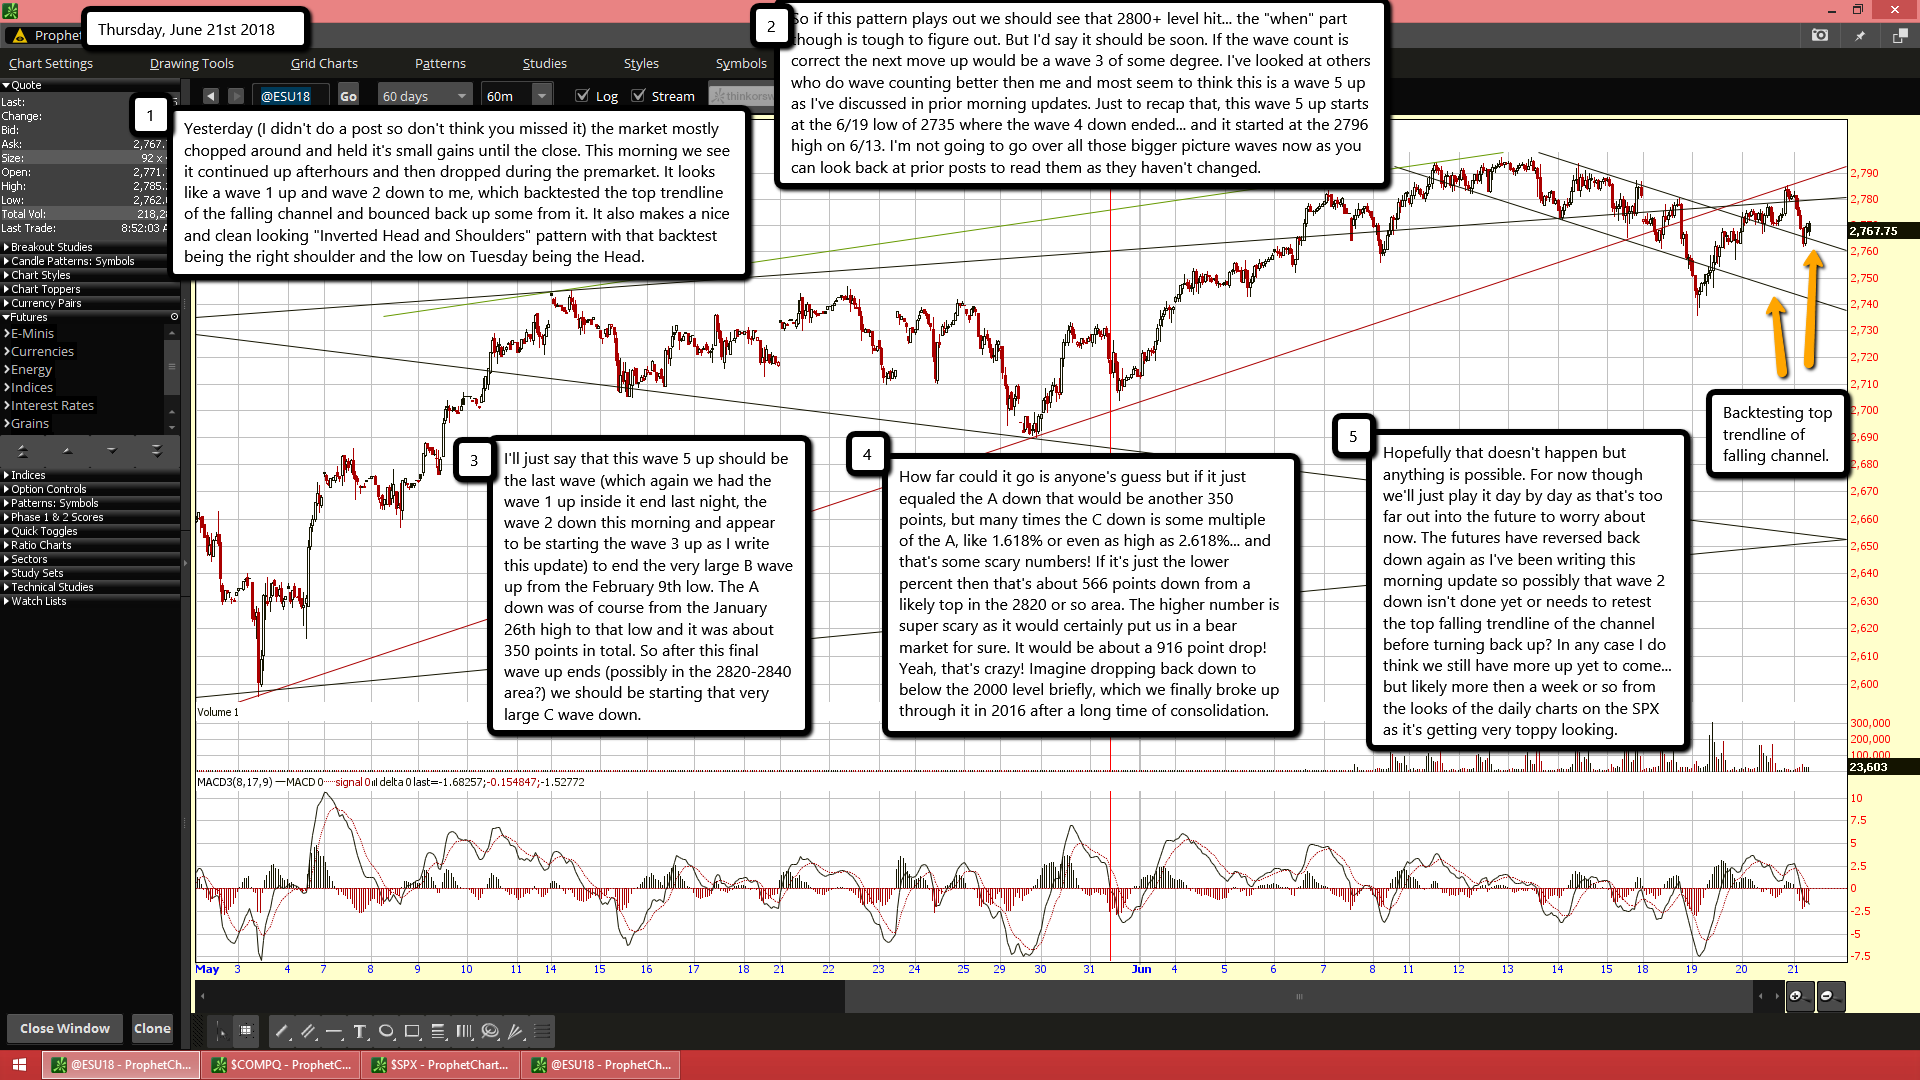
Yesterday (I didn't do a post so don't think you missed it) the market mostly chopped around and held it's small gains until the close. This morning we see it continued up afterhours and then dropped during the premarket. It looks like a wave 1 up and wave 2 down to me, which backtested the top trendline of the falling channel and bounced back up some from it. It also makes a nice and clean looking "Inverted Head and Shoulders" pattern with that backtest being the right shoulder and the low on Tuesday being the Head.

So if this pattern plays out we should see that 2800+ level hit... the "when" part though is tough to figure out. But I'd say it should be soon. If the wave count is correct the next move up would be a wave 3 of some degree. I've looked at others who do wave counting better then me and most seem to think this is a wave 5 up as I've discussed in prior morning updates. Just to recap that, this wave 5 up starts at the 6/19 low of 2735 where the wave 4 down ended... and it started at the 2796 high on 6/13. I'm not going to go over all those bigger picture waves now as you can look back at prior posts to read them as they haven't changed.

I'll just say that this wave 5 up should be the last wave (which again we had the wave 1 up inside it end last night, the wave 2 down this morning and appear to be starting the wave 3 up as I write this update) to end the very large B wave up from the February 9th low. The A down was of course from the January 26th high to that low and it was about 350 points in total. So after this final wave up ends (possibly in the 2820-2840 area?) we should be starting that very large C wave down.

How far could it go is anyone's guess but if it just equaled the A down that would be another 350 points, but many times the C down is some multiple of the A, like 1.618% or even as high as 2.618%... and that's some scary numbers! If it's just the lower percent then that's about 566 points down from a likely top in the 2820 or so area. The higher number is super scary as it would certainly put us in a bear market for sure. It would be about a 916 point drop! Yeah, that's crazy! Imagine dropping back down to below the 2000 level briefly, which we finally broke up through it in 2016 after a long time of consolidation.

Hopefully that doesn't happen but anything is possible. For now though we'll just play it day by day as that's too far out into the future to worry about now. The futures have reversed back down again as I've been writing this morning update so possibly that wave 2 down isn't done yet or needs to retest the top falling trendline of the channel before turning back up? In any case I do think we still have more up yet to come... but likely more then a week or so from the looks of the daily charts on the SPX as it's getting very toppy looking.

ES Morning Update June 19th 2018

0

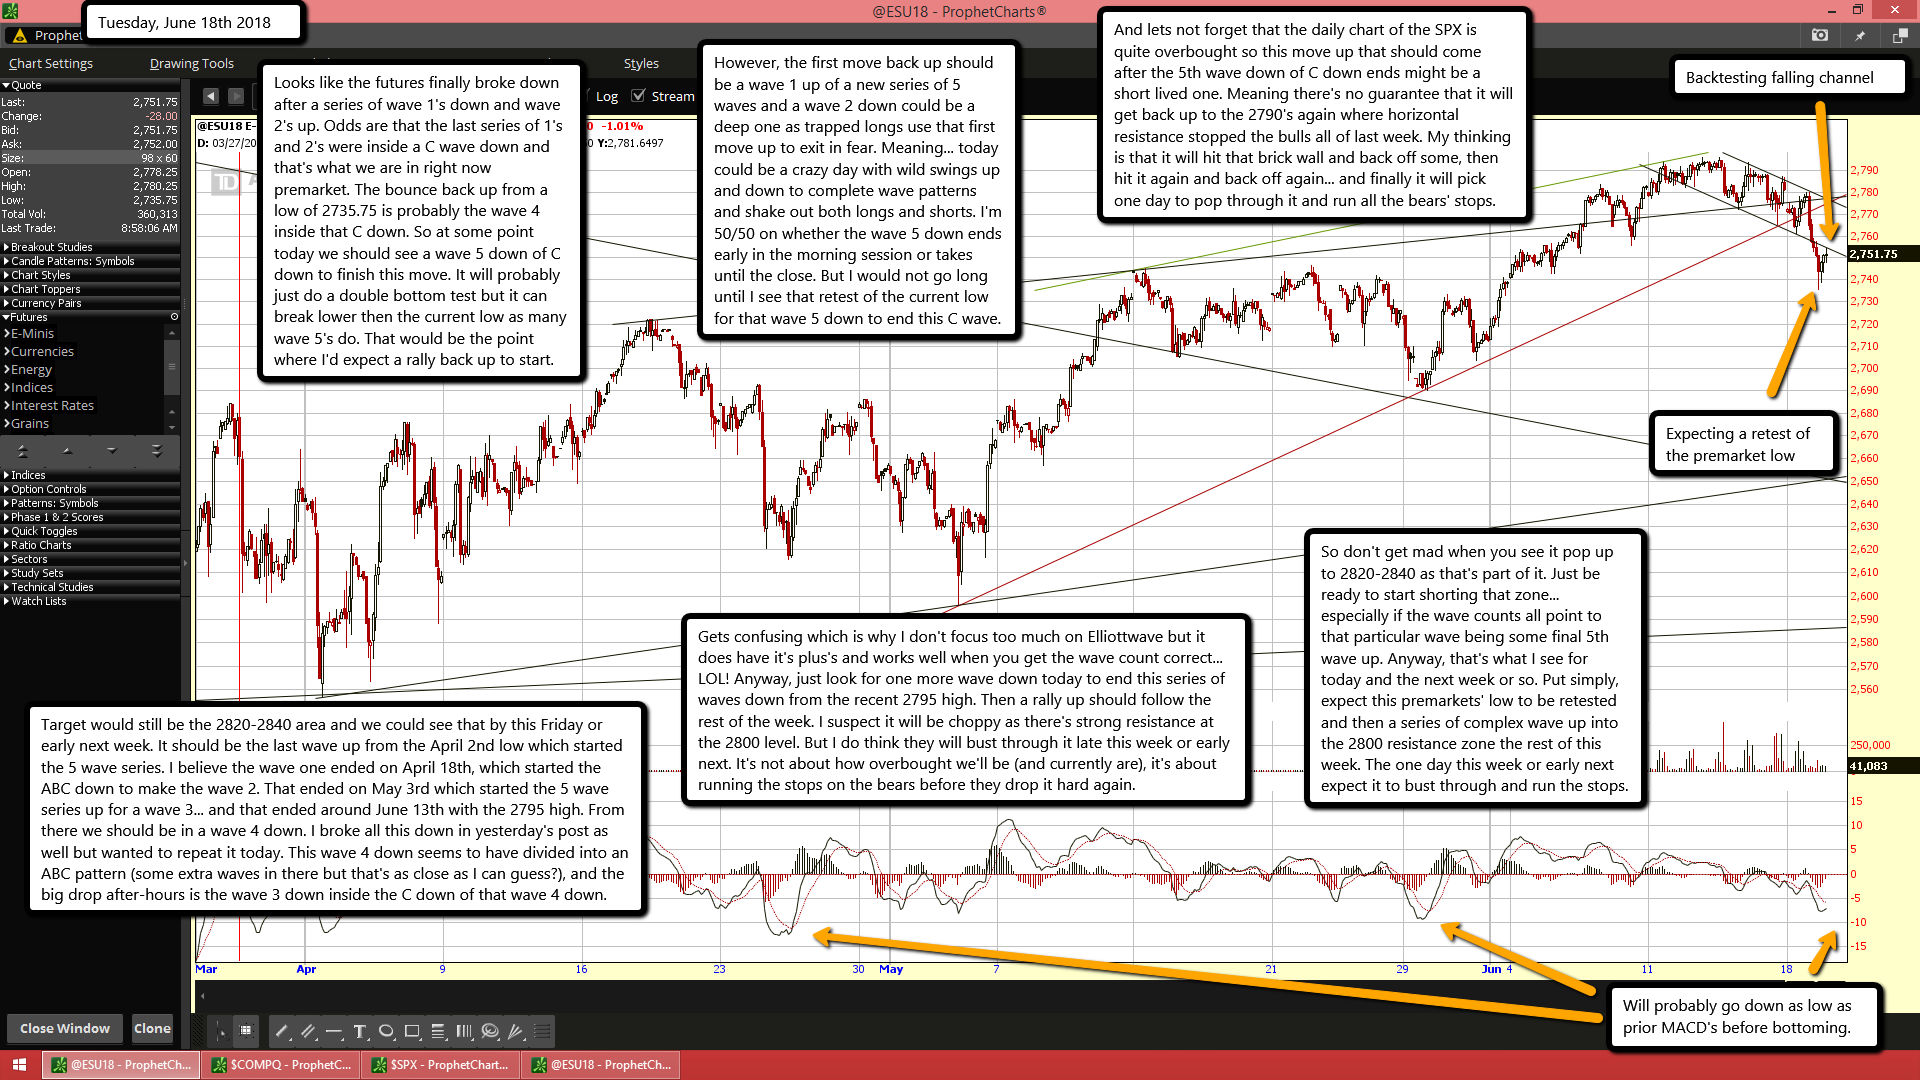
Looks like the futures finally broke down after a series of wave 1's down and wave 2's up. Odds are that the last series of 1's and 2's were inside a C wave down and that's what we are in right now premarket. The bounce back up from a low of 2735.75 is probably the wave 4 inside that C down. So at some point today we should see a wave 5 down of C down to finish this move. It will probably just do a double bottom test but it can break lower then the current low as many wave 5's do. That would be the point where I'd expect a rally back up to start.

However, the first move back up should be a wave 1 up of a new series of 5 waves and a wave 2 down could be a deep one as trapped longs use that first move up to exit in fear. Meaning... today could be a crazy day with wild swings up and down to complete wave patterns and shake out both longs and shorts. I'm 50/50 on whether the wave 5 down ends early in the morning session or takes until the close. But I would not go long until I see that retest of the current low for that wave 5 down to end this C wave.

And lets not forget that the daily chart of the SPX is quite overbought so this move up that should come after the 5th wave down of C down ends might be a short lived one. Meaning there's no guarantee that it will get back up to the 2790's again where horizontal resistance stopped the bulls all of last week. My thinking is that it will hit that brick wall and back off some, then hit it again and back off again... and finally it will pick one day to pop through it and run all the bears' stops.

Target would still be the 2820-2840 area and we could see that by this Friday or early next week. It should be the last wave up from the April 2nd low which started the 5 wave series. I believe the wave one ended on April 18th, which started the ABC down to make the wave 2. That ended on May 3rd which started the 5 wave series up for a wave 3... and that ended around June 13th with the 2795 high. From there we should be in a wave 4 down. I broke all this down in yesterday's post as well but wanted to repeat it today. This wave 4 down seems to have divided into an ABC pattern (some extra waves in there but that's as close as I can guess?), and the big drop after-hours is the wave 3 down inside the C down of that wave 4 down.

Gets confusing which is why I don't focus too much on Elliottwave but it does have it's plus's and works well when you get the wave count correct... LOL! Anyway, just look for one more wave down today to end this series of waves down from the recent 2795 high. Then a rally up should follow the rest of the week. I suspect it will be choppy as there's strong resistance at the 2800 level. But I do think they will bust through it late this week or early next. It's not about how overbought we'll be (and currently are), it's about running the stops on the bears before they drop it hard again.

So don't get mad when you see it pop up to 2820-2840 as that's part of it. Just be ready to start shorting that zone... especially if the wave counts all point to that particular wave being some final 5th wave up. Anyway, that's what I see for today and the next week or so. Put simply, expect this premarkets' low to be retested and then a series of complex wave up into the 2800 resistance zone the rest of this week. The one day this week or early next expect it to bust through and run the stops.

ES Morning Update June 18th 2018

0


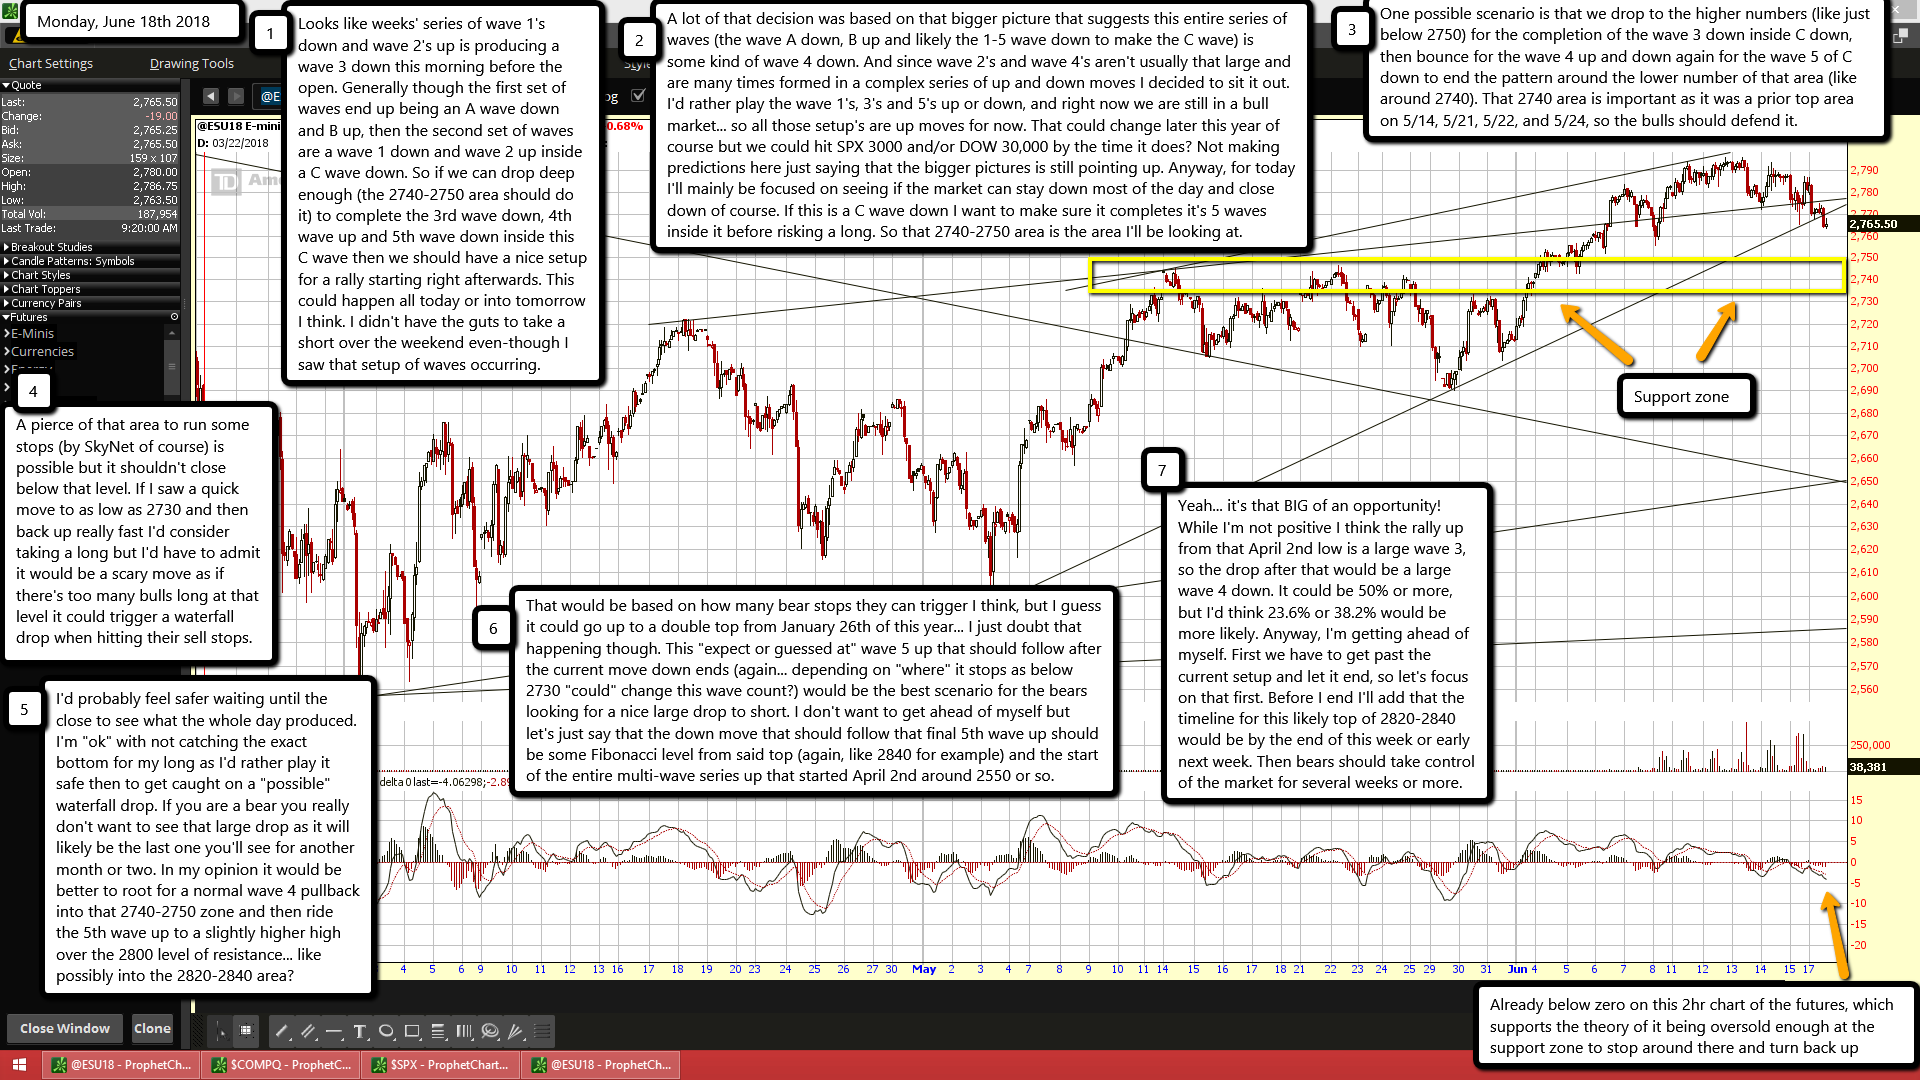
Looks like weeks' series of wave 1's down and wave 2's up is producing a wave 3 down this morning before the open. Generally though the first set of waves end up being an A wave down and B up, then the second set of waves are a wave 1 down and wave 2 up inside a C wave down. So if we can drop deep enough (the 2740-2750 area should do it) to complete the 3rd wave down, 4th wave up and 5th wave down inside this C wave then we should have a nice setup for a rally starting right afterwards. This could happen all today or into tomorrow I think. I didn't have the guts to take a short over the weekend even-though I saw that setup of waves occurring.

A lot of that decision was based on that bigger picture that suggests this entire series of waves (the wave A down, B up and likely the 1-5 wave down to make the C wave) is some kind of wave 4 down. And since wave 2's and wave 4's aren't usually that large and are many times formed in a complex series of up and down moves I decided to sit it out. I'd rather play the wave 1's, 3's and 5's up or down, and right now we are still in a bull market... so all those setup's are up moves for now. That could change later this year of course but we could hit SPX 3000 and/or DOW 30,000 by the time it does? Not making predictions here just saying that the bigger pictures is still pointing up. Anyway, for today I'll mainly be focused on seeing if the market can stay down most of the day and close down of course. If this is a C wave down I want to make sure it completes it's 5 waves inside it before risking a long. So that 2740-2750 area is the area I'll be looking at.

One possible scenario is that we drop to the higher numbers (like just below 2750) for the completion of the wave 3 down inside C down, then bounce for the wave 4 up and down again for the wave 5 of C down to end the pattern around the lower number of that area (like around 2740). That 2740 area is important as it was a prior top area on 5/14, 5/21, 5/22, and 5/24, so the bulls should defend it.

A pierce of that area to run some stops (by SkyNet of course) is possible but it shouldn't close below that level. If I saw a quick move to as low as 2730 and then back up really fast I'd consider taking a long but I'd have to admit it would be a scary move as if there's too many bulls long at that level it could trigger a waterfall drop when hitting their sell stops.

I'd probably feel safer waiting until the close to see what the whole day produced. I'm "ok" with not catching the exact bottom for my long as I'd rather play it safe then to get caught on a "possible" waterfall drop. If you are a bear you really don't want to see that large drop as it will likely be the last one you'll see for another month or two. In my opinion it would be better to root for a normal wave 4 pullback into that 2740-2750 zone and then ride the 5th wave up to a slightly higher high over the 2800 level of resistance... like possibly into the 2820-2840 area?

That would be based on how many bear stops they can trigger I think, but I guess it could go up to a double top from January 26th of this year... I just doubt that happening though. This "expect or guessed at" wave 5 up that should follow after the current move down ends (again... depending on "where" it stops as below 2730 "could" change this wave count?) would be the best scenario for the bears looking for a nice large drop to short. I don't want to get ahead of myself but let's just say that the down move that should follow that final 5th wave up should be some Fibonacci level from said top (again, like 2840 for example) and the start of the entire multi-wave series up that started April 2nd around 2550 or so.

Yeah... it's that BIG of an opportunity! While I'm not positive I think the rally up from that April 2nd low is a large wave 3, so the drop after that would be a large wave 4 down. It could be 50% or more, but I'd think 23.6% or 38.2% would be more likely. Anyway, I'm getting ahead of myself. First we have to get past the current setup and let it end, so let's focus on that first. Before I end I'll add that the timeline for this likely top of 2820-2840 would be by the end of this week or early next week. Then bears should take control of the market for several weeks or more.

ES Morning Update June 15th 2018

0


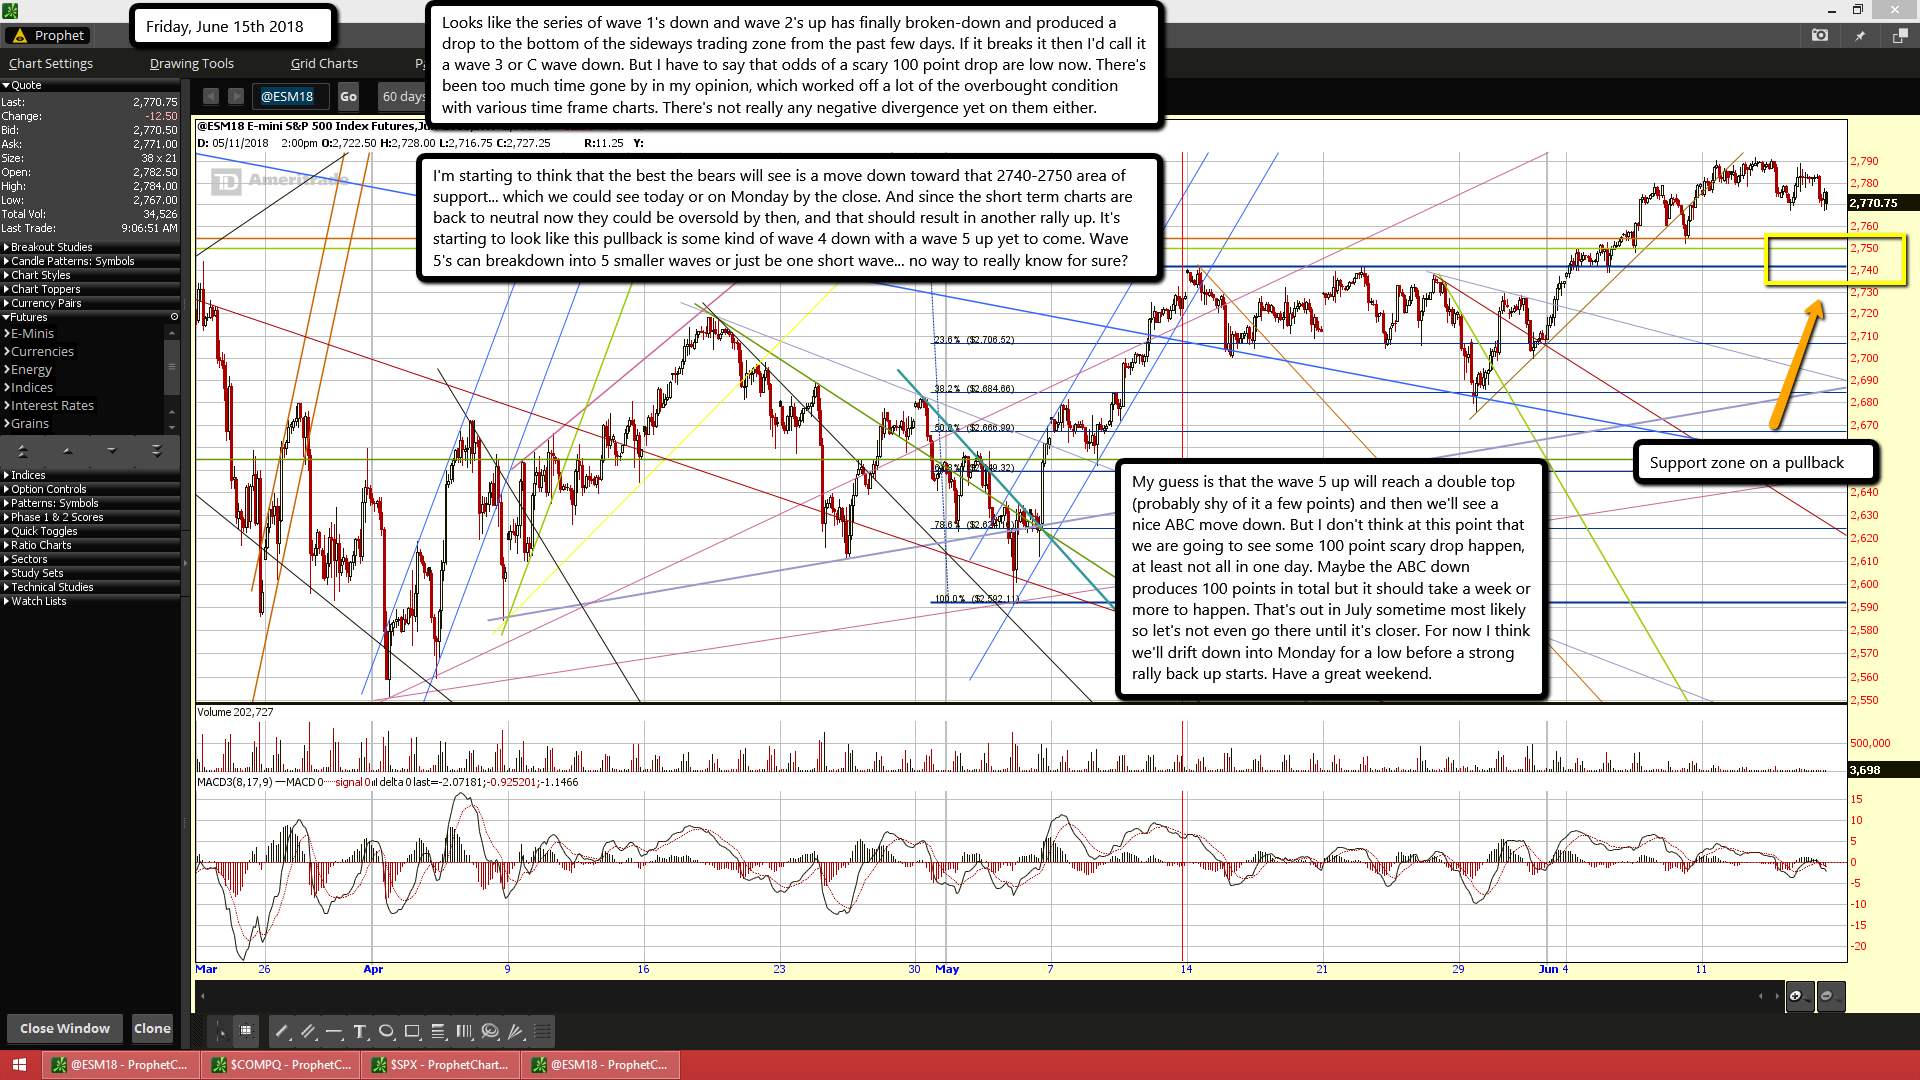
Looks like the series of wave 1's down and wave 2's up has finally broken-down and produced a drop to the bottom of the sideways trading zone from the past few days. If it breaks it then I'd call it a wave 3 or C wave down. But I have to say that odds of a scary 100 point drop are low now. There's been too much time gone by in my opinion, which worked off a lot of the overbought condition with various time frame charts. There's not really any negative divergence yet on them either.

I'm starting to think that the best the bears will see is a move down toward that 2740-2750 area of support... which we could see today or on Monday by the close. And since the short term charts are back to neutral now they could be oversold by then, and that should result in another rally up. It's starting to look like this pullback is some kind of wave 4 down with a wave 5 up yet to come. Wave 5's can breakdown into 5 smaller waves or just be one short wave... no way to really know for sure?

My guess is that the wave 5 up will reach a double top (probably shy of it a few points) and then we'll see a nice ABC move down. But I don't think at this point that we are going to see some 100 point scary drop happen, at least not all in one day. Maybe the ABC down produces 100 points in total but it should take a week or more to happen. That's out in July sometime most likely so let's not even go there until it's closer. For now I think we'll drift down into Monday for a low before a strong rally back up starts. Have a great weekend.

ES Morning Update June 14th 2018

0


The action yesterday after the FOMC meeting was kinda muted if you ask me. But then again we haven't seen any wild swing days in a long time, so I guess that was to be expected. The 2790 area seems to be holding the bulls back for now but I don't know how long this can continue? If the bulls were smart they would allow 3-4 days in a row of red closes to get the charts back to neutral or oversold (depends on how deep the pullbacks are?) where they could make another run up higher with strength.

They look tired to me right now as the volume is very weak. They need bears to squeeze and I have to say that it's not looking like there's very many bears out there with short positions on... otherwise the bulls could have squeezed through 2790 hard and fast. My guess is that bears are waiting at 2800 to short or have already done so with just a few points over that area as their stops. That does help the bulls as if they can get past the 2790 they can't reach those stops to run them.

There was a small move down into the close yesterday, which continued into afterhours, but this premarket it has reversed back up again. If the market can carve out a series of these wave 1's down and wave 2's up and not breakthrough that 2790 cleanly (a pierce would be OK but it shouldn't be high enough to run those stops just a little over 2800), then at some point we should see a breakdown for a wave 3 of some degree. It doesn't look like it's going to happen today so I'm still neutral at this point. Like I said, a slow drift down into that 2740-2750 for 3-4 days could reset the charts back to neutral and the bulls could make another run up higher. But we'd need to close red for those 3-4 days too as that skews the odds that the next day will close green.

Closing red one day, green the next, back to red and green again would just be neutral as it would be considered chop. However, if those days setup a nice series of 1 and 2 wave (again, without taking out 2790 by more then a pierce) then we might see a large wave 3 down appear. It could also be a wave C, it will depend on whether the market takes a 5 wave series down or 3 wave series? I can't know that until afterwards. Regardless of which it's common for the wave 3 or C to subdivide into 5 waves and I'll be looking to catch the 3 of that wave.

Anyway, that's what I'm looking for to setup over the next few days. Maybe it happens by tomorrow or maybe Monday but a breakout or breakdown is coming soon. Which I don't know but I'm leaning bearish versus bullish but I won't hesitate to go long if that's the setup we get in the next few days. A move down into that 2740-2750 area would support a wave count suggesting the move up from the 2676 low on 5/29 to the high yesterday was a wave 3 up and the drop into 2740 area would then be a wave 4 down. That leaves a wave 5 up to end the wave series before a nice pullback can happen.

But I'm thinking that move up from 2676 was a wave 5 that ended the whole series and is now allowing for a nice pullback to setup. Whether it's an ABC down or 5 wave series isn't important. I just want to do my best to catch the wave 3 down inside the C down (or 3 down?). That's the goal! It could turn out to be a 100 point move in total (or more?) if this is the correct wave count? Don't know as I'm not an expert at Elliottwave but I'm patient and will just take whatever the market gives me.

ES Morning Update June 13th 2018

0


Nothing to add today gang. It's all about the FOMC meeting it seems. I don't expect much movement until after the meeting is over with. I have no position currently and will look to see what happens afterwards and into the close. If we pop up and drop to put in a long topping tail I will look for an entry short. If we rally and close at the high I'll be 50/50 on what to do as it could continue into Thursday before topping out or rollover at that open the next day? Just don't know at that point.

If we drop and close low I'll likely stand pat and do nothing to see if there's a bounce on Thursday or continued selling. If continued selling then I'll have missed the short and will wait for a bottom to get a good long for the summer rally. I'm hoping for an up move followed by a pullback into the close for that topping tail candle on the daily chart. But you don't always get what you want (by the Rolling Stones... LOL).

My gut tells me we are going to push out this sell until Thursday or Friday so it doesn't look like the Fed's are the blame. Do over the weekend and open down on Monday so you can blame Trump for something he said that weekend... that's the way the media would love to spin it. But it won't be anyone's fault as it's just in the charts... a pullback is needed, and a sharp one would do the best job of setting up the next powerful rally to all time new highs. Anyway, I'll end it here as that's my thoughts for today.

ES Morning Update June 12th 2018

0


Yesterday turned out as expected... a choppy nothing day. Today could be the same, but from past times similar there's usually a drift lower on the day prior to an FOMC day, which is tomorrow. I'd be shocked if we go up much at all, but if we do go up and close green I will take my first short. There's still risk of some wild swings up and down right after the meeting around 2pm EST tomorrow so I'd be risking some squeeze up first, which could extend into Thursday, and that's why I'll inch my way into shorts if we close up today. It's been a long time since we've had an FOMC day do those wild up and down swings like they used too happen back in the early QE days, so it's not really expected this time around but you still want to be on the lookout for surprise swings both ways.

There's also the meeting with North Korea and Trump going on now and that could cause a sell off as well. I don't think an agreement being signed would cause a rally as we all know that the main stream propaganda machine hates Trump (well, at least 93% does, a record never seen before in the history of all presidents) and they view this talks as negative. So, a deal signed or not it will be pumped as bad. I can see the headlines now... "Trump can't get the deal signed" or "Trump signs the worst deal in history"! But never will they say something neutral like "Trump and Kim Jong Un fail to agree this time but plan to meet again" or "Trump and Kim Jong Un sign historic deal, how will affect everyone?".

The bottom line is simple... the media will spin anything Trump does a bad, and the market therefore will either react neutral or negative... positive is highly unlikely. We have both the FOMC meeting and the NK deal as possible reason for a market drop starting soon. Will it start Wednesday or will they push it out a day or two? I don't know but do think the market is still vulnerable for a sharp drop... at least until both events pass. Overall I'm bullish into this summer/fall as I do see higher prices with a new all time coming. But this week the bears still have a chance at a surprise attack. It should be short leaved though and a great buying opportunity.

If I miss the down move (again, they are tricky and hard too forecast accurately in advance) you can bet I won't miss the up move that will follow. It should last many weeks or months. We might not see a final top in this market until August or September. October will be the scary month to worry about. Will the controllers of the market keep it normal then so the November elections look good for Trump keeping control of both houses of Senate and Congress, or will they tank it badly so he looks bad and could lose control to the democrats?

I don't know the answer but right now they seem to like Trump and are supporting him by keeping this market up high without any crash to scare the public, who would then blame Trump even-though it wouldn't be his fault. But most sheep don't know the market is rigged and controlled by the elite behind the scenes. Presidents have zero control of it but get blamed or rewarded for it.

Clinton got rewarded for the 1992-2000 bull market but it had nothing to do with him. Anyway, I'm looking for more light volume chop today with odds of a slow drift down higher then an up move... but neither would be something I'd trade as odds aren't high enough for me to risk money on it.

But at the end of the day I'll decide on whether I want to risk a small short or not. I'll post it in the chatroom if I do? I'm a little leery of doing it on a "slightly green" close as I fear that we could see one of those wild swing days tomorrow around 2pm. I'd love to see a strong move up today that puts in a long topping tail candle by the close. But that has low odds of happening without some news event to spark it. Good Luck.

ES Morning Update June 11th 2018

0


Ok gang, I'll keep today short as I covered most everything last week. We have the FOMC meeting this Wednesday and my thoughts are a lot of chop into the meeting where afterwards we should see a breakout or breakdown. If the bulls plan on breaking out then they had better drift this market down the next two days so they can have some bears to squeeze up after the meeting.

Personally I don't think they are really to bust up higher as the market looks too overbought right now for any strong up move to last very long. Odds favor the bears from what I see in the charts right now. We should rollover after the meeting I think. But if we want to see a strong fast and scary drop we need to continue grinding higher into the meeting date.

A drift down in front of it "could" weaken any scary sell off afterwards, and if that drift is deep enough then the bulls could ram it back up on some "fake out" rally before rolling over again. I say "fake out" (as again) I just don't see a strong uptrend starting from the current overbought charts. Any move up should be short lived. The medium term (days to weeks) is bullish, the longer term (weeks to months) is bullish, but the short term (hours to days) is bearish.

We "should" get a scary drop here soon to shake out long and get everyone short so they can be squeeze up to new all time highs in the medium term. I say "should" but I'm fully aware of the extreme manipulation that goes on with the market so if we don't see that drop this week we'll know they are holding it up until enough time passes to work off the overbought charts back to neutral. At that point I'd expect to see some slow grind up for the medium term and long term as without bears to squeeze there's not likely to be many huge rally up days. It should be full of those 5, 10 and 20 point moves with sideways in between.

I personally would love to see some 100 point scary drop as the rally afterwards will be super strong and full of great "big up days" in it. But we can't control the market so we'll have to take what the controllers give us. Today should close down in the red but again, I'm not doing much until we get closer to the FOMC meeting. Give me today and tomorrow closing up and I'll be a bear into the meeting. But give me a mix of one up and one down and I'll just wait on the meeting to be over with to decide. And finally, give me two nice down days (like back to the 2740 area of support) and I'll be dipping my toes into a few longs.

ES Morning Update June 8th 2018

0

We are finally seeing some weakness this morning with yesterdays pullback continuing into this morning, breaking the rising brown trendline of support. It's rallying back up this morning trying to backtest the breakdown point from the looks of it. It's looking like a clean ABC wave 4 down from the high yesterday. So if you start at the 5/29 low of 2676 you have a wave 1 up into the 5/30 high of 2729, then an ABC down for wave 2 to bottom at 2704 on 5/31, and the the long ride up for the wave 3 into yesterdays high of 2779. It's a very clean wave pattern so far, which suggests the rally up today is the start of the wave 5 up to end the whole 5 wave move.

No one can really predict how long or far a wave 5 can go as some end really fast and short, falling shy of the wave 3 high. Those are the truncated wave 5's. Then there are the wave 5's that subdivide into 5 more smaller waves and match the length of the wave 3 in points, or even go beyond that distance. With wave 3 starting at 2704 and ending at 2779 we have a total of 75 points. So if wave 5 does the same it will reach 75 points higher then the wave 4 low, which right now could be the premarket bottom of 2751? Too early to know for sure the the wave 4 down is complete as we could retest that level today and break it. But if that is the low then 75 points higher puts us at 2826 on the ES Futures.

The clue today to help us figure out whether it's going to be a long wave up or a truncated short one should be where they stop it at by the close today. If it's up today and appears just a few points below the high yesterday then the backtest of the rising brown trendline is likely all they will get and at that point I'd think it's a truncated wave 5. Therefore we should drop on Monday. But if we go down today toward retesting that premarket low, then we close in the red as well, then I'd lean toward the 5th wave up as not started yet and look for that wave 4 down to find a bottom by the close today or even Monday. Maybe the bulls want to take it higher but need more bears to squeeze?

If so they should retest the 2740 area of great prior resistance but now it's support. That should get enough bears on board for another squeeze up on Tuesday to end the wave 5 at least at a double top from yesterday, but probably more. If 2740 becomes the low of this wave 4 down then 75 points up on that would be 2815, just slightly higher then the current wave 3 up top of 2779, and the same length of that wave 3. That could be the plan as well? So, to summarize... down today with a red close leans toward the wave 4 down as "still in play", which might continue into Monday before the wave 5 up squeeze all day Tuesday to end the whole five wave pattern up from the 5/29 low.

Then we should drop on Wednesday of next week to start a new series of waves down. But if the bulls don't back off today and rally up into the close where we end up green for the day and near the high yesterday then I'll lean toward that being a completed wave 5 up and look for a drop to start on Monday. My plan is to short the close if we go up and truncate this wave 5, or to wait until next Tuesday for the wave 5 up to end if we drop all day and close red. I may even go long at the low on Monday for the wave 5 up squeeze? Too early to know for sure but that's my plan of action. Have a great weekend and good luck.

P.S. There's an FOMC meeting next week on the 12th/13th, which if this wave 5 up extends into Tuesday/Wednesday it could end just before the meeting? Possibly that's the top and some surprise event by them will be blamed on the coming drop... like another interest rate hike?

s2Member®