Saturday, July 25, 2026
Home Blog Page 47

ES Morning Update June 7th 2018

0


Yesterdays' slow grind higher tacked on over 20 points... not bad, not bad at all. But I seriously doubt if the bulls can do that again today. In fact odds are skewed more for a flat day or even down some. But I'll be rooting for the bulls to close it green again today and tomorrow so I can get a great short entry for Monday. I don't know if we'll be so lucky as the bulls seem to know exactly when they need to take a break and close red to avoid getting too overbought, thereby killing the perfect bear setup. But maybe this time will be different... who knows?

I'm also keeping my eyes on the VIX as it's getting closer to that old FP of 10.91 that's still showing up on my Think or Swim chart. It could be the signal to say the top is in for the market? Let's see if they can hit it by the close tomorrow. That's about all I can add for today as I covered everything yesterday. My best guess is down small in the morning then back up in the afternoon.

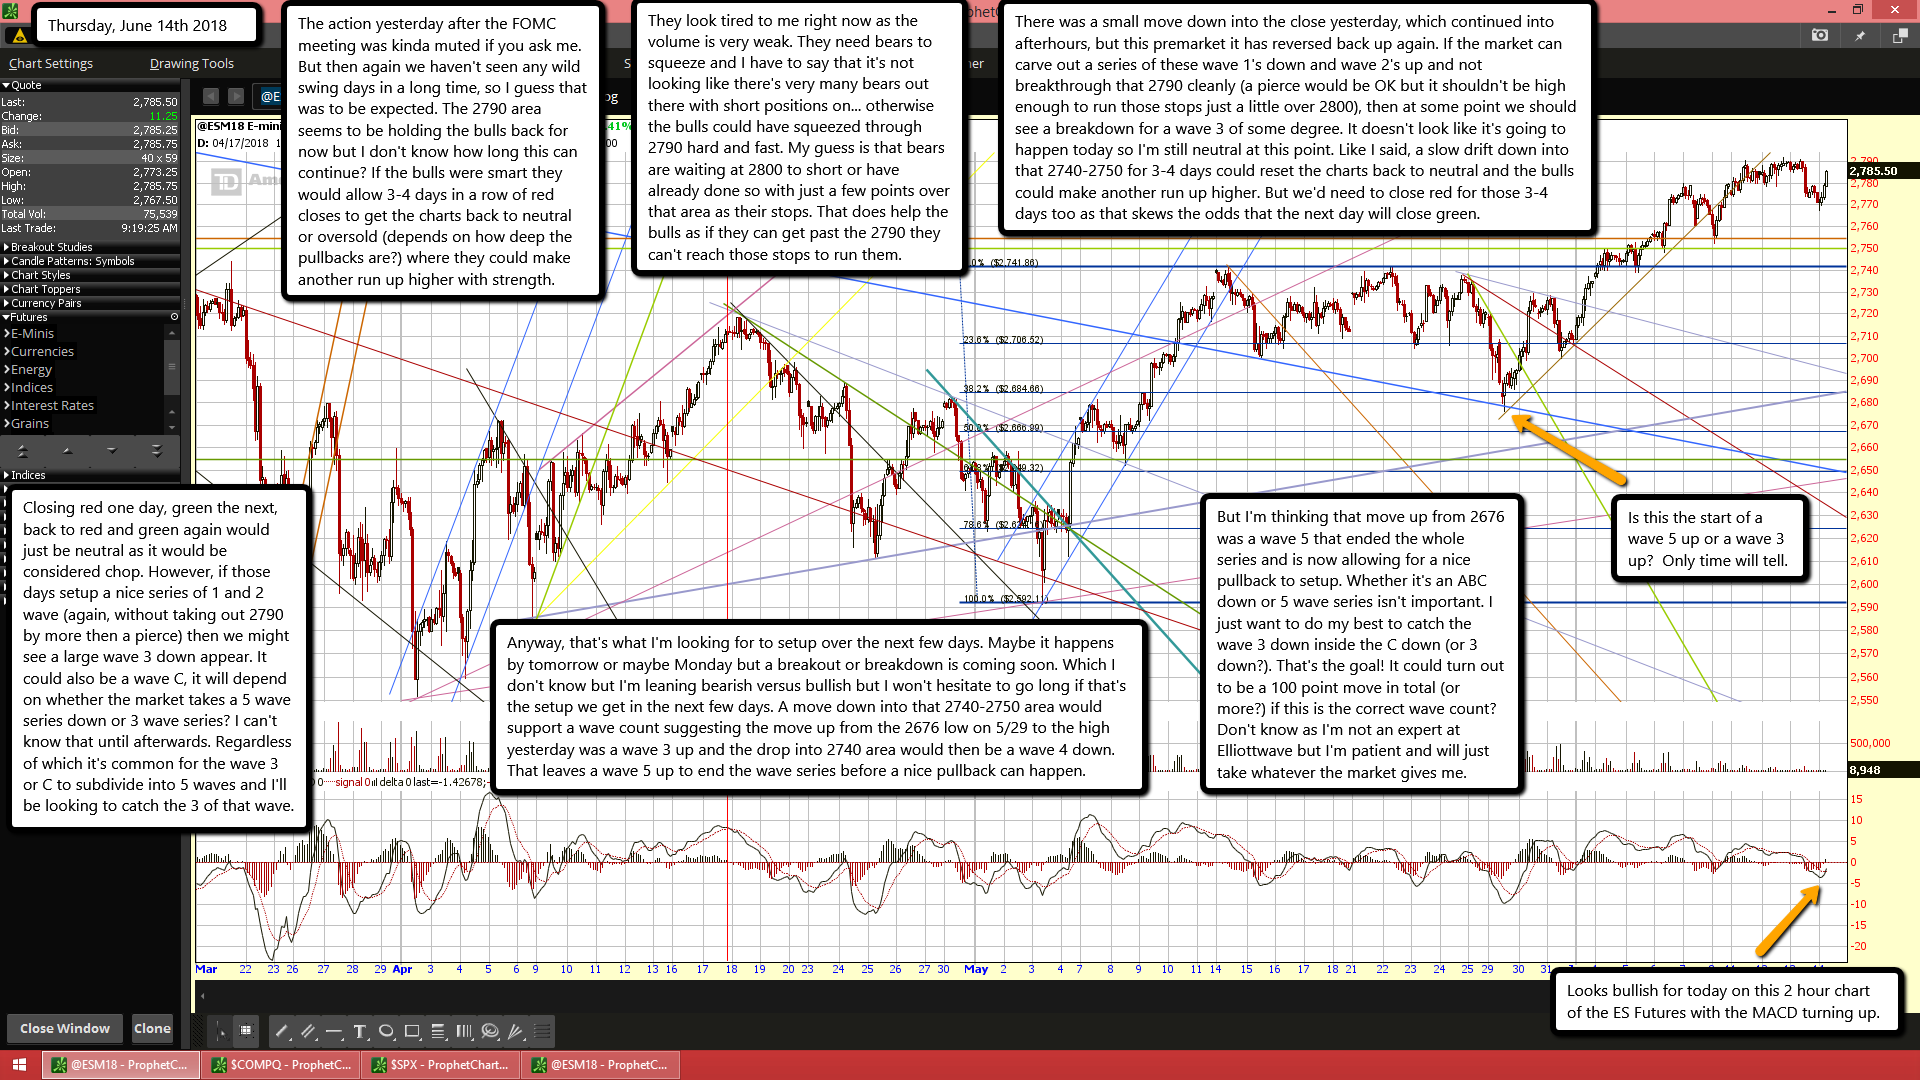
The rising brown trendline is support as shown on this 6 hour chart. A move into it today should produce another rally, but we might not see that until tomorrow from the looks of how far away it is right now, or even afterhours on Friday? But if that support line breaks it should be over the weekend from simple counting of how many 6 hour bars are left to get close enough to hit that rising brown trendline. Tomorrow at the close could be the perfect bear setup... but let's see a green close today and tomorrow to exhaust the bulls first.

ES Morning Update June 6th 2018

0


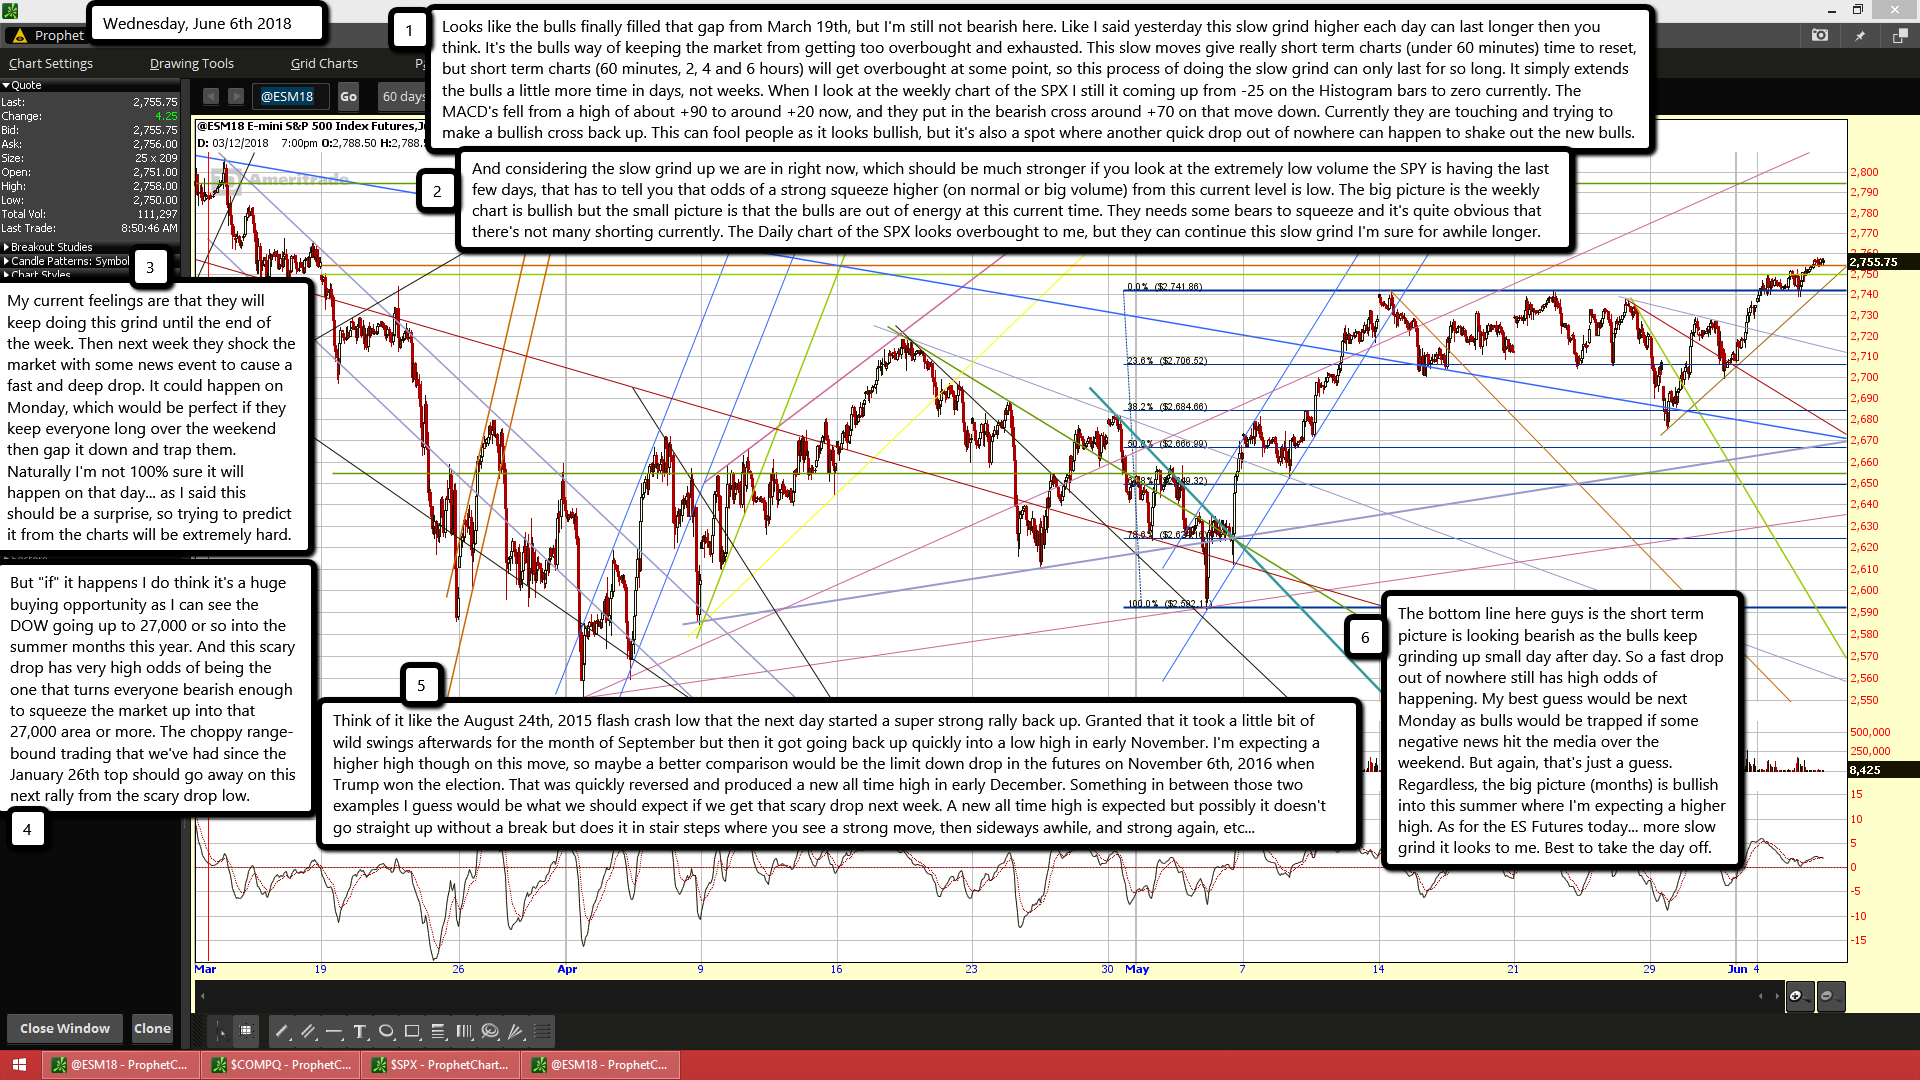
Looks like the bulls finally filled that gap from March 19th, but I'm still not bearish here. Like I said yesterday this slow grind higher each day can last longer then you think. It's the bulls way of keeping the market from getting too overbought and exhausted. This slow moves give really short term charts (under 60 minutes) time to reset, but short term charts (60 minutes, 2, 4 and 6 hours) will get overbought at some point, so this process of doing the slow grind can only last for so long. It simply extends the bulls a little more time in days, not weeks. When I look at the weekly chart of the SPX I still it coming up from -25 on the Histogram bars to zero currently. The MACD's fell from a high of about +90 to around +20 now, and they put in the bearish cross around +70 on that move down. Currently they are touching and trying to make a bullish cross back up. This can fool people as it looks bullish, but it's also a spot where another quick drop out of nowhere can happen to shake out the new bulls.

And considering the slow grind up we are in right now, which should be much stronger if you look at the extremely low volume the SPY is having the last few days, that has to tell you that odds of a strong squeeze higher (on normal or big volume) from this current level is low. The big picture is the weekly chart is bullish but the small picture is that the bulls are out of energy at this current time. They needs some bears to squeeze and it's quite obvious that there's not many shorting currently. The Daily chart of the SPX looks overbought to me, but they can continue this slow grind I'm sure for awhile longer.

My current feelings are that they will keep doing this grind until the end of the week. Then next week they shock the market with some news event to cause a fast and deep drop. It could happen on Monday, which would be perfect if they keep everyone long over the weekend then gap it down and trap them. Naturally I'm not 100% sure it will happen on that day... as I said this should be a surprise, so trying to predict it from the charts will be extremely hard.

But "if" it happens I do think it's a huge buying opportunity as I can see the DOW going up to 27,000 or so into the summer months this year. And this scary drop has very high odds of being the one that turns everyone bearish enough to squeeze the market up into that 27,000 area or more. The choppy range-bound trading that we've had since the January 26th top should go away on this next rally from the scary drop low.

Think of it like the August 24th, 2015 flash crash low that the next day started a super strong rally back up. Granted that it took a little bit of wild swings afterwards for the month of September but then it got going back up quickly into a low high in early November. I'm expecting a higher high though on this move, so maybe a better comparison would be the limit down drop in the futures on November 6th, 2016 when Trump won the election. That was quickly reversed and produced a new all time high in early December. Something in between those two examples I guess would be what we should expect if we get that scary drop next week. A new all time high is expected but possibly it doesn't go straight up without a break but does it in stair steps where you see a strong move, then sideways awhile, and strong again, etc...

The bottom line here guys is the short term picture is looking bearish as the bulls keep grinding up small day after day. So a fast drop out of nowhere still has high odds of happening. My best guess would be next Monday as bulls would be trapped if some negative news hit the media over the weekend. But again, that's just a guess. Regardless, the big picture (months) is bullish into this summer where I'm expecting a higher high. As for the ES Futures today... more slow grind it looks to me. Best to take the day off.

ES Morning Update June 5th 2018

0

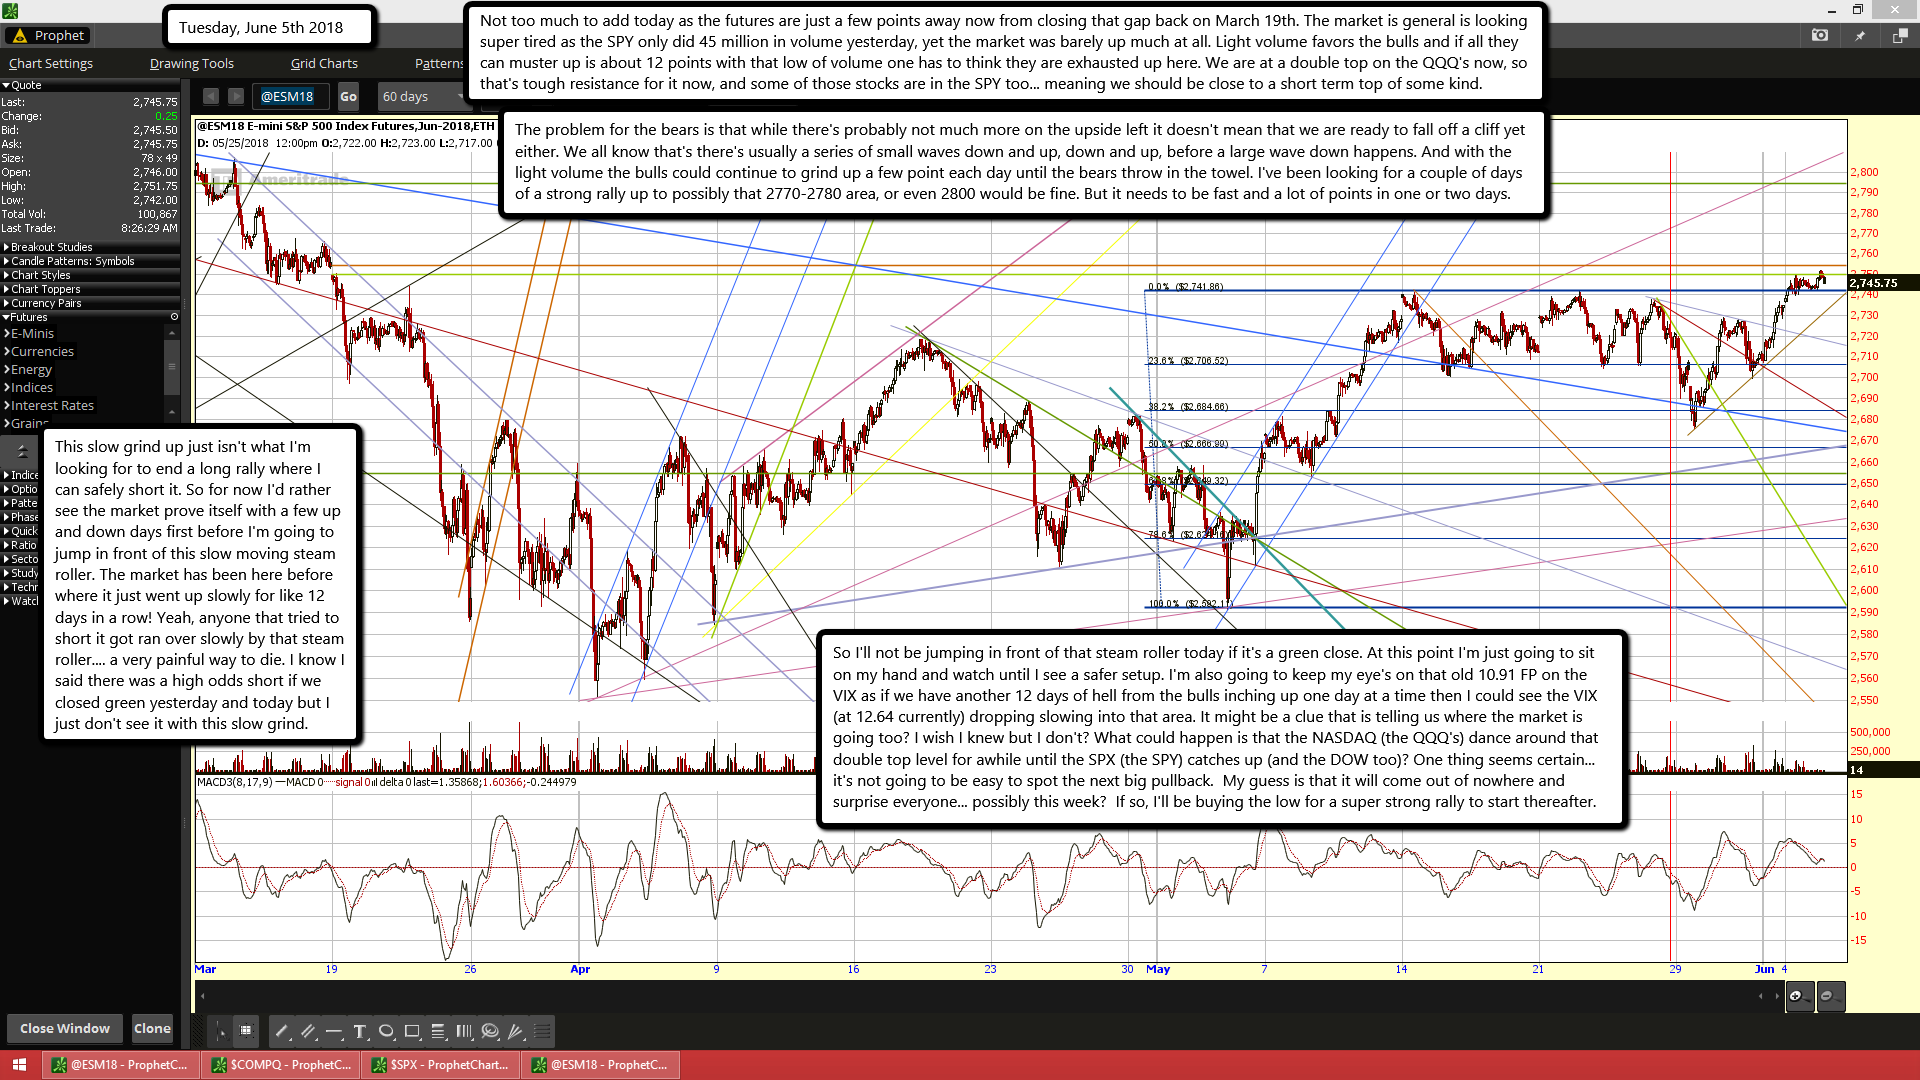
Not too much to add today as the futures are just a few points away now from closing that gap back on March 19th. The market is general is looking super tired as the SPY only did 45 million in volume yesterday, yet the market was barely up much at all. Light volume favors the bulls and if all they can muster up is about 12 points with that low of volume one has to think they are exhausted up here. We are at a double top on the QQQ's now, so that's tough resistance for it now, and some of those stocks are in the SPY too... meaning we should be close to a short term top of some kind.

The problem for the bears is that while there's probably not much more on the upside left it doesn't mean that we are ready to fall off a cliff yet either. We all know that's there's usually a series of small waves down and up, down and up, before a large wave down happens. And with the light volume the bulls could continue to grind up a few point each day until the bears throw in the towel. I've been looking for a couple of days of a strong rally up to possibly that 2770-2780 area, or even 2800 would be fine. But it needs to be fast and a lot of points in one or two days.

This slow grind up just isn't what I'm looking for to end a long rally where I can safely short it. So for now I'd rather see the market prove itself with a few up and down days first before I'm going to jump in front of this slow moving steam roller. The market has been here before where it just went up slowly for like 12 days in a row! Yeah, anyone that tried to short it got ran over slowly by that steam roller.... a very painful way to die. I know I said there was a high odds short if we closed green yesterday and today but I just don't see it with this slow grind.

So I'll not be jumping in front of that steam roller today if it's a green close. At this point I'm just going to sit on my hand and watch until I see a safer setup. I'm also going to keep my eye's on that old 10.91 FP on the VIX as if we have another 12 days of hell from the bulls inching up one day at a time then I could see the VIX (at 12.64 currently) dropping slowing into that area. It might be a clue that is telling us where the market is going too? I wish I knew but I don't? What could happen is that the NASDAQ (the QQQ's) dance around that double top level for awhile until the SPX (the SPY) catches up (and the DOW too)? One thing seems certain... it's not going to be easy to spot the next big pullback. My guess is that it will come out of nowhere and surprise everyone... possibly this week? If so, I'll be buying the low for a super strong rally to start thereafter.

ES Morning Update June 4th 2018

0


Finally we are breaking out of the 2740 topping zone this morning. I was beginning to wonder if the bulls were ever going to get it through. Since it taken so long to do so I fully expect them to go up past that gap fill area of 2755 as it's been there too long now and too many traders see it. So logic tells me the bulls will go up to it and let the shorts pile on, then rip it higher to squeeze them out.

How high is anyone's guess but if it's hit today then I'd expect tomorrow to rally up higher as well. My best guess is that if we rally today and tomorrow we'll top out by the close Tuesday and start back down on Wednesday. I don't see this as being over yet for the bears as they have yet to have a super scary drop that shakes out all the bulls. There's a lot of bulls that have been buying all these dips and for the market to rally up to new all time highs again (which I think is coming at some point), those bulls need to become bears or at least go to cash.

That's why I think the market is still at risk of another scary drop before any long lasting rally can take us up to new highs and beyond. Give me a green close today (preferably with that gap filled) and a green close tomorrow (closing near the highs by 4pm Tuesday) and I think we have a great short setup. The higher the better in my opinion... even as high as that 2800 level, but I don't know if it's got that much in it or not?

Whatever the level is I'm fine with shorting it as long as it exhausts the bulls and squeezes the last bear out... which it should do with a nice "all day long" squeeze up on Tuesday (and part of today, but I tend to think we'll pullback small at some point today). That's it for this mornings' update... short and sweet. If we don't get the green closes and instead get one or two red closes then I'm back to waiting on another setup I guess... as well as being back in the trading zone (I'd assume we would be with two down days).

ES Morning Update June 1st 2018

0


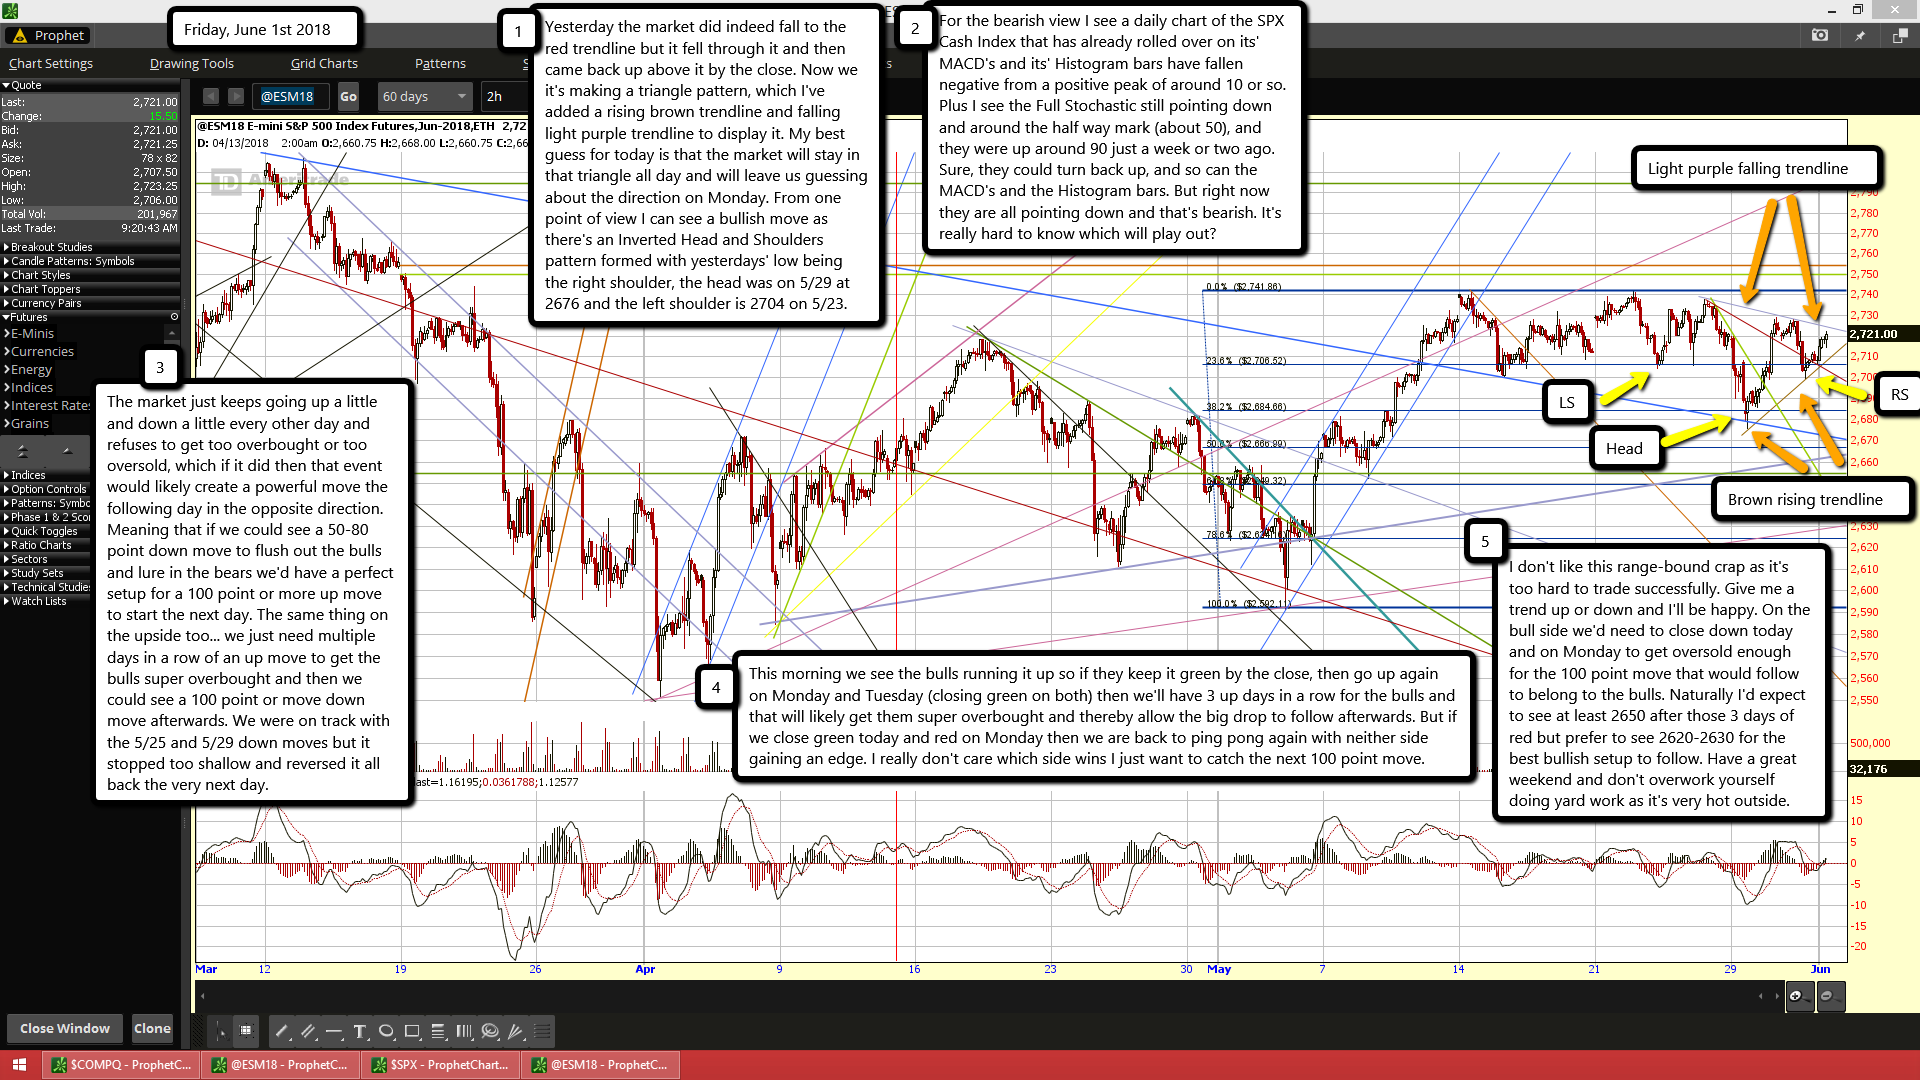
Yesterday the market did indeed fall to the red trendline but it fell through it and then came back up above it by the close. Now we it's making a triangle pattern, which I've added a rising brown trendline and falling light purple trendline to display it. My best guess for today is that the market will stay in that triangle all day and will leave us guessing about the direction on Monday. From one point of view I can see a bullish move as there's an Inverted Head and Shoulders pattern formed with yesterdays' low being the right shoulder, the head was on 5/29 at 2676 and the left shoulder is 2704 on 5/23.

For the bearish view I see a daily chart of the SPX Cash Index that has already rolled over on its' MACD's and its' Histogram bars have fallen negative from a positive peak of around 10 or so. Plus I see the Full Stochastic still pointing down and around the half way mark (about 50), and they were up around 90 just a week or two ago. Sure, they could turn back up, and so can the MACD's and the Histogram bars. But right now they are all pointing down and that's bearish. It's really hard to know which will play out?

The market just keeps going up a little and down a little every other day and refuses to get too overbought or too oversold, which if it did then that event would likely create a powerful move the following day in the opposite direction. Meaning that if we could see a 50-80 point down move to flush out the bulls and lure in the bears we'd have a perfect setup for a 100 point or more up move to start the next day. The same thing on the upside too... we just need multiple days in a row of an up move to get the bulls super overbought and then we could see a 100 point or move down move afterwards. We were on track with the 5/25 and 5/29 down moves but it stopped too shallow and reversed it all back the very next day.

This morning we see the bulls running it up so if they keep it green by the close, then go up again on Monday and Tuesday (closing green on both) then we'll have 3 up days in a row for the bulls and that will likely get them super overbought and thereby allow the big drop to follow afterwards. But if we close green today and red on Monday then we are back to ping pong again with neither side gaining an edge. I really don't care which side wins I just want to catch the next 100 point move.

I don't like this range-bound crap as it's too hard to trade successfully. Give me a trend up or down and I'll be happy. On the bull side we'd need to close down today and on Monday to get oversold enough for the 100 point move that would follow to belong to the bulls. Naturally I'd expect to see at least 2650 after those 3 days of red but prefer to see 2620-2630 for the best bullish setup to follow. Have a great weekend and don't overwork yourself doing yard work as it's very hot outside.

ES Morning Update May 31st 2018

0


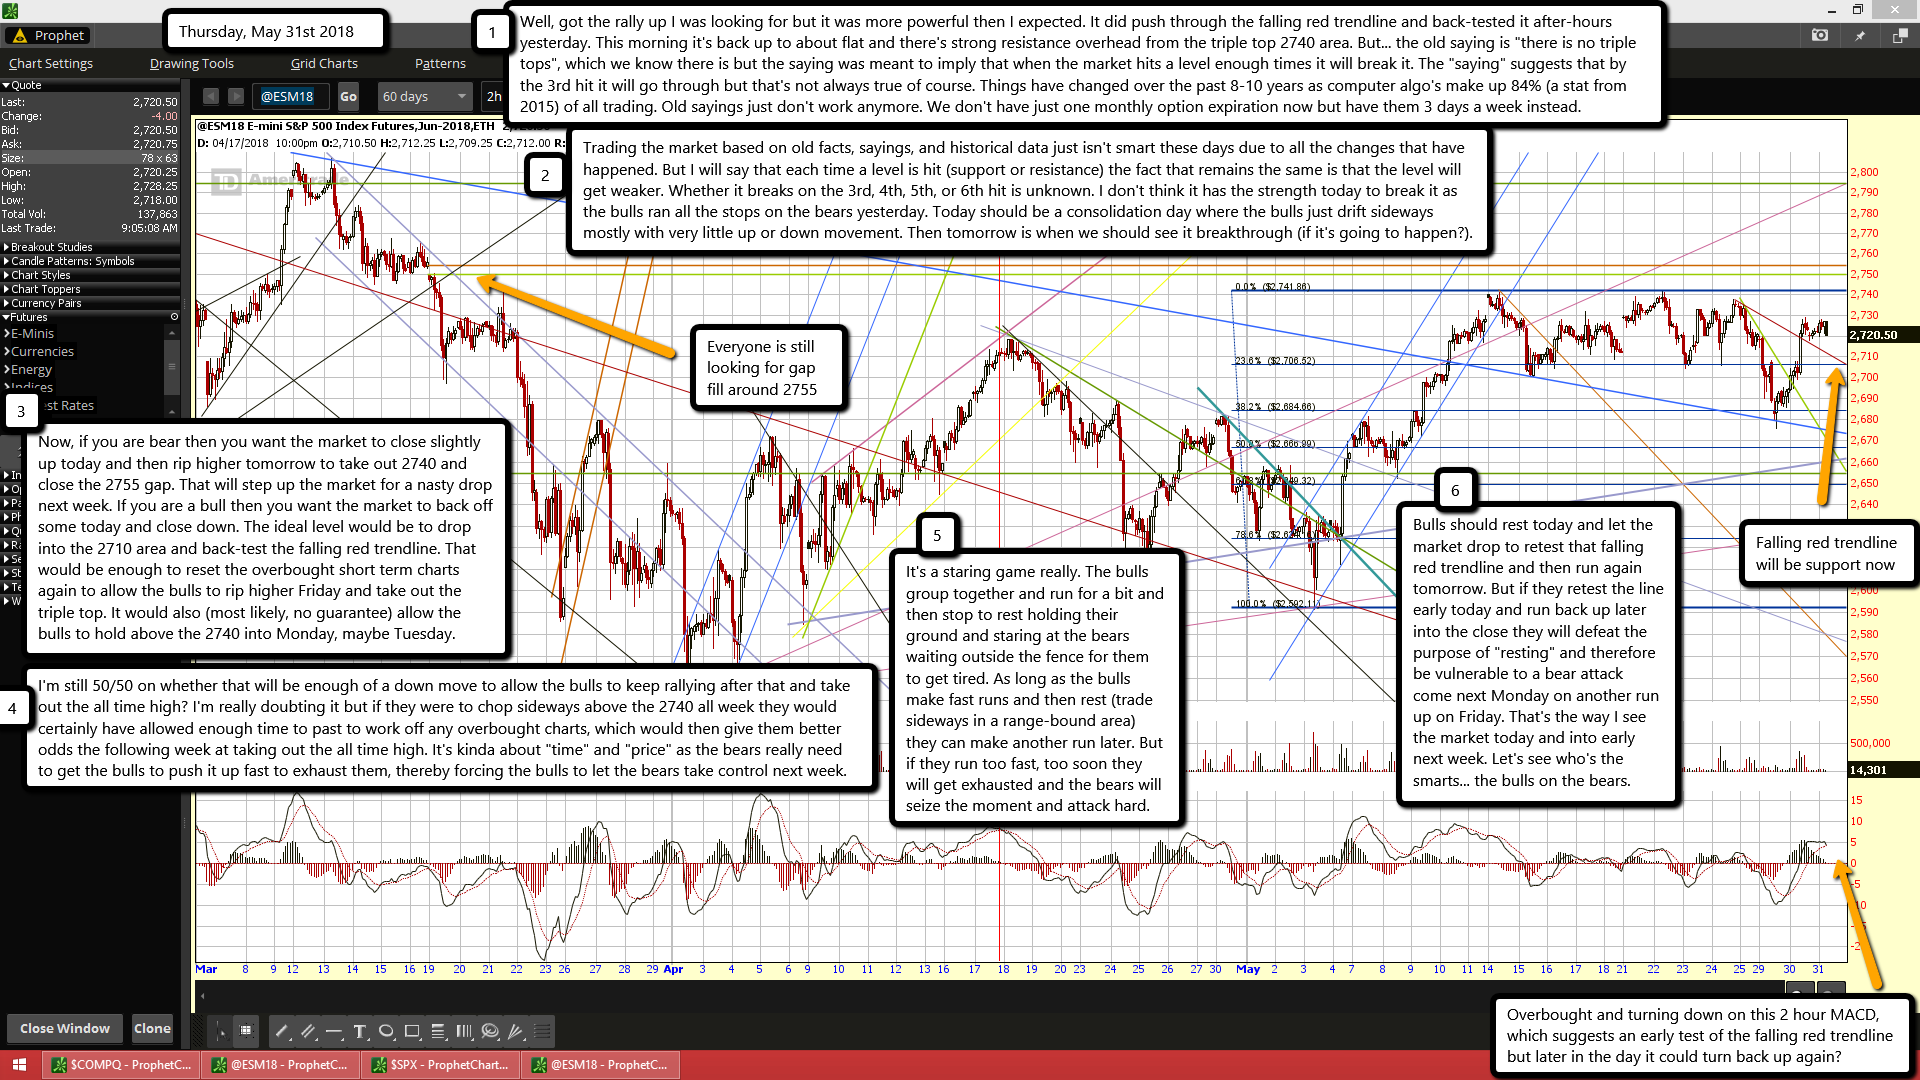
Well, got the rally up I was looking for but it was more powerful then I expected. It did push through the falling red trendline and back-tested it after-hours yesterday. This morning it's back up to about flat and there's strong resistance overhead from the triple top 2740 area. But... the old saying is "there is no triple tops", which we know there is but the saying was meant to imply that when the market hits a level enough times it will break it. The "saying" suggests that by the 3rd hit it will go through but that's not always true of course. Things have changed over the past 8-10 years as computer algo's make up 84% (a stat from 2015) of all trading. Old sayings just don't work anymore. We don't have just one monthly option expiration now but have them 3 days a week instead.

Trading the market based on old facts, sayings, and historical data just isn't smart these days due to all the changes that have happened. But I will say that each time a level is hit (support or resistance) the fact that remains the same is that the level will get weaker. Whether it breaks on the 3rd, 4th, 5th, or 6th hit is unknown. I don't think it has the strength today to break it as the bulls ran all the stops on the bears yesterday. Today should be a consolidation day where the bulls just drift sideways mostly with very little up or down movement. Then tomorrow is when we should see it breakthrough (if it's going to happen?).

Now, if you are bear then you want the market to close slightly up today and then rip higher tomorrow to take out 2740 and close the 2755 gap. That will step up the market for a nasty drop next week. If you are a bull then you want the market to back off some today and close down. The ideal level would be to drop into the 2710 area and back-test the falling red trendline. That would be enough to reset the overbought short term charts again to allow the bulls to rip higher Friday and take out the triple top. It would also (most likely, no guarantee) allow the bulls to hold above the 2740 into Monday, maybe Tuesday.

I'm still 50/50 on whether that will be enough of a down move to allow the bulls to keep rallying after that and take out the all time high? I'm really doubting it but if they were to chop sideways above the 2740 all week they would certainly have allowed enough time to past to work off any overbought charts, which would then give them better odds the following week at taking out the all time high. It's kinda about "time" and "price" as the bears really need to get the bulls to push it up fast to exhaust them, thereby forcing the bulls to let the bears take control next week.

It's a staring game really. The bulls group together and run for a bit and then stop to rest holding their ground and staring at the bears waiting outside the fence for them to get tired. As long as the bulls make fast runs and then rest (trade sideways in a range-bound area) they can make another run later. But if they run too fast, too soon they will get exhausted and the bears will seize the moment and attack hard.

Bulls should rest today and let the market drop to retest that falling red trendline and then run again tomorrow. But if they retest the line early today and run back up later into the close they will defeat the purpose of "resting" and therefore be vulnerable to a bear attack come next Monday on another run up on Friday. That's the way I see the market today and into early next week. Let's see who's the smarts... the bulls on the bears.

ES Morning Update May 30th 2018

0


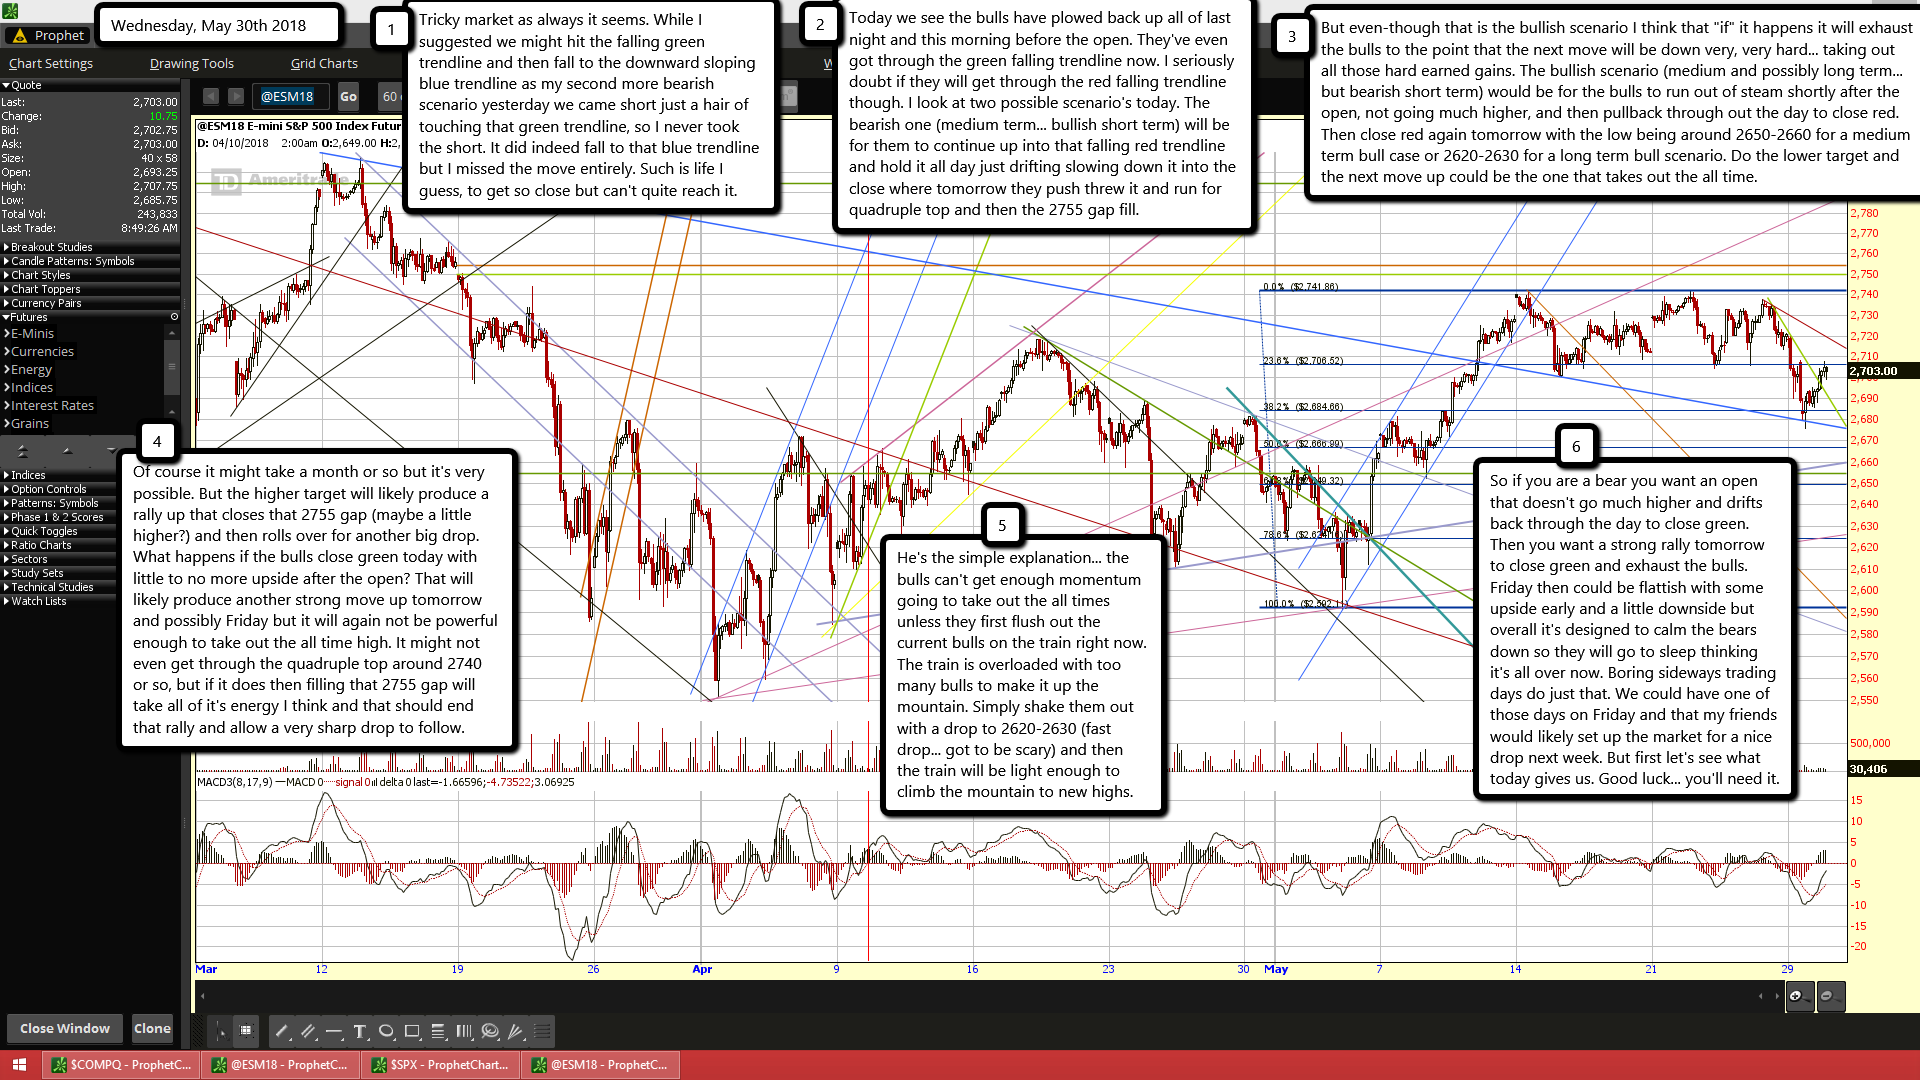
Tricky market as always it seems. While I suggested we might hit the falling green trendline and then fall to the downward sloping blue trendline as my second more bearish scenario yesterday we came short just a hair of touching that green trendline, so I never took the short. It did indeed fall to that blue trendline but I missed the move entirely. Such is life I guess, to get so close but can't quite reach it.

Today we see the bulls have plowed back up all of last night and this morning before the open. They've even got through the green falling trendline now. I seriously doubt if they will get through the red falling trendline though. I look at two possible scenario's today. The bearish one (medium term... bullish short term) will be for them to continue up into that falling red trendline and hold it all day just drifting slowing down it into the close where tomorrow they push threw it and run for quadruple top and then the 2755 gap fill.

But even-though that is the bullish scenario I think that "if" it happens it will exhaust the bulls to the point that the next move will be down very, very hard... taking out all those hard earned gains. The bullish scenario (medium and possibly long term... but bearish short term) would be for the bulls to run out of steam shortly after the open, not going much higher, and then pullback through out the day to close red. Then close red again tomorrow with the low being around 2650-2660 for a medium term bull case or 2620-2630 for a long term bull scenario. Do the lower target and the next move up could be the one that takes out the all time.

Of course it might take a month or so but it's very possible. But the higher target will likely produce a rally up that closes that 2755 gap (maybe a little higher?) and then rolls over for another big drop. What happens if the bulls close green today with little to no more upside after the open? That will likely produce another strong move up tomorrow and possibly Friday but it will again not be powerful enough to take out the all time high. It might not even get through the quadruple top around 2740 or so, but if it does then filling that 2755 gap will take all of it's energy I think and that should end that rally and allow a very sharp drop to follow.

He's the simple explanation... the bulls can't get enough momentum going to take out the all times unless they first flush out the current bulls on the train right now. The train is overloaded with too many bulls to make it up the mountain. Simply shake them out with a drop to 2620-2630 (fast drop... got to be scary) and then the train will be light enough to climb the mountain to new highs.

So if you are a bear you want an open that doesn't go much higher and drifts back through the day to close green. Then you want a strong rally tomorrow to close green and exhaust the bulls. Friday then could be flattish with some upside early and a little downside but overall it's designed to calm the bears down so they will go to sleep thinking it's all over now. Boring sideways trading days do just that. We could have one of those days on Friday and that my friends would likely set up the market for a nice drop next week. But first let's see what today gives us. Good luck... you'll need it.

ES Morning Update May 29th 2018

0


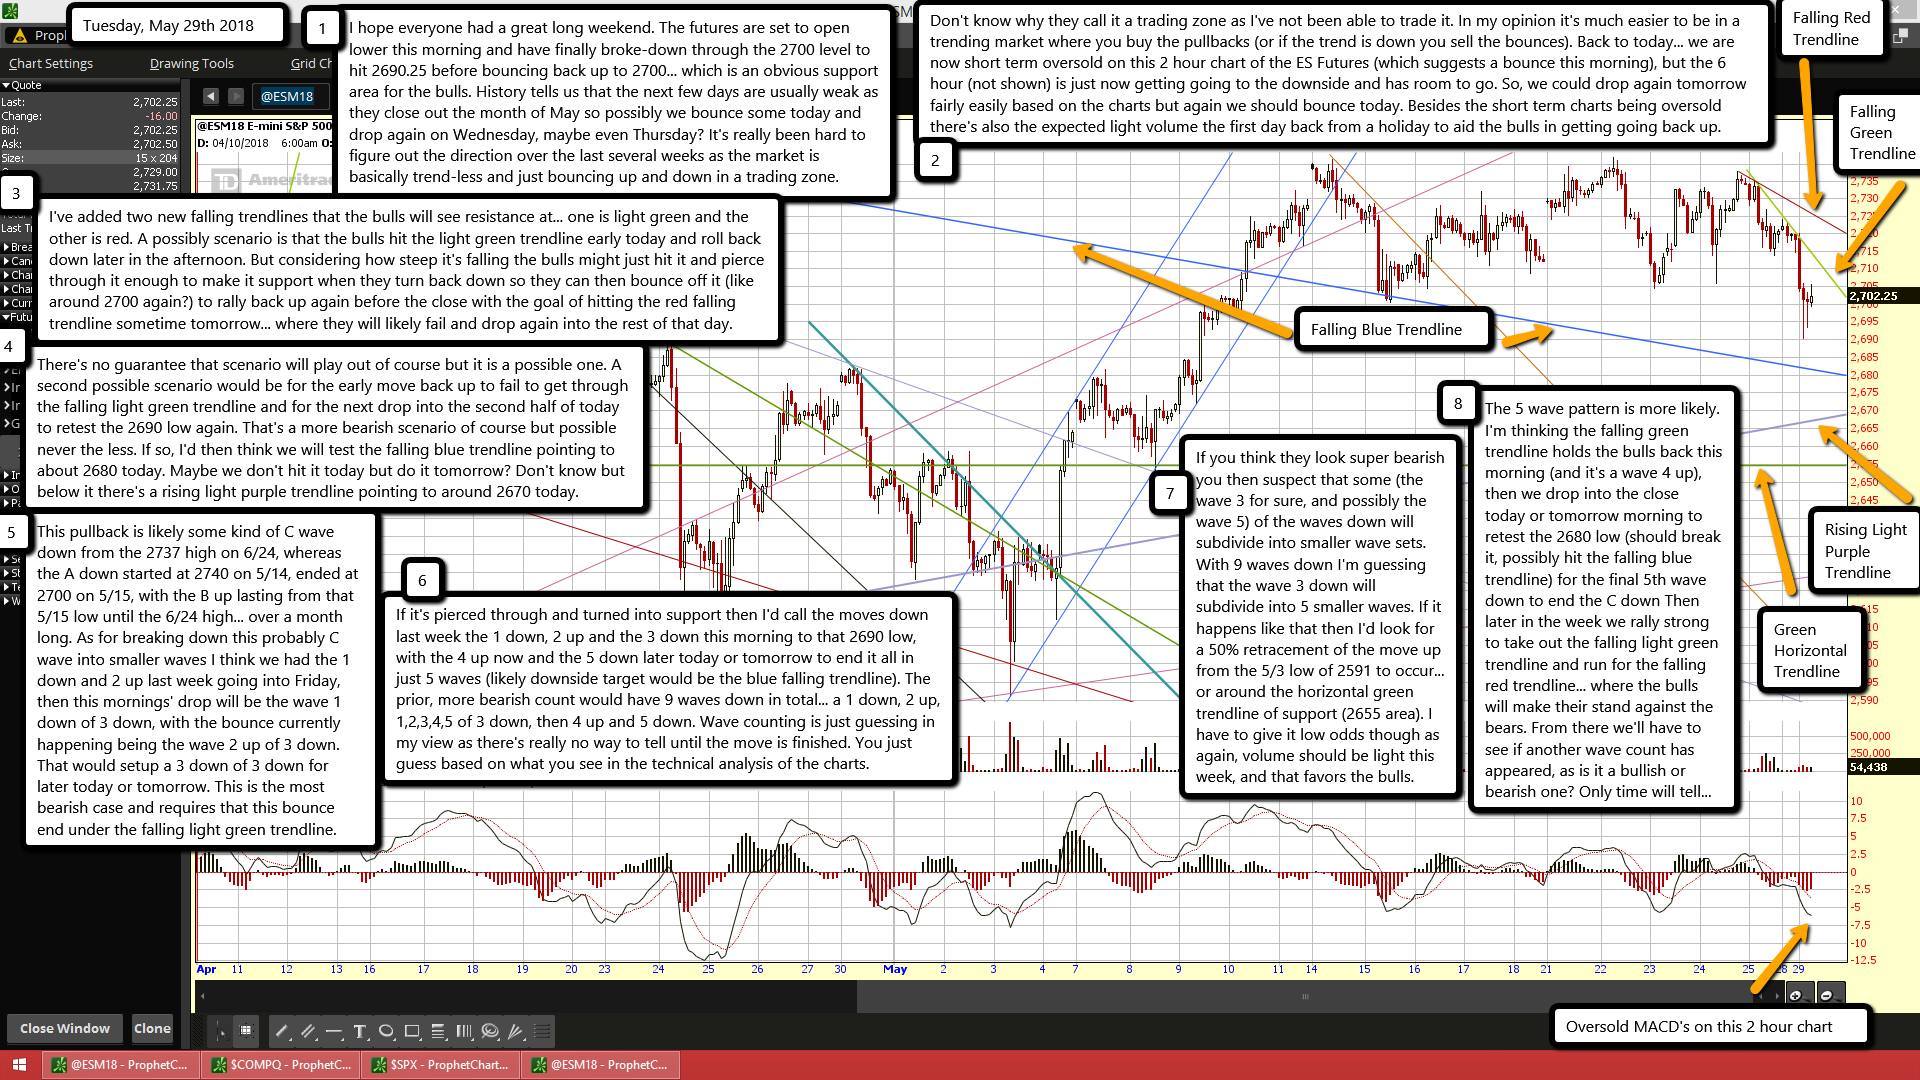
I hope everyone had a great long weekend. The futures are set to open lower this morning and have finally broke-down through the 2700 level to hit 2690.25 before bouncing back up to 2700... which is an obvious support area for the bulls. History tells us that the next few days are usually weak as they close out the month of May so possibly we bounce some today and drop again on Wednesday, maybe even Thursday? It's really been hard to figure out the direction over the last several weeks as the market is basically trend-less and just bouncing up and down in a trading zone.

Don't know why they call it a trading zone as I've not been able to trade it. In my opinion it's much easier to be in a trending market where you buy the pullbacks (or if the trend is down you sell the bounces). Back to today... we are now short term oversold on this 2 hour chart of the ES Futures (which suggests a bounce this morning), but the 6 hour (not shown) is just now getting going to the downside and has room to go. So, we could drop again tomorrow fairly easily based on the charts but again we should bounce today. Besides the short term charts being oversold there's also the expected light volume the first day back from a holiday to aid the bulls in getting going back up.

I've added two new falling trendlines that the bulls will see resistance at... one is light green and the other is red. A possibly scenario is that the bulls hit the light green trendline early today and roll back down later in the afternoon. But considering how steep it's falling the bulls might just hit it and pierce through it enough to make it support when they turn back down so they can then bounce off it (like around 2700 again?) to rally back up again before the close with the goal of hitting the red falling trendline sometime tomorrow... where they will likely fail and drop again into the rest of that day.

There's no guarantee that scenario will play out of course but it is a possible one. A second possible scenario would be for the early move back up to fail to get through the falling light green trendline and for the next drop into the second half of today to retest the 2690 low again. That's a more bearish scenario of course but possible never the less. If so, I'd then think we will test the falling blue trendline pointing to about 2680 today. Maybe we don't hit it today but do it tomorrow? Don't know but below it there's a rising light purple trendline pointing to around 2670 today.

This pullback is likely some kind of C wave down from the 2737 high on 6/24, whereas the A down started at 2740 on 5/14, ended at 2700 on 5/15, with the B up lasting from that 5/15 low until the 6/24 high... over a month long. As for breaking down this probably C wave into smaller waves I think we had the 1 down and 2 up last week going into Friday, then this mornings' drop will be the wave 1 down of 3 down, with the bounce currently happening being the wave 2 up of 3 down. That would setup a 3 down of 3 down for later today or tomorrow. This is the most bearish case and requires that this bounce end under the falling light green trendline.

If it's pierced through and turned into support then I'd call the moves down last week the 1 down, 2 up and the 3 down this morning to that 2690 low, with the 4 up now and the 5 down later today or tomorrow to end it all in just 5 waves (likely downside target would be the blue falling trendline). The prior, more bearish count would have 9 waves down in total... a 1 down, 2 up, 1,2,3,4,5 of 3 down, then 4 up and 5 down. Wave counting is just guessing in my view as there's really no way to tell until the move is finished. You just guess based on what you see in the technical analysis of the charts.

If you think they look super bearish you then suspect that some (the wave 3 for sure, and possibly the wave 5) of the waves down will subdivide into smaller wave sets. With 9 waves down I'm guessing that the wave 3 down will subdivide into 5 smaller waves. If it happens like that then I'd look for a 50% retracement of the move up from the 5/3 low of 2591 to occur... or around the horizontal green trendline of support (2655 area). I have to give it low odds though as again, volume should be light this week, and that favors the bulls.

The 5 wave pattern is more likely. I'm thinking the falling green trendline holds the bulls back this morning (and it's a wave 4 up), then we drop into the close today or tomorrow morning to retest the 2680 low (should break it, possibly hit the falling blue trendline) for the final 5th wave down to end the C down Then later in the week we rally strong to take out the falling light green trendline and run for the falling red trendline... where the bulls will make their stand against the bears. From there we'll have to see if another wave count has appeared, as is it a bullish or bearish one? Only time will tell...

ES Morning Update May 25th 2018

0


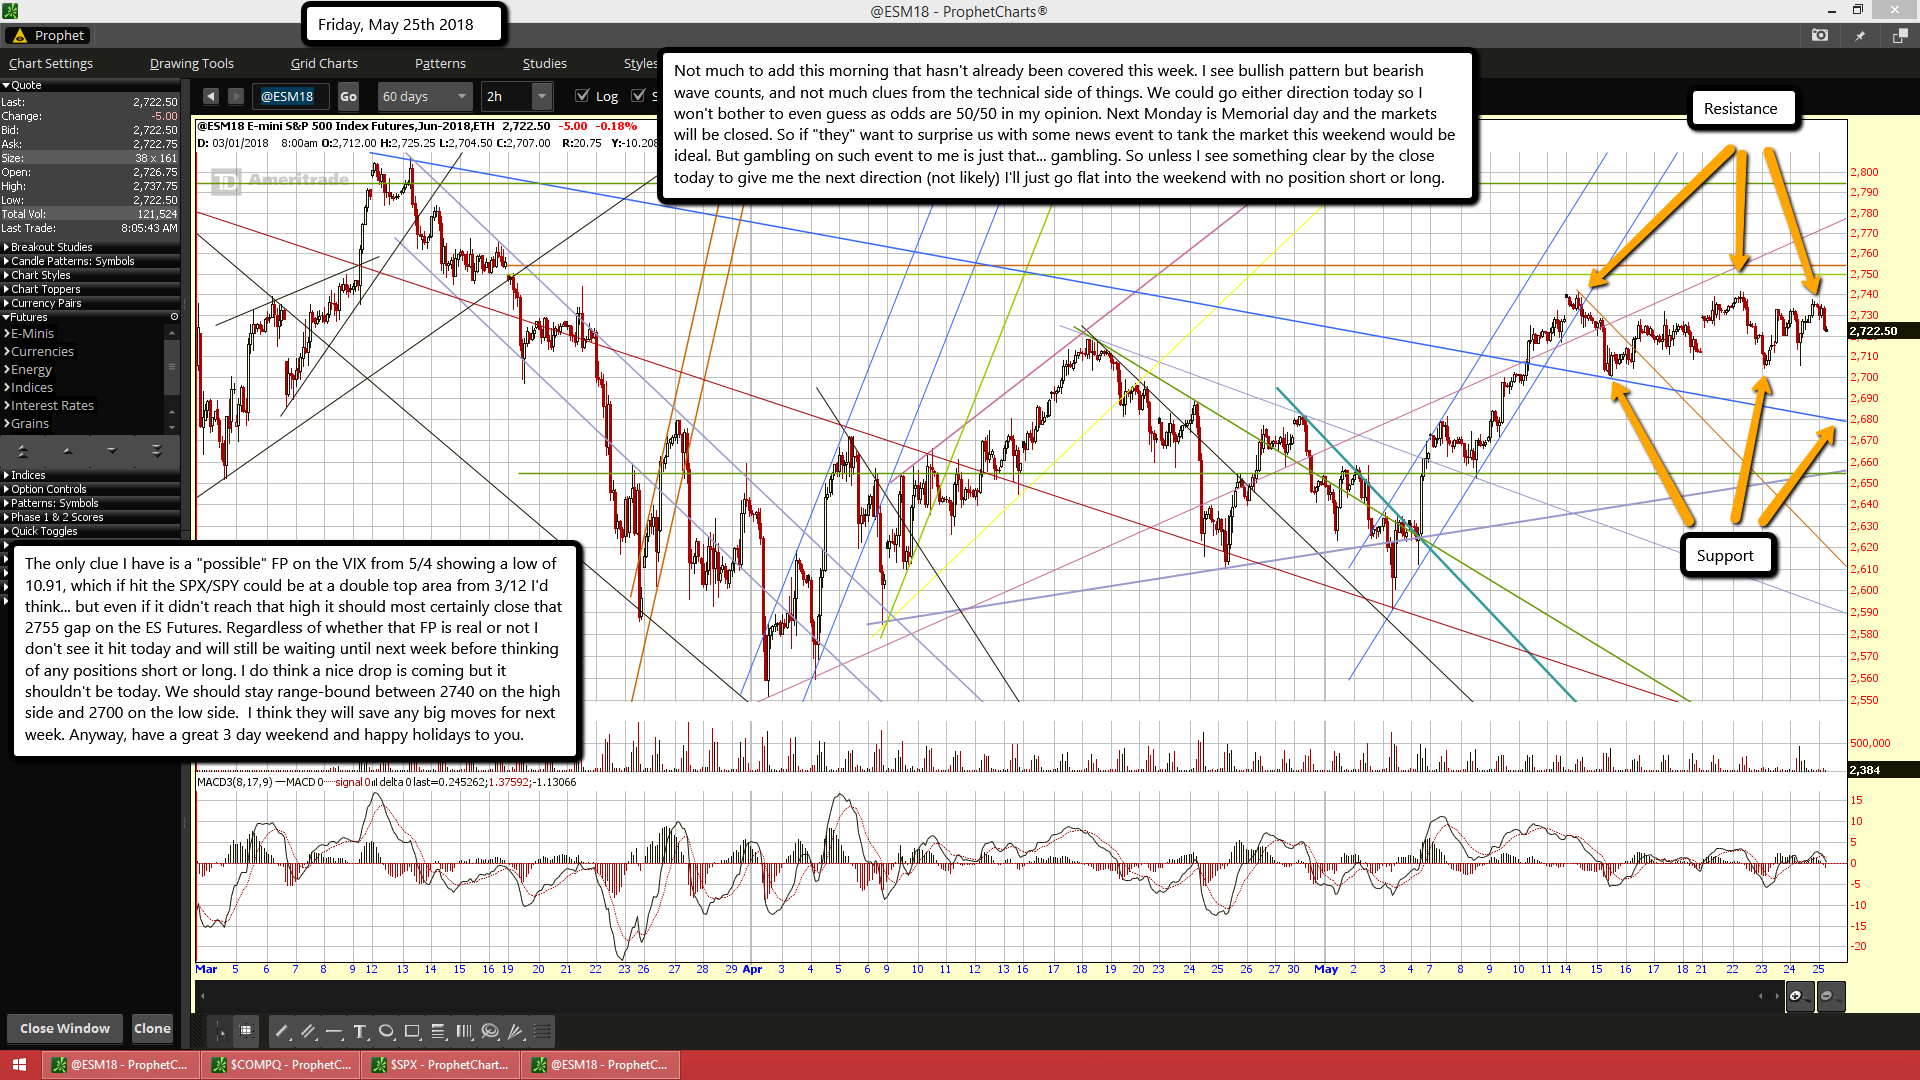
Not much to add this morning that hasn't already been covered this week. I see bullish pattern but bearish wave counts, and not much clues from the technical side of things. We could go either direction today so I won't bother to even guess as odds are 50/50 in my opinion. Next Monday is Memorial day and the markets will be closed. So if "they" want to surprise us with some news event to tank the market this weekend would be ideal. But gambling on such event to me is just that... gambling. So unless I see something clear by the close today to give me the next direction (not likely) I'll just go flat into the weekend with no position short or long.

The only clue I have is a "possible" FP on the VIX from 5/4 showing a low of 10.91, which if hit the SPX/SPY could be at a double top area from 3/12 I'd think... but even if it didn't reach that high it should most certainly close that 2755 gap on the ES Futures. Regardless of whether that FP is real or not I don't see it hit today and will still be waiting until next week before thinking of any positions short or long. I do think a nice drop is coming but it shouldn't be today. We should stay range-bound between 2740 on the high side and 2700 on the low side.  I think they will save any big moves for next week. Anyway, have a great 3 day weekend and happy holidays to you.

ES Morning Update May 24th 2018

0


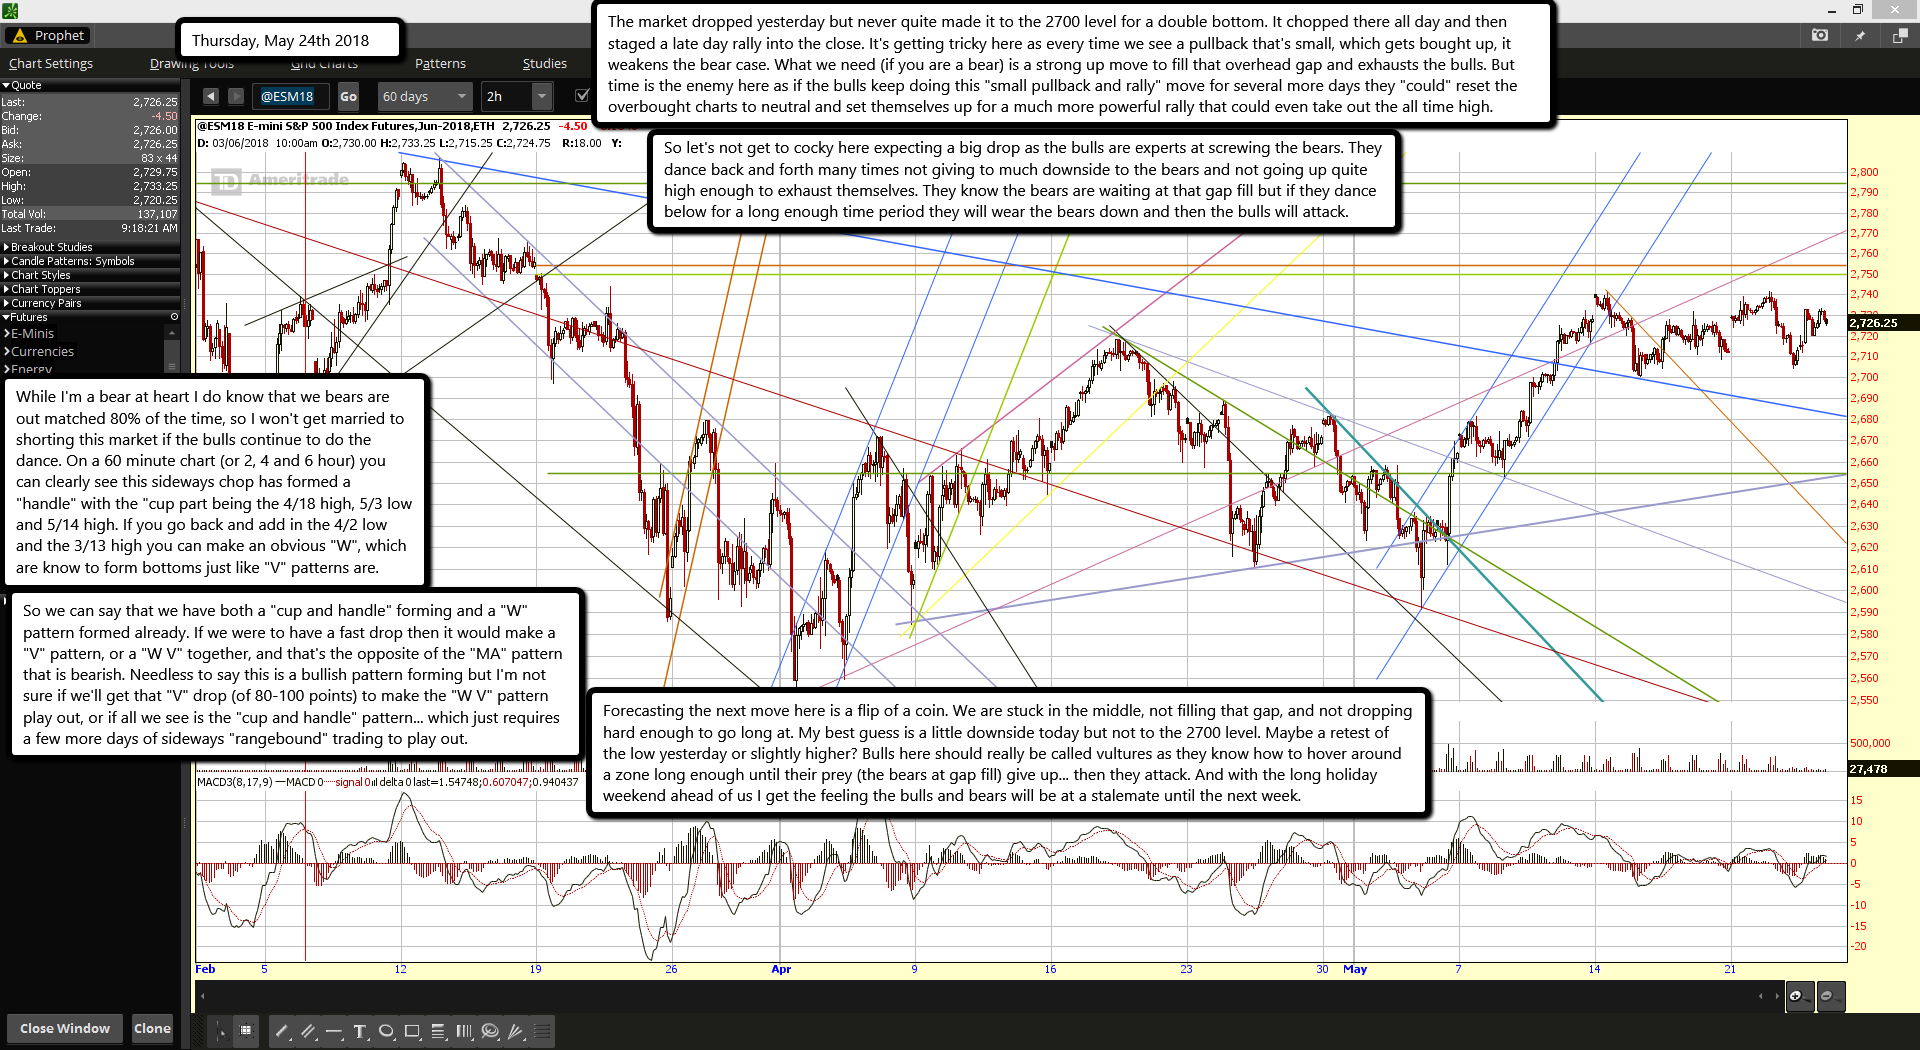
The market dropped yesterday but never quite made it to the 2700 level for a double bottom. It chopped there all day and then staged a late day rally into the close. It's getting tricky here as every time we see a pullback that's small, which gets bought up, it weakens the bear case. What we need (if you are a bear) is a strong up move to fill that overhead gap and exhausts the bulls. But time is the enemy here as if the bulls keep doing this "small pullback and rally" move for several more days they "could" reset the overbought charts to neutral and set themselves up for a much more powerful rally that could even take out the all time high.

So let's not get to cocky here expecting a big drop as the bulls are experts at screwing the bears. They dance back and forth many times not giving to much downside to the bears and not going up quite high enough to exhaust themselves. They know the bears are waiting at that gap fill but if they dance below for a long enough time period they will wear the bears down and then the bulls will attack.

While I'm a bear at heart I do know that we bears are out matched 80% of the time, so I won't get married to shorting this market if the bulls continue to do the dance. On a 60 minute chart (or 2, 4 and 6 hour) you can clearly see this sideways chop has formed a "handle" with the "cup part being the 4/18 high, 5/3 low and 5/14 high. If you go back and add in the 4/2 low and the 3/13 high you can make an obvious "W", which are know to form bottoms just like "V" patterns are.

So we can say that we have both a "cup and handle" forming and a "W" pattern formed already. If we were to have a fast drop then it would make a "V" pattern, or a "W V" together, and that's the opposite of the "MA" pattern that is bearish. Needless to say this is a bullish pattern forming but I'm not sure if we'll get that "V" drop (of 80-100 points) to make the "W V" pattern play out, or if all we see is the "cup and handle" pattern... which just requires a few more days of sideways "rangebound" trading to play out.

Forecasting the next move here is a flip of a coin. We are stuck in the middle, not filling that gap, and not dropping hard enough to go long at. My best guess is a little downside today but not to the 2700 level. Maybe a retest of the low yesterday or slightly higher? Bulls here should really be called vultures as they know how to hover around a zone long enough until their prey (the bears at gap fill) give up... then they attack. And with the long holiday weekend ahead of us I get the feeling the bulls and bears will be at a stalemate until the next week.

ES Morning Update May 23rd 2018

0


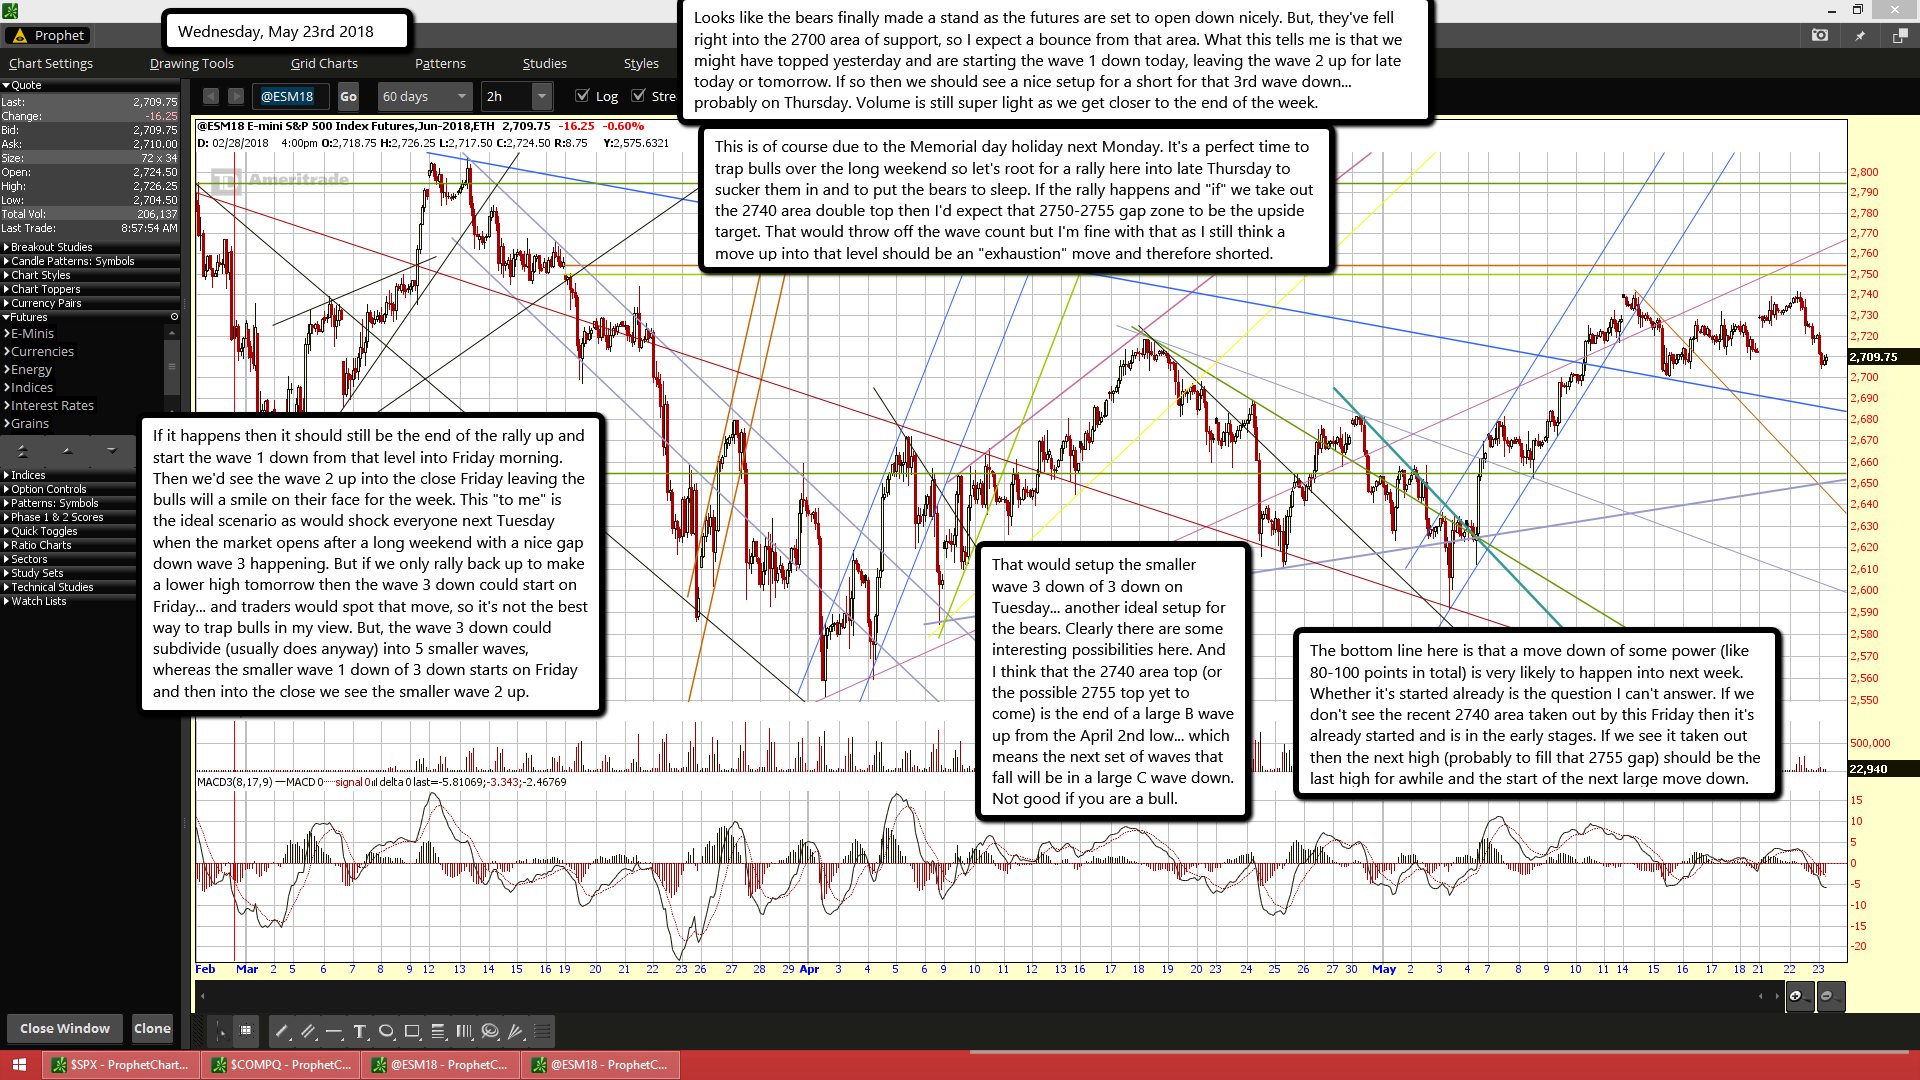
Looks like the bears finally made a stand as the futures are set to open down nicely. But, they've fell right into the 2700 area of support, so I expect a bounce from that area. What this tells me is that we might have topped yesterday and are starting the wave 1 down today, leaving the wave 2 up for late today or tomorrow. If so then we should see a nice setup for a short for that 3rd wave down... probably on Thursday. Volume is still super light as we get closer to the end of the week.

This is of course due to the Memorial day holiday next Monday. It's a perfect time to trap bulls over the long weekend so let's root for a rally here into late Thursday to sucker them in and to put the bears to sleep. If the rally happens and "if" we take out the 2740 area double top then I'd expect that 2750-2755 gap zone to be the upside target. That would throw off the wave count but I'm fine with that as I still think a move up into that level should be an "exhaustion" move and therefore shorted.

If it happens then it should still be the end of the rally up and start the wave 1 down from that level into Friday morning. Then we'd see the wave 2 up into the close Friday leaving the bulls will a smile on their face for the week. This "to me" is the ideal scenario as would shock everyone next Tuesday when the market opens after a long weekend with a nice gap down wave 3 happening. But if we only rally back up to make a lower high tomorrow then the wave 3 down could start on Friday... and traders would spot that move, so it's not the best way to trap bulls in my view. But, the wave 3 down could subdivide (usually does anyway) into 5 smaller waves, whereas the smaller wave 1 down of 3 down starts on Friday and then into the close we see the smaller wave 2 up.

That would setup the smaller wave 3 down of 3 down on Tuesday... another ideal setup for the bears. Clearly there are some interesting possibilities here. And I think that the 2740 area top (or the possible 2755 top yet to come) is the end of a large B wave up from the April 2nd low... which means the next set of waves that fall will be in a large C wave down. Not good if you are a bull.

The bottom line here is that a move down of some power (like 80-100 points in total) is very likely to happen into next week. Whether it's started already is the question I can't answer. If we don't see the recent 2740 area taken out by this Friday then it's already started and is in the early stages. If we see it taken out then the next high (probably to fill that 2755 gap) should be the last high for awhile and the start of the next large move down.

ES Morning Update May 22nd 2018

0


Yesterday I was thinking about shorting at the close but decided not to as it just felt that the market wasn't ready to rollover yet. Now that we are up some in the pre-market I'm glad I made that decision. I think we need another strong up day of 20 or 30 points to squeeze out the last bear, exhaust the bulls and hopefully fill that gap overhead. We might not get it today though as the short term charts look pretty overbought right now, so possibly we pullback small today and reset them and make another attempt tomorrow.

The bottom line here is that I'm looking for a move higher to close that gap before I think it will rollover. But it's also about "time", as if the bulls pullback some first (like to 2700 or so) before closing that gap then the next move up could have them "rebooted" with more energy and therefore they could go up higher then just that gap. If you are a bear you really want the bulls to exhaust themselves on the move up each day until they fill that gap. A strong down day before that and the bulls will reboot... not good for the bears. This gap needs to be filled this week I think, and the sooner the better.

Give me a gap fill and then I'll be looking for a 80-100 point down move to follow into the end of next week. As far as wave count, I'm leaning toward the move up from the 2700 recent pullback being a 5th wave of some degree... versus that 2740 to 2700 drop being an A wave down and a B wave up to the present. All I need to see now is that 2740 recent high get taken out and that would kill the ABC wave pattern and support the 5th wave as being most likely correct. Regardless of the wave count short term chart are getting overbought so move down is near. If we don't see that gap filled today then I think we'll see it tomorrow as overbought charts should reset to neutral by the close today if we chop around and don't go anywhere.

ES Morning Update May 21st 2018

0

NOTE:  I'm unable to write my notes on the chart this morning as for some strange reason Jing keeps crashing and that's the software I use to make the screenshot with text boxes.  But I was able to get a screenshot using my pen tablet software called EpicPen but unfortunately there's no way to type text in boxes with it.  It's just a hand writing software that requires the pen to write with.  Naturally I'm not going to even try to hand write all my notes on the screen.  This will be the new "norm" until I can figure out how to get Jing back working or some other software that allows text boxes.

On to this mornings' update..

Looks like we are gaping up this morning as the market likes the tariff news between the US and China... at least that's the most likely thing to blame it on. In reality it was really more based on short term charts being more toward oversold levels versus overbought. Overall the charts are mixed when looking at all time frames, but getting more toward overbought medium term (days to weeks). Longer term (weeks to months) we are coming down from very overbought to neutral so it could dip into oversold this summer if we have a drop to the 2500's or so.

For today though I'm looking for this move up to exhaust itself by the close, which could (should) lead to a pullback starting as early as Tuesday. It might be choppy during the week though as the pullback does it's dance up and down to shake out the weak hands (in Elliottwave it would be the multiple waves 1 and 2 until a 3 of C down starts). The move since the high on 5/14 looks like an A wave down to 2700 on the 15th and we are now in a choppy B wave up of some degree.

This suggests a lower high today then the 2740 start of the A wave down. If it completes today by the close then I'd expect a 5 wave move down to make the C wave, with a downside target around 2655-2675... basically somewhere where the falling orange trendline hits to the rising blue trendline and horizontal green trendline. The alternate EW count would be that we make a higher high (preferred really as I think that will increase the odds on the down move). If so, then the 2740 to 2700 move was some kind of wave 4 down and the move up would be the 5th wave to end the pattern.

Not sure on the smaller wave counts inside that 5th wave but they commonly breakdown into 5 waves. So hopefully we can count them cleanly if we rally up all day to 2750 or more? This wave count would be preferred by me as it would make the drop larger as the downside targets will still be the same no matter what wave count happens. Therefore, today is an important day for the bears with either wave count.

Odds favor a down move starting tomorrow with either count but the "higher high" is the one with the best odds. As far as the down move... it could all happen this week by Friday? Hard too say for sure but it's possible. Going into the end of the month is usually where you'll see this weakness happen... at least for the month of May. So possibly this gets dragged out into next week, but that's the overall plan that I will happen.

ES Morning Update May 18th 2018

0


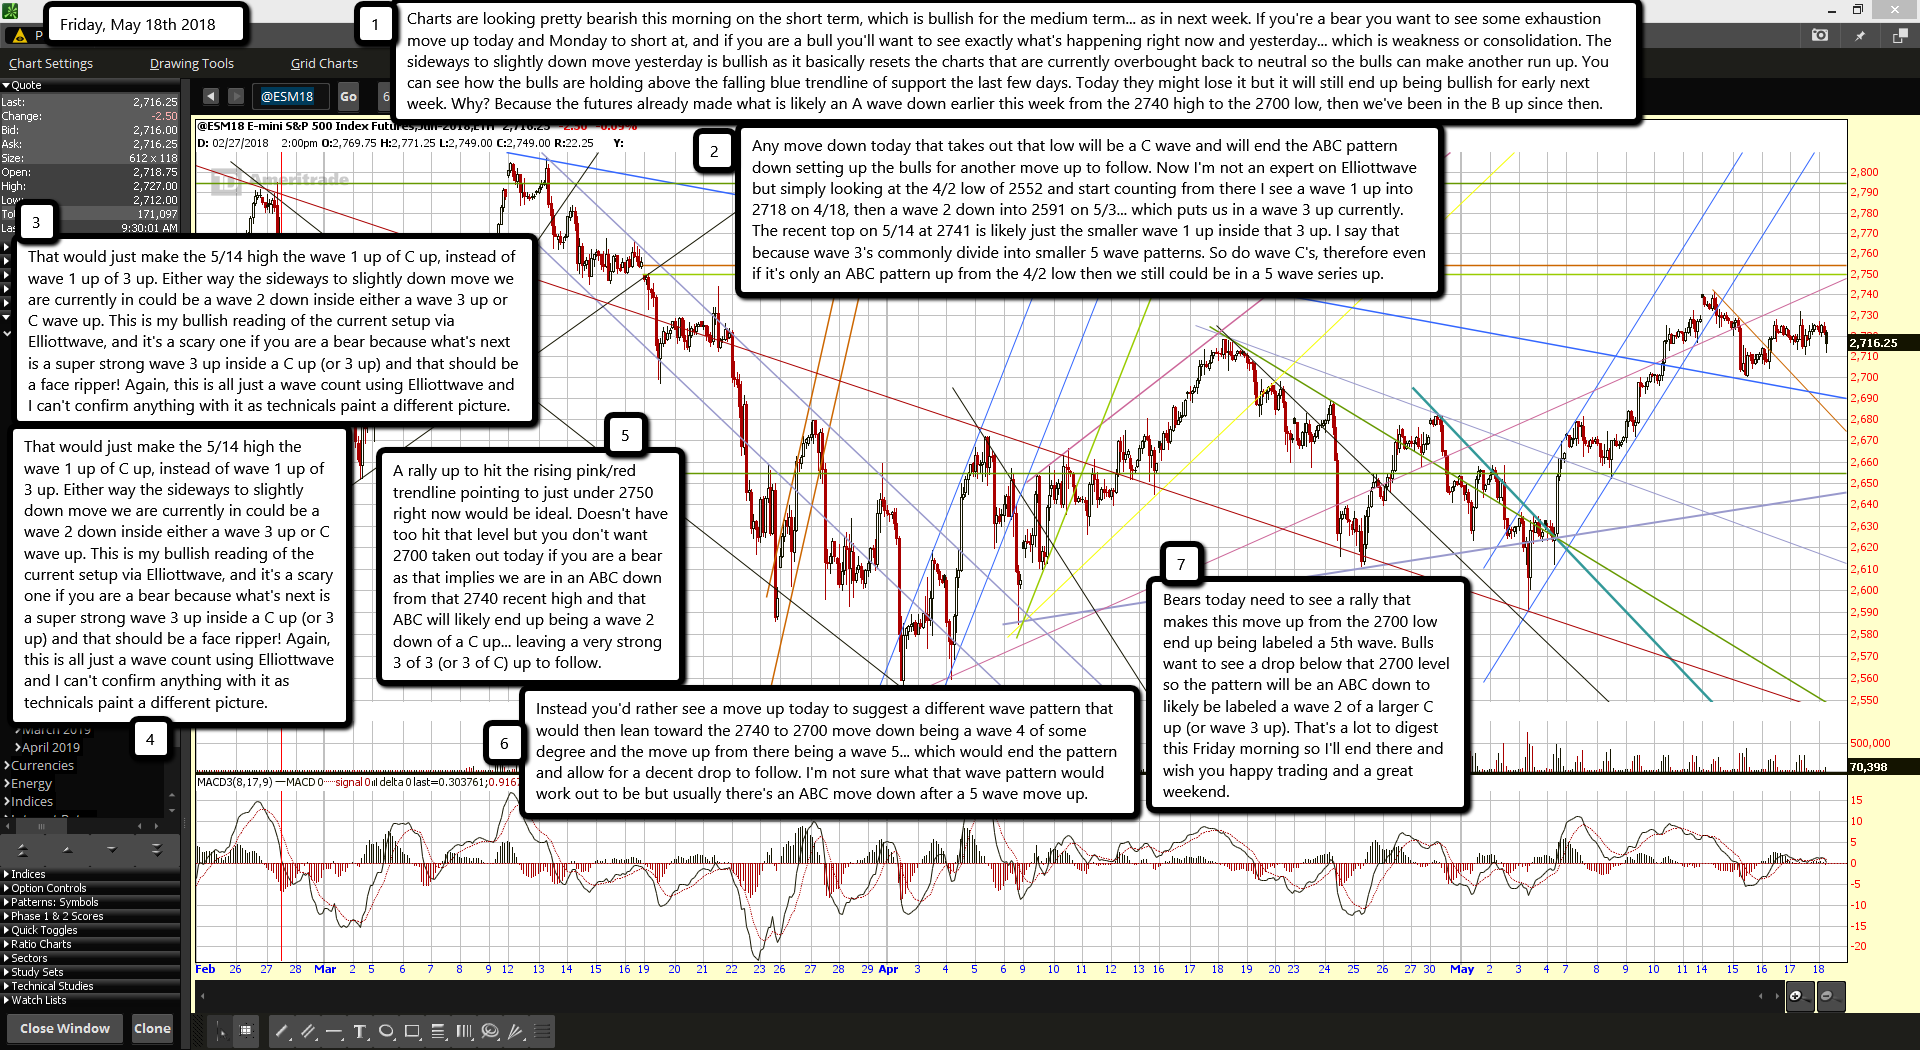
Charts are looking pretty bearish this morning on the short term, which is bullish for the medium term... as in next week. If you're a bear you want to see some exhaustion move up today and Monday to short at, and if you are a bull you'll want to see exactly what's happening right now and yesterday... which is weakness or consolidation. The sideways to slightly down move yesterday is bullish as it basically resets the charts that are currently overbought back to neutral so the bulls can make another run up. You can see how the bulls are holding above the falling blue trendline of support the last few days. Today they might lose it but it will still end up being bullish for early next week. Why? Because the futures already made what is likely an A wave down earlier this week from the 2740 high to the 2700 low, then we've been in the B up since then.

Any move down today that takes out that low will be a C wave and will end the ABC pattern down setting up the bulls for another move up to follow. Now I'm not an expert on Elliottwave but simply looking at the 4/2 low of 2552 and start counting from there I see a wave 1 up into 2718 on 4/18, then a wave 2 down into 2591 on 5/3... which puts us in a wave 3 up currently. The recent top on 5/14 at 2741 is likely just the smaller wave 1 up inside that 3 up. I say that because wave 3's commonly divide into smaller 5 wave patterns. So do wave C's, therefore even if it's only an ABC pattern up from the 4/2 low then we still could be in a 5 wave series up.

That would just make the 5/14 high the wave 1 up of C up, instead of wave 1 up of 3 up. Either way the sideways to slightly down move we are currently in could be a wave 2 down inside either a wave 3 up or C wave up. This is my bullish reading of the current setup via Elliottwave, and it's a scary one if you are a bear because what's next is a super strong wave 3 up inside a C up (or 3 up) and that should be a face ripper! Again, this is all just a wave count using Elliottwave and I can't confirm anything with it as technicals paint a different picture.

They show an overbought daily chart (on the SPX) with Stochastic's up in the high 80's that are rolling over, histogram bars with lower peaks (negative divergence), and the price level up at the top range of the bollinger bands. Usually that means a pullback to the middle is coming to normalize the price zone. The MACD's however are only around positive 10, which isn't too high as many prior peaks were up between 20 and 30. Anyway, from a bears point of view you'll want more overbought charts on more time frames and for that we'll need an up day today and Monday to get it overbought enough in my opinion for a nice drop to follow.

A rally up to hit the rising pink/red trendline pointing to just under 2750 right now would be ideal. Doesn't have too hit that level but you don't want 2700 taken out today if you are a bear as that implies we are in an ABC down from that 2740 recent high and that ABC will likely end up being a wave 2 down of a C up... leaving a very strong 3 of 3 (or 3 of C) up to follow.

Instead you'd rather see a move up today to suggest a different wave pattern that would then lean toward the 2740 to 2700 move down being a wave 4 of some degree and the move up from there being a wave 5... which would end the pattern and allow for a decent drop to follow. I'm not sure what that wave pattern would work out to be but usually there's an ABC move down after a 5 wave move up.

Bears today need to see a rally that makes this move up from the 2700 low end up being labeled a 5th wave. Bulls want to see a drop below that 2700 level so the pattern will be an ABC down to likely be labeled a wave 2 of a larger C up (or wave 3 up). That's a lot to digest this Friday morning so I'll end there and wish you happy trading and a great weekend.

ES Morning Update May 17th 2018

0


Looking at the charts this morning I think we had a wave 4 down on Tuesday, then started the wave 5 up yesterday. Wave 5's are usually 5 wave patterns inside them, or just a straight single wave. Breaking it down into those smaller waves I think we had the wave 1 up and 2 down on Tuesday, then the 3 up yesterday, leaving the 4 down happening right now. If they can turn this back up at some point today and rally up into the close then that should be the smaller wave 5 up to complete the 5th pattern.

It would be great to see them close that 2750-2755 gap zone with the 5th wave but that's yet to be known. Possibly they chop all day on this smaller wave 4 down inside 5 up and push out the 5 of 5 up until Friday? From a tricky point of view that would certainly be one as then they could gap it down over the weekend for the open on Monday with everyone stuck long.

It's unknown how they are going to play this out but my gut tells me they won't fill that gap on this current rally up from the 2592 low but instead sell off and delay the filling of the gap until the next trip back up, which that time I suspect it will go through it and keep going. But who knows when that "next time" will be?

For now I'm just looking for a move up today to complete the smaller wave 5 of the 5th wave, and a green close on the market up near that high. Give me those two thing.... say +5 points SPX or more at the close, and I'll be a bear into Friday. Otherwise I'll be just watching as I need the proper setup to happen to increase the odds enough for me to take the trade. Without it I'd just be gambling and I've done plenty of that already with little success.

ES Morning Update May 16th 2018

0


Looks like a flat open here this morning. I added a new falling trendline in orange and that's where the overnight move up stopped at. Now it's stuck between that falling resistance and the falling support from the blue trendline. It's looking a lot like all the other peaks and drops do from the last month or so, whereas the first move down (yesterday) is followed by some sideways action then another drop followed by a fake out move up that's lower then the previous days' high. Then the next day produces the larger drop of the whole move. If this pattern continues we should have another drop today or tomorrow that is followed by a quick rebound that goes up a hair lower then todays high.

After that we should see the bigger drop, which might be this Friday or next Monday. Either way it's looking likely that we'll get a drop in the next few days. My focus today will be to see if the falling orange trendline holds back the bulls or if they bust it and do that "lower high" move up today instead of tomorrow or the next day. Possibly we chop today into the Apex of the falling orange and blue trendlines and then gap up tomorrow out of them for that lower high... and then start the bigger drop? Either way odds favor the bears here for the next several days. Lets see what they can do.

ES Morning Update May 15th 2018

0


Yesterday was a boring day overall as not much action happened in the market. With summer time around the corner we could see several more months of this... at least until late summer where large corrections or crashes start. But for today it's looking like another slow day could be upon us. Yesterdays' move down to the rising pink/red trendline was about all I really expected for a Monday, but today we could see a little more. While it's hard too see on this 2 hour chart we had an ABC move down yesterday, which I think isn't done as it's really too small. I'm thinking we'll have another move down today to the falling blue trendline pointing to around 2700 to finish this ABC pattern down.

I'm not sure how it will look when done as it's a sloppy looking wave pattern right now. Regardless of what it ends up looking like (or morphing into) I think we have a little more down coming today before another move back up. The question then will be... will the move back up make another higher high or lower high? That's a hard one to call so we'll just have to wait and see I guess. For now though we do have some clues for the low. I see FP on IWM from 5/11 showing a low of 157.69 and we are already over halfway down there this premaket morning.

My guess is that will be the bottom of this down move on not only IWM but the SPY and of course the ES/SPX as well. Strangely it could easily line up with around 2700 on the ES as well. So, there you have it. A likely target to end a move down and go long at. Of course it's common for them to pierce through FP's so that should be expected too. And if by the time the market opens it's already at the FP then the signal may not mean anything more then that it was an "opening target" and NOT necessarily a bottom. I've seen times where it will open at a FP and keep going in whatever direction without turning the other way.

Still though, I'm more inclined to think that we will turn back up at the falling blue trendline of support which is around 2700 right now. Right below it is a horizontal range of trading from 5/9 to early 5/10 where the market bounced between 2695 and 2700, so a pierce of 2700 could easily happen. It's common for SkyNet to pierce trendlines these days before reversing as it knows we sheep have access now to charting that we didn't prior, so the more people that draw that same trendline and put stops there the more likely it will be pierced.

ES Morning Update May 14th 2018

0


I hope everyone had a great weekend and enjoyed time with your mother for "Mothers Day". I don't expect much action this week in the market, at least not early on. It's pretty clear the futures want to fill that gap up around 2755 but with charts being so overbought short term there's likely to be several attempts made to reach it. Today looks more likely to pullback some to a lower support level, which for today might only be the rising light pink (red?) trendline that just a few points below where we are currently at right now. The horizontal chop zone is a hair below it around 2720 or so, which would be a pierce of that trendline and another likely target today.

But we might need two days of a slight pullback to consolidate before moving higher again, and the lower target would be the 2700 level... which is where the blue falling trendline is pointing to today (but will be a little lower tomorrow). My guess is that we'll see some kind of ABC move down into that area and then back up later in the week to fill that 2755 gap. Then the tricky moves should start as everyone see's the gap and will short it when it gets filled. So I expect something tricky around that period. Maybe a strong pierce through it to 2770 area, or possibly just hit it once, then pullback a day and go back up and hit it again? Hard too know for sure but we'll guess at it again when we get closer to that period. Not much more I can think of to add for this mornings' update so I'll leave it at that.

ES Morning Update May 11th 2018

0


Yesterday the bulls did indeed make it up to that 2720 area and of course pushed through the many trendlines intersecting that area. But they died out shortly there after as either the bears placed their stops lower and the bulls ran them all, or the stops are place over 2720 and the bulls couldn't over come them. Either way the rally died out and that's that. This morning we have negative divergence on the 60 minute chart with a lower MACD high on this move up, so unless they go for triple divergence the bulls should take a breather today. Of course that doesn't mean we are going to drop hard, it only means that odds favor sideways all day today or down some.

The falling blue trendline will act as support now and it's pointing to 2710 or so, and then there's the even number level of 2700 that will be good support below that. I don't see that taken out but view it as possible for being hit. Above we see that gap fill area around 2755 that every bull and bear know well. Will it get filled next week and rollover, or will there be a "close but no cigar" move up to it where it rolls over without the bears getting short or the bulls exiting their longs?

Only time will tell. The bulls still have the advantage today and can squeeze higher if they want, but odds favor a "pause" day or slight pullback. If we see that pullback today there will be bears that flip to bulls and go long expecting that gap fill area next week... which is what is needed for the next move up to "top out" the bulls and allow another move down. Or a continued move up today into that area would also work as bears would keep shorting today and getting squeezed as it moves on up to that gap fill. Of course when it gets close the bears will stop shorting and just wait for the gap to fill first where they will try shorting again.

It's a fine line I'm sure but basically all traders see the same thing and usually react in masses to go short or long based on what they see. SkyNet knows this and uses that data to move the market into areas that fool the masses. I say this as I've noticed over time that many of the trendlines I draw are pierced before reversing the opposite direction. It means that SkyNet also see's those trendlines and all the buy or sell orders there. So, it pierces and takes them all out and then reverses without those traders in a winning position.

What this means with that gap fill area is that everyone see's it and therefore SkyNet has two options... ONE, pierce up through it and hit all the stops the bears placed just slightly above it and then reverse back down. Or TWO, fall short of it and not allow the bears to get short. Then drop back for the next nice move down and make the bears chase it as the bulls keep buying the dip expecting it to rally back up one more time to fill that gap.

It's become a very, very tricky market to trade successfully. You have to rethink everything you think is right. Trendlines you draw get pierced, so adjust for that, level you expect for a reversal fall short, so again... adjust for that. Kinda sounds like we need to "see what SkyNet see's"... right? Wouldn't you love to have that secret? Well, I have it and I'm selling it. Just wire me $1,000,000 to the bank of the Bahamas and I'll give it to you. LOL. Have a great weekend and good luck gambling today.

ES Morning Update May 10th 2018

0


The market keeps on grinding up this morning in what should be a 5th wave. And unless some news comes out to scare it I don't see any reason for it to sell off today. It's still in the rising blue channel of support but coming up into a tough resistance zone overhead. I don't see it getting through it on the first hit, so an ABC move down seems likely to start as early as tomorrow but might be pushed out until Monday.

Everything looks pretty good for the bulls right now, and even on the pullback to retrace maybe 50% of the move up from 2590 it would just be more bullish as it would make the right shoulder of an inverted head and shoulders pattern. The rising purple trendline points to around 2635 or so, and has a light purple falling trendline pointing to the same area. A move down into that zone next week would set the bulls up nicely.

But I'm getting ahead of myself as we haven't finished the up move yet. We can see a rising light red trendline and a falling blue trendline both pointing to around 2710, as well as the lower rising trendline in the blue channel. Plus that happens to be a double top area from 4/18, so I doubt if we get through it today. I really don't see the bulls taking it out at all on this attempt.

They are on wave 5 up and many trendlines of resistance intersecting there, so odds are low for them getting past it. However, if enough bears where to short that area and placed enough stop orders say at 2720 and above then if the bulls could just hit that first stop they could squeeze on up through it. I give it very low odds but nothing surprises me anymore in this market but the constant impossible moves... LOL. Anyway, that all I see for today... more grind until the channel breaks and started the pullback.

s2Member®