Saturday, July 25, 2026
Home Blog Page 48

ES Morning Update May 9th 2018

0


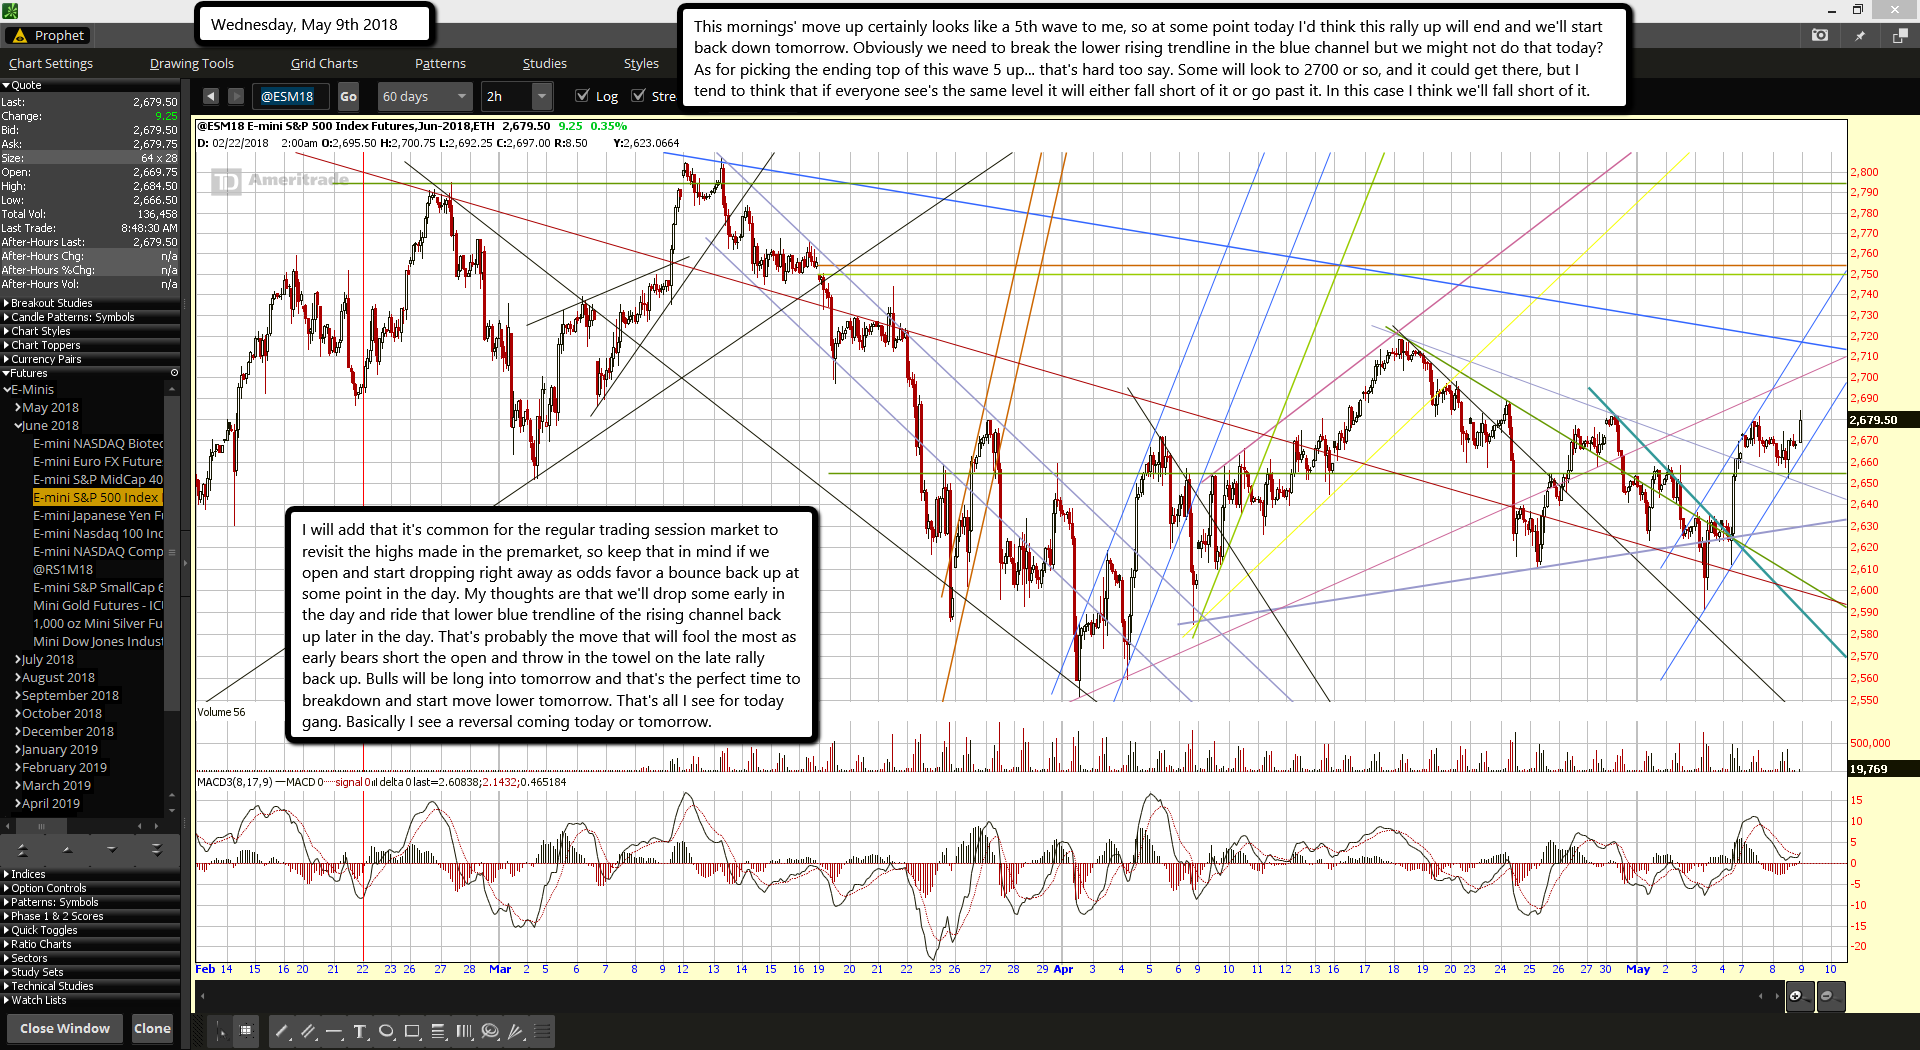
This mornings' move up certainly looks like a 5th wave to me, so at some point today I'd think this rally up will end and we'll start back down tomorrow. Obviously we need to break the lower rising trendline in the blue channel but we might not do that today? As for picking the ending top of this wave 5 up... that's hard too say. Some will look to 2700 or so, and it could get there, but I tend to think that if everyone see's the same level it will either fall short of it or go past it. In this case I think we'll fall short of it.

I will add that it's common for the regular trading session market to revisit the highs made in the premarket, so keep that in mind if we open and start dropping right away as odds favor a bounce back up at some point in the day. My thoughts are that we'll drop some early in the day and ride that lower blue trendline of the rising channel back up later in the day. That's probably the move that will fool the most as early bears short the open and throw in the towel on the late rally back up. Bulls will be long into tomorrow and that's the perfect time to breakdown and start move lower tomorrow. That's all I see for today gang. Basically I see a reversal coming today or tomorrow.

ES Morning Update May 8th 2018

0


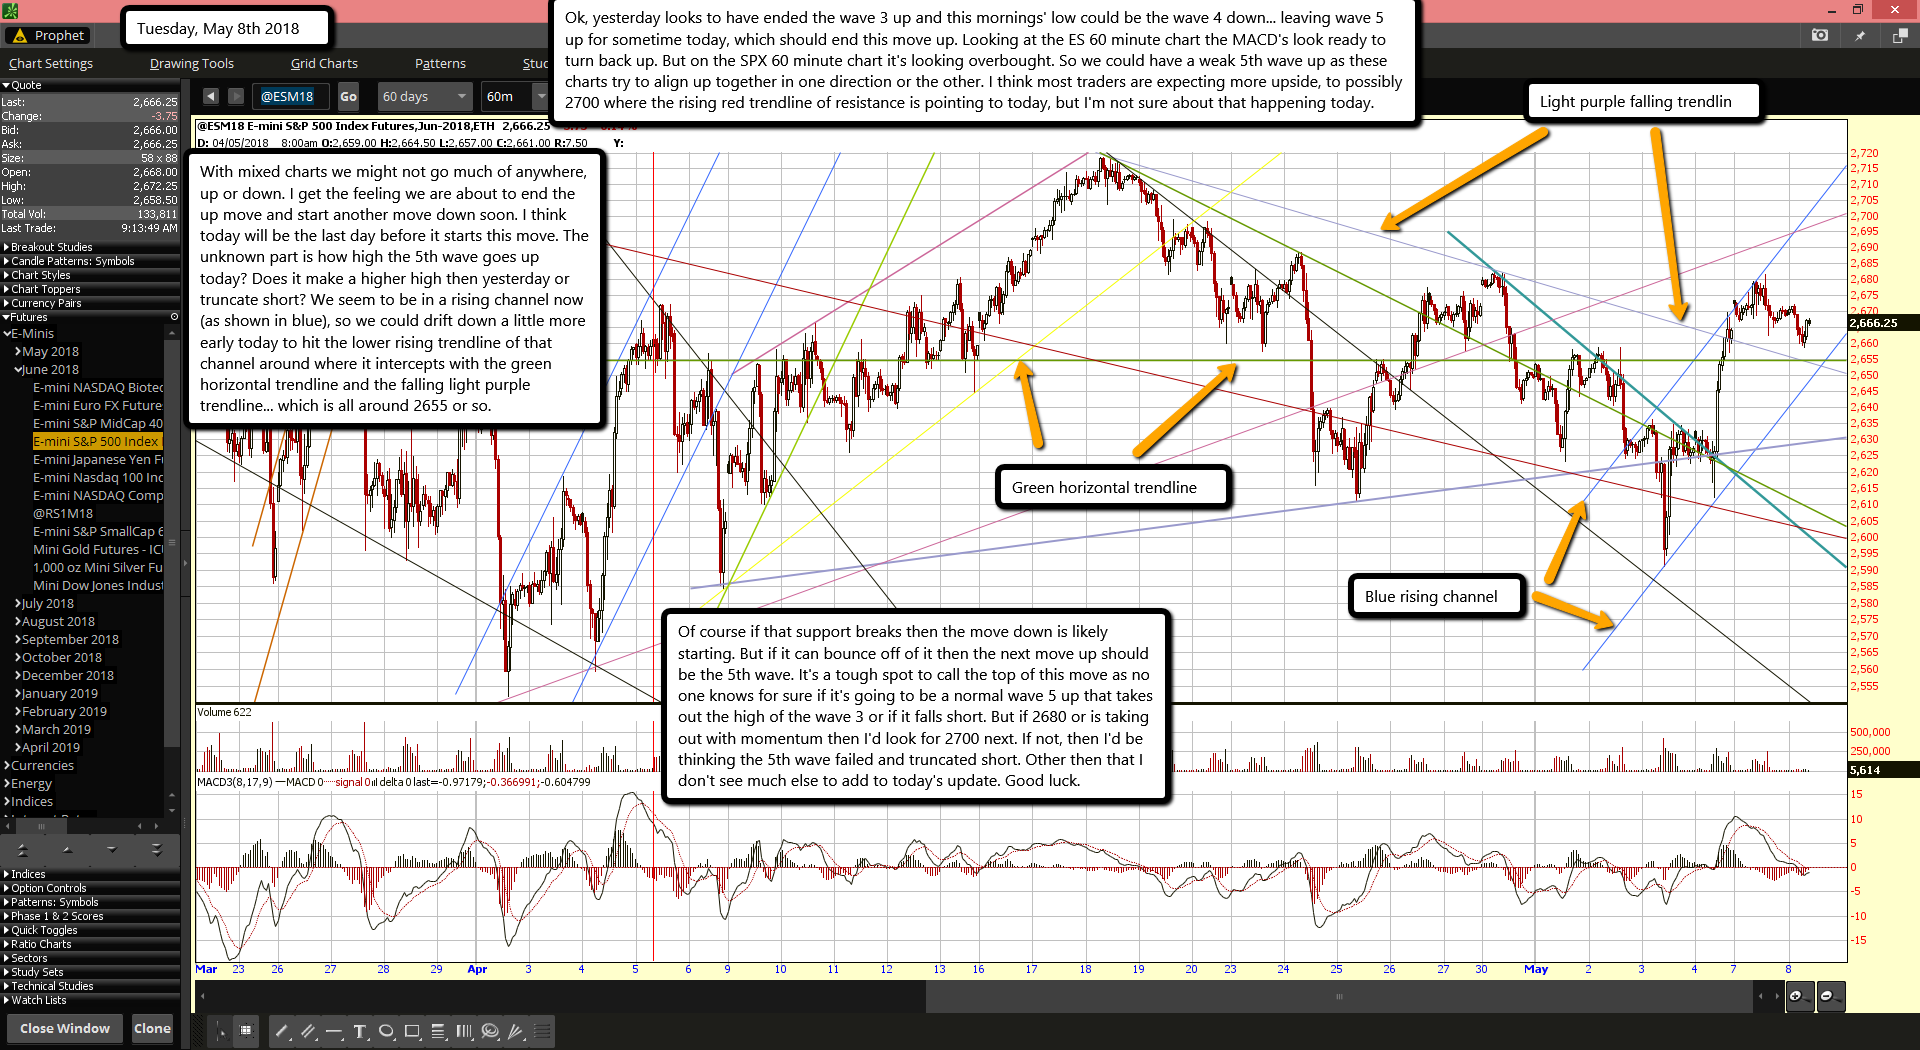
Ok, yesterday looks to have ended the wave 3 up and this mornings' low could be the wave 4 down... leaving wave 5 up for sometime today, which should end this move up. Looking at the ES 60 minute chart the MACD's look ready to turn back up. But on the SPX 60 minute chart it's looking overbought. So we could have a weak 5th wave up as these charts try to align up together in one direction or the other. I think most traders are expecting more upside, to possibly 2700 where the rising red trendline of resistance is pointing to today, but I'm not sure about that happening today.

With mixed charts we might not go much of anywhere, up or down. I get the feeling we are about to end the up move and start another move down soon. I think today will be the last day before it starts this move. The unknown part is how high the 5th wave goes up today? Does it make a higher high then yesterday or truncate short? We seem to be in a rising channel now (as shown in blue), so we could drift down a little more early today to hit the lower rising trendline of that channel around where it intercepts with the green horizontal trendline and the falling light purple trendline... which is all around 2655 or so.

Of course if that support breaks then the move down is likely starting. But if it can bounce off of it then the next move up should be the 5th wave. It's a tough spot to call the top of this move as no one knows for sure if it's going to be a normal wave 5 up that takes out the high of the wave 3 or if it falls short. But if 2680 or is taking out with momentum then I'd look for 2700 next. If not, then I'd be thinking the 5th wave failed and truncated short. Other then that I don't see much else to add to today's update. Good luck.

ES Morning Update May 7th 2018

0


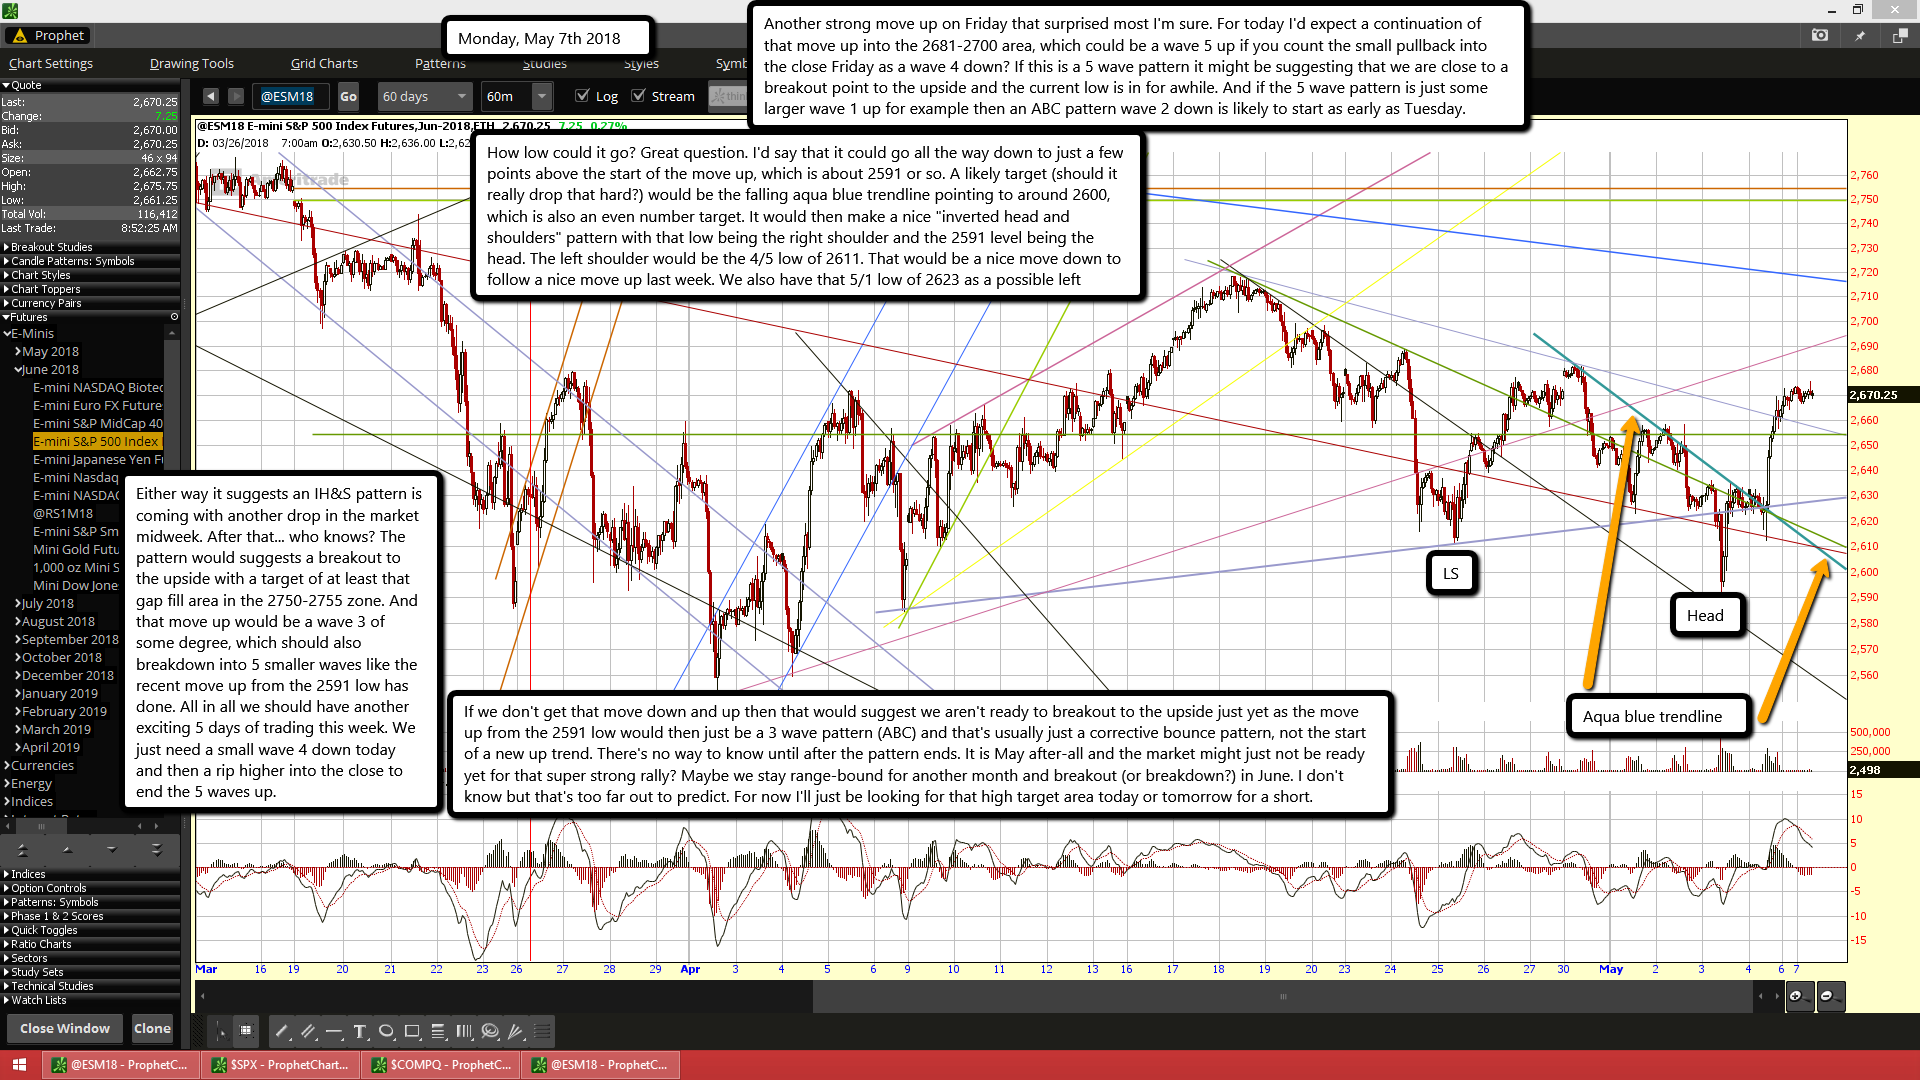
Another strong move up on Friday that surprised most I'm sure. For today I'd expect a continuation of that move up into the 2681-2700 area, which could be a wave 5 up if you count the small pullback into the close Friday as a wave 4 down? If this is a 5 wave pattern it might be suggesting that we are close to a breakout point to the upside and the current low is in for awhile. And if the 5 wave pattern is just some larger wave 1 up for example then an ABC pattern wave 2 down is likely to start as early as Tuesday.

How low could it go? Great question. I'd say that it could go all the way down to just a few points above the start of the move up, which is about 2591 or so. A likely target (should it really drop that hard?) would be the falling aqua blue trendline pointing to around 2600, which is also an even number target. It would then make a nice "inverted head and shoulders" pattern with that low being the right shoulder and the 2591 level being the head. The left shoulder would be the 4/5 low of 2611. That would be a nice move down to follow a nice move up last week. We also have that 5/1 low of 2623 as a possible left shoulder to?

Either way it suggests an IH&S pattern is coming with another drop in the market midweek. After that... who knows? The pattern would suggests a breakout to the upside with a target of at least that gap fill area in the 2750-2755 zone. And that move up would be a wave 3 of some degree, which should also breakdown into 5 smaller waves like the recent move up from the 2591 low has done. All in all we should have another exciting 5 days of trading this week. We just need a small wave 4 down today and then a rip higher into the close to end the 5 waves up.

If we don't get that move down and up then that would suggest we aren't ready to breakout to the upside just yet as the move up from the 2591 low would then just be a 3 wave pattern (ABC) and that's usually just a corrective bounce pattern, not the start of a new up trend. There's no way to know until after the pattern ends. It is May after-all and the market might just not be ready yet for that super strong rally? Maybe we stay range-bound for another month and breakout (or breakdown?) in June. I don't know but that's too far out to predict. For now I'll just be looking for that high target area today or tomorrow for a short.

ES Morning Update May 4th 2018

0


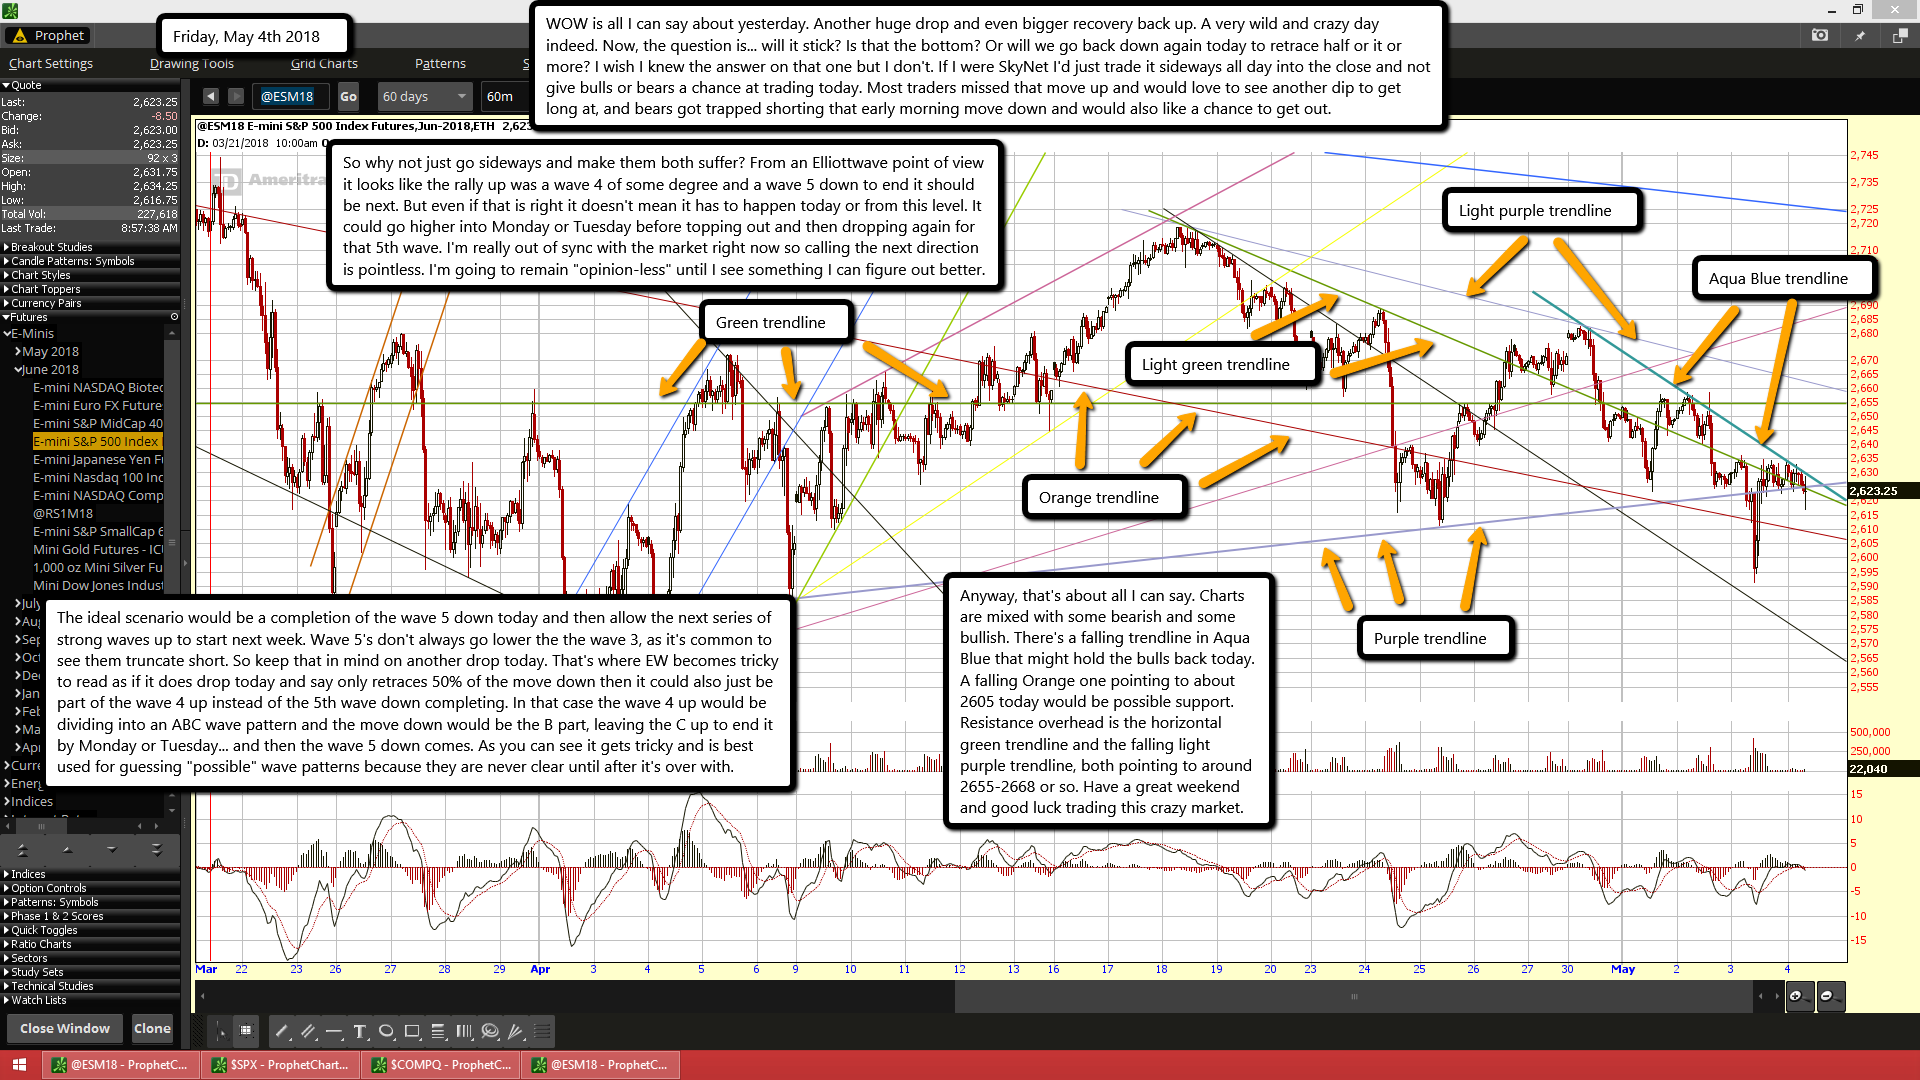
WOW is all I can say about yesterday. Another huge drop and even bigger recovery back up. A very wild and crazy day indeed. Now, the question is... will it stick? Is that the bottom? Or will we go back down again today to retrace half or it or more? I wish I knew the answer on that one but I don't. If I were SkyNet I'd just trade it sideways all day into the close and not give bulls or bears a chance at trading today. Most traders missed that move up and would love to see another dip to get long at, and bears got trapped shorting that early morning move down and would also like a chance to get out.

So why not just go sideways and make them both suffer? From an Elliottwave point of view it looks like the rally up was a wave 4 of some degree and a wave 5 down to end it should be next. But even if that is right it doesn't mean it has to happen today or from this level. It could go higher into Monday or Tuesday before topping out and then dropping again for that 5th wave. I'm really out of sync with the market right now so calling the next direction is pointless. I'm going to remain "opinion-less" until I see something I can figure out better.

The ideal scenario would be a completion of the wave 5 down today and then allow the next series of strong waves up to start next week. Wave 5's don't always go lower the the wave 3, as it's common to see them truncate short. So keep that in mind on another drop today. That's where EW becomes tricky to read as if it does drop today and say only retraces 50% of the move down then it could also just be part of the wave 4 up instead of the 5th wave down completing. In that case the wave 4 up would be dividing into an ABC wave pattern and the move down would be the B part, leaving the C up to end it by Monday or Tuesday... and then the wave 5 down comes. As you can see it gets tricky and is best used for guessing "possible" wave patterns because they are never clear until after it's over with.

Anyway, that's about all I can say. Charts are mixed with some bearish and some bullish. There's a falling trendline in Aqua Blue that might hold the bulls back today. A falling Orange one pointing to about 2605 today would be possible support. Resistance overhead is the horizontal green trendline and the falling light purple trendline, both pointing to around 2655-2668 or so. Have a great weekend and good luck trading this crazy market.

ES Morning Update May 3rd 2018

0

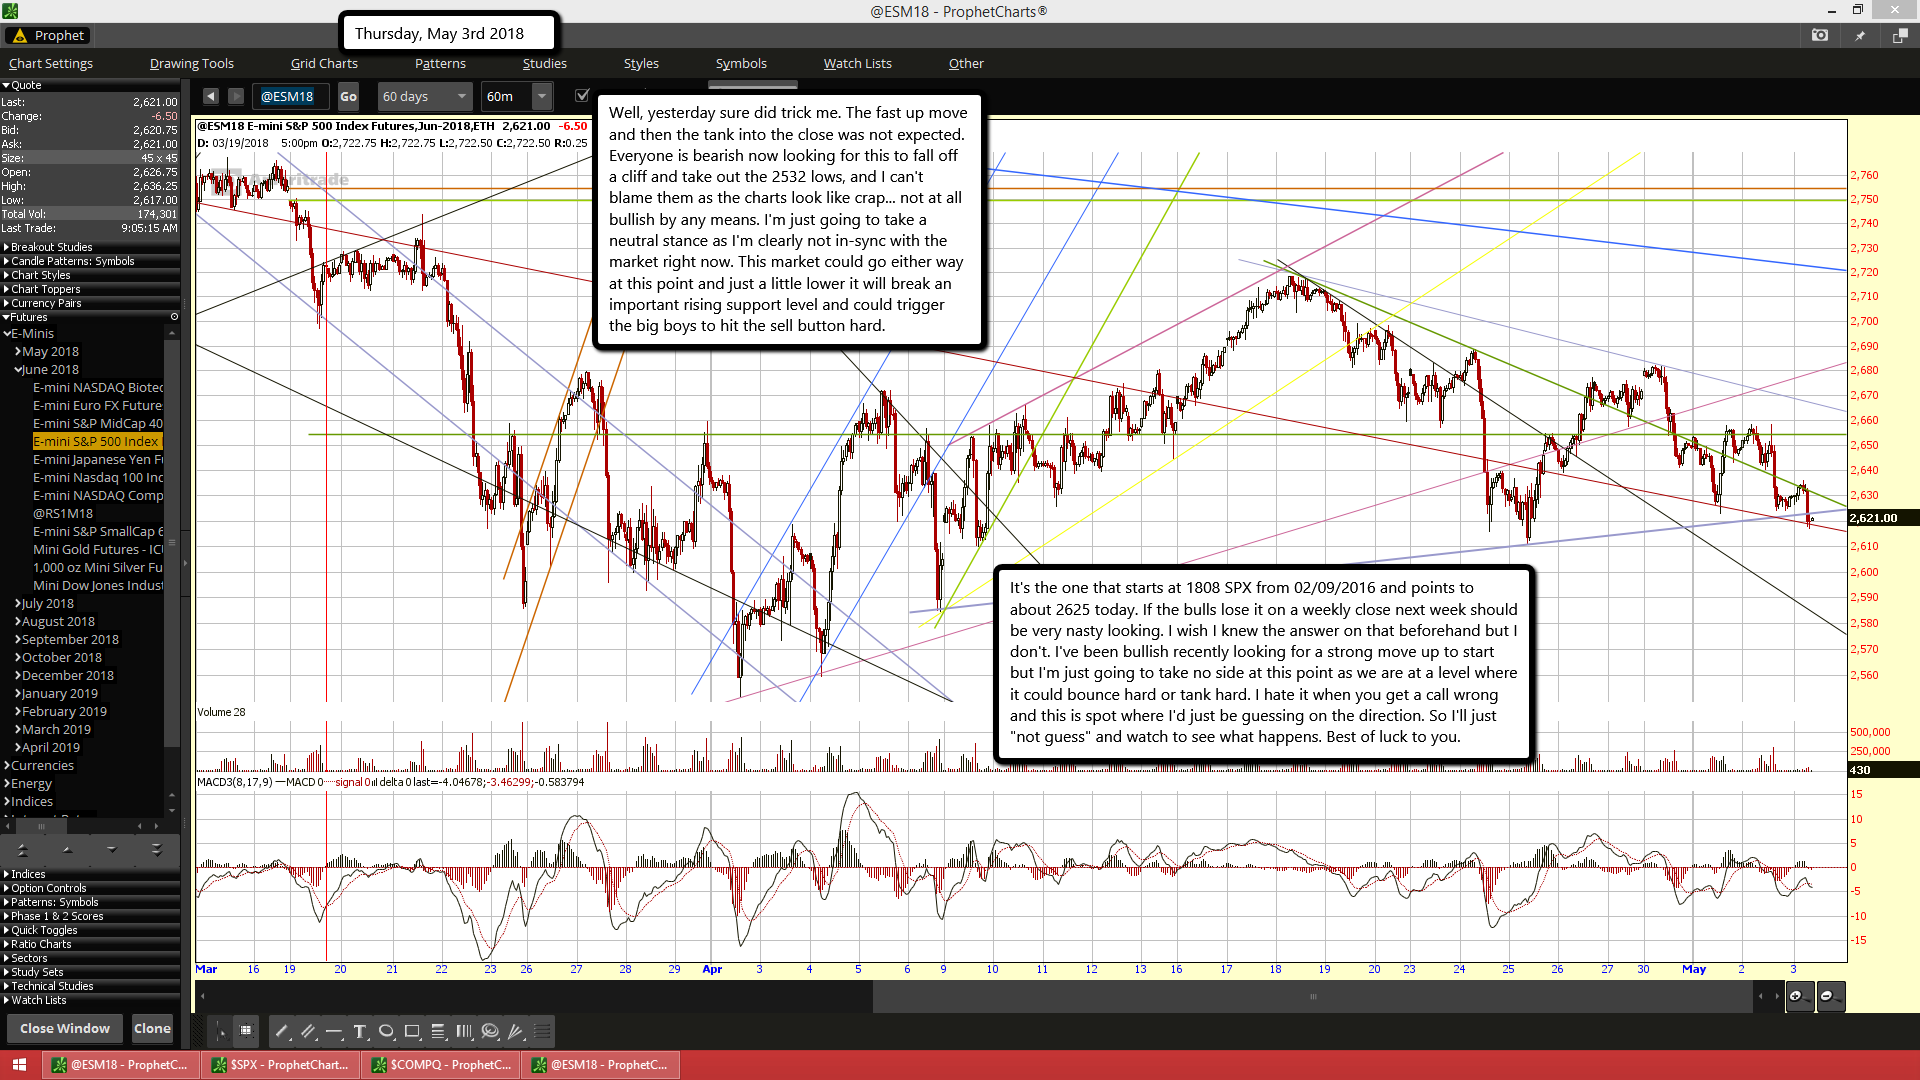
Well, yesterday sure did trick me. The fast up move and then the tank into the close was not expected. Everyone is bearish now looking for this to fall off a cliff and take out the 2532 lows, and I can't blame them as the charts look like crap... not at all bullish by any means. I'm just going to take a neutral stance as I'm clearly not in-sync with the market right now. This market could go either way at this point and just a little lower it will break an important rising support level and could trigger the big boys to hit the sell button hard.

It's the one that starts at 1808 SPX from 02/09/2016 and points to about 2625 today. If the bulls lose it on a weekly close next week should be very nasty looking. I wish I knew the answer on that beforehand but I don't. I've been bullish recently looking for a strong move up to start but I'm just going to take no side at this point as we are at a level where it could bounce hard or tank hard. I hate it when you get a call wrong and this is spot where I'd just be guessing on the direction. So I'll just "not guess" and watch to see what happens. Best of luck to you.

ES Morning Update May 2nd 2018

0


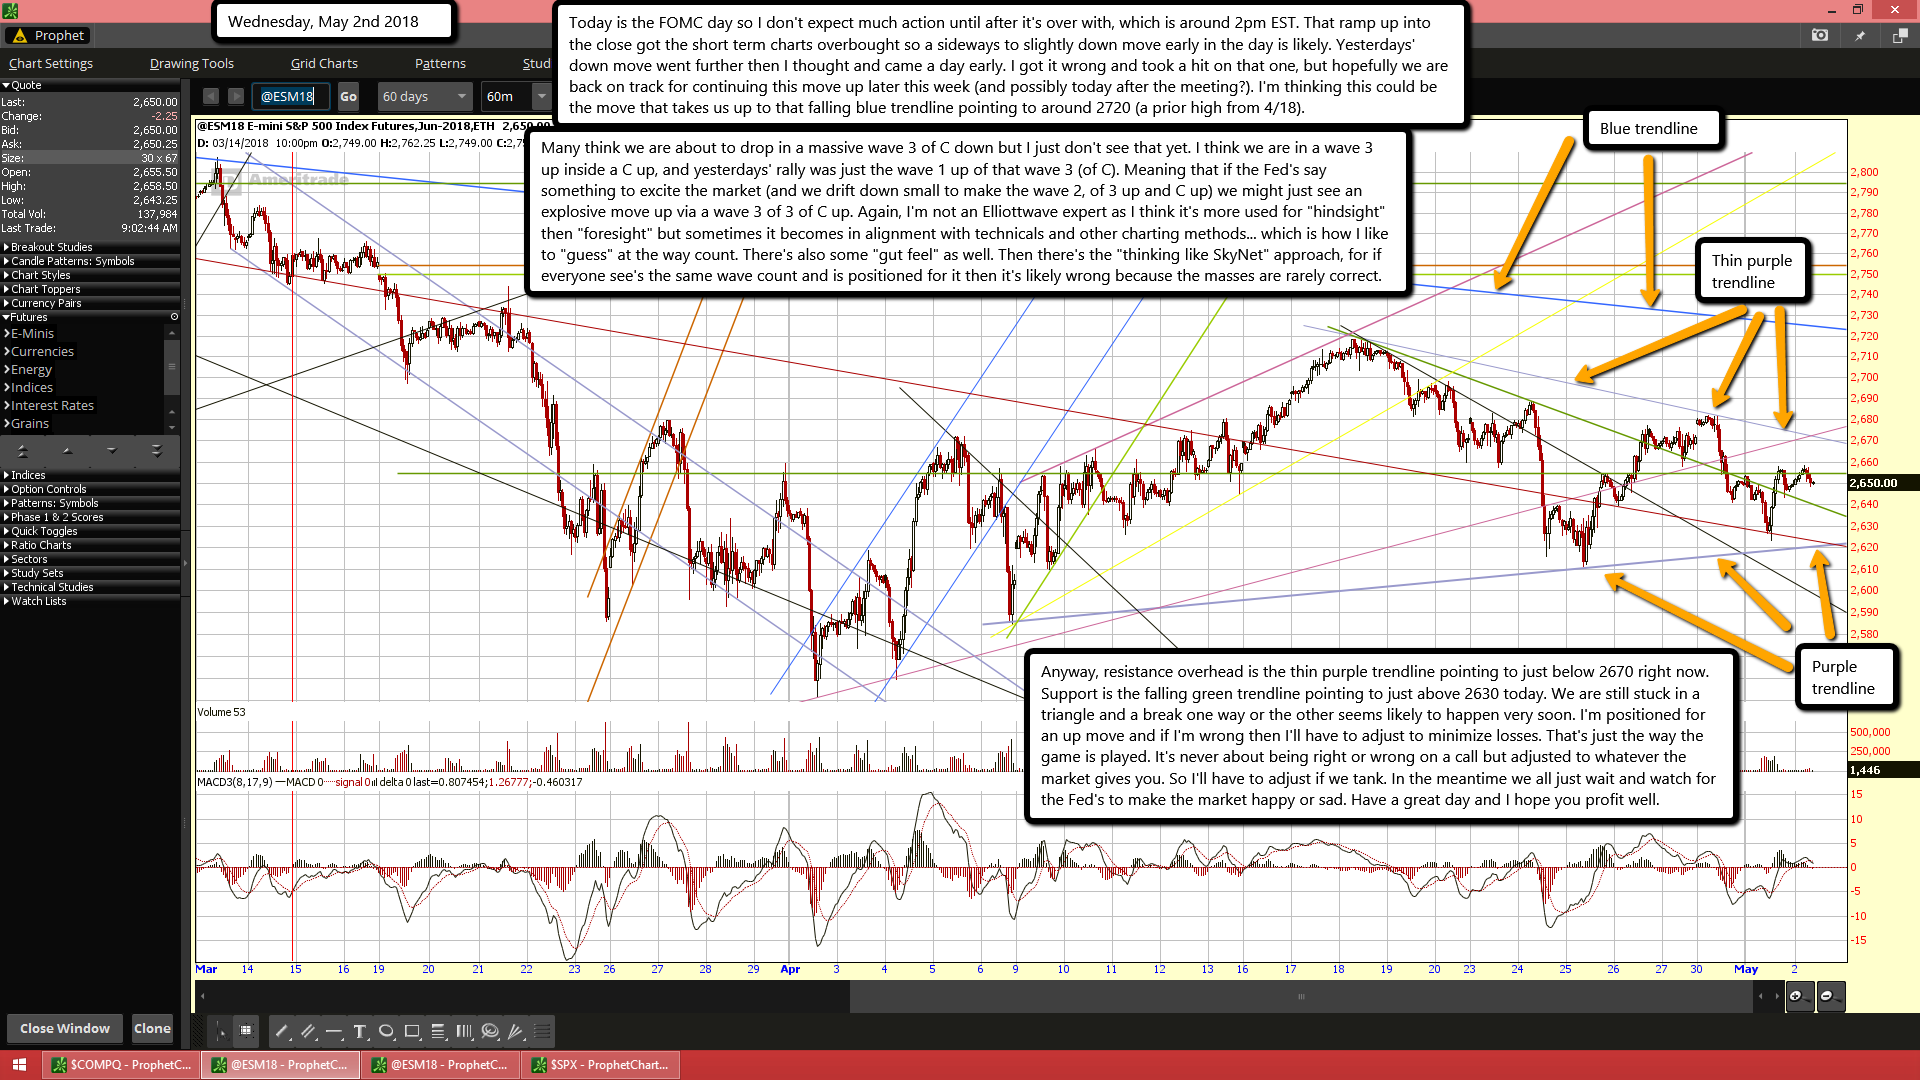
Today is the FOMC day so I don't expect much action until after it's over with, which is around 2pm EST. That ramp up into the close got the short term charts overbought so a sideways to slightly down move early in the day is likely. Yesterdays' down move went further then I thought and came a day early. I got it wrong and took a hit on that one, but hopefully we are back on track for continuing this move up later this week (and possibly today after the meeting?). I'm thinking this could be the move that takes us up to that falling blue trendline pointing to around 2720 (a prior high from 4/18).

Many think we are about to drop in a massive wave 3 of C down but I just don't see that yet. I think we are in a wave 3 up inside a C up, and yesterdays' rally was just the wave 1 up of that wave 3 (of C). Meaning that if the Fed's say something to excite the market (and we drift down small to make the wave 2, of 3 up and C up) we might just see an explosive move up via a wave 3 of 3 of C up. Again, I'm not an Elliottwave expert as I think it's more used for "hindsight" then "foresight" but sometimes it becomes in alignment with technicals and other charting methods... which is how I like to "guess" at the way count. There's also some "gut feel" as well. Then there's the "thinking like SkyNet" approach, for if everyone see's the same wave count and is positioned for it then it's likely wrong because the masses are rarely correct.

Anyway, resistance overhead is the thin purple trendline pointing to just below 2670 right now. Support is the falling green trendline pointing to just above 2630 today. We are still stuck in a triangle and a break one way or the other seems likely to happen very soon. I'm positioned for an up move and if I'm wrong then I'll have to adjust to minimize losses. That's just the way the game is played. It's never about being right or wrong on a call but adjusted to whatever the market gives you. So I'll have to adjust if we tank. In the meantime we all just wait and watch for the Fed's to make the market happy or sad. Have a great day and I hope you profit well.

ES Morning Update May 1st 2018

0


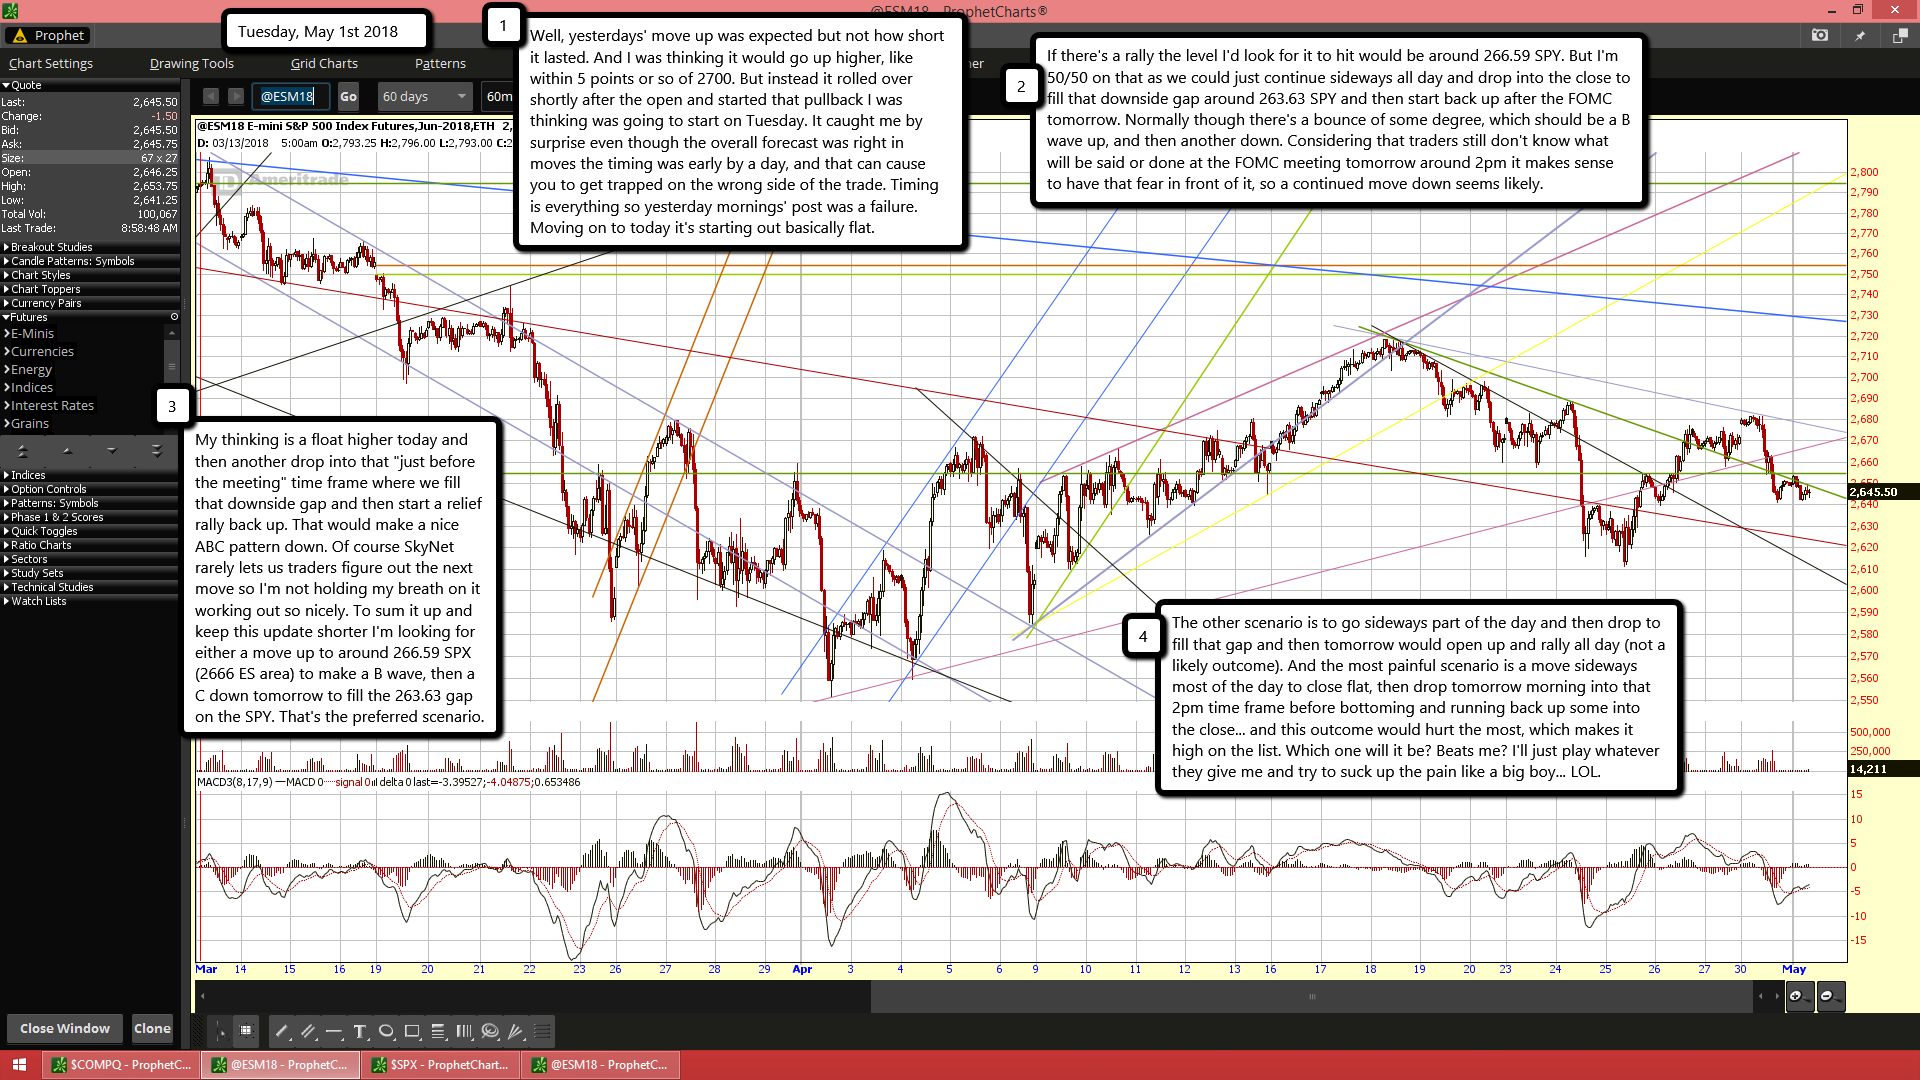
Well, yesterdays' move up was expected but not how short it lasted. And I was thinking it would go up higher, like within 5 points or so of 2700. But instead it rolled over shortly after the open and started that pullback I was thinking was going to start on Tuesday. It caught me by surprise even though the overall forecast was right in moves the timing was early by a day, and that can cause you to get trapped on the wrong side of the trade. Timing is everything so yesterday mornings' post was a failure. Moving on to today it's starting out basically flat.

If there's a rally the level I'd look for it to hit would be around 266.59 SPY. But I'm 50/50 on that as we could just continue sideways all day and drop into the close to fill that downside gap around 263.63 SPY and then start back up after the FOMC tomorrow. Normally though there's a bounce of some degree, which should be a B wave up, and then another down. Considering that traders still don't know what will be said or done at the FOMC meeting tomorrow around 2pm it makes sense to have that fear in front of it, so a continued move down seems likely.

My thinking is a float higher today and then another drop into that "just before the meeting" time frame where we fill that downside gap and then start a relief rally back up. That would make a nice ABC pattern down. Of course SkyNet rarely lets us traders figure out the next move so I'm not holding my breath on it working out so nicely. To sum it up and keep this update shorter I'm looking for either a move up to around 266.59 SPX (2666 ES area) to make a B wave, then a C down tomorrow to fill the 263.63 gap on the SPY. That's the preferred scenario.

The other scenario is to go sideways part of the day and then drop to fill that gap and then tomorrow would open up and rally all day (not a likely outcome). And the most painful scenario is a move sideways most of the day to close flat, then drop tomorrow morning into that 2pm time frame before bottoming and running back up some into the close... and this outcome would hurt the most, which makes it high on the list. Which one will it be? Beats me? I'll just play whatever they give me and try to suck up the pain like a big boy... LOL.

ES Morning Update April 30th 2018

0


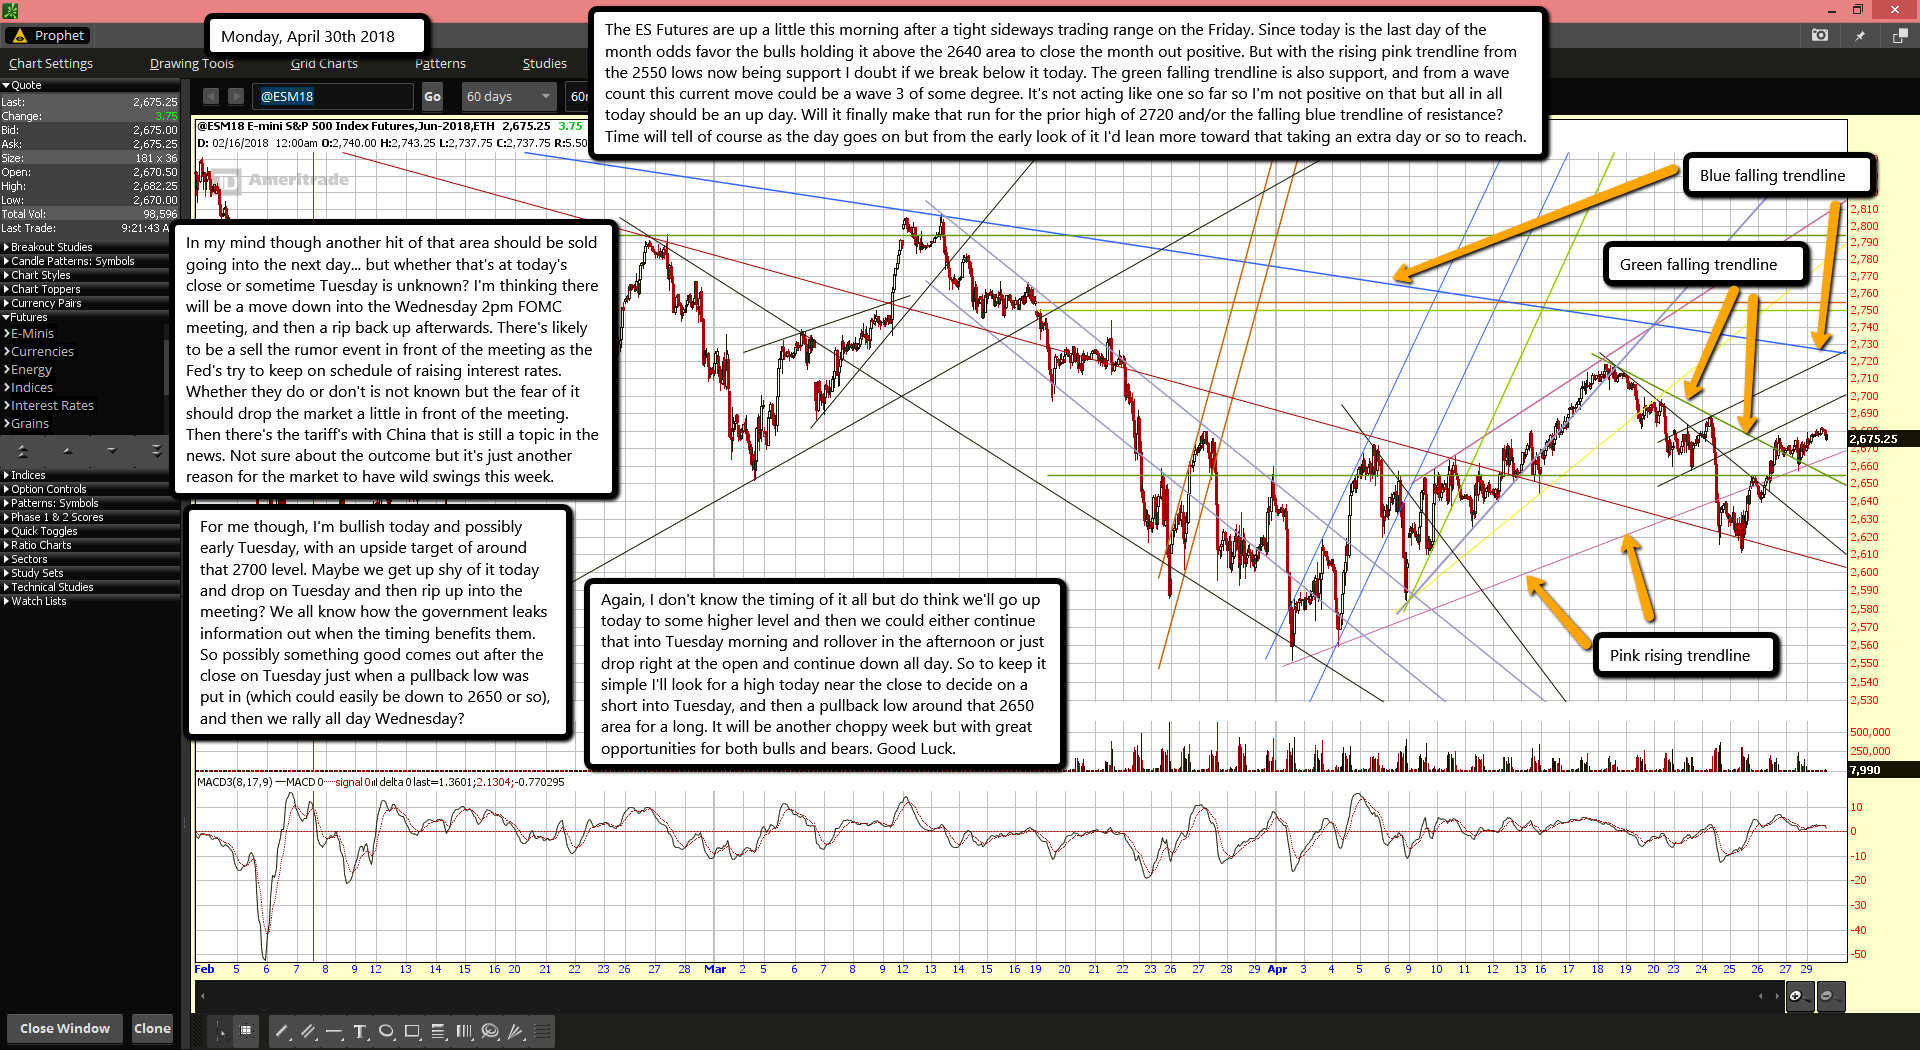
The ES Futures are up a little this morning after a tight sideways trading range on the Friday. Since today is the last day of the month odds favor the bulls holding it above the 2640 area to close the month out positive. But with the rising pink trendline from the 2550 lows now being support I doubt if we break below it today. The green falling trendline is also support, and from a wave count this current move could be a wave 3 of some degree. It's not acting like one so far so I'm not positive on that but all in all today should be an up day. Will it finally make that run for the prior high of 2720 and/or the falling blue trendline of resistance? Time will tell of course as the day goes on but from the early look of it I'd lean more toward that taking an extra day or so to reach.

In my mind though another hit of that area should be sold going into the next day... but whether that's at today's close or sometime Tuesday is unknown? I'm thinking there will be a move down into the Wednesday 2pm FOMC meeting, and then a rip back up afterwards. There's likely to be a sell the rumor event in front of the meeting as the Fed's try to keep on schedule of raising interest rates. Whether they do or don't is not known but the fear of it should drop the market a little in front of the meeting. Then there's the tariff's with China that is still a topic in the news. Not sure about the outcome but it's just another reason for the market to have wild swings this week.

For me though, I'm bullish today and possibly early Tuesday, with an upside target of around that 2700 level. Maybe we get up shy of it today and drop on Tuesday and then rip up into the meeting? We all know how the government leaks information out when the timing benefits them. So possibly something good comes out after the close on Tuesday just when a pullback low was put in (which could easily be down to 2650 or so), and then we rally all day Wednesday?

Again, I don't know the timing of it all but do think we'll go up today to some higher level and then we could either continue that into Tuesday morning and rollover in the afternoon or just drop right at the open and continue down all day. So to keep it simple I'll look for a high today near the close to decide on a short into Tuesday, and then a pullback low around that 2650 area for a long. It will be another choppy week but with great opportunities for both bulls and bears. Good Luck.

ES Morning Update April 27th 2018

0

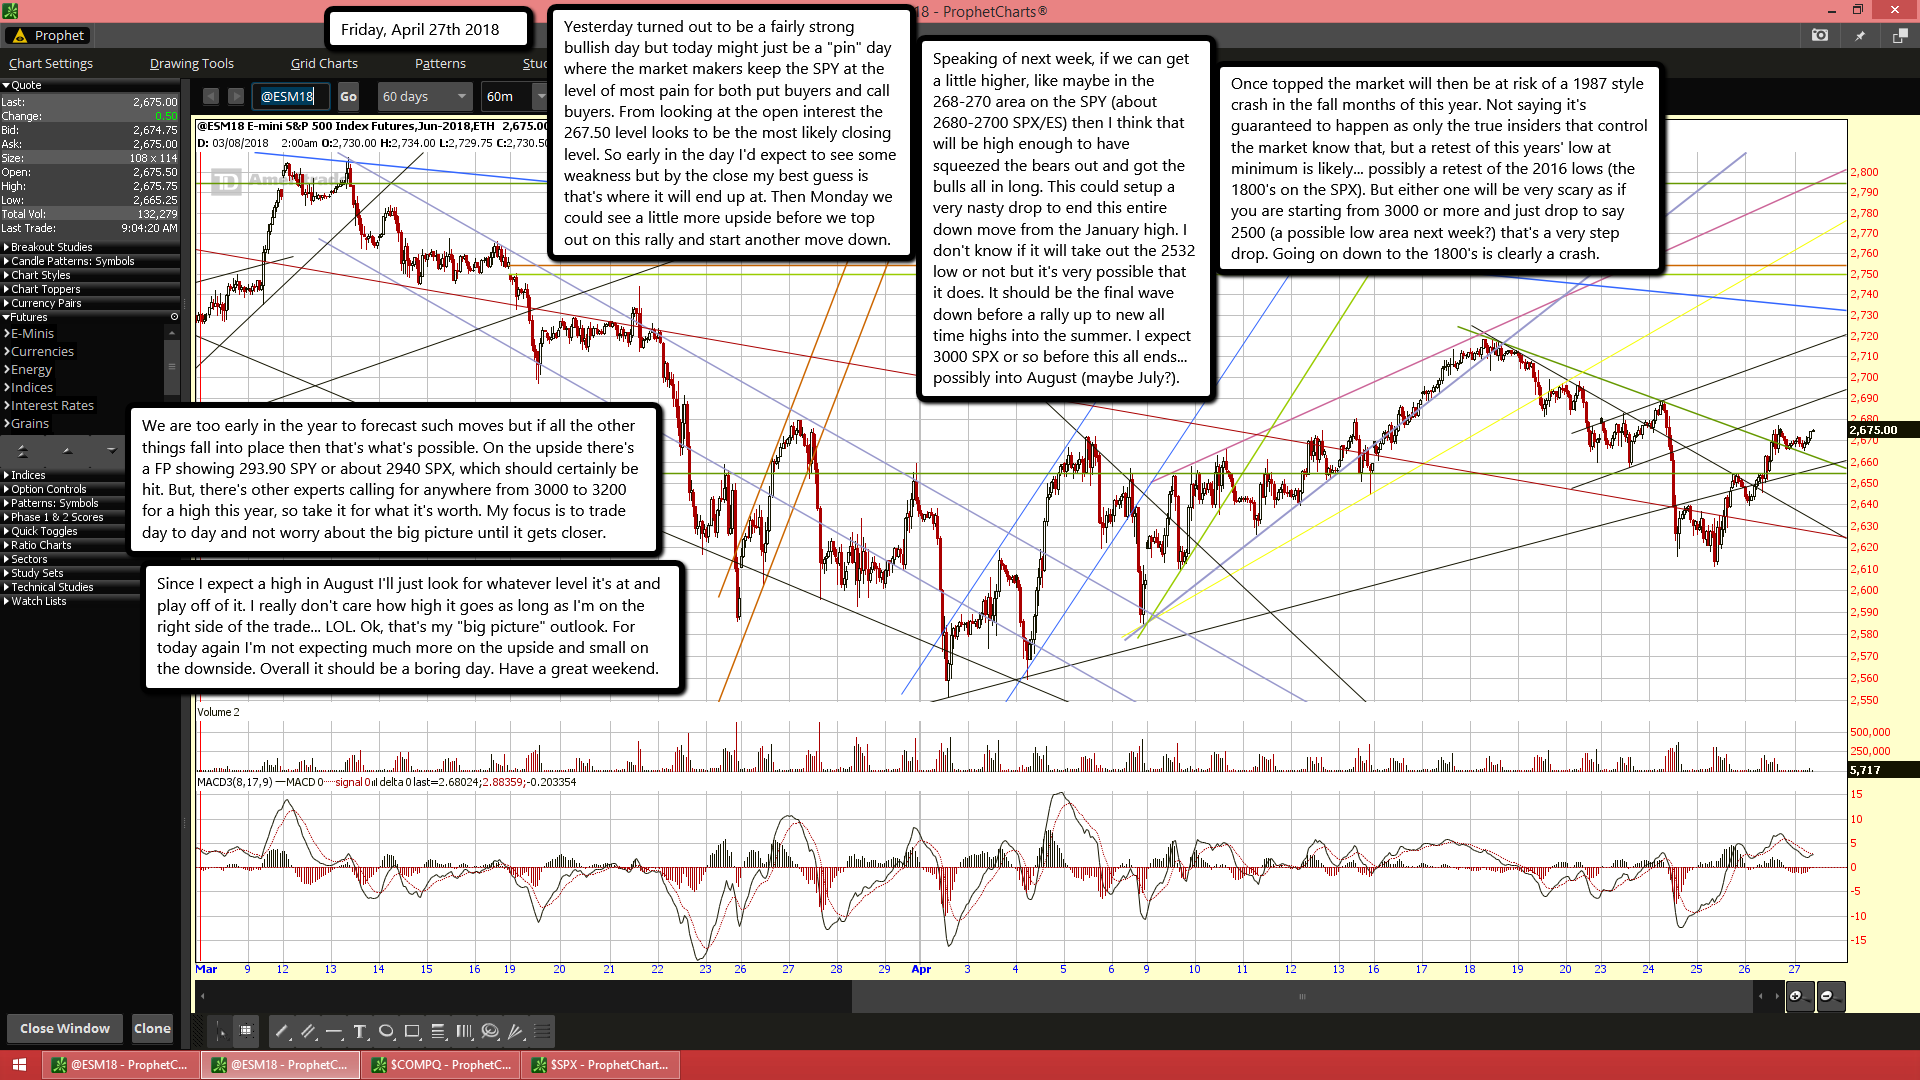
Yesterday turned out to be a fairly strong bullish day but today might just be a "pin" day where the market makers keep the SPY at the level of most pain for both put buyers and call buyers. From looking at the open interest the 267.50 level looks to be the most likely closing level. So early in the day I'd expect to see some weakness but by the close my best guess is that's where it will end up at. Then Monday we could see a little more upside before we top out on this rally and start another move down.

Speaking of next week, if we can get a little higher, like maybe in the 268-270 area on the SPY (about 2680-2700 SPX/ES) then I think that will be high enough to have squeezed the bears out and got the bulls all in long. This could setup a very nasty drop to end this entire down move from the January high. I don't know if it will take out the 2532 low or not but it's very possible that it does. It should be the final wave down before a rally up to new all time highs into the summer. I expect 3000 SPX or so before this all ends... possibly into August (maybe July?).

Once topped the market will then be at risk of a 1987 style crash in the fall months of this year. Not saying it's guaranteed to happen as only the true insiders that control the market know that, but a retest of this years' low at minimum is likely... possibly a retest of the 2016 lows (the 1800's on the SPX). But either one will be very scary as if you are starting from 3000 or more and just drop to say 2500 (a possible low area next week?) that's a very step drop. Going on down to the 1800's is clearly a crash.

We are too early in the year to forecast such moves but if all the other things fall into place then that's what's possible. On the upside there's a FP showing 293.90 SPY or about 2940 SPX, which should certainly be hit. But, there's other experts calling for anywhere from 3000 to 3200 for a high this year, so take it for what it's worth. My focus is to trade day to day and not worry about the big picture until it gets closer.

Since I expect a high in August I'll just look for whatever level it's at and play off of it. I really don't care how high it goes as long as I'm on the right side of the trade... LOL. Ok, that's my "big picture" outlook. For today again I'm not expecting much more on the upside and small on the downside. Overall it should be a boring day. Have a great weekend.

ES Morning Update April 26th 2018

0

Yesterday the bears were still in control the first two thirds of the day but later one the bulls finally broke out and started a push up. They hit some resistance from the green horizontal trendline after-hours as well as a black falling trendline. But after a pullback they have managed to turn back up and get through that falling black trendline and are trying hard to get through the green horizontal trendline. If they make it the next resistance is a green falling trendline pointing to about 2665 or so for today. I suspect that's where most trades will look to re-short and/or exit longs they took. But I'm just neutral at that level as this move up could fool people and last longer then everyone thinks... meaning it might stop at that resistance but instead of dropping hard again we might only see a small pullback of consolidation before pushing through it Friday or even Monday.

The large drop Tuesday took a lot of people by surprise and now that they are awake and ready for another big drop I think the odds are much lower for it to happen so soon. Yeah, it could still happen but more time needs to pass for people to forget about the most recent one. And people need to get bullish again, which I don't think they currently are. This is a game SkyNet plays with the sheep's emotions and right now everyone is in fear mode of another larger drop. Once enough time has past and the market has rallied up high enough then that's when we should start preparing for another hard and fast drop.

By no means am I saying that it's not coming as I do think we'll see another large move down, but it needs to come from higher levels then right now and further out in time. For the downside support we have the falling black trendline pointing to around 2635 today and then the red falling trendline pointing to 2610. I don't see that red one getting hit but the black is possible if the bulls can't get through the green horizontal trendline today. If they do get past it then again they should pause at the falling green trendline and likely pullback to the green horizontal one they busted through. It will become support then as well as the black rising trendline intersecting it around 2652 or so.

ES Morning Update April 25th 2018

0

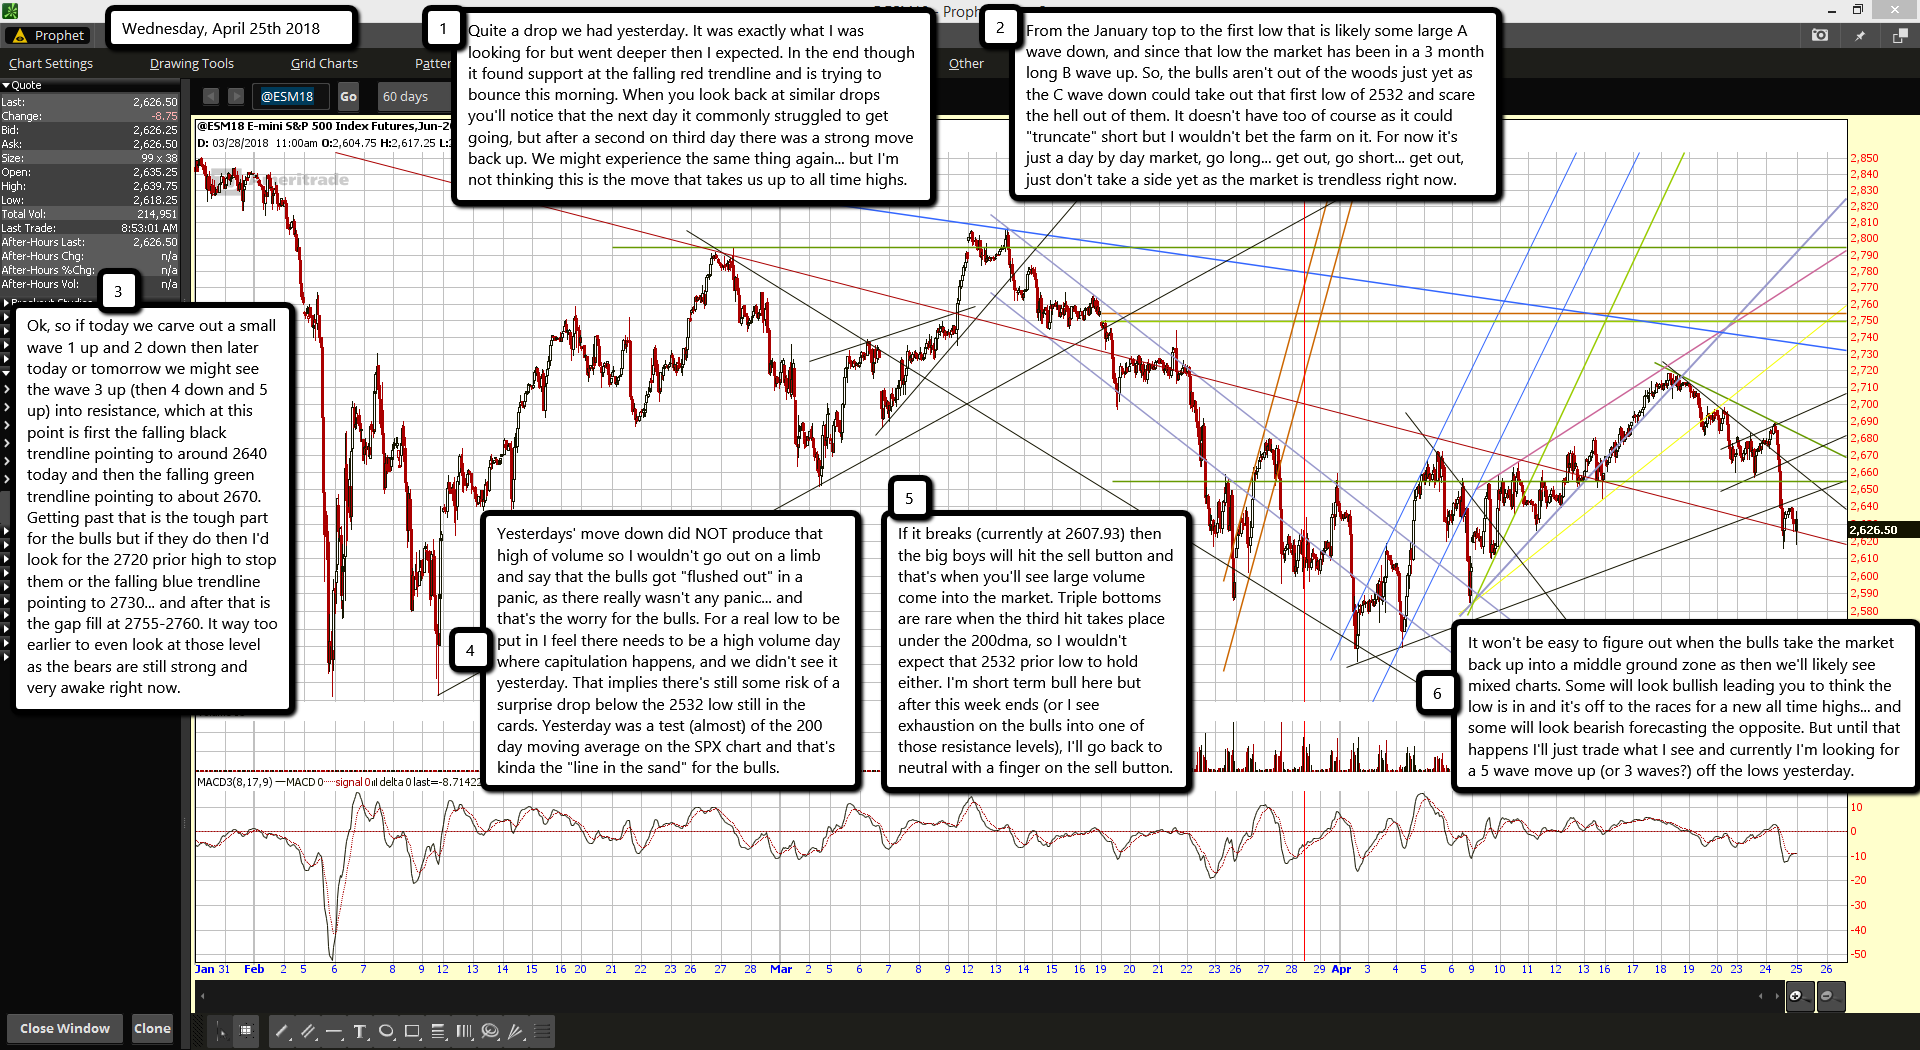
Quite a drop we had yesterday. It was exactly what I was looking for but went deeper then I expected. In the end though it found support at the falling red trendline and is trying to bounce this morning. When you look back at similar drops you'll notice that the next day it commonly struggled to get going, but after a second on third day there was a strong move back up. We might experience the same thing again... but I'm not thinking this is the move that takes us up to all time highs.

From the January top to the first low that is likely some large A wave down, and since that low the market has been in a 3 month long B wave up. So, the bulls aren't out of the woods just yet as the C wave down could take out that first low of 2532 and scare the hell out of them. It doesn't have too of course as it could "truncate" short but I wouldn't bet the farm on it. For now it's just a day by day market, go long... get out, go short... get out, just don't take a side yet as the market is trendless right now.

Ok, so if today we carve out a small wave 1 up and 2 down then later today or tomorrow we might see the wave 3 up (then 4 down and 5 up) into resistance, which at this point is first the falling black trendline pointing to around 2640 today and then the falling green trendline pointing to about 2670. Getting past that is the tough part for the bulls but if they do then I'd look for the 2720 prior high to stop them or the falling blue trendline pointing to 2730... and after that is the gap fill at 2755-2760. It way too earlier to even look at those level as the bears are still strong and very awake right now.

Yesterdays' move down did NOT produce that high of volume so I wouldn't go out on a limb and say that the bulls got "flushed out" in a panic, as there really wasn't any panic... and that's the worry for the bulls. For a real low to be put in I feel there needs to be a high volume day where capitulation happens, and we didn't see it yesterday. That implies there's still some risk of a surprise drop below the 2532 low still in the cards. Yesterday was a test (almost) of the 200 day moving average on the SPX chart and that's kinda the "line in the sand" for the bulls.

If it breaks (currently at 2607.93) then the big boys will hit the sell button and that's when you'll see large volume come into the market. Triple bottoms are rare when the third hit takes place under the 200dma, so I wouldn't expect that 2532 prior low to hold either. I'm short term bull here but after this week ends (or I see exhaustion on the bulls into one of those resistance levels), I'll go back to neutral with a finger on the sell button.

It won't be easy to figure out when the bulls take the market back up into a middle ground zone as then we'll likely see mixed charts. Some will look bullish leading you to think the low is in and it's off to the races for a new all time highs... and some will look bearish forecasting the opposite. But until that happens I'll just trade what I see and currently I'm looking for a 5 wave move up (or 3 waves?) off the lows yesterday.

ES Morning Update April 24th 2018

0

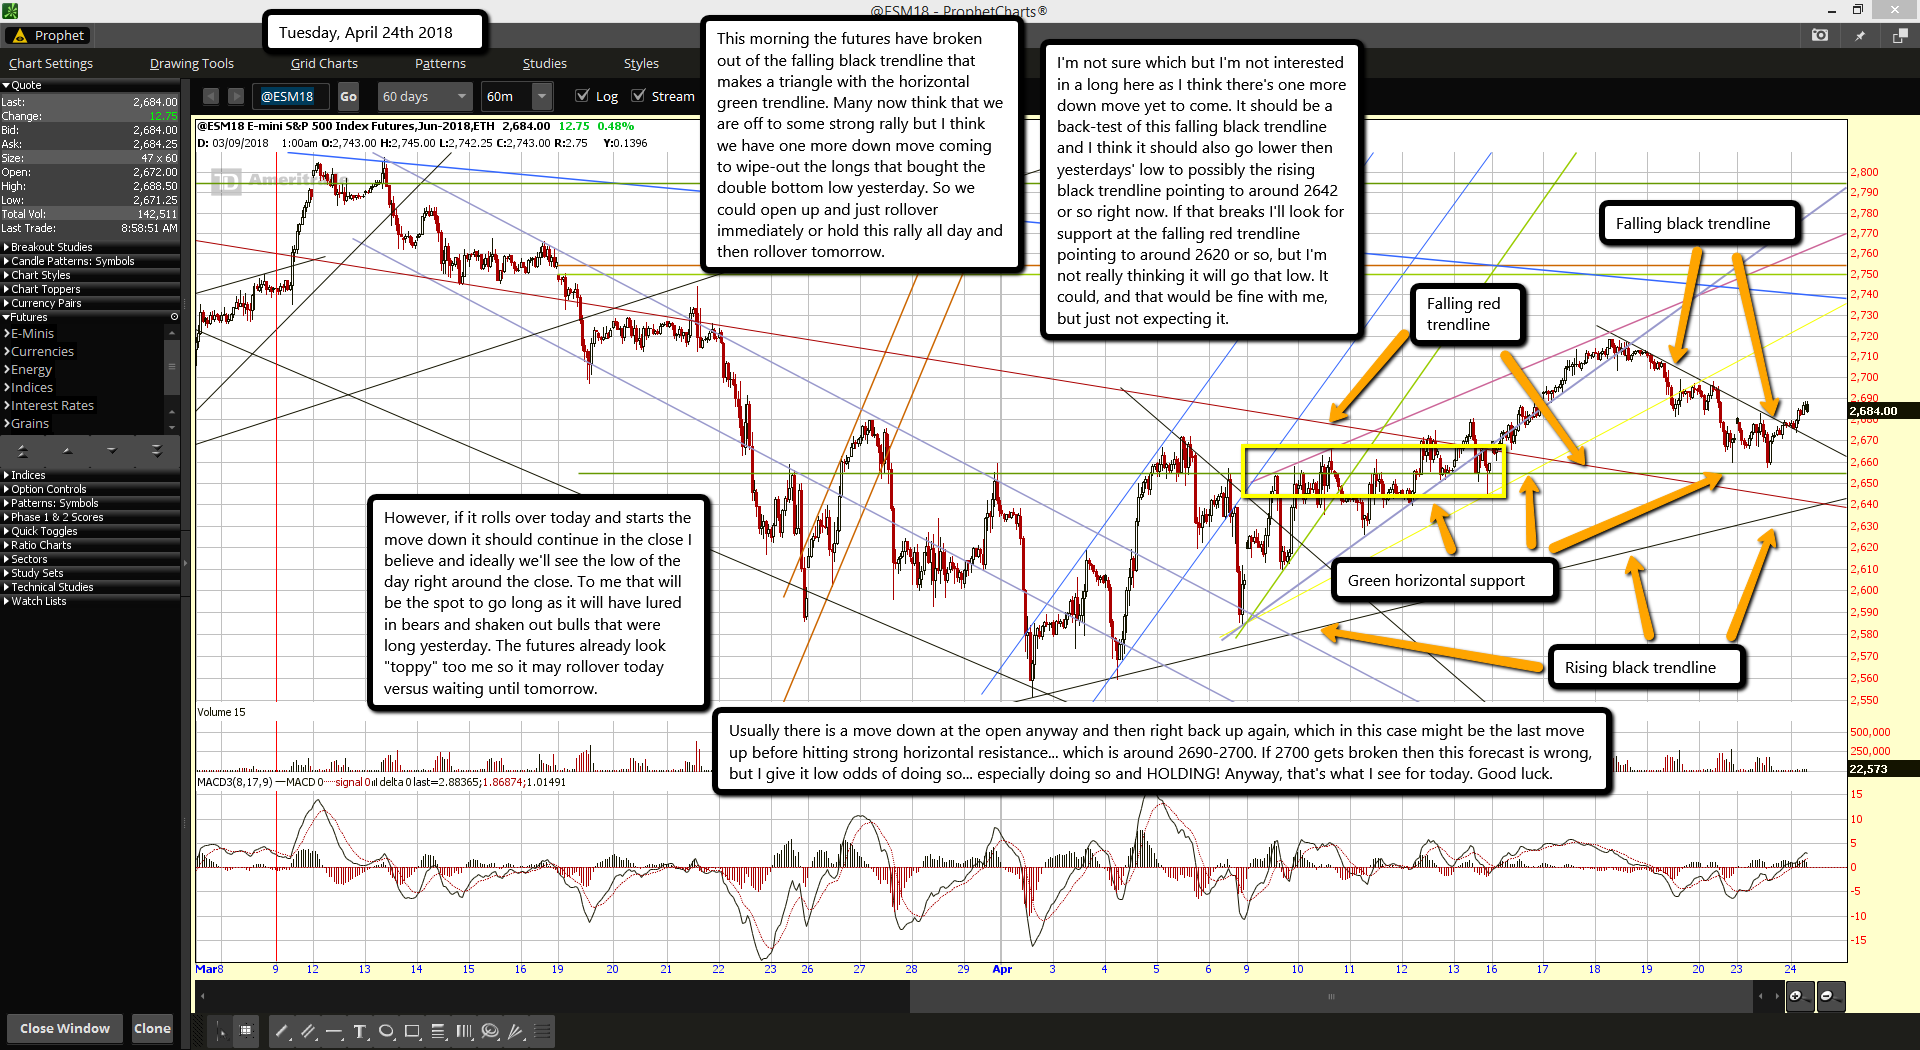
This morning the futures have broken out of the falling black trendline that makes a triangle with the horizontal green trendline. Many now think that we are off to some strong rally but I think we have one more down move coming to wipe-out the longs that bought the double bottom low yesterday. So we could open up and just rollover immediately or hold this rally all day and then rollover tomorrow.

I'm not sure which but I'm not interested in a long here as I think there's one more down move yet to come. It should be a back-test of this falling black trendline and I think it should also go lower then yesterdays' low to possibly the rising black trendline pointing to around 2642 or so right now. If that breaks I'll look for support at the falling red trendline pointing to around 2620 or so, but I'm not really thinking it will go that low. It could, and that would be fine with me, but just not expecting it.

However, if it rolls over today and starts the move down it should continue in the close I believe and ideally we'll see the low of the day right around the close. To me that will be the spot to go long as it will have lured in bears and shaken out bulls that were long yesterday. The futures already look "toppy" too me so it may rollover today versus waiting until tomorrow.

Usually there is a move down at the open anyway and then right back up again, which in this case might be the last move up before hitting strong horizontal resistance... which is around 2690-2700. If 2700 gets broken then this forecast is wrong, but I give it low odds of doing so... especially doing so and HOLDING! Anyway, that's what I see for today. Good luck.

ES Morning Update April 23rd 2018

0

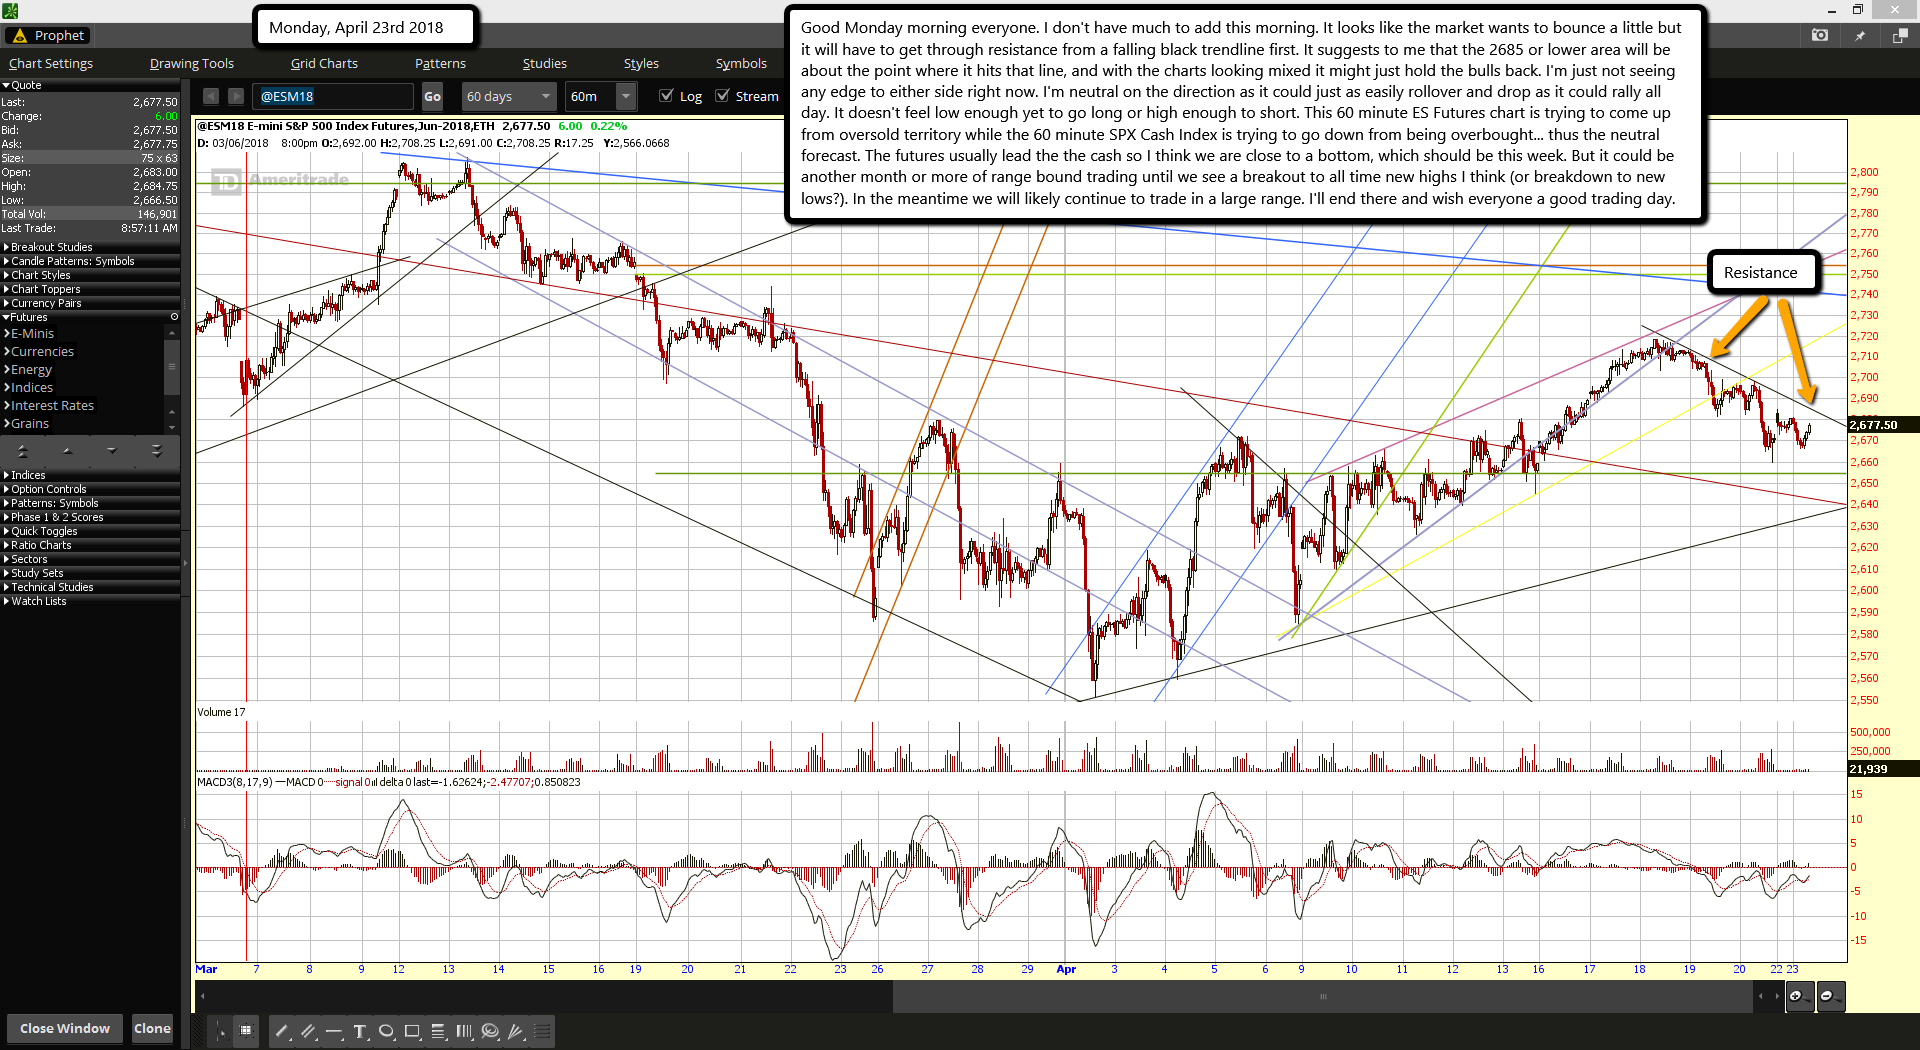
Good Monday morning everyone. I don't have much to add this morning. It looks like the market wants to bounce a little but it will have to get through resistance from a falling black trendline first. It suggests to me that the 2685 or lower area will be about the point where it hits that line, and with the charts looking mixed it might just hold the bulls back. I'm just not seeing any edge to either side right now. I'm neutral on the direction as it could just as easily rollover and drop as it could rally all day. It doesn't feel low enough yet to go long or high enough to short. This 60 minute ES Futures chart is trying to come up from oversold territory while the 60 minute SPX Cash Index is trying to go down from being overbought... thus the neutral forecast. The futures usually lead the the cash so I think we are close to a bottom, which should be this week. But it could be another month or more of range bound trading until we see a breakout to all time new highs I think (or breakdown to new lows?). In the meantime we will likely continue to trade in a large range. I'll end there and wish everyone a good trading day.

ES Morning Update April 20th 2018

0

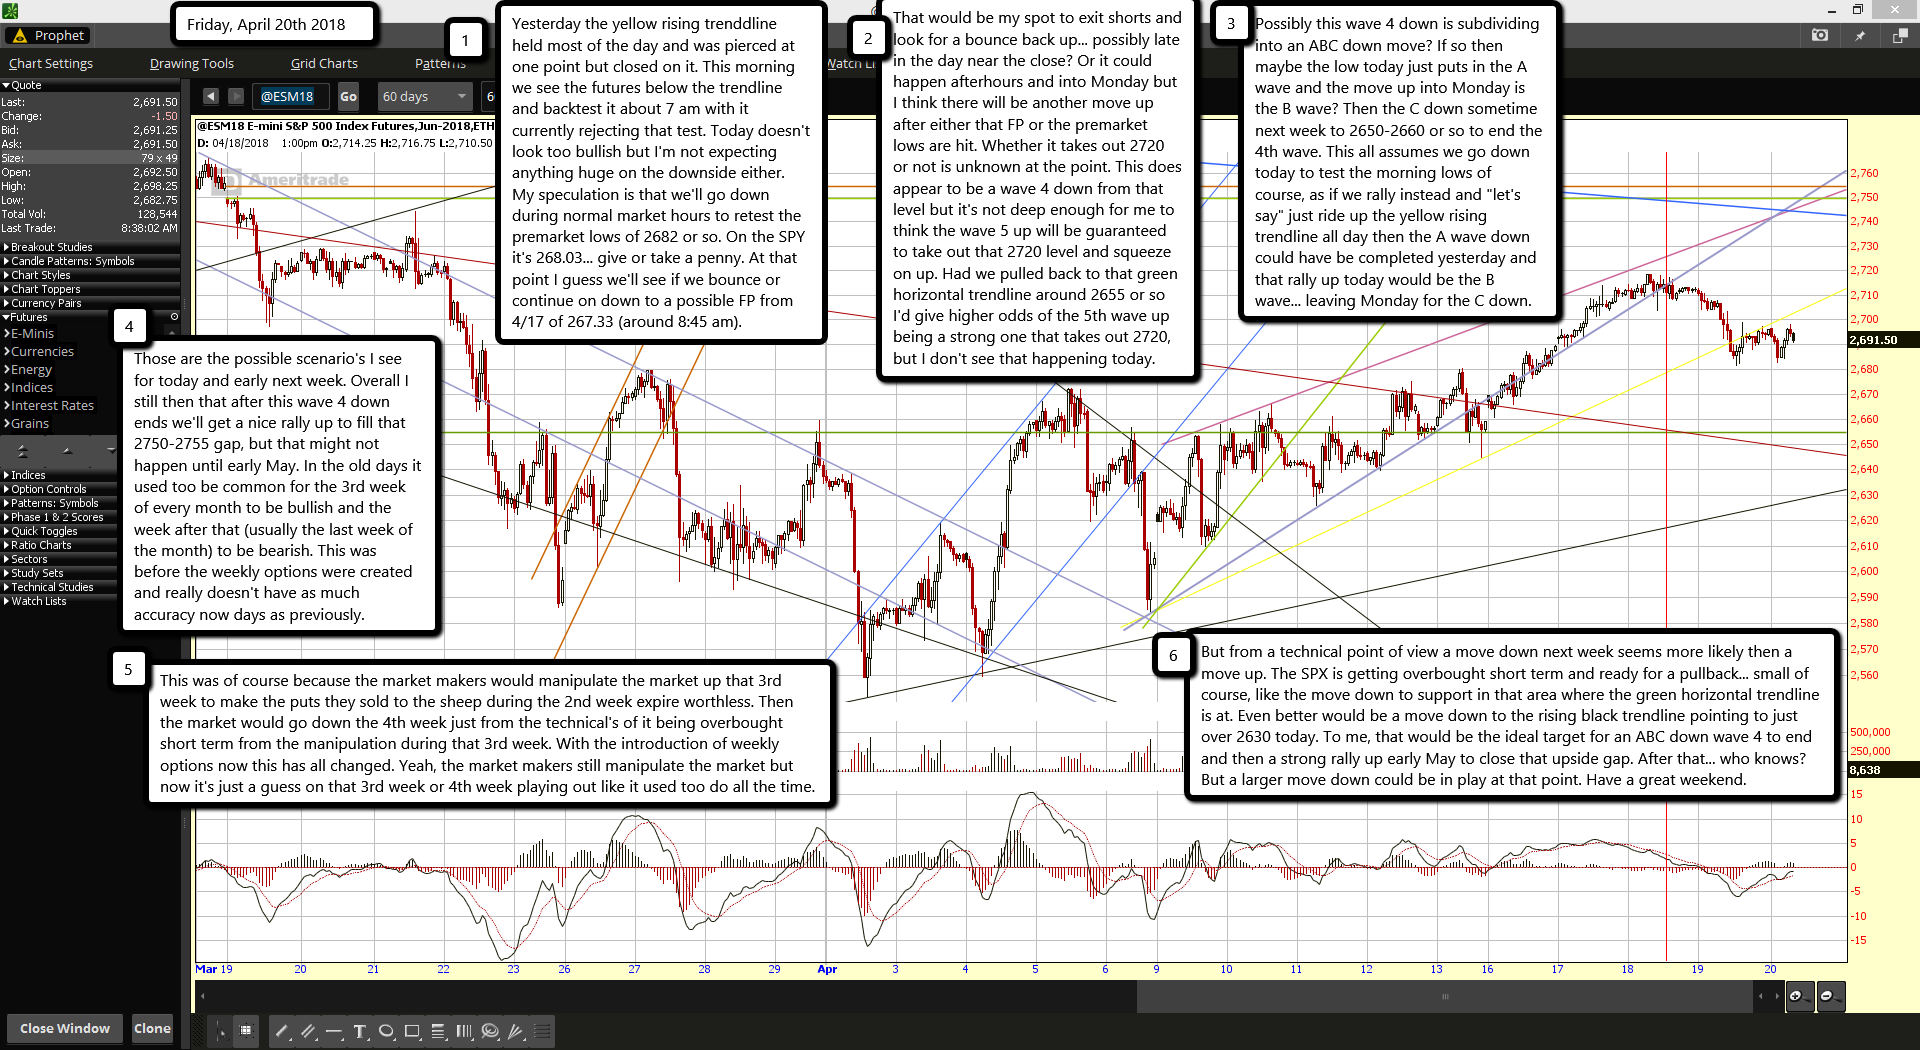
Yesterday the yellow rising trenddline held most of the day and was pierced at one point but closed on it. This morning we see the futures below the trendline and backtest it about 7 am with it currently rejecting that test. Today doesn't look too bullish but I'm not expecting anything huge on the downside either. My speculation is that we'll go down during normal market hours to retest the premarket lows of 2682 or so. On the SPY it's 268.03... give or take a penny. At that point I guess we'll see if we bounce or continue on down to a possible FP from 4/17 of 267.33 (around 8:45 am).

That would be my spot to exit shorts and look for a bounce back up... possibly late in the day near the close? Or it could happen afterhours and into Monday but I think there will be another move up after either that FP or the premarket lows are hit. Whether it takes out 2720 or not is unknown at the point. This does appear to be a wave 4 down from that level but it's not deep enough for me to think the wave 5 up will be guaranteed to take out that 2720 level and squeeze on up. Had we pulled back to that green horizontal trendline around 2655 or so I'd give higher odds of the 5th wave up being a strong one that takes out 2720, but I don't see that happening today.

Possibly this wave 4 down is subdividing into an ABC down move? If so then maybe the low today just puts in the A wave and the move up into Monday is the B wave? Then the C down sometime next week to 2650-2660 or so to end the 4th wave. This all assumes we go down today to test the morning lows of course, as if we rally instead and "let's say" just ride up the yellow rising trendline all day then the A wave down could have be completed yesterday and that rally up today would be the B wave... leaving Monday for the C down.

Those are the possible scenario's I see for today and early next week. Overall I still then that after this wave 4 down ends we'll get a nice rally up to fill that 2750-2755 gap, but that might not happen until early May. In the old days it used too be common for the 3rd week of every month to be bullish and the week after that (usually the last week of the month) to be bearish. This was before the weekly options were created and really doesn't have as much accuracy now days as previously.

This was of course because the market makers would manipulate the market up that 3rd week to make the puts they sold to the sheep during the 2nd week expire worthless. Then the market would go down the 4th week just from the technical's of it being overbought short term from the manipulation during that 3rd week. With the introduction of weekly options now this has all changed. Yeah, the market makers still manipulate the market but now it's just a guess on that 3rd week or 4th week playing out like it used too do all the time.

But from a technical point of view a move down next week seems more likely then a move up. The SPX is getting overbought short term and ready for a pullback... small of course, like the move down to support in that area where the green horizontal trendline is at. Even better would be a move down to the rising black trendline pointing to just over 2630 today. To me, that would be the ideal target for an ABC down wave 4 to end and then a strong rally up early May to close that upside gap. After that... who knows? But a larger move down could be in play at that point. Have a great weekend.

ES Morning Update April 19th 2018

0

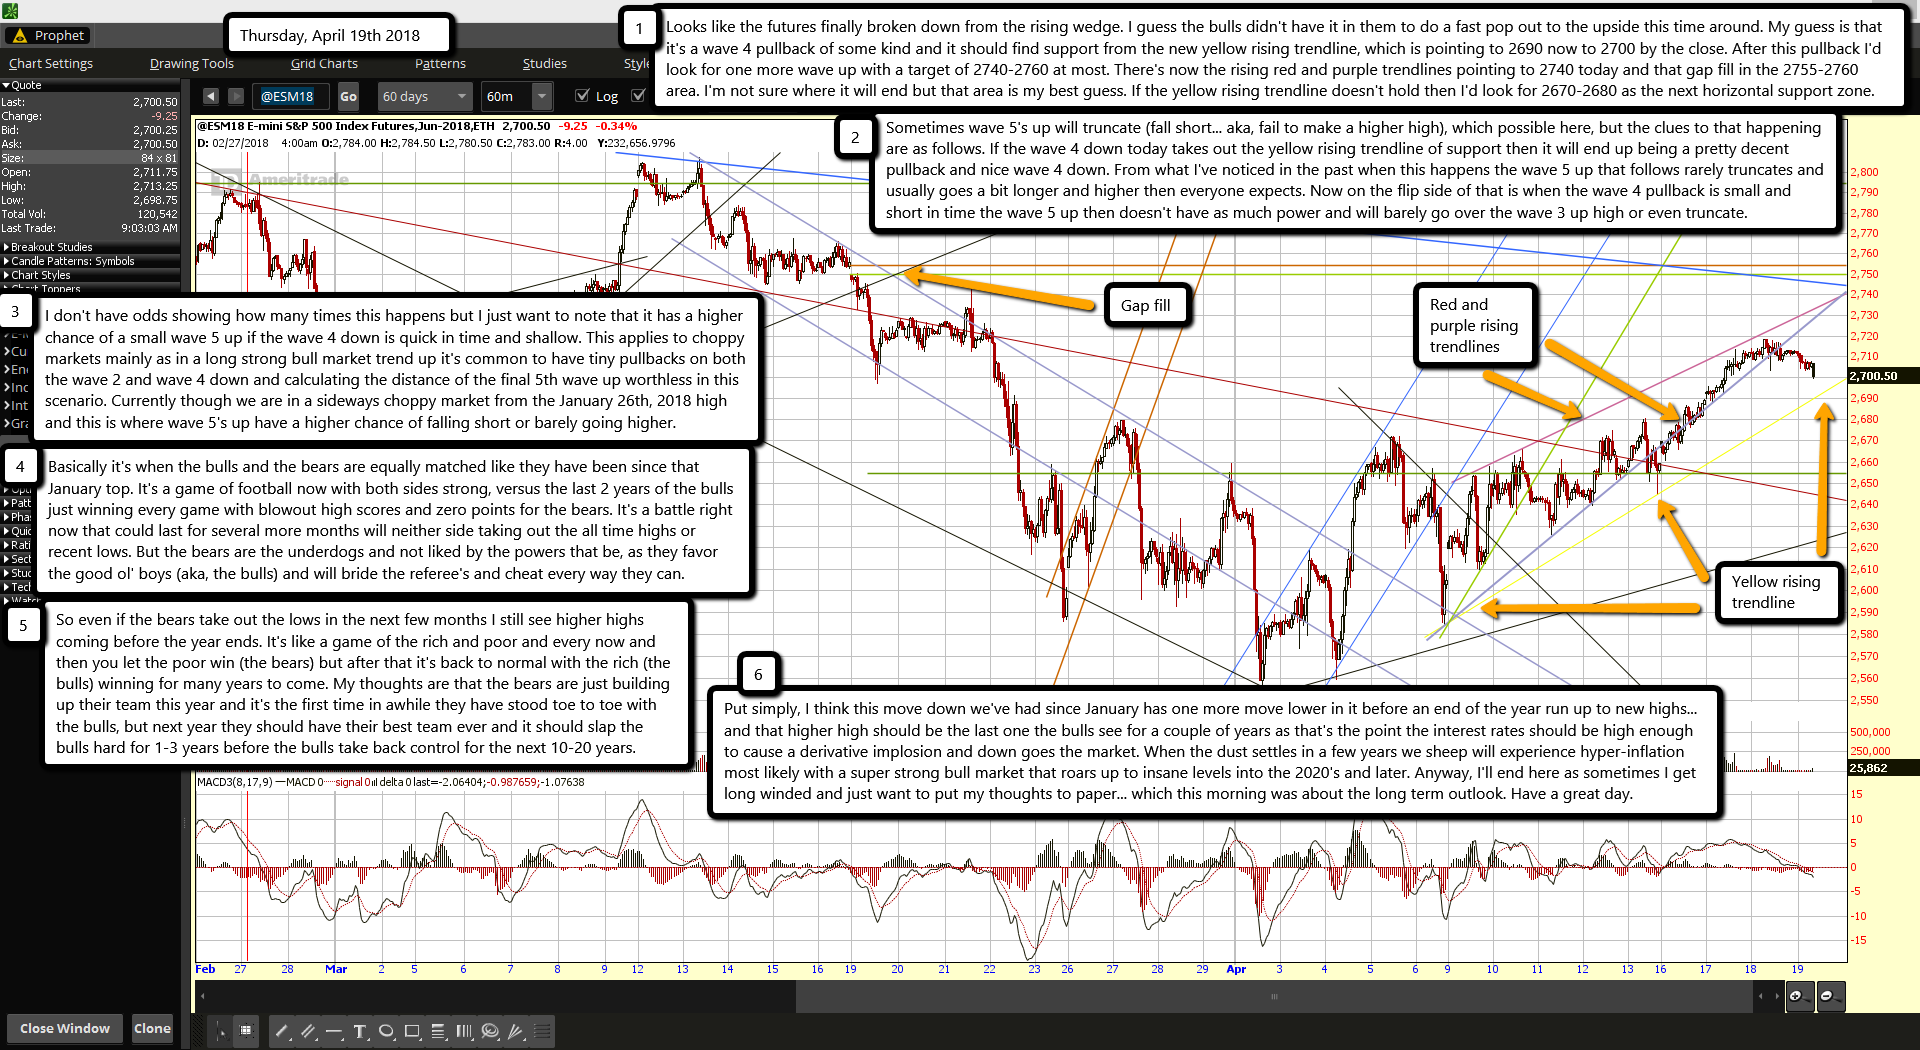
Looks like the futures finally broken down from the rising wedge. I guess the bulls didn't have it in them to do a fast pop out to the upside this time around. My guess is that it's a wave 4 pullback of some kind and it should find support from the new yellow rising trendline, which is pointing to 2690 now to 2700 by the close. After this pullback I'd look for one more wave up with a target of 2740-2760 at most. There's now the rising red and purple trendlines pointing to 2740 today and that gap fill in the 2755-2760 area. I'm not sure where it will end but that area is my best guess. If the yellow rising trendline doesn't hold then I'd look for 2670-2680 as the next horizontal support zone.

Sometimes wave 5's up will truncate (fall short... aka, fail to make a higher high), which possible here, but the clues to that happening are as follows. If the wave 4 down today takes out the yellow rising trendline of support then it will end up being a pretty decent pullback and nice wave 4 down. From what I've noticed in the past when this happens the wave 5 up that follows rarely truncates and usually goes a bit longer and higher then everyone expects. Now on the flip side of that is when the wave 4 pullback is small and short in time the wave 5 up then doesn't have as much power and will barely go over the wave 3 up high or even truncate.

I don't have odds showing how many times this happens but I just want to note that it has a higher chance of a small wave 5 up if the wave 4 down is quick in time and shallow. This applies to choppy markets mainly as in a long strong bull market trend up it's common to have tiny pullbacks on both the wave 2 and wave 4 down and calculating the distance of the final 5th wave up worthless in this scenario. Currently though we are in a sideways choppy market from the January 26th, 2018 high and this is where wave 5's up have a higher chance of falling short or barely going higher.

Basically it's when the bulls and the bears are equally matched like they have been since that January top. It's a game of football now with both sides strong, versus the last 2 years of the bulls just winning every game with blowout high scores and zero points for the bears. It's a battle right now that could last for several more months will neither side taking out the all time highs or recent lows. But the bears are the underdogs and not liked by the powers that be, as they favor the good ol' boys (aka, the bulls) and will bride the referee's and cheat every way they can.

So even if the bears take out the lows in the next few months I still see higher highs coming before the year ends. It's like a game of the rich and poor and every now and then you let the poor win (the bears) but after that it's back to normal with the rich (the bulls) winning for many years to come. My thoughts are that the bears are just building up their team this year and it's the first time in awhile they have stood toe to toe with the bulls, but next year they should have their best team ever and it should slap the bulls hard for 1-3 years before the bulls take back control for the next 10-20 years.

Put simply, I think this move down we've had since January has one more move lower in it before an end of the year run up to new highs... and that higher high should be the last one the bulls see for a couple of years as that's the point the interest rates should be high enough to cause a derivative implosion and down goes the market. When the dust settles in a few years we sheep will experience hyper-inflation most likely with a super strong bull market that roars up to insane levels into the 2020's and later. Anyway, I'll end here as sometimes I get long winded and just want to put my thoughts to paper... which this morning was about the long term outlook. Have a great day.

ES Morning Update April 18th 2018

0

Not much to add today that wasn't covered yesterday. The bulls continue to grind up the rising wedge as bears keep shorting it. The Apex of the wedge is near so I wouldn't be surprised to see it busting up out of the wedge soon to defy gravity (not that gravity even exists as it's just a made up word to keep the sheep stupid) and to fill that gap in the 2750-2755 area. Since everything in this world is the opposite of what you think you have to learn to adjust your brain into thinking that way. That's why I say we'll bust up from the wedge instead of down like every logical person would think.

Anyway, I don't see much opportunity yet for the bears as there are too many on the train right now and more time is needed to shake them off. I expect they will hold the market over 2700 all week long to make sure all the puts expire worthless. If we breakdown below the wedge then that could be a 4th wave down and suggest one more 5th wave up to end this rally.

But right now we are clearly in a slow grinding wave 3 up and it doesn't look ready to give up yet. The falling blue trendline and the gap fill is the goal for the bulls but expect so tricky action around that area as everyone see's it... therefore it won't likely end with a perfect hit and gap fill. I'd expect so fake out dancing around it to happen to make sure the bears aren't on the next leg down. But until then I don't see much on the charts to get bearish about yet.

ES Morning Update April 17th 2018

0

Looks like the bulls have finally decided to make a run up that sticks as I don't see any red 6 hour bars now since this move up started Sunday night. They are back in the rising wedge and continuing this grind up inch by inch. Baring some unknown news event to shake the market it's looking like this is the run to close the gap in the 2750-2755 area. Looking back at prior run ups the pattern seems to be for them to crawl up small each day at first and then have some explosive blow off day where it does 50 points or more in a final squeeze.

Basically it suggests that they will do what the least amount of people expect, and most expect a breakdown of the rising wedge because that's a logical thing to happen. But prior times show it defeating gravity when it gets close to the Apex of the wedge and instead of falling down from that peak it will explode upward out of it. Technical s don't make at that point as it's all about squeezing the last bear out before rolling over. So the more bears that short this 2700 area the more likely this last thrust up will happen. That's how they will close that gap. Unfortunately that sets up the bulls for a much deeper move down in the weeks that follow.

They would do better to drop out of the wedge with some fast 30-40 point move and stair step their way up to new all time highs. But they don't like to do that when they have bears trapped. So they squeeze the last drop of blood out of them until they all turn into bulls. Then they tank the market will bears all long and of course bulls long too.

Do the stair step move up and the bulls can prevent any retest of break of the 2532 low, but grind up slowly with some final gasp up move and the next move down could be the one that scares the bulls into wetting their pants. So, it's a "wait and see" game we play. If you're long then great job, just keep your stops tight. If you are short be prepared to endure more pain as odds are with the bulls today and only a nice breakdown of that rising wedge can save you.

ES Morning Update April 16th 2018

0

Not much of an update this morning. The market is still doing the up, down, up, down, etc... type moves everyday. I'm not seeing any clear direction at the moment. The moves up are not what I'd call strong wave 3's or C waves but just wild swings. And the more time that passes without a strong breakout to the upside the less likely it will happen. Instead we could be doing this ping pong for several more months. It's acting like it wants to setup a strong down move soon instead of an up move, but that's not clear yet. So, I'll end it here and hope to get a better picture tomorrow.

ES Morning Update April 13th 2018

0

Well, here we are again... same thing different day. The breakout of the falling red trendline yesterday was not impressive in my view. Clearly it wasn't a wave 3 of any degree. This morning we have a nice move up happening but it still doesn't act like a wave 3 should. I've added a rising pink trendline and with the rising purple trendline we have the futures stuck in a wedge that points to 2700 or so at the peak of it today. Will it reach there or not is unknown? This is not the kinda of market action I'm looking to play.

This is where you just flip a coin on puts or calls for the next day, which is just gambling. I hate it, but believe me I've done it many times in past. I try not to do so and instead look to catch a strong wave 3 or C up or down but we aren't being given that here lately. Anyway, I don't have much more to add that hasn't been said all week. We seem to be climbing the wall of worry now and trying to catch a nice wave isn't going to be easy. Maybe next week will be better. Have a great weekend.

ES Morning Update April 12th 2018

0

Here we are this morning with basically no change from yesterday. The futures keep making triangles off the upper falling red trendline with this morning having it ride up a new rising purple trendline, which puts it at the Apex of that new triangle. A breakout to the upside seems more likely then a breakdown at this point but there's still no clear direction showing. All the rallies seem to be getting sold, and most likely that's by the big boys. We are much closer to a strong rally starting then a big sell off. But that doesn't rule out a fast "one day" drop as that's still possible.

But it should be bought up and would likely start the multi-day (or week?) rally. In other words, I'm not looking to catch that short but would rather catch the long as it should be a powerful one that last awhile (versus these half day moves up and the back down in the same day). The daily chart of the SPX is still bottomed and trying to turn back up... so that's bullish. The 60 minute chart is mixed with some things being overbought and others oversold. Back on the ES Futures 6 hour chart it to is mixed as it's basically been trading sideways on its' MACD's for awhile now.

That shows no clear direction. It doesn't act like it wants to rollover and cause a sell off, but it also doesn't seem like it has enough strength to turn up sharply and rally the market higher yet. But I think we are close to a breakout and it could (should) happen today. Yeah, that rising purple trendline could break just like the rising light green one did a day or two ago.

And then it would probably just make another new rising trendline of support and continue its' attempt to breakout to the upside. With all the hits of that falling red trendline it's got to be getting weaker and weaker and will break soon. It's like a dam with small holes in it being equal to hits on the trendline. Eventually the dam will burst and collapse, just like the falling red trendline will give way to the futures trying to push through it. That's all I have for today... happy trading.

s2Member®