Monday, August 24, 2026
Home Blog Page 49

ES Morning Update April 17th 2018

0

Looks like the bulls have finally decided to make a run up that sticks as I don't see any red 6 hour bars now since this move up started Sunday night. They are back in the rising wedge and continuing this grind up inch by inch. Baring some unknown news event to shake the market it's looking like this is the run to close the gap in the 2750-2755 area. Looking back at prior run ups the pattern seems to be for them to crawl up small each day at first and then have some explosive blow off day where it does 50 points or more in a final squeeze.

Basically it suggests that they will do what the least amount of people expect, and most expect a breakdown of the rising wedge because that's a logical thing to happen. But prior times show it defeating gravity when it gets close to the Apex of the wedge and instead of falling down from that peak it will explode upward out of it. Technical s don't make at that point as it's all about squeezing the last bear out before rolling over. So the more bears that short this 2700 area the more likely this last thrust up will happen. That's how they will close that gap. Unfortunately that sets up the bulls for a much deeper move down in the weeks that follow.

They would do better to drop out of the wedge with some fast 30-40 point move and stair step their way up to new all time highs. But they don't like to do that when they have bears trapped. So they squeeze the last drop of blood out of them until they all turn into bulls. Then they tank the market will bears all long and of course bulls long too.

Do the stair step move up and the bulls can prevent any retest of break of the 2532 low, but grind up slowly with some final gasp up move and the next move down could be the one that scares the bulls into wetting their pants. So, it's a "wait and see" game we play. If you're long then great job, just keep your stops tight. If you are short be prepared to endure more pain as odds are with the bulls today and only a nice breakdown of that rising wedge can save you.

ES Morning Update April 16th 2018

0

Not much of an update this morning. The market is still doing the up, down, up, down, etc... type moves everyday. I'm not seeing any clear direction at the moment. The moves up are not what I'd call strong wave 3's or C waves but just wild swings. And the more time that passes without a strong breakout to the upside the less likely it will happen. Instead we could be doing this ping pong for several more months. It's acting like it wants to setup a strong down move soon instead of an up move, but that's not clear yet. So, I'll end it here and hope to get a better picture tomorrow.

ES Morning Update April 13th 2018

0

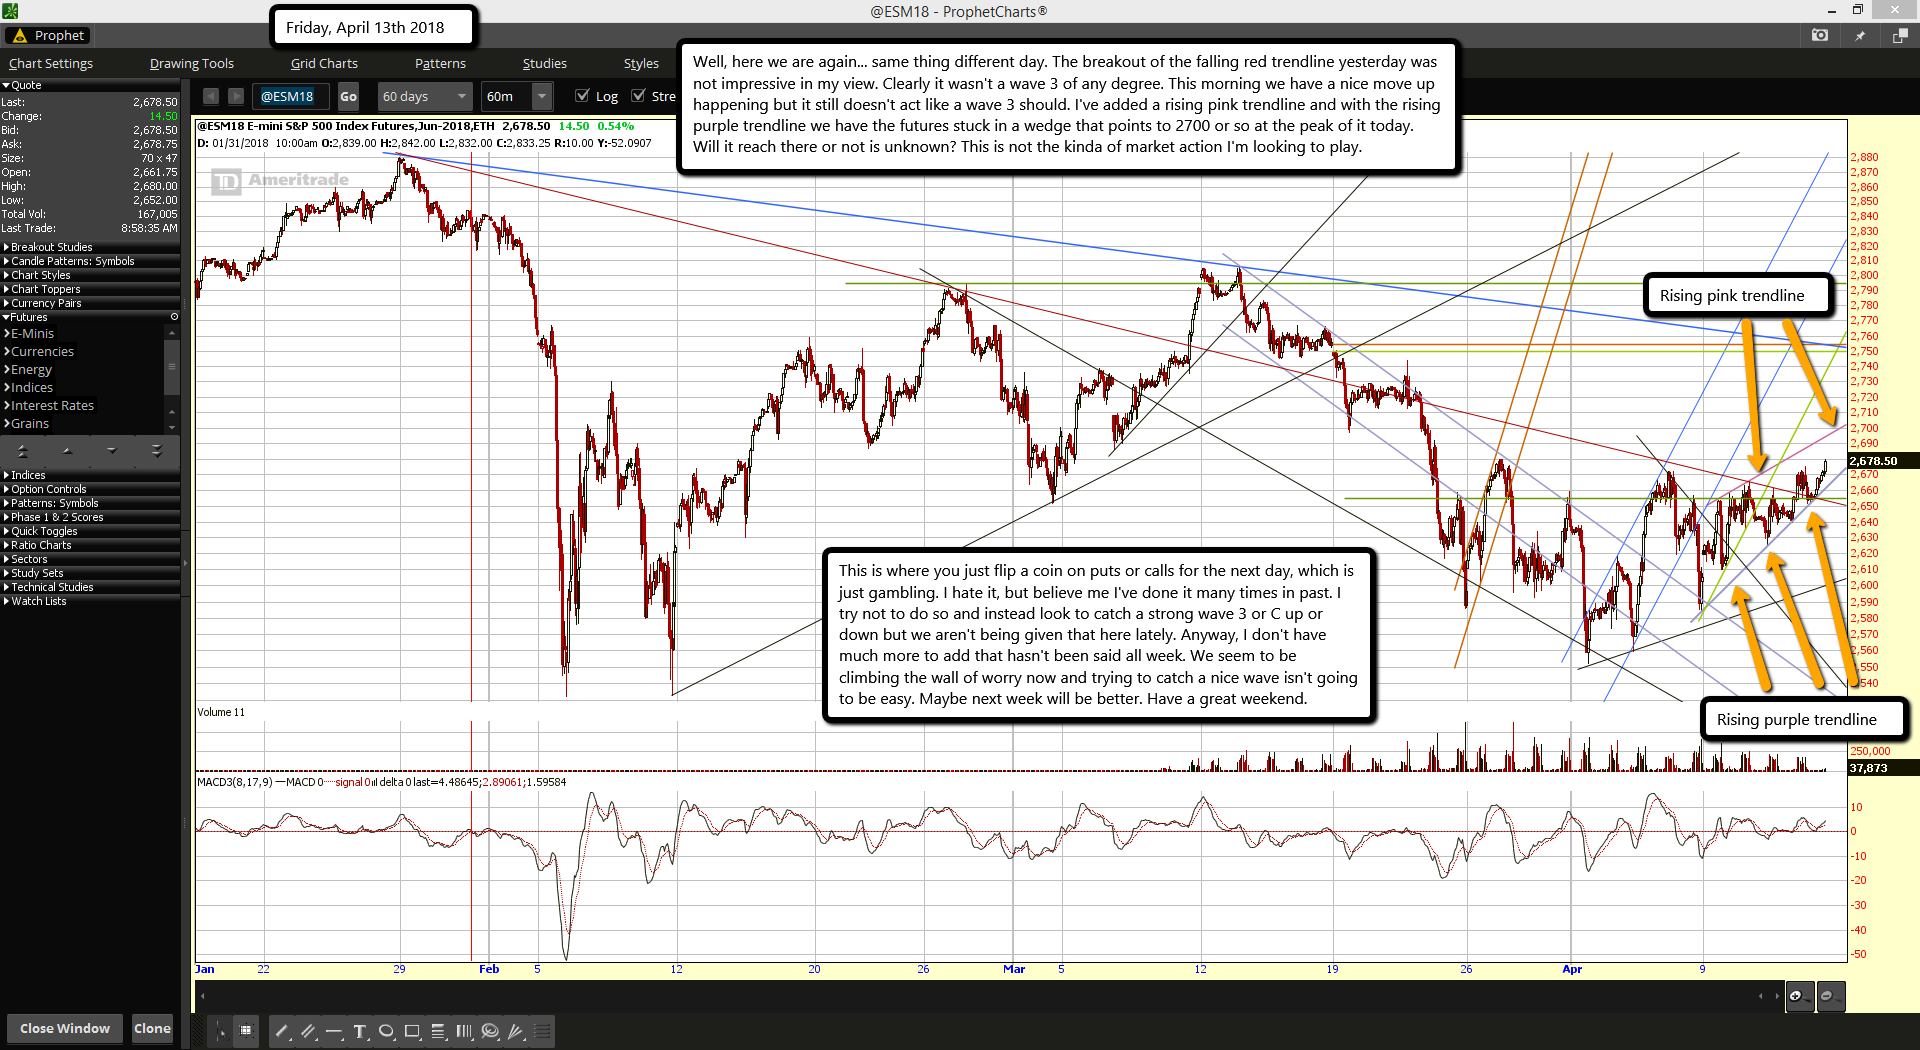
Well, here we are again... same thing different day. The breakout of the falling red trendline yesterday was not impressive in my view. Clearly it wasn't a wave 3 of any degree. This morning we have a nice move up happening but it still doesn't act like a wave 3 should. I've added a rising pink trendline and with the rising purple trendline we have the futures stuck in a wedge that points to 2700 or so at the peak of it today. Will it reach there or not is unknown? This is not the kinda of market action I'm looking to play.

This is where you just flip a coin on puts or calls for the next day, which is just gambling. I hate it, but believe me I've done it many times in past. I try not to do so and instead look to catch a strong wave 3 or C up or down but we aren't being given that here lately. Anyway, I don't have much more to add that hasn't been said all week. We seem to be climbing the wall of worry now and trying to catch a nice wave isn't going to be easy. Maybe next week will be better. Have a great weekend.

ES Morning Update April 12th 2018

0

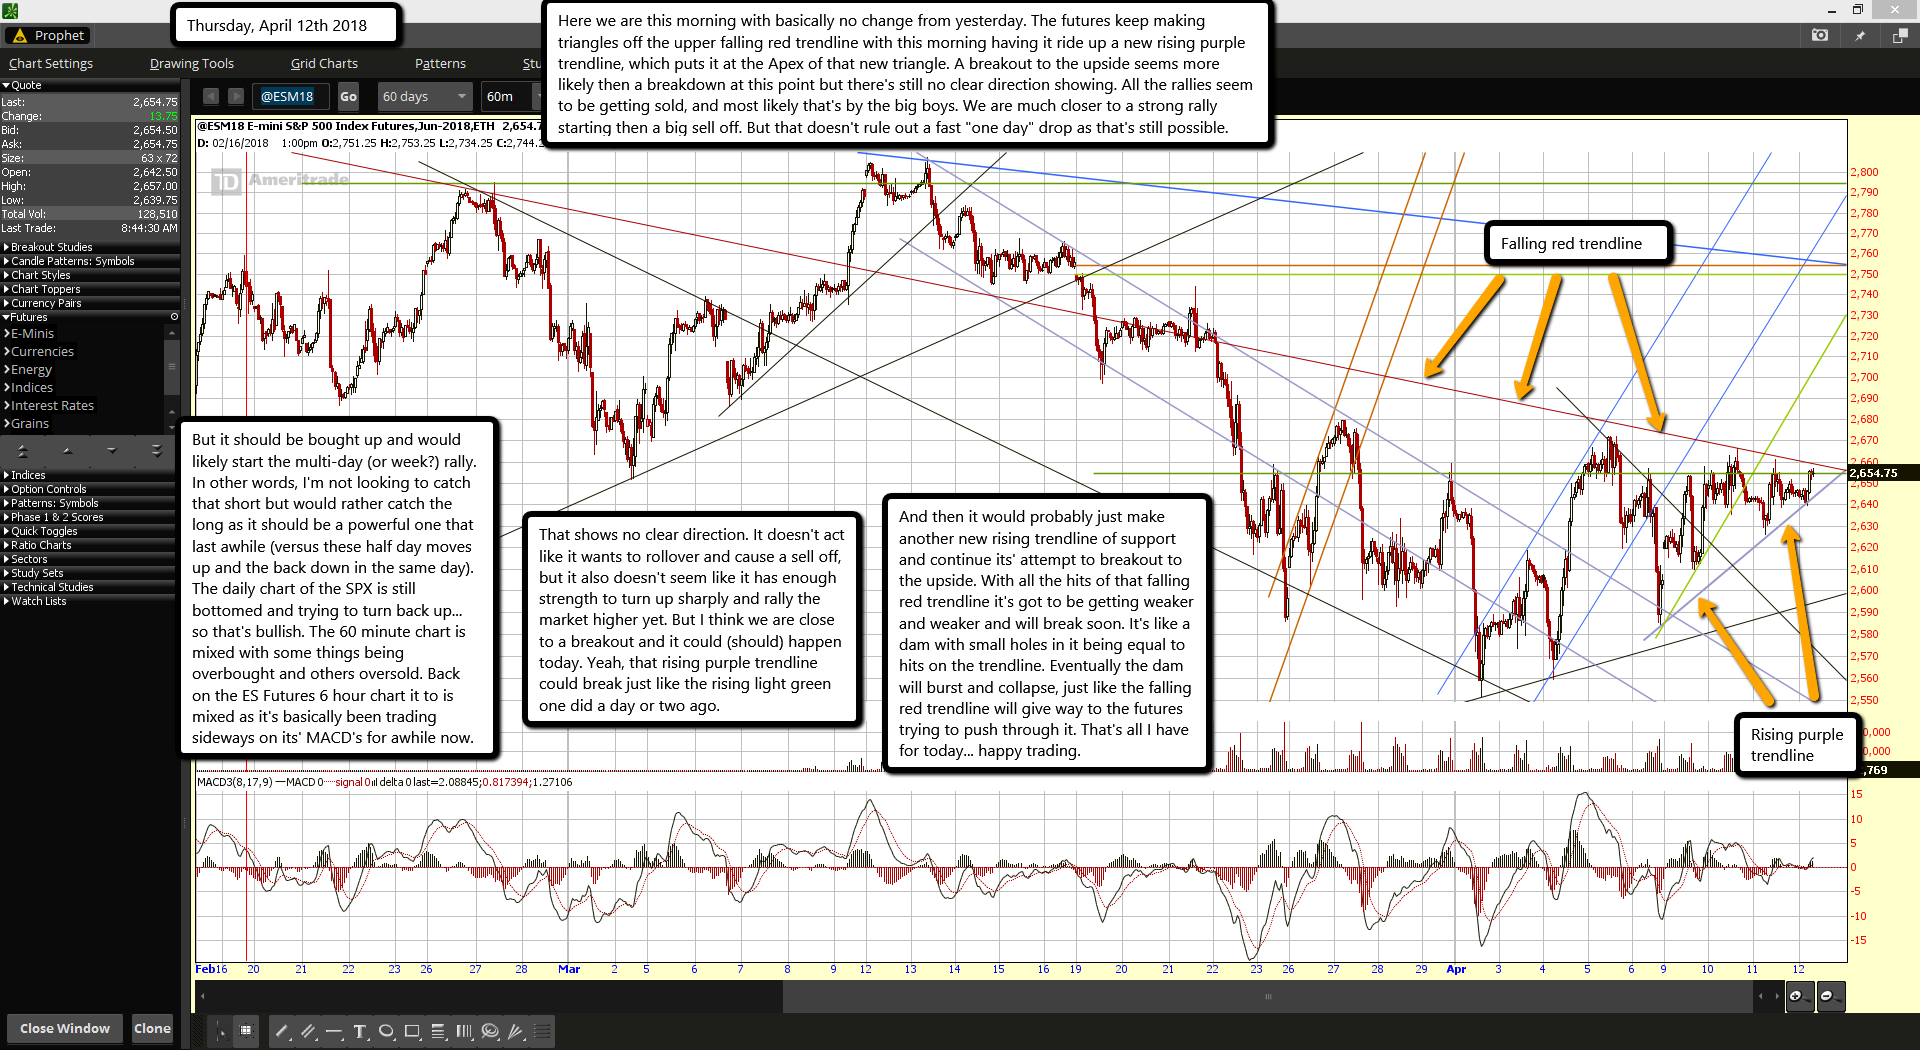
Here we are this morning with basically no change from yesterday. The futures keep making triangles off the upper falling red trendline with this morning having it ride up a new rising purple trendline, which puts it at the Apex of that new triangle. A breakout to the upside seems more likely then a breakdown at this point but there's still no clear direction showing. All the rallies seem to be getting sold, and most likely that's by the big boys. We are much closer to a strong rally starting then a big sell off. But that doesn't rule out a fast "one day" drop as that's still possible.

But it should be bought up and would likely start the multi-day (or week?) rally. In other words, I'm not looking to catch that short but would rather catch the long as it should be a powerful one that last awhile (versus these half day moves up and the back down in the same day). The daily chart of the SPX is still bottomed and trying to turn back up... so that's bullish. The 60 minute chart is mixed with some things being overbought and others oversold. Back on the ES Futures 6 hour chart it to is mixed as it's basically been trading sideways on its' MACD's for awhile now.

That shows no clear direction. It doesn't act like it wants to rollover and cause a sell off, but it also doesn't seem like it has enough strength to turn up sharply and rally the market higher yet. But I think we are close to a breakout and it could (should) happen today. Yeah, that rising purple trendline could break just like the rising light green one did a day or two ago.

And then it would probably just make another new rising trendline of support and continue its' attempt to breakout to the upside. With all the hits of that falling red trendline it's got to be getting weaker and weaker and will break soon. It's like a dam with small holes in it being equal to hits on the trendline. Eventually the dam will burst and collapse, just like the falling red trendline will give way to the futures trying to push through it. That's all I have for today... happy trading.

ES Morning Update April 11th 2018

0

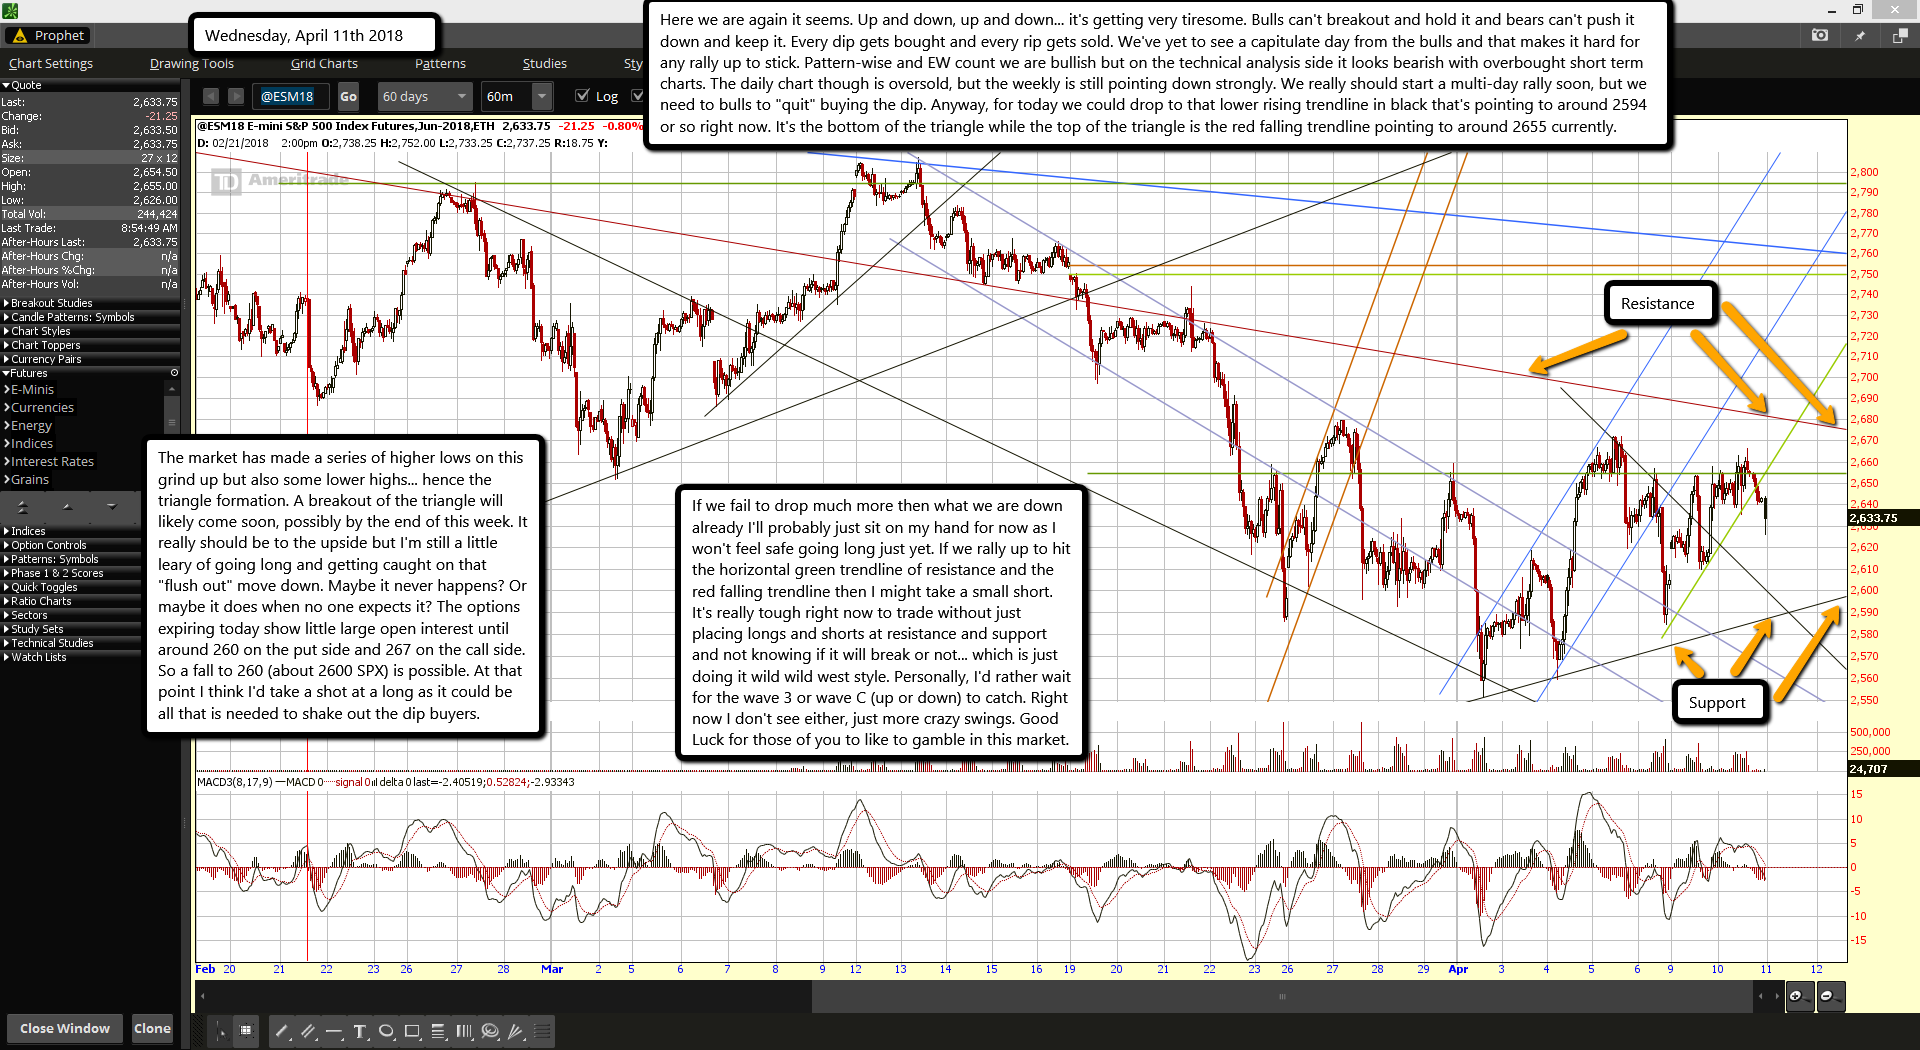
Here we are again it seems. Up and down, up and down... it's getting very tiresome. Bulls can't breakout and hold it and bears can't push it down and keep it. Every dip gets bought and every rip gets sold. We've yet to see a capitulate day from the bulls and that makes it hard for any rally up to stick. Pattern-wise and EW count we are bullish but on the technical analysis side it looks bearish with overbought short term charts. The daily chart though is oversold, but the weekly is still pointing down strongly. We really should start a multi-day rally soon, but we need to bulls to "quit" buying the dip. Anyway, for today we could drop to that lower rising trendline in black that's pointing to around 2594 or so right now. It's the bottom of the triangle while the top of the triangle is the red falling trendline pointing to around 2655 currently.

The market has made a series of higher lows on this grind up but also some lower highs... hence the triangle formation. A breakout of the triangle will likely come soon, possibly by the end of this week. It really should be to the upside but I'm still a little leary of going long and getting caught on that "flush out" move down. Maybe it never happens? Or maybe it does when no one expects it? The options expiring today show little large open interest until around 260 on the put side and 267 on the call side. So a fall to 260 (about 2600 SPX) is possible. At that point I think I'd take a shot at a long as it could be all that is needed to shake out the dip buyers.

If we fail to drop much more then what we are down already I'll probably just sit on my hand for now as I won't feel safe going long just yet. If we rally up to hit the horizontal green trendline of resistance and the red falling trendline then I might take a small short. It's really tough right now to trade without just placing longs and shorts at resistance and support and not knowing if it will break or not... which is just doing it wild wild west style. Personally, I'd rather wait for the wave 3 or wave C (up or down) to catch. Right now I don't see either, just more crazy swings. Good Luck for those of you to like to gamble in this market.

ES Morning Update April 10th 2018

0

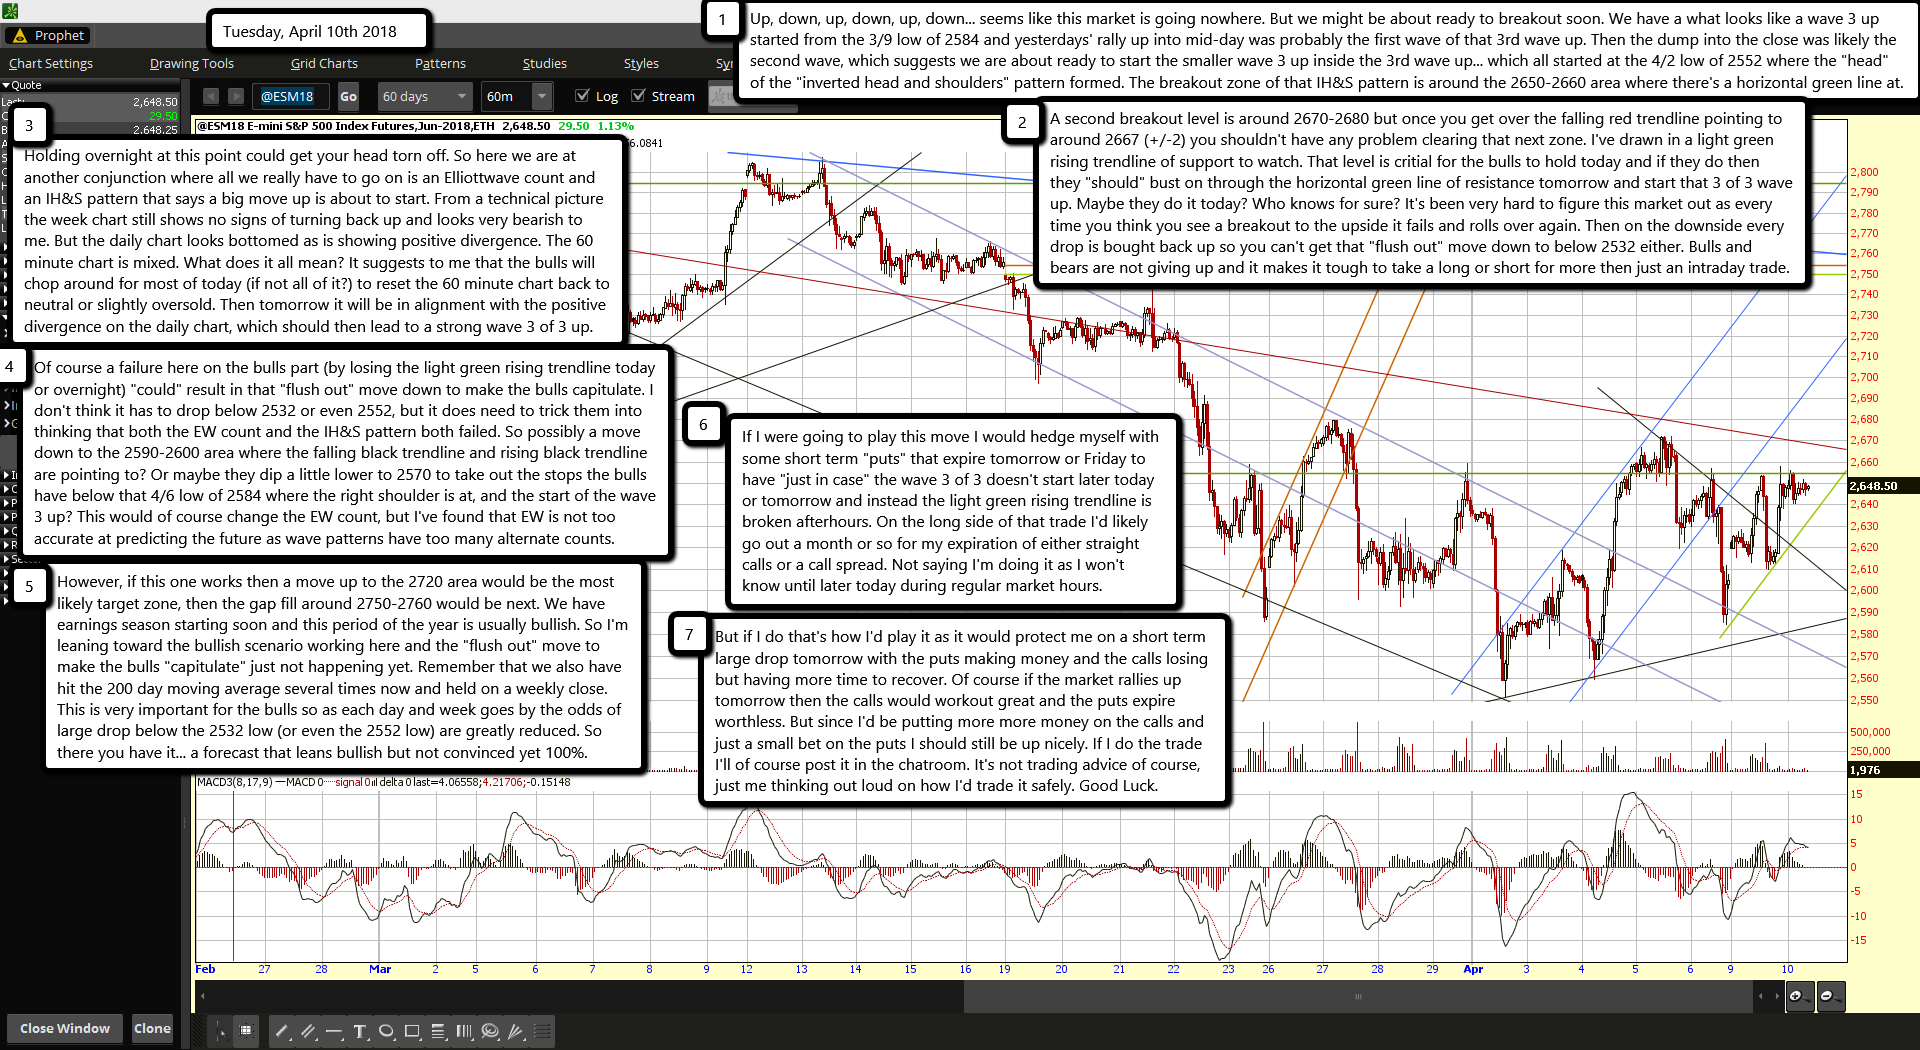
Up, down, up, down, up, down... seems like this market is going nowhere. But we might be about ready to breakout soon. We have a what looks like a wave 3 up started from the 3/9 low of 2584 and yesterdays' rally up into mid-day was probably the first wave of that 3rd wave up. Then the dump into the close was likely the second wave, which suggests we are about ready to start the smaller wave 3 up inside the 3rd wave up... which all started at the 4/2 low of 2552 where the "head" of the "inverted head and shoulders" pattern formed. The breakout zone of that IH&S pattern is around the 2650-2660 area where there's a horizontal green line at.

A second breakout level is around 2670-2680 but once you get over the falling red trendline pointing to around 2667 (+/-2) you shouldn't have any problem clearing that next zone. I've drawn in a light green rising trendline of support to watch. That level is critial for the bulls to hold today and if they do then they "should" bust on through the horizontal green line of resistance tomorrow and start that 3 of 3 wave up. Maybe they do it today? Who knows for sure? It's been very hard to figure this market out as every time you think you see a breakout to the upside it fails and rolls over again. Then on the downside every drop is bought back up so you can't get that "flush out" move down to below 2532 either. Bulls and bears are not giving up and it makes it tough to take a long or short for more then just an intraday trade.

Holding overnight at this point could get your head torn off. So here we are at another conjunction where all we really have to go on is an Elliottwave count and an IH&S pattern that says a big move up is about to start. From a technical picture the week chart still shows no signs of turning back up and looks very bearish to me. But the daily chart looks bottomed as is showing positive divergence. The 60 minute chart is mixed. What does it all mean? It suggests to me that the bulls will chop around for most of today (if not all of it?) to reset the 60 minute chart back to neutral or slightly oversold. Then tomorrow it will be in alignment with the positive divergence on the daily chart, which should then lead to a strong wave 3 of 3 up.

Of course a failure here on the bulls part (by losing the light green rising trendline today or overnight) "could" result in that "flush out" move down to make the bulls capitulate. I don't think it has to drop below 2532 or even 2552, but it does need to trick them into thinking that both the EW count and the IH&S pattern both failed. So possibly a move down to the 2590-2600 area where the falling black trendline and rising black trendline are pointing to? Or maybe they dip a little lower to 2570 to take out the stops the bulls have below that 4/6 low of 2584 where the right shoulder is at, and the start of the wave 3 up? This would of course change the EW count, but I've found that EW is not too accurate at predicting the future as wave patterns have too many alternate counts.

However, if this one works then a move up to the 2720 area would be the most likely target zone, then the gap fill around 2750-2760 would be next. We have earnings season starting soon and this period of the year is usually bullish. So I'm leaning toward the bullish scenario working here and the "flush out" move to make the bulls "capitulate" just not happening yet. Remember that we also have hit the 200 day moving average several times now and held on a weekly close. This is very important for the bulls so as each day and week goes by the odds of large drop below the 2532 low (or even the 2552 low) are greatly reduced. So there you have it... a forecast that leans bullish but not convinced yet 100%.

If I were going to play this move I would hedge myself with some short term "puts" that expire tomorrow or Friday to have "just in case" the wave 3 of 3 doesn't start later today or tomorrow and instead the light green rising trendline is broken afterhours. On the long side of that trade I'd likely go out a month or so for my expiration of either straight calls or a call spread. Not saying I'm doing it as I won't know until later today during regular market hours.

But if I do that's how I'd play it as it would protect me on a short term large drop tomorrow with the puts making money and the calls losing but having more time to recover. Of course if the market rallies up tomorrow then the calls would workout great and the puts expire worthless. But since I'd be putting more more money on the calls and just a small bet on the puts I should still be up nicely. If I do the trade I'll of course post it in the chatroom. It's not trading advice of course, just me thinking out loud on how I'd trade it safely. Good Luck.

ES Morning Update April 9th 2018

0

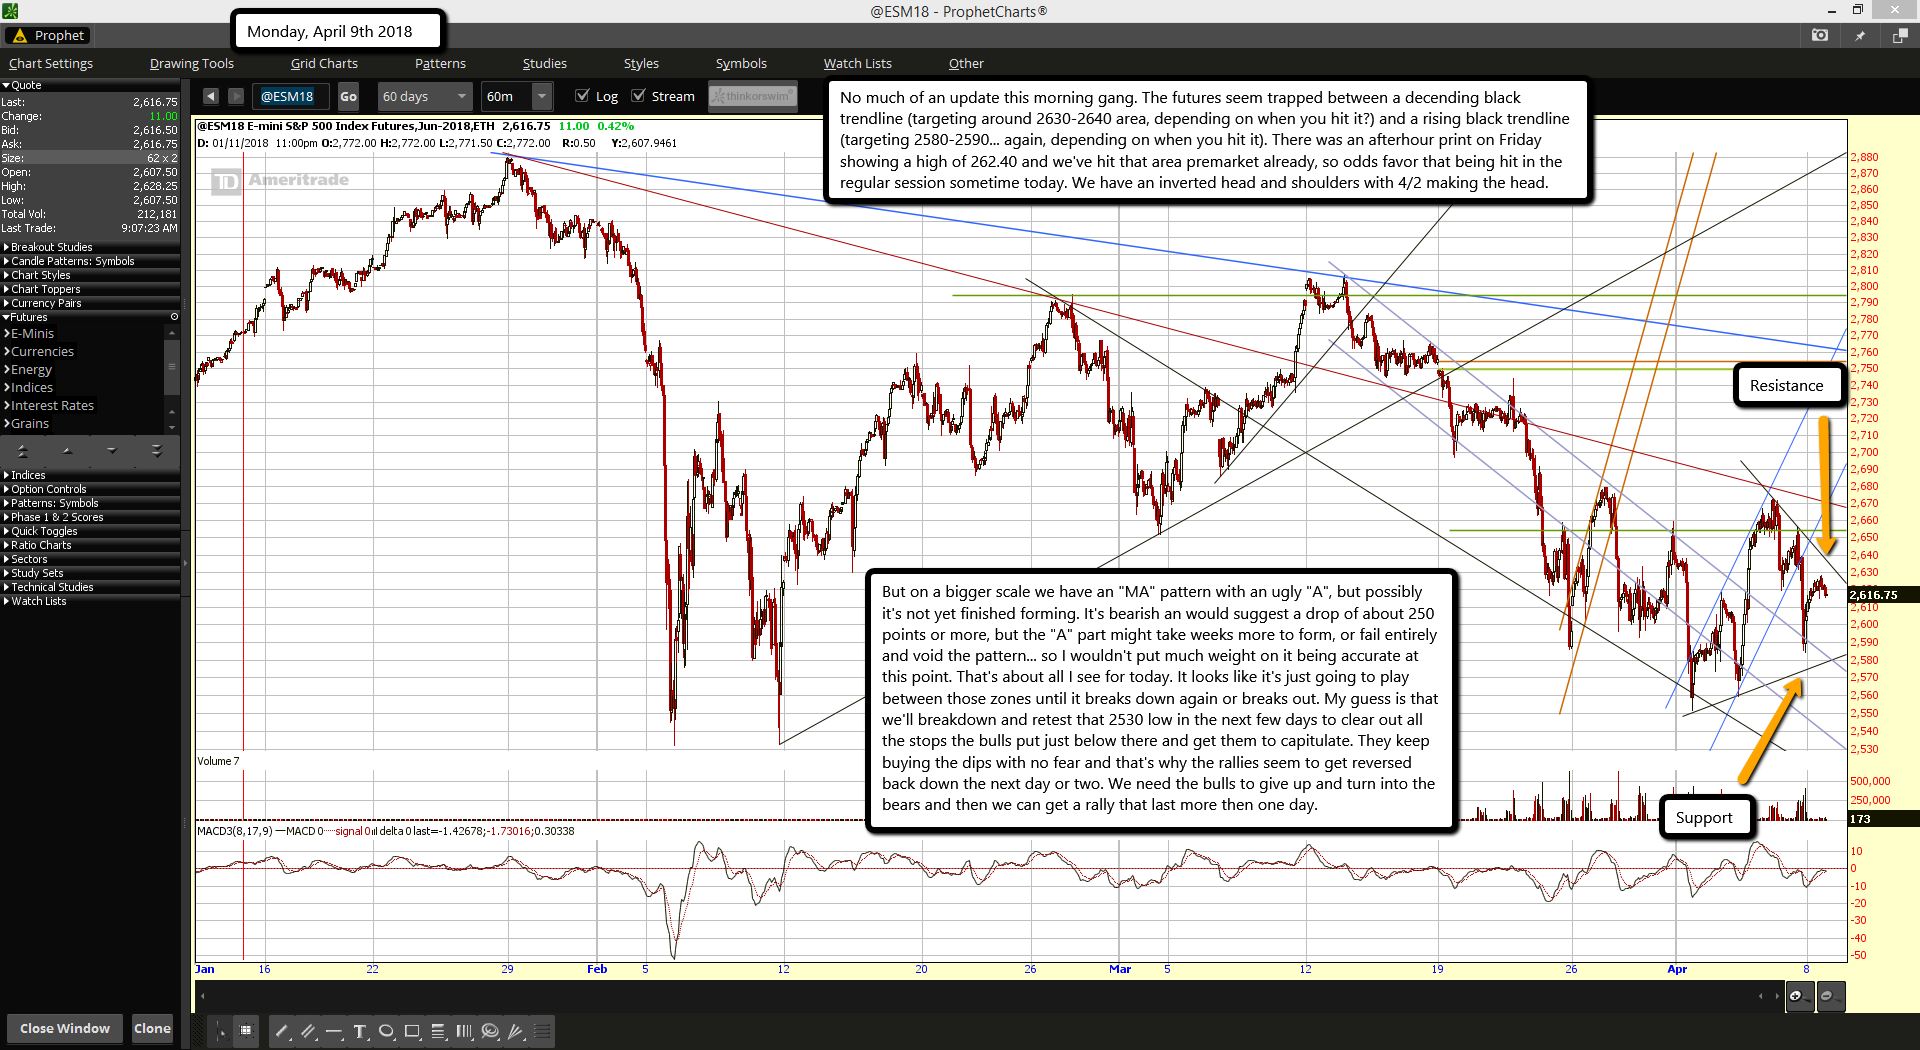
No much of an update this morning gang. The futures seem trapped between a decending black trendline (targeting around 2630-2640 area, depending on when you hit it?) and a rising black trendline (targeting 2580-2590... again, depending on when you hit it). There was an afterhour print on Friday showing a high of 262.40 and we've hit that area premarket already, so odds favor that being hit in the regular session sometime today. We have an inverted head and shoulders with 4/2 making the head.

But on a bigger scale we have an "MA" pattern with an ugly "A", but possibly it's not yet finished forming. It's bearish an would suggest a drop of about 250 points or more, but the "A" part might take weeks more to form, or fail entirely and void the pattern... so I wouldn't put much weight on it being accurate at this point. That's about all I see for today. It looks like it's just going to play between those zones until it breaks down again or breaks out. My guess is that we'll breakdown and retest that 2530 low in the next few days to clear out all the stops the bulls put just below there and get them to capitulate. They keep buying the dips with no fear and that's why the rallies seem to get reversed back down the next day or two. We need the bulls to give up and turn into the bears and then we can get a rally that last more then one day.

ES Morning Update April 6th 2018

0

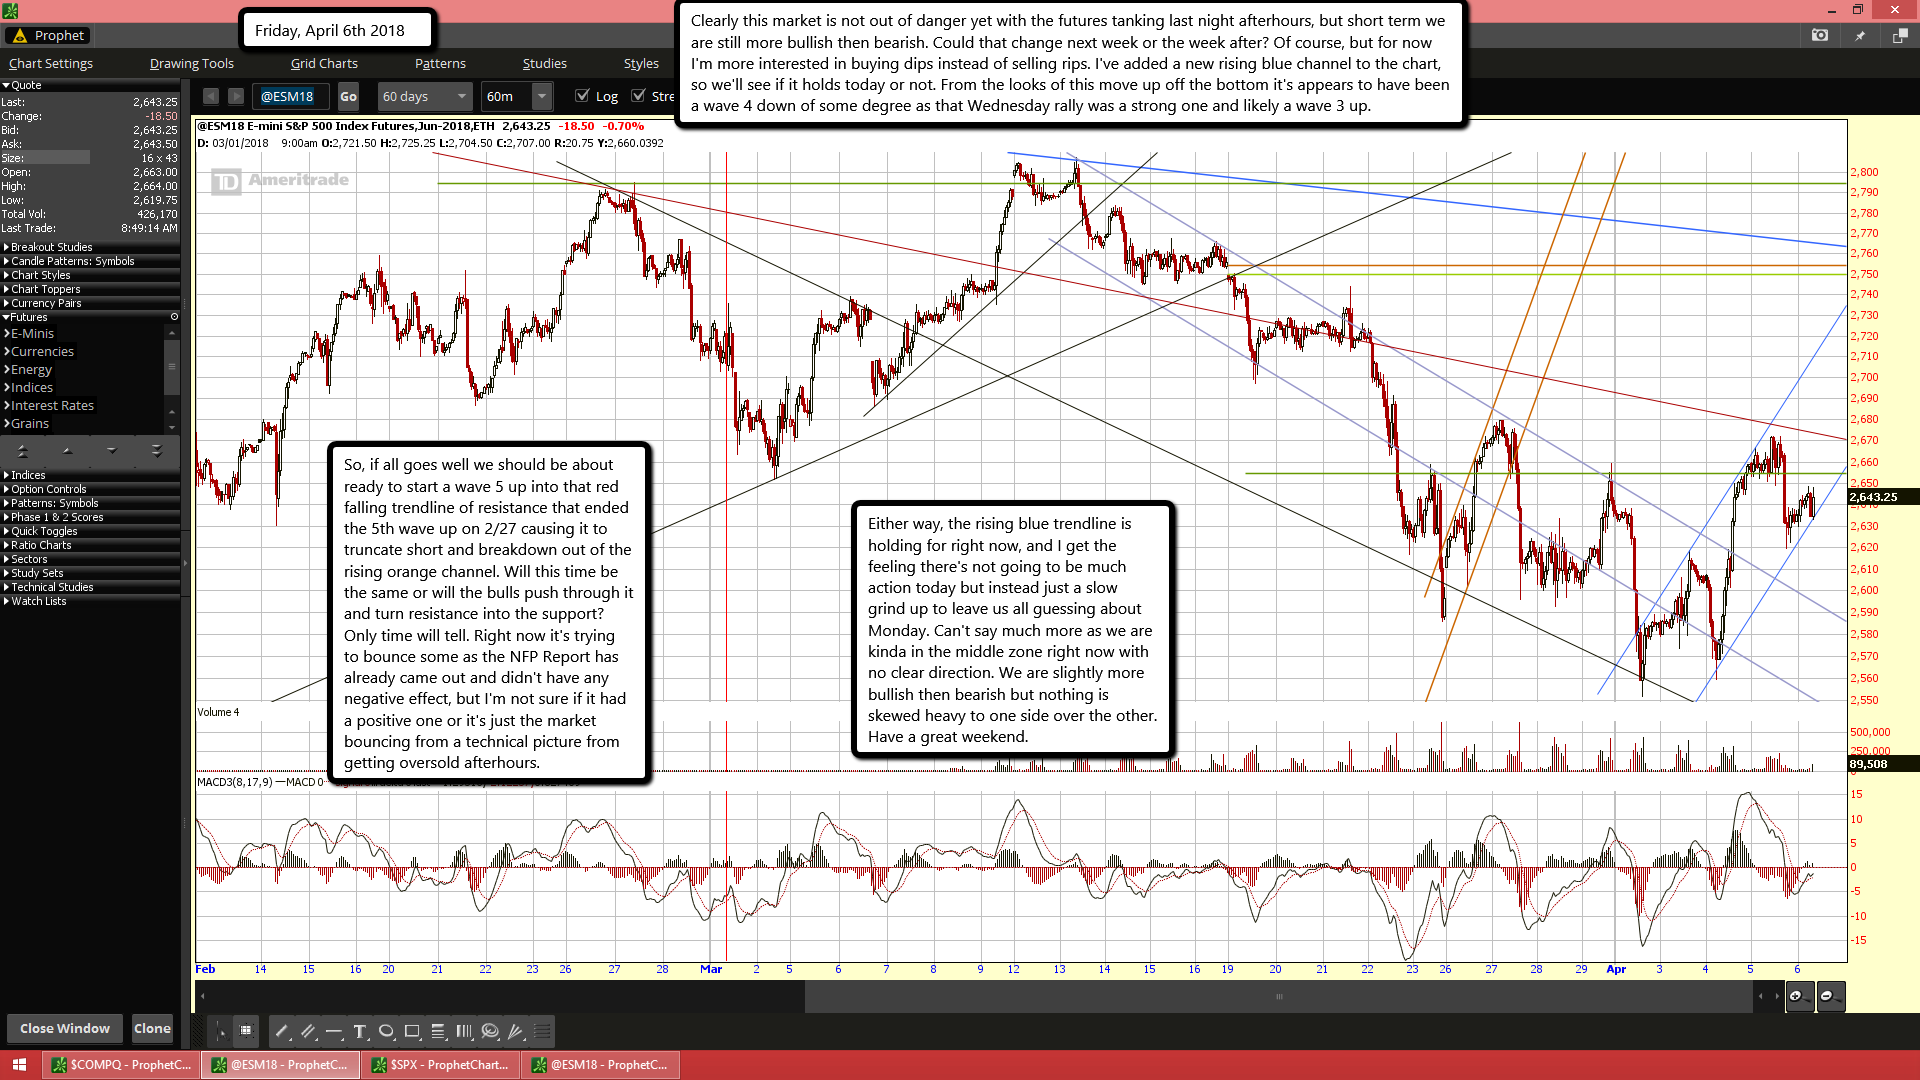
Clearly this market is not out of danger yet with the futures tanking last night afterhours, but short term we are still more bullish then bearish. Could that change next week or the week after? Of course, but for now I'm more interested in buying dips instead of selling rips. I've added a new rising blue channel to the chart, so we'll see if it holds today or not. From the looks of this move up off the bottom it's appears to have been a wave 4 down of some degree as that Wednesday rally was a strong one and likely a wave 3 up.

So, if all goes well we should be about ready to start a wave 5 up into that red falling trendline of resistance that ended the 5th wave up on 2/27 causing it to truncate short and breakdown out of the rising orange channel. Will this time be the same or will the bulls push through it and turn resistance into the support? Only time will tell. Right now it's trying to bounce some as the NFP Report has already came out and didn't have any negative effect, but I'm not sure if it had a positive one or it's just the market bouncing from a technical picture from getting oversold afterhours.

Either way, the rising blue trendline is holding for right now, and I get the feeling there's not going to be much action today but instead just a slow grind up to leave us all guessing about Monday. Can't say much more as we are kinda in the middle zone right now with no clear direction. We are slightly more bullish then bearish but nothing is skewed heavy to one side over the other. Have a great weekend.

ES Morning Update April 5th 2018

0

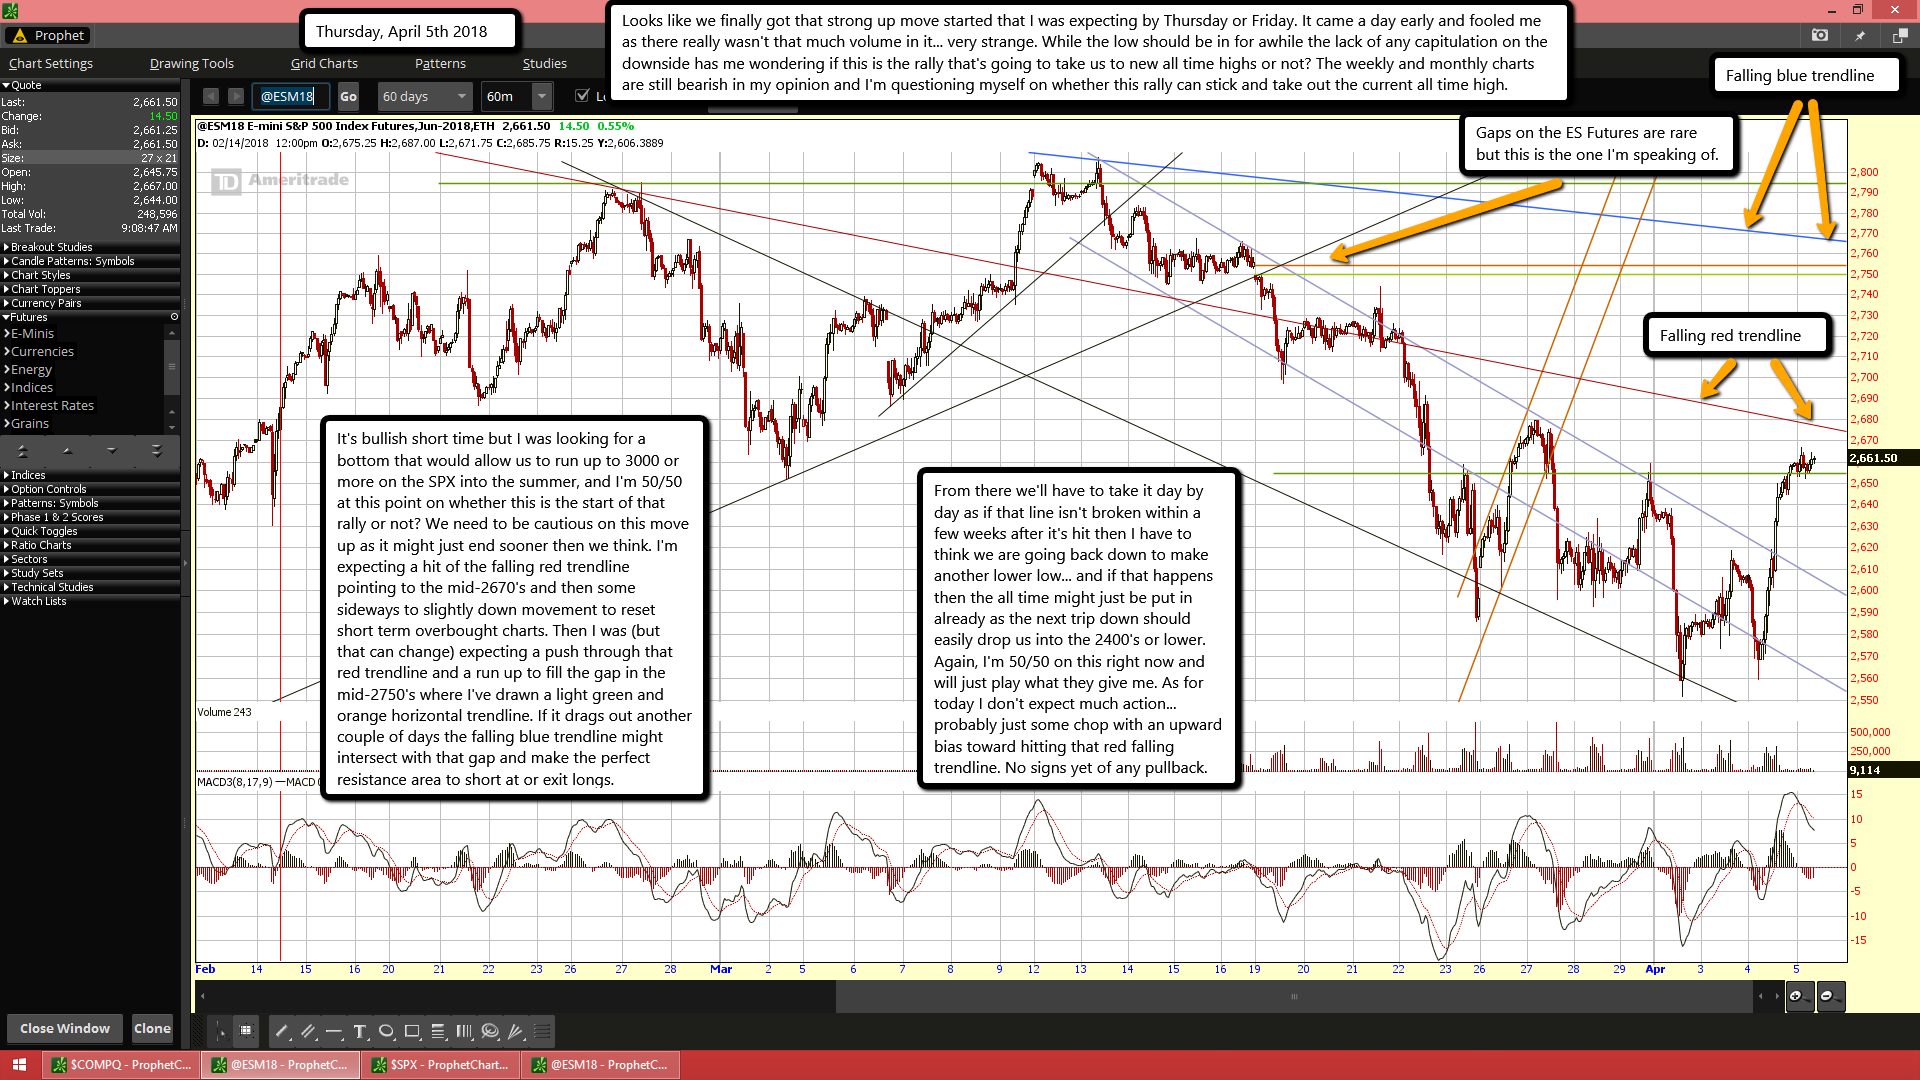
Looks like we finally got that strong up move started that I was expecting by Thursday or Friday. It came a day early and fooled me as there really wasn't that much volume in it... very strange. While the low should be in for awhile the lack of any capitulation on the downside has me wondering if this is the rally that's going to take us to new all time highs or not? The weekly and monthly charts are still bearish in my opinion and I'm questioning myself on whether this rally can stick and take out the current all time high.

It's bullish short time but I was looking for a bottom that would allow us to run up to 3000 or more on the SPX into the summer, and I'm 50/50 at this point on whether this is the start of that rally or not? We need to be cautious on this move up as it might just end sooner then we think. I'm expecting a hit of the falling red trendline pointing to the mid-2670's and then some sideways to slightly down movement to reset short term overbought charts. Then I was (but that can change) expecting a push through that red trendline and a run up to fill the gap in the mid-2750's where I've drawn a light green and orange horizontal trendline. If it drags out another couple of days the falling blue trendline might intersect with that gap and make the perfect resistance area to short at or exit longs.

From there we'll have to take it day by day as if that line isn't broken within a few weeks after it's hit then I have to think we are going back down to make another lower low... and if that happens then the all time might just be put in already as the next trip down should easily drop us into the 2400's or lower. Again, I'm 50/50 on this right now and will just play what they give me. As for today I don't expect much action... probably just some chop with an upward bias toward hitting that red falling trendline. No signs yet of any pullback.

Fed Panic Stricken About Inflation – Michael Pento

0

By Greg Hunter’s USAWatchdog.com

Money manager and financial writer Michael Pento says the federal government is “burning the furniture to heat the house.” Pento contends, “If you are burning the furniture in your house to heat your house, guess what, you are not too far away from freezing to death.  The government is now selling its assets to try to make the fiscal situation look better.  We have so much red ink in the government today.  Our debt to GDP ratio is now way above 100%.  The budget deficits are way over $1 trillion and going much higher.  The government is forced now to sell assets to try to make it look better. . . . They’re so desperate for money that they are draining the Strategic Petroleum Reserve.  They are selling 100 million barrels and draining the Reserve down 45%. . . . That comes to $6 billion.  We are so desperate for money from any place.”

So, what does the Federal Reserve think about the U.S. economy? Pento says, “The Fed is worried about intractable inflation.  They are panic stricken. . . . What you have to understand, and these people will never understand it at the Federal Reserve, is that inflation is about a market psychology about the purchasing power of its currency.  When the market loses faith in a currency’s purchasing power, you get inflation, and it could go hyperinflation.  That’s coming down the road I believe.  It’s not coming because people are becoming prosperous and working and finding employment.”

Pento says the biggest unreported story is the skyrocketing interest rate of LIBOR. What’s that?  Pento explains, “LIBOR, and people don’t understand or talk about it, is the London Inter-Bank Offered Rate.  This rate has gone from 0.3% at the end of 2015 to 2.3% today.  The London Inter-Bank Offered Rate is the rate that is applied to $370 trillion of loans and derivatives.  I did not say “B” billion or “M” million, I said “T”.  $370 trillion worth of derivatives and loans, from credit cards, to student loans, to auto loans are priced off of LIBOR. . . .  That is the biggest reason why the stock market is rolling over because the cost of borrowing money . . . is going up very, very sharply. . . . All of this is going to hit a crescendo in October of 2018.”

Pento says gold prices will naturally be going up. Pento explains, “Why do I think gold is going to prosper?  Gold prospers most when two conditions occur.  One, the dollar rolls over compared to other fiat currencies.  I think that’s going to happen.  Even more so the case, I believe real interest rates are going to fall.  Real interest rates are going to fall along with nominal rates come October.  There is going to be a watershed epiphany on the part of the Fed that they can no longer raise rates.”

Join Greg Hunter as he goes One-on-One with money manager Michael Pento of PentoPort.com.


I have to agree that while I do see another higher high this summer the fall season looks super bearish to me.  Just on an "Elliottwave" basis we are about to start a final 5th wave up that should top out in the summer months and of course from a technical point of view I don't think I've ever seen the market up so high.

In fact in January (before the correction started) the market had spent two month above (outside of) the bollinger bands on the monthly chart.  That's something I've never seen.  It's like the market was climbing Mount Everest and when it got to the top it just walked on air for another two months... yeah, crazy!

Anyway, I bullish into the summer but after that I'm a big ol' bear again!

Red

Here's another person that lays out some similar facts that makes me this fall is going to be very ugly for the bulls...

ES Morning Update April 4th 2018

0

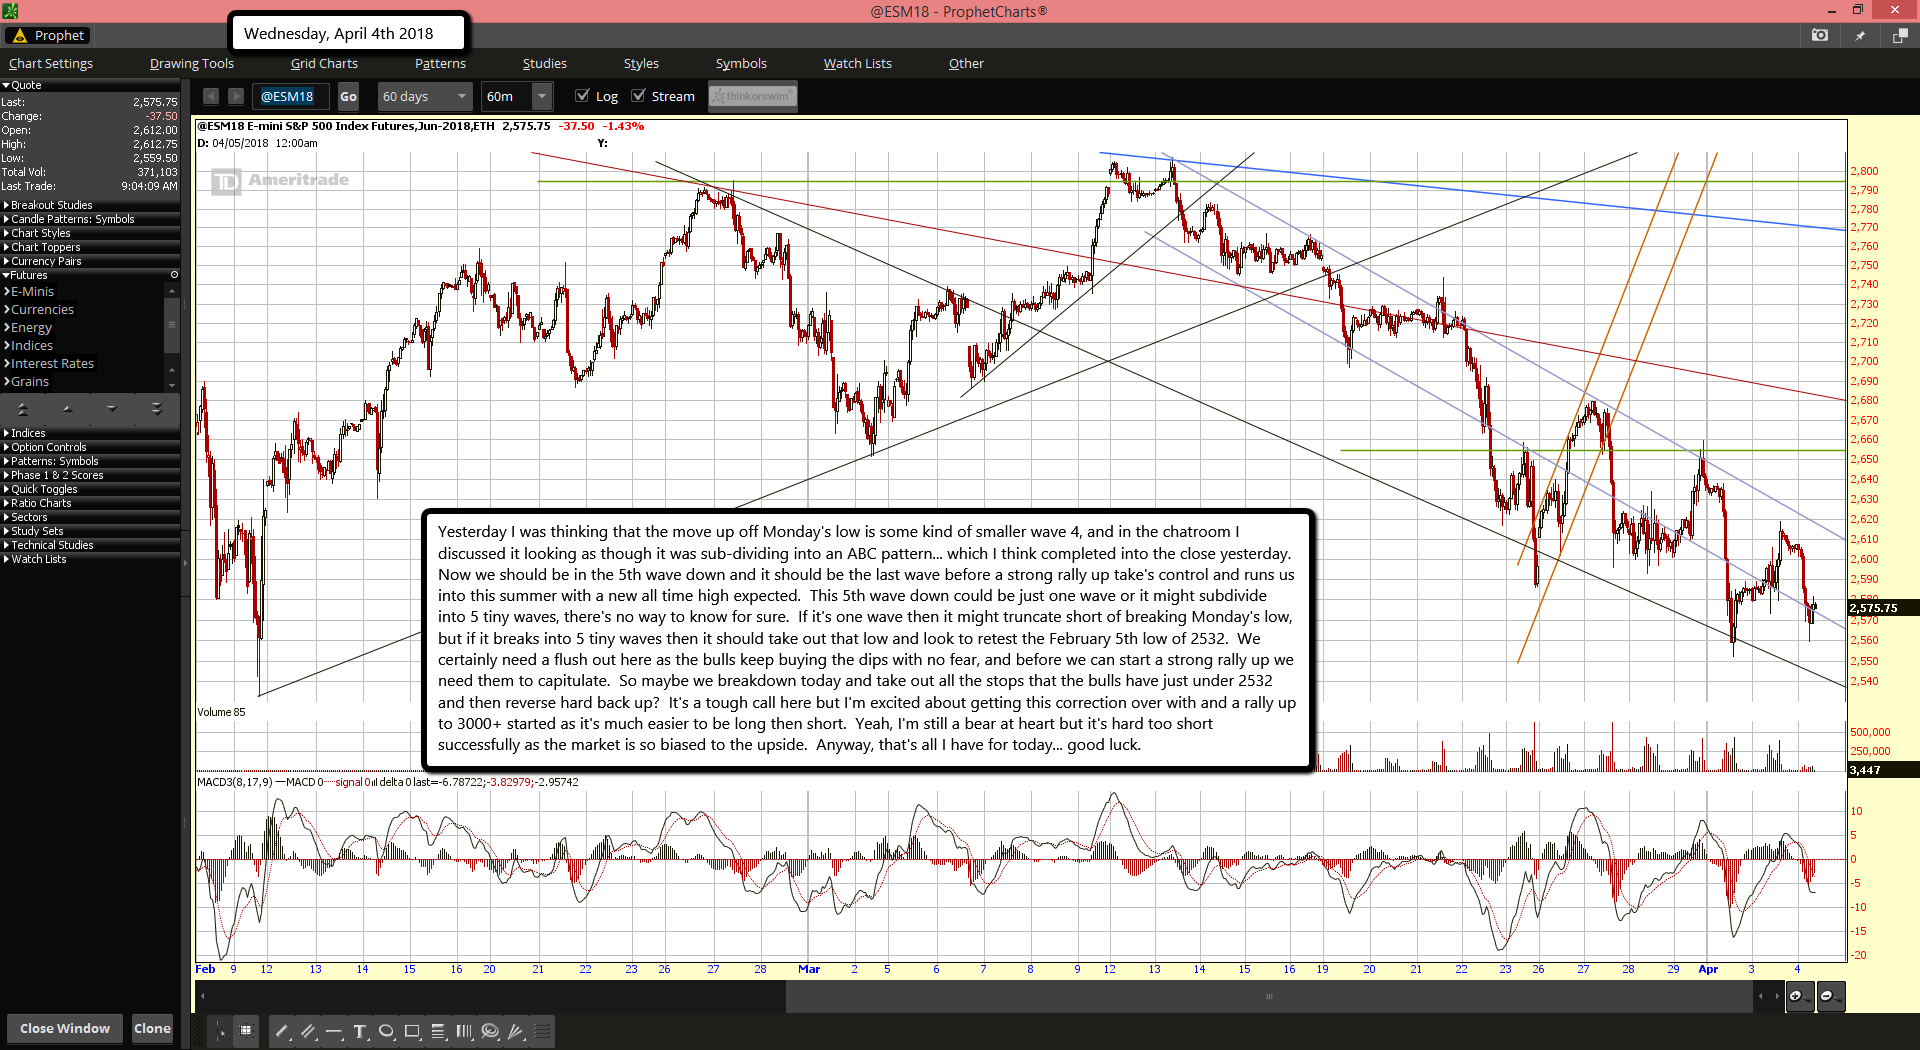
Yesterday I was thinking that the move up off Monday's low is some kind of smaller wave 4, and in the chatroom I discussed it looking as though it was sub-dividing into an ABC pattern... which I think completed into the close yesterday. Now we should be in the 5th wave down and it should be the last wave before a strong rally up take's control and runs us into this summer with a new all time high expected. This 5th wave down could be just one wave or it might subdivide into 5 tiny waves, there's no way to know for sure. If it's one wave then it might truncate short of breaking Monday's low, but if it breaks into 5 tiny waves then it should take out that low and look to retest the February 5th low of 2532. We certainly need a flush out here as the bulls keep buying the dips with no fear, and before we can start a strong rally up we need them to capitulate. So maybe we breakdown today and take out all the stops that the bulls have just under 2532 and then reverse hard back up? It's a tough call here but I'm excited about getting this correction over with and a rally up to 3000+ started as it's much easier to be long then short. Yeah, I'm still a bear at heart but it's hard too short successfully as the market is so biased to the upside. Anyway, that's all I have for today... good luck.

ES Morning Update April 3rd 2018

0

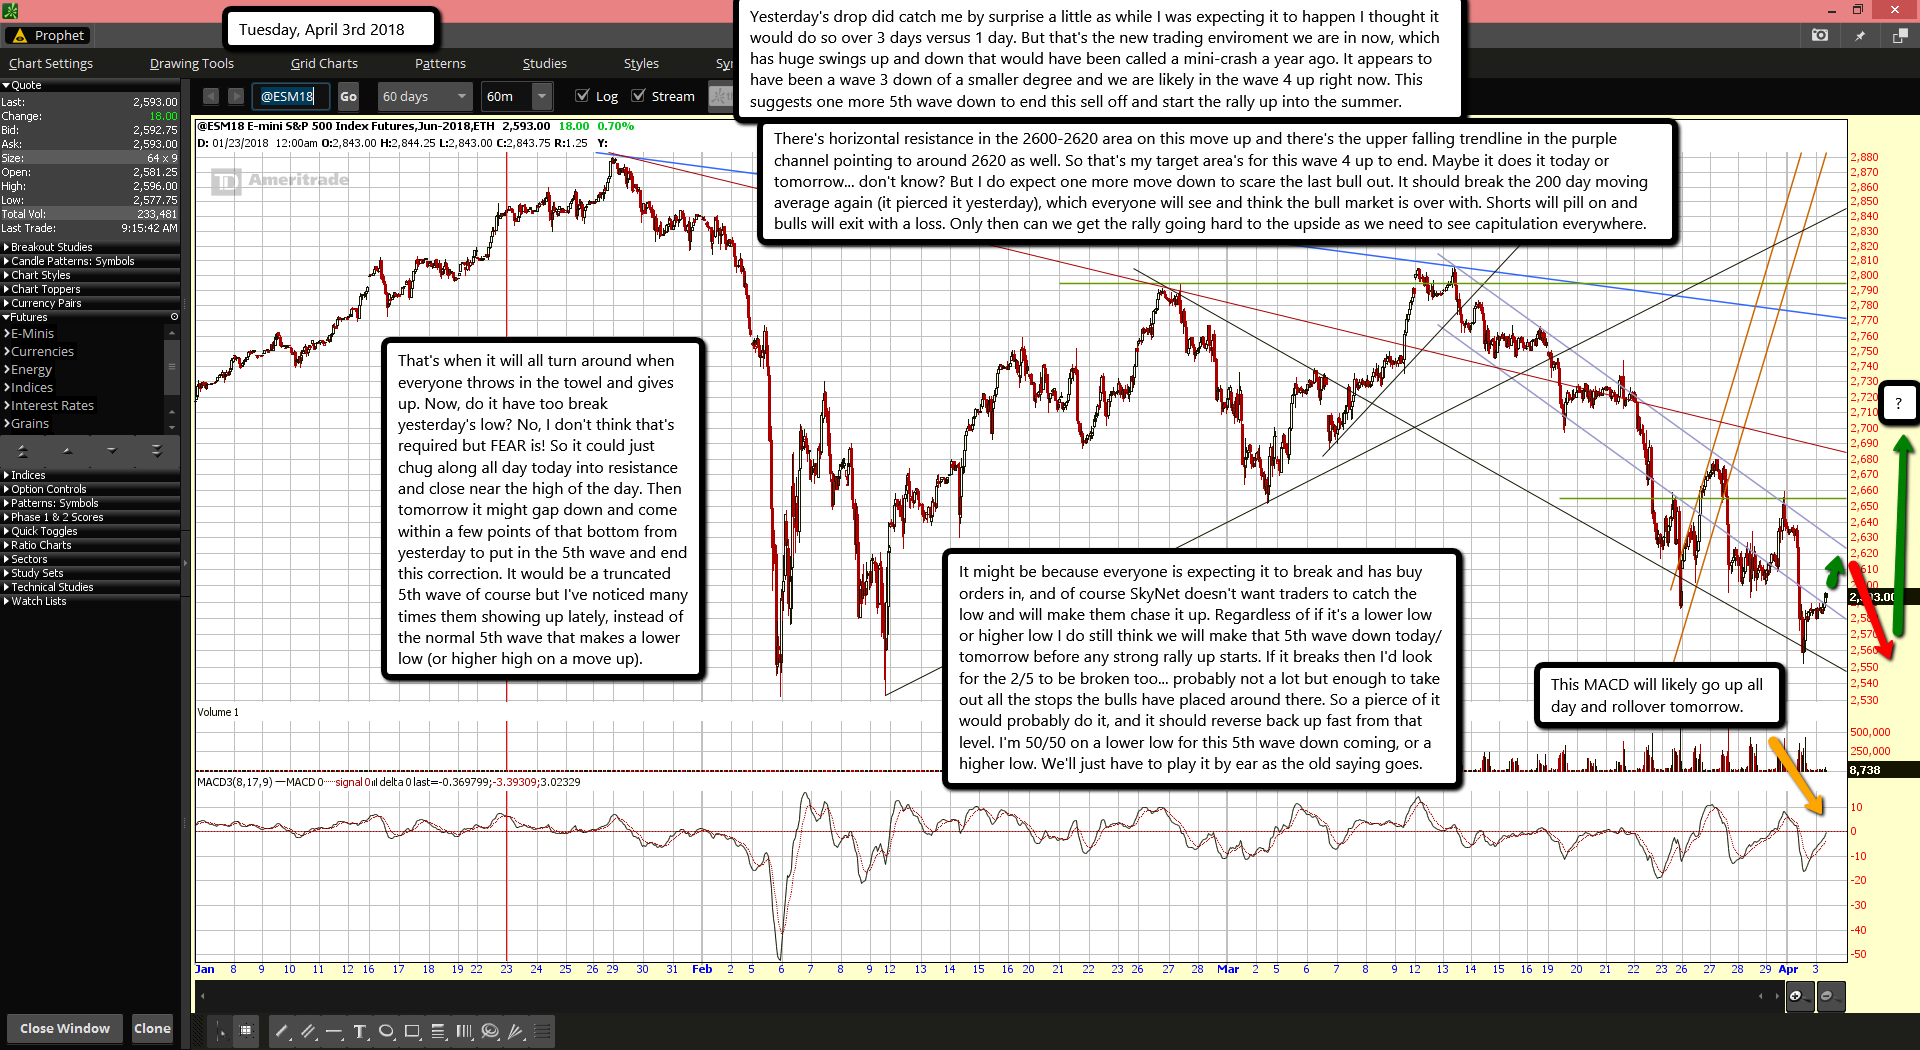
Yesterday's drop did catch me by surprise a little as while I was expecting it to happen I thought it would do so over 3 days versus 1 day. But that's the new trading enviroment we are in now, which has huge swings up and down that would have been called a mini-crash a year ago. It appears to have been a wave 3 down of a smaller degree and we are likely in the wave 4 up right now. This suggests one more 5th wave down to end this sell off and start the rally up into the summer.

There's horizontal resistance in the 2600-2620 area on this move up and there's the upper falling trendline in the purple channel pointing to around 2620 as well. So that's my target area's for this wave 4 up to end. Maybe it does it today or tomorrow... don't know? But I do expect one more move down to scare the last bull out. It should break the 200 day moving average again (it pierced it yesterday), which everyone will see and think the bull market is over with. Shorts will pill on and bulls will exit with a loss. Only then can we get the rally going hard to the upside as we need to see capitulation everywhere.

That's when it will all turn around when everyone throws in the towel and gives up. Now, do it have too break yesterday's low? No, I don't think that's required but FEAR is! So it could just chug along all day today into resistance and close near the high of the day. Then tomorrow it might gap down and come within a few points of that bottom from yesterday to put in the 5th wave and end this correction. It would be a truncated 5th wave of course but I've noticed many times them showing up lately, instead of the normal 5th wave that makes a lower low (or higher high on a move up).

It might be because everyone is expecting it to break and has buy orders in, and of course SkyNet doesn't want traders to catch the low and will make them chase it up. Regardless of if it's a lower low or higher low I do still think we will make that 5th wave down today/tomorrow before any strong rally up starts. If it breaks then I'd look for the 2/5 to be broken too... probably not a lot but enough to take out all the stops the bulls have placed around there. So a pierce of it would probably do it, and it should reverse back up fast from that level. I'm 50/50 on a lower low for this 5th wave down coming, or a higher low. We'll just have to play it by ear as the old saying goes.

ES Morning Update April 2nd 2018

0

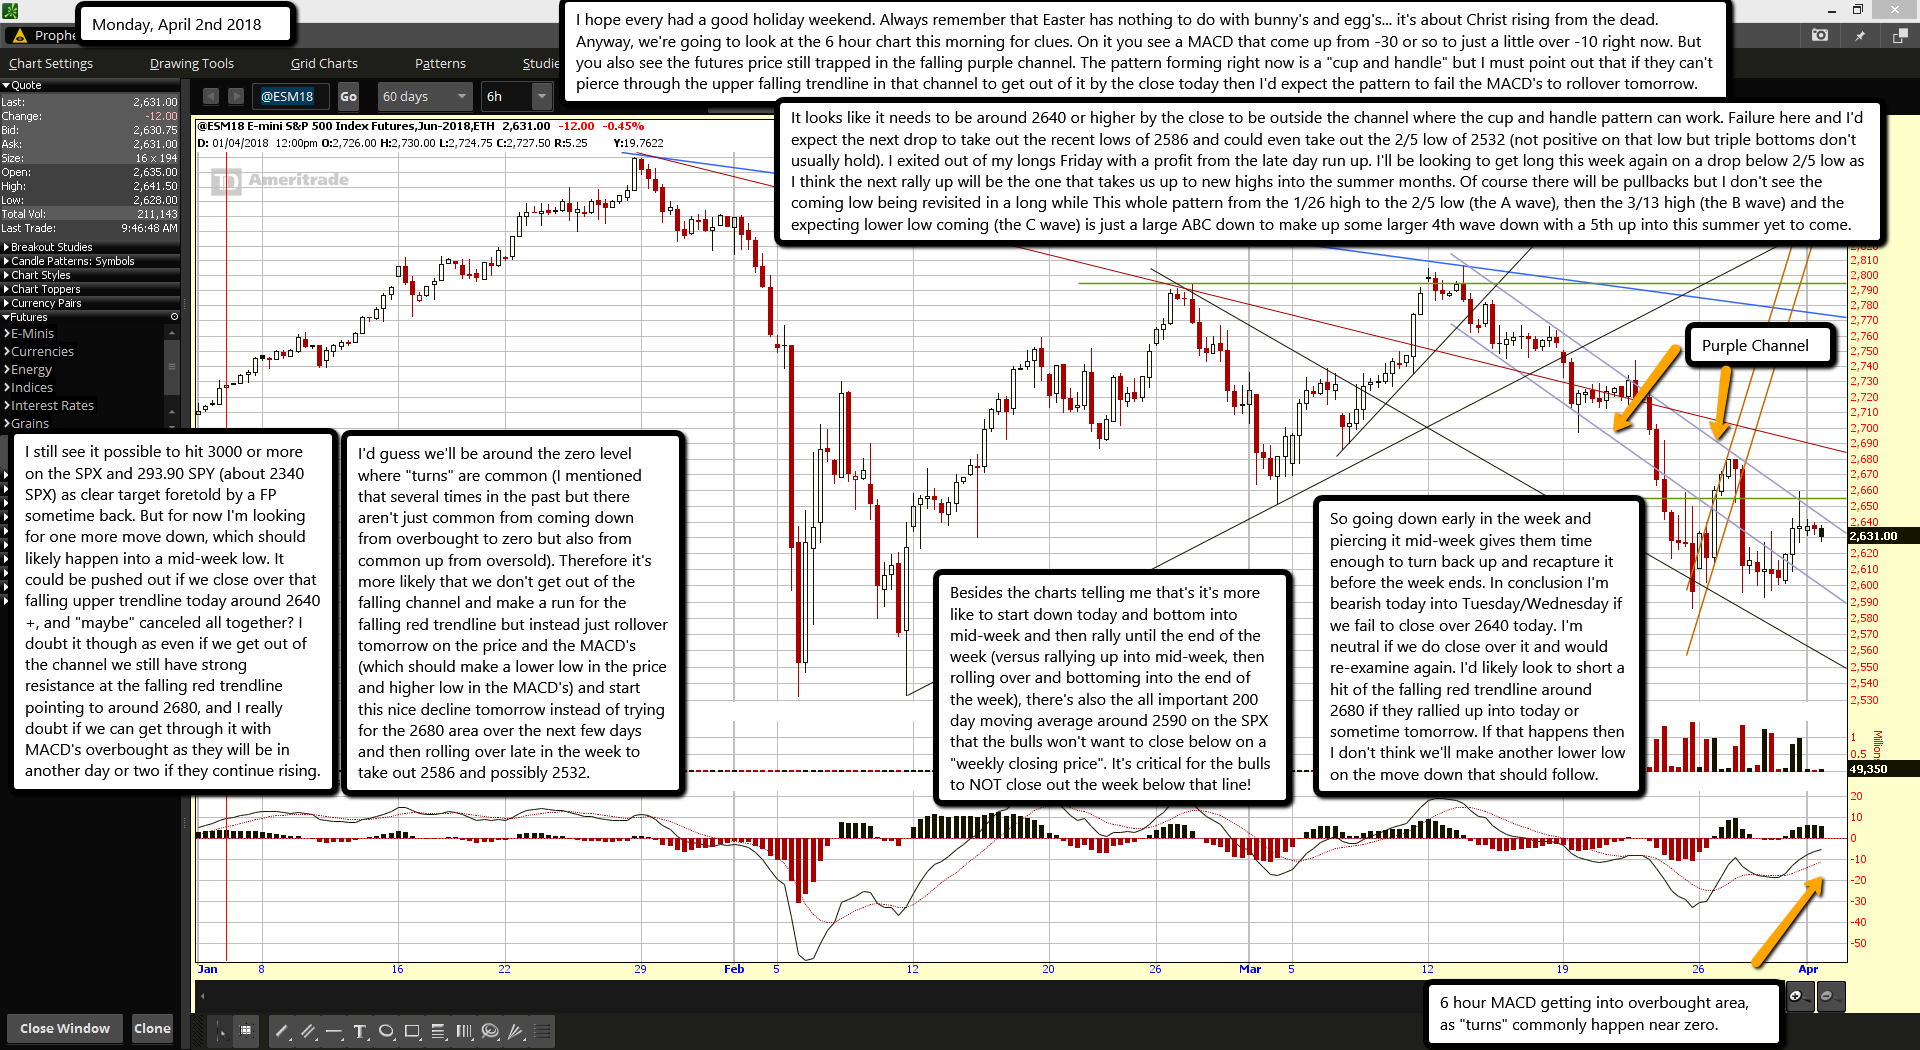
I hope every had a good holiday weekend. Always remember that Easter has nothing to do with bunny's and egg's... it's about Christ rising from the dead. Anyway, we're going to look at the 6 hour chart this morning for clues. On it you see a MACD that come up from -30 or so to just a little over -10 right now. But you also see the futures price still trapped in the falling purple channel. The pattern forming right now is a "cup and handle" but I must point out that if they can't pierce through the upper falling trendline in that channel to get out of it by the close today then I'd expect the pattern to fail the MACD's to rollover tomorrow.

It looks like it needs to be around 2640 or higher by the close to be outside the channel where the cup and handle pattern can work. Failure here and I'd expect the next drop to take out the recent lows of 2586 and could even take out the 2/5 low of 2532 (not positive on that low but triple bottoms don't usually hold). I exited out of my longs Friday with a profit from the late day run up. I'll be looking to get long this week again on a drop below 2/5 low as I think the next rally up will be the one that takes us up to new highs into the summer months. Of course there will be pullbacks but I don't see the coming low being revisited in a long while This whole pattern from the 1/26 high to the 2/5 low (the A wave), then the 3/13 high (the B wave) and the expecting lower low coming (the C wave) is just a large ABC down to make up some larger 4th wave down with a 5th up into this summer yet to come.

I still see it possible to hit 3000 or more on the SPX and 293.90 SPY (about 2340 SPX) as clear target foretold by a FP sometime back. But for now I'm looking for one more move down, which should likely happen into a mid-week low. It could be pushed out if we close over that falling upper trendline today around 2640+, and "maybe" canceled all together? I doubt it though as even if we get out of the channel we still have strong resistance at the falling red trendline pointing to around 2680, and I really doubt if we can get through it with MACD's overbought as they will be in another day or two if they continue rising.

I'd guess we'll be around the zero level where "turns" are common (I mentioned that several times in the past but there aren't just common from coming down from overbought to zero but also from common up from oversold). Therefore it's more likely that we don't get out of the falling channel and make a run for the falling red trendline but instead just rollover tomorrow on the price and the MACD's (which should make a lower low in the price and higher low in the MACD's) and start this nice decline tomorrow instead of trying for the 2680 area over the next few days and then rolling over late in the week to take out 2586 and possibly 2532.

Besides the charts telling me that's it's more like to start down today and bottom into mid-week and then rally until the end of the week (versus rallying up into mid-week, then rolling over and bottoming into the end of the week), there's also the all important 200 day moving average around 2590 on the SPX that the bulls won't want to close below on a "weekly closing price". It's critical for the bulls to NOT close out the week below that line!

So going down early in the week and piercing it mid-week gives them time enough to turn back up and recapture it before the week ends. In conclusion I'm bearish today into Tuesday/Wednesday if we fail to close over 2640 today. I'm neutral if we do close over it and would re-examine again. I'd likely look to short a hit of the falling red trendline around 2680 if they rallied up into today or sometime tomorrow. If that happens then I don't think we'll make another lower low on the move down that should follow.

ES Morning Update March 29th 2018

0

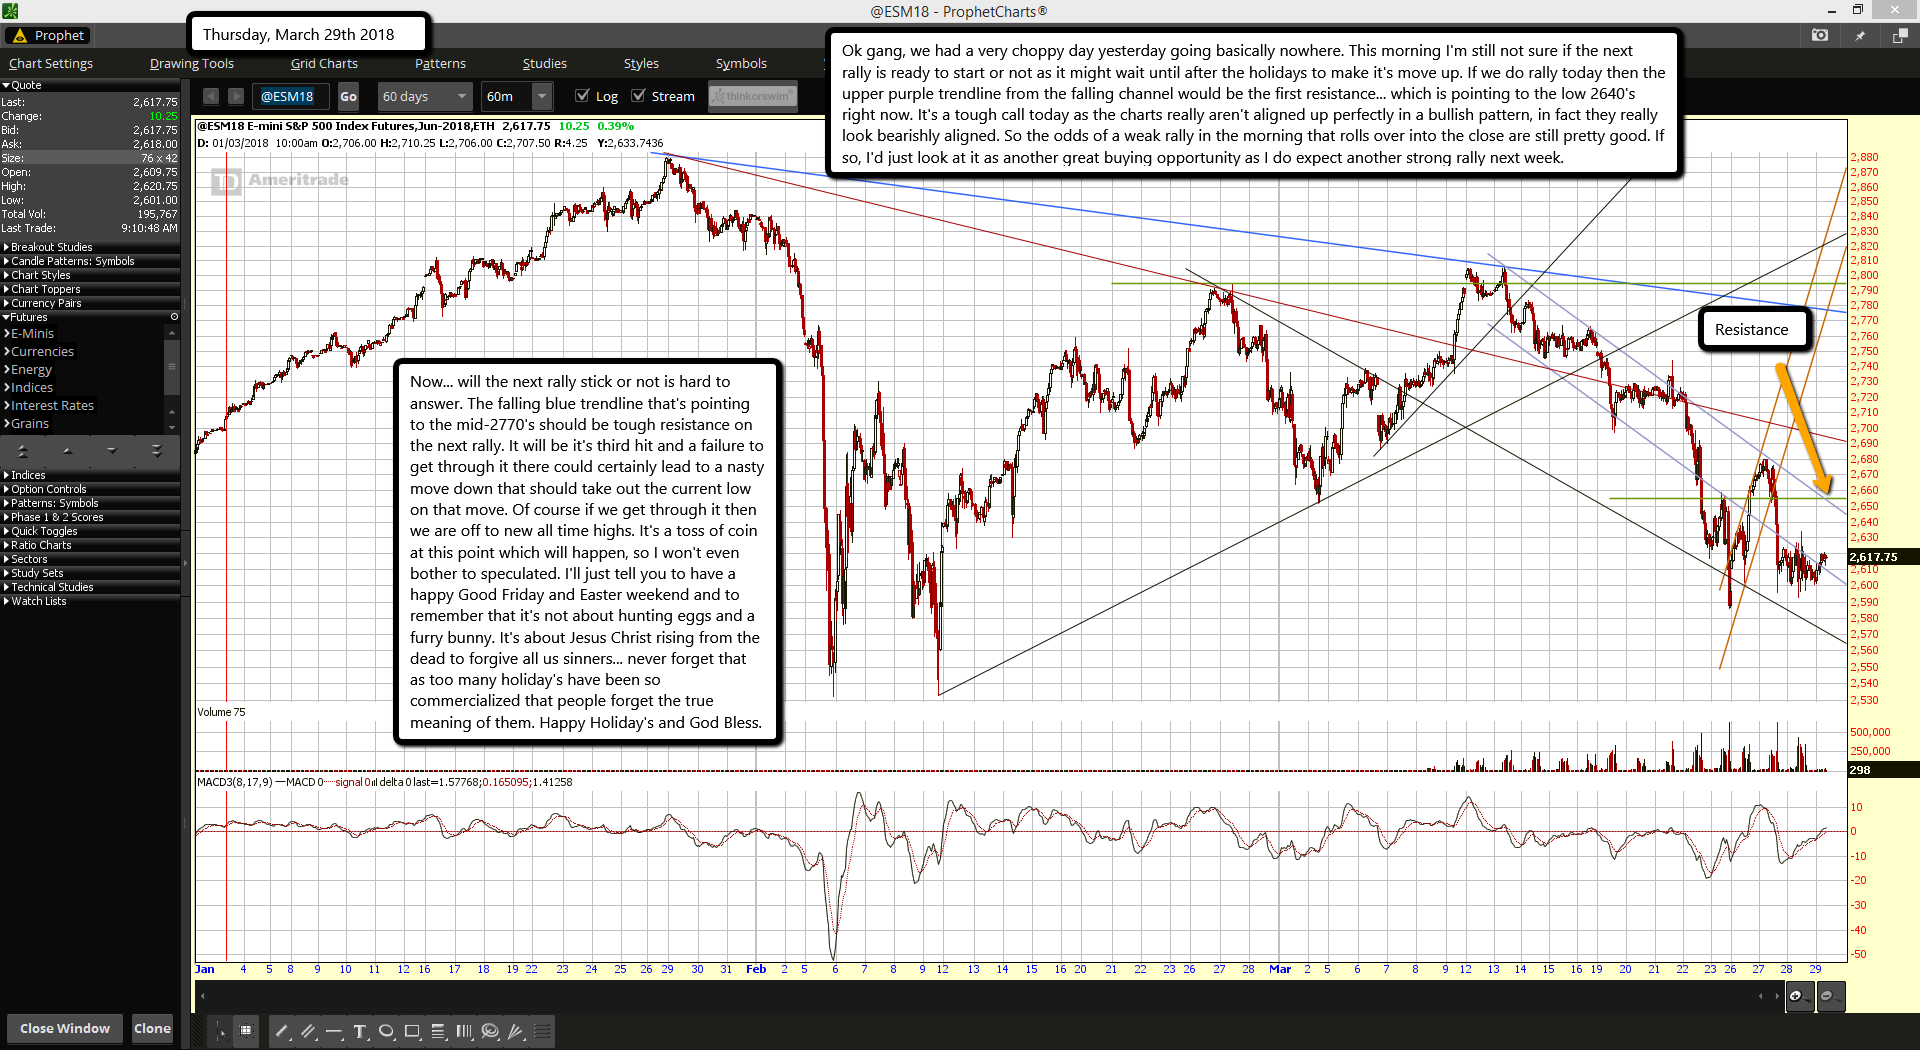
Ok gang, we had a very choppy day yesterday going basically nowhere. This morning I'm still not sure if the next rally is ready to start or not as it might wait until after the holidays to make it's move up. If we do rally today then the upper purple trendline from the falling channel would be the first resistance... which is pointing to the low 2640's right now. It's a tough call today as the charts really aren't aligned up perfectly in a bullish pattern, in fact they really look bearishly aligned. So the odds of a weak rally in the morning that rolls over into the close are still pretty good. If so, I'd just look at it as another great buying opportunity as I do expect another strong rally next week.

Now... will the next rally stick or not is hard to answer. The falling blue trendline that's pointing to the mid-2770's should be tough resistance on the next rally. It will be it's third hit and a failure to get through it there could certainly lead to a nasty move down that should take out the current low on that move. Of course if we get through it then we are off to new all time highs. It's a toss of coin at this point which will happen, so I won't even bother to speculated. I'll just tell you to have a happy Good Friday and Easter weekend and to remember that it's not about hunting eggs and a furry bunny. It's about Jesus Christ rising from the dead to forgive all us sinners... never forget that as too many holiday's have been so commercialized that people forget the true meaning of them. Happy Holiday's and God Bless.

ES Morning Update March 28th 2018

0

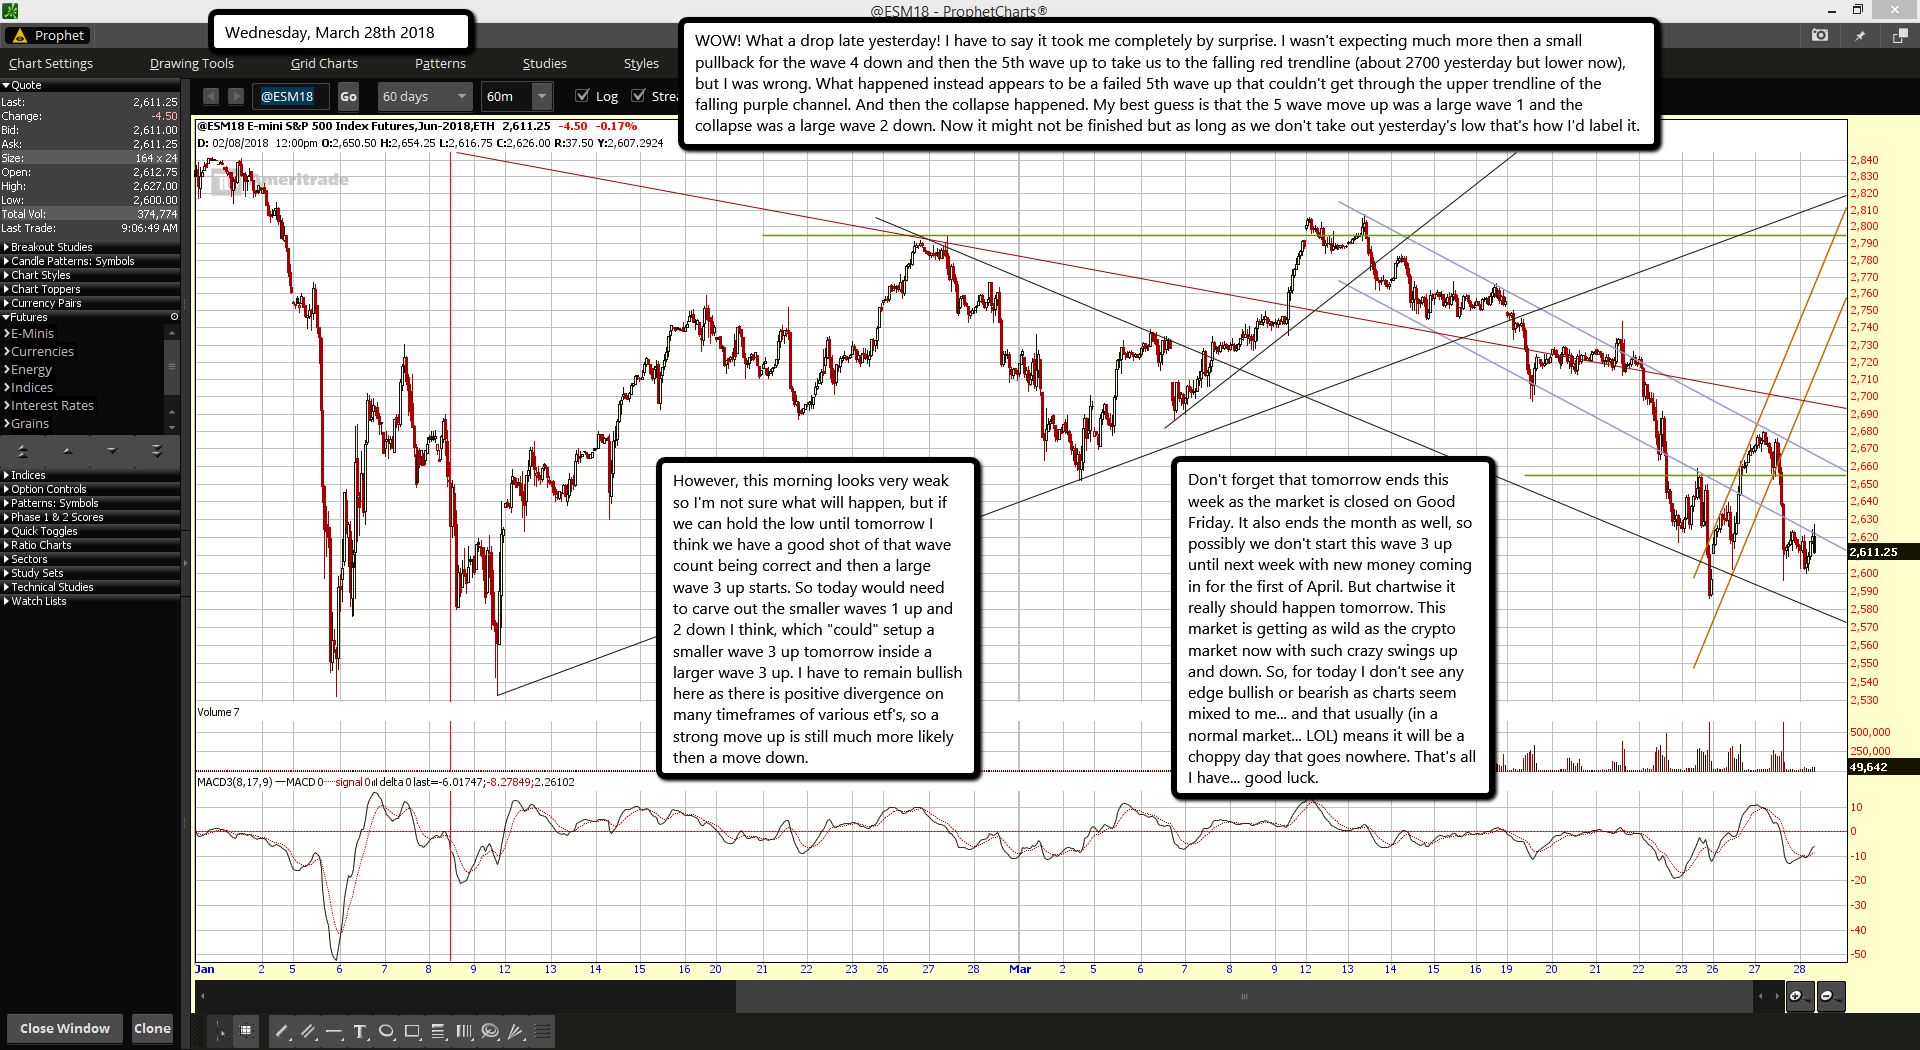
WOW! What a drop late yesterday! I have to say it took me completely by surprise. I wasn't expecting much more then a small pullback for the wave 4 down and then the 5th wave up to take us to the falling red trendline (about 2700 yesterday but lower now), but I was wrong. What happened instead appears to be a failed 5th wave up that couldn't get through the upper trendline of the falling purple channel. And then the collapse happened. My best guess is that the 5 wave move up was a large wave 1 and the collapse was a large wave 2 down. Now it might not be finished but as long as we don't take out yesterday's low that's how I'd label it.

However, this morning looks very weak so I'm not sure what will happen, but if we can hold the low until tomorrow I think we have a good shot of that wave count being correct and then a large wave 3 up starts. So today would need to carve out the smaller waves 1 up and 2 down I think, which "could" setup a smaller wave 3 up tomorrow inside a larger wave 3 up. I have to remain bullish here as there is positive divergence on many timeframes of various etf's, so a strong move up is still much more likely then a move down.

Don't forget that tomorrow ends this week as the market is closed on Good Friday. It also ends the month as well, so possibly we don't start this wave 3 up until next week with new money coming in for the first of April. But chartwise it really should happen tomorrow. This market is getting as wild as the crypto market now with such crazy swings up and down. So, for today I don't see any edge bullish or bearish as charts seem mixed to me... and that usually (in a normal market... LOL) means it will be a choppy day that goes nowhere. That's all I have... good luck.

ES Morning Update March 27th 2018

0

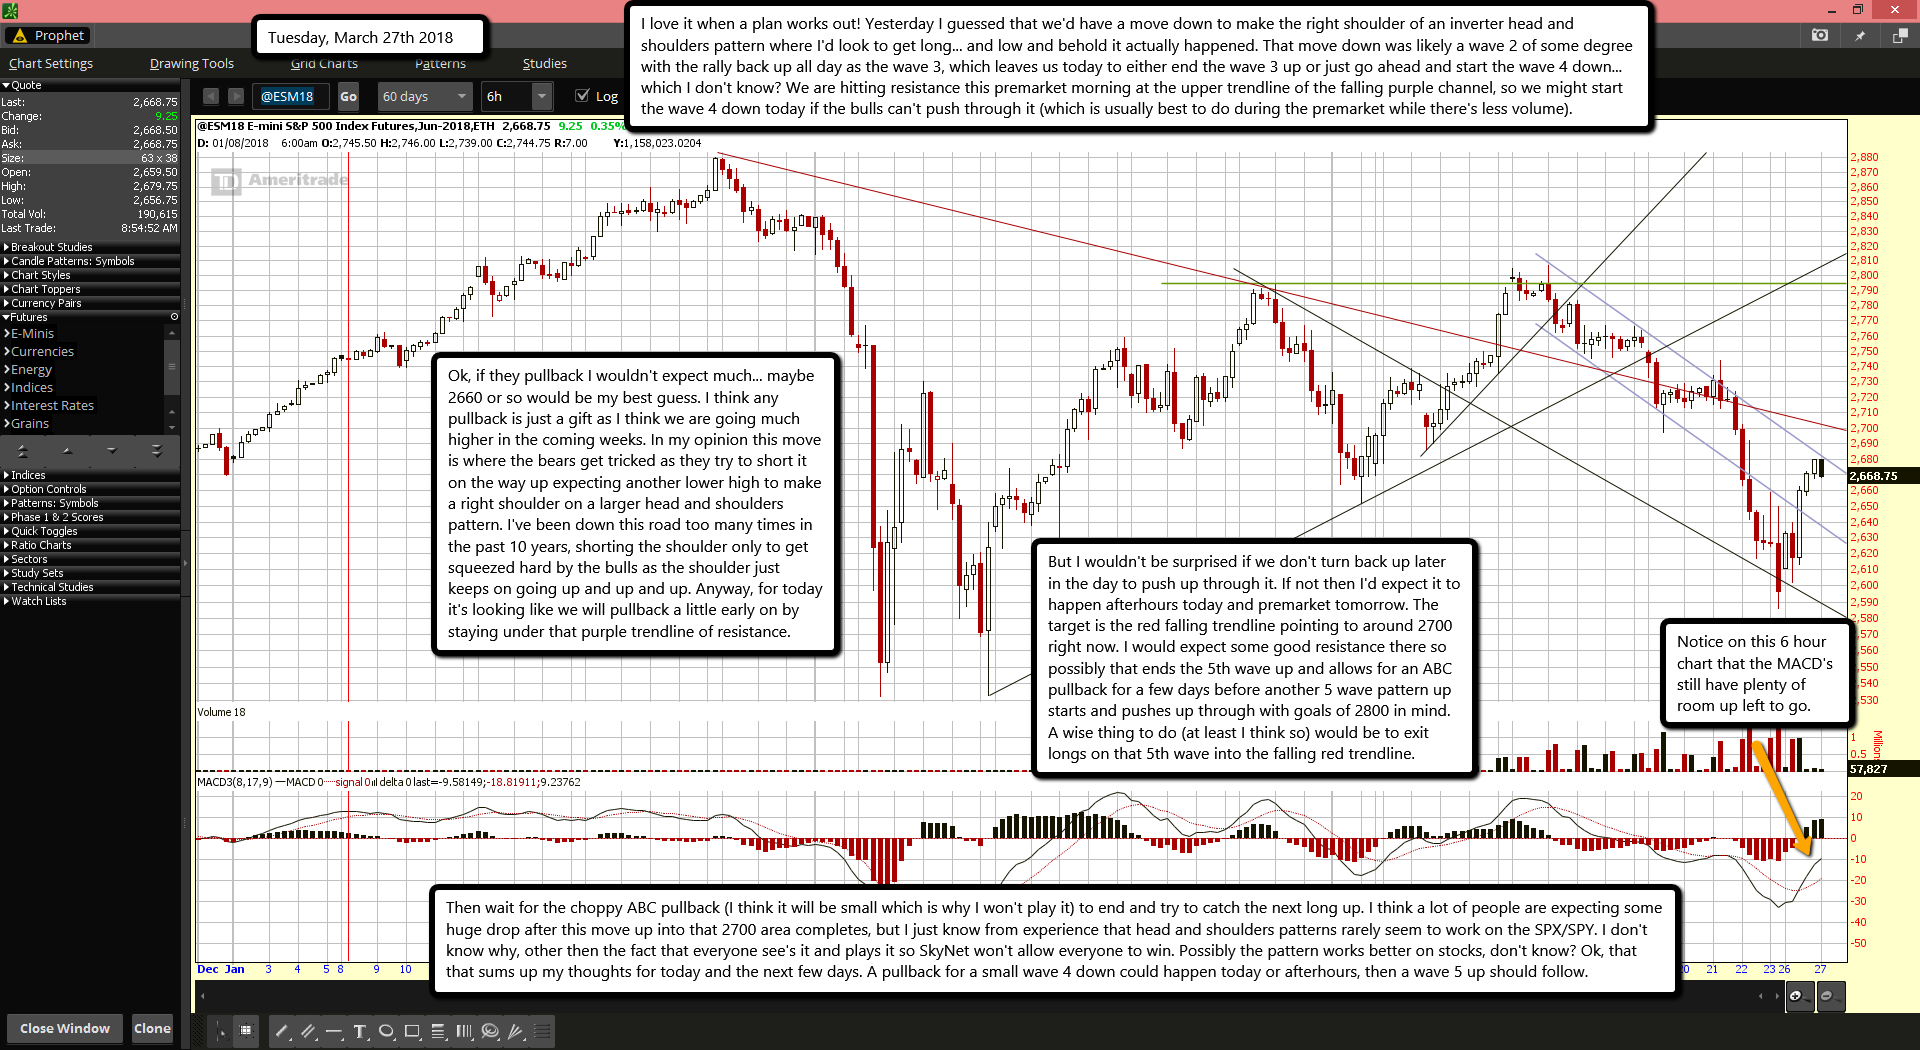
I love it when a plan works out! Yesterday I guessed that we'd have a move down to make the right shoulder of an inverter head and shoulders pattern where I'd look to get long... and low and behold it actually happened. That move down was likely a wave 2 of some degree with the rally back up all day as the wave 3, which leaves us today to either end the wave 3 up or just go ahead and start the wave 4 down... which I don't know? We are hitting resistance this premarket morning at the upper trendline of the falling purple channel, so we might start the wave 4 down today if the bulls can't push through it (which is usually best to do during the premarket while there's less volume).

Ok, if they pullback I wouldn't expect much... maybe 2660 or so would be my best guess. I think any pullback is just a gift as I think we are going much higher in the coming weeks. In my opinion this move is where the bears get tricked as they try to short it on the way up expecting another lower high to make a right shoulder on a larger head and shoulders pattern. I've been down this road too many times in the past 10 years, shorting the shoulder only to get squeezed hard by the bulls as the shoulder just keeps on going up and up and up. Anyway, for today it's looking like we will pullback a little early on by staying under that purple trendline of resistance.

But I wouldn't be surprised if we don't turn back up later in the day to push up through it. If not then I'd expect it to happen afterhours today and premarket tomorrow. The target is the red falling trendline pointing to around 2700 right now. I would expect some good resistance there so possibly that ends the 5th wave up and allows for an ABC pullback for a few days before another 5 wave pattern up starts and pushes up through with goals of 2800 in mind. A wise thing to do (at least I think so) would be to exit longs on that 5th wave into the falling red trendline.

Then wait for the choppy ABC pullback (I think it will be small which is why I won't play it) to end and try to catch the next long up. I think a lot of people are expecting some huge drop after this move up into that 2700 area completes, but I just know from experience that head and shoulders patterns rarely seem to work on the SPX/SPY. I don't know why, other then the fact that everyone see's it and plays it so SkyNet won't allow everyone to win. Possibly the pattern works better on stocks, don't know? Ok, that that sums up my thoughts for today and the next few days. A pullback for a small wave 4 down could happen today or afterhours, then a wave 5 up should follow.

ES Morning Update March 26th 2018

0

Last week was brutal for the bulls but this week looks to be the opposite. This morning we are opening up strongly right out of the gate with the futures up over 30 points this premarket morning. Once open though I'd suspect we'll see some trapped bulls hit the sell button to exit but I don't see the market going down again to a lower low. What's more likely is that we drop some to make a right shoulder of an "inverted head and shoulders" pattern, and then launch back up strongly all week. This first move up is likely just a small wave one and the panicked selling at the open by trapped bulls (if it happens?) would be a small wave 2 down in my view, and an opportunity to get long for what is likely to be a very strong and long lasting rally.

I do not expect this to die out in a day or so but to last all week and to produce a large point gain. I would not be surprised if we make new all time highs again before the rally ends. Maybe it takes a month or two, don't know? But this rally is likely to stay for awhile and should not be shorted but should be bought up on pullbacks. I'll be looking for that pullback today to get long myself but if there's no pullback I'll still look to average into a long position. Ideally we drop back to around 2600 to make that right shoulder but again... no guarantee. Good luck to everyone. Oh... one last thing, if for some reason we drop into the red today and close slightly lower I'd be super, super, super bullish about tomorrow and would look at it like a gift and would go balls to the walls long.

ES Morning Update March 23rd 2018

0

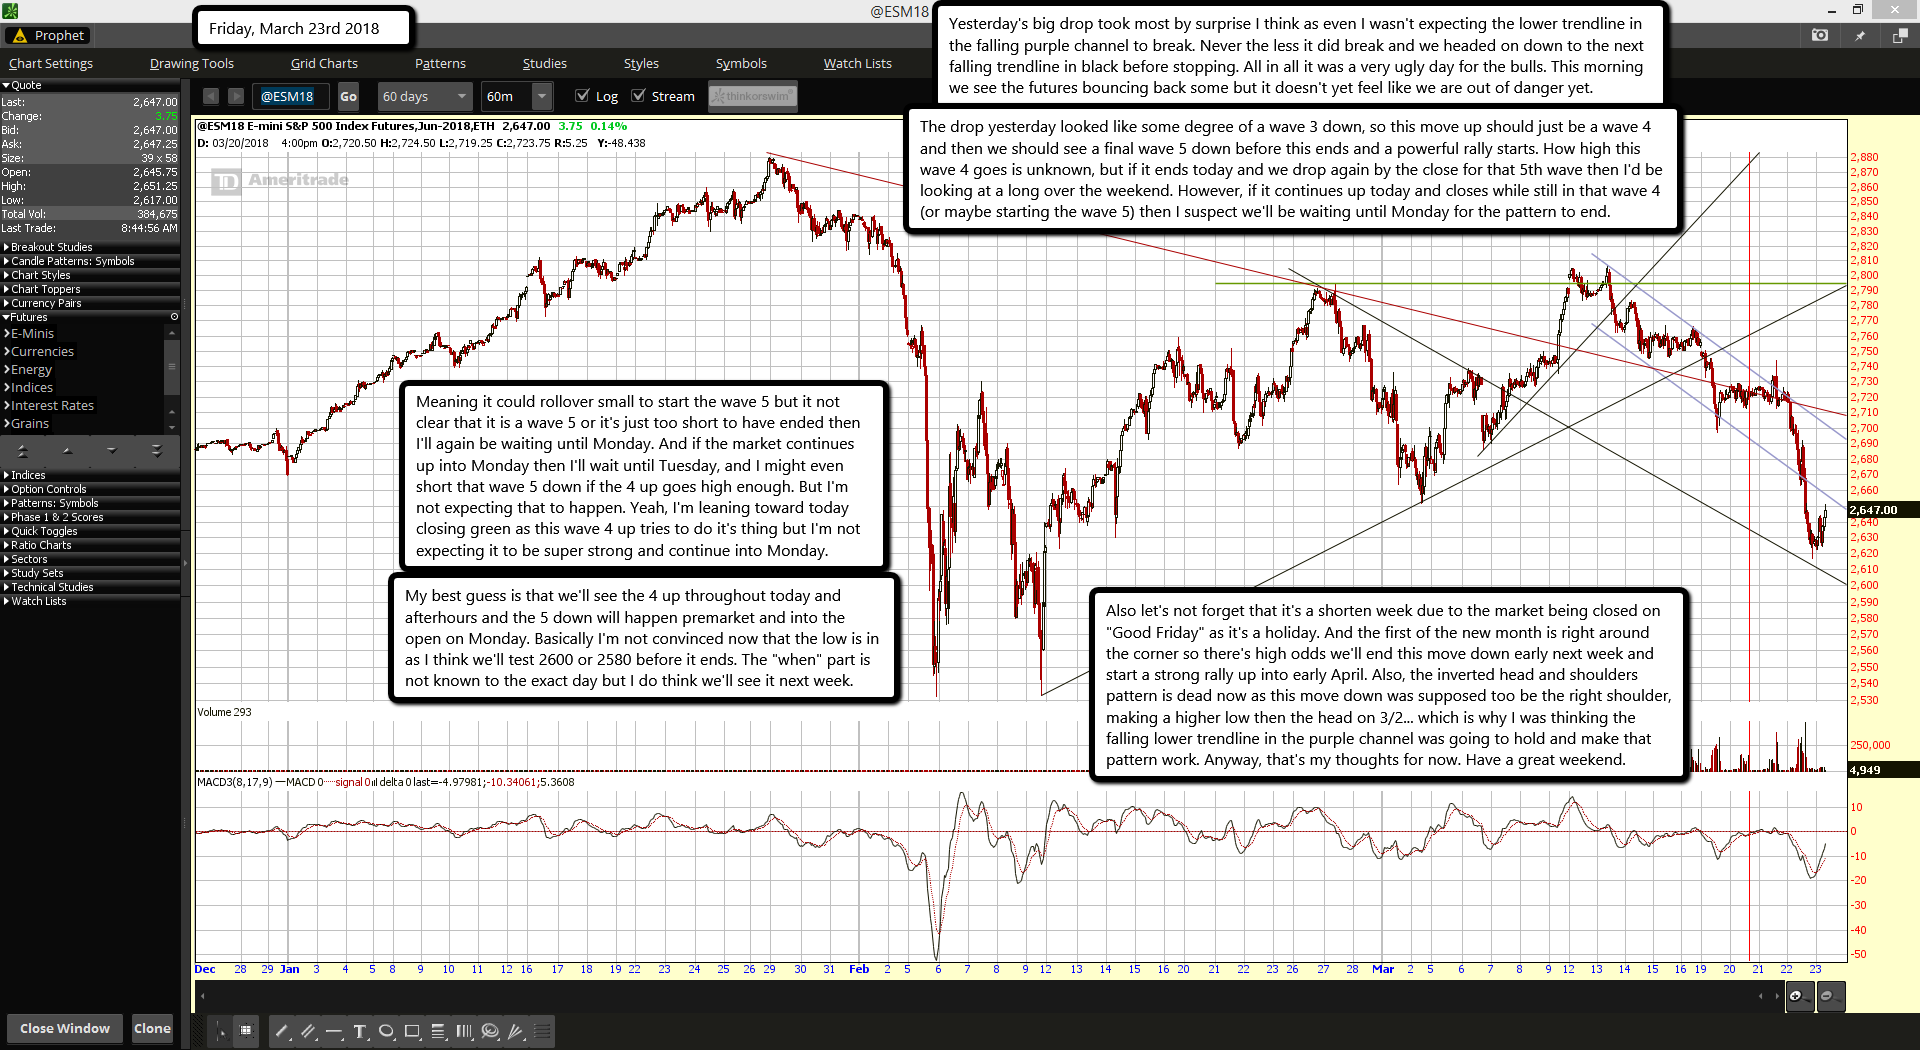
Yesterday's big drop took most by surprise I think as even I wasn't expecting the lower trendline in the falling purple channel to break. Never the less it did break and we headed on down to the next falling trendline in black before stopping. All in all it was a very ugly day for the bulls. This morning we see the futures bouncing back some but it doesn't yet feel like we are out of danger yet.

The drop yesterday looked like some degree of a wave 3 down, so this move up should just be a wave 4 and then we should see a final wave 5 down before this ends and a powerful rally starts. How high this wave 4 goes is unknown, but if it ends today and we drop again by the close for that 5th wave then I'd be looking at a long over the weekend. However, if it continues up today and closes while still in that wave 4 (or maybe starting the wave 5) then I suspect we'll be waiting until Monday for the pattern to end.

Meaning it could rollover small to start the wave 5 but it not clear that it is a wave 5 or it's just too short to have ended then I'll again be waiting until Monday. And if the market continues up into Monday then I'll wait until Tuesday, and I might even short that wave 5 down if the 4 up goes high enough. But I'm not expecting that to happen. Yeah, I'm leaning toward today closing green as this wave 4 up tries to do it's thing but I'm not expecting it to be super strong and continue into Monday.

My best guess is that we'll see the 4 up throughout today and afterhours and the 5 down will happen premarket and into the open on Monday. Basically I'm not convinced now that the low is in as I think we'll test 2600 or 2580 before it ends. The "when" part is not known to the exact day but I do think we'll see it next week.

Also let's not forget that it's a shorten week due to the market being closed on "Good Friday" as it's a holiday. And the first of the new month is right around the corner so there's high odds we'll end this move down early next week and start a strong rally up into early April. Also, the inverted head and shoulders pattern is dead now as this move down was supposed too be the right shoulder, making a higher low then the head on 3/2... which is why I was thinking the falling lower trendline in the purple channel was going to hold and make that pattern work. Anyway, that's my thoughts for now. Have a great weekend.

ES Morning Update March 22nd 2018

0

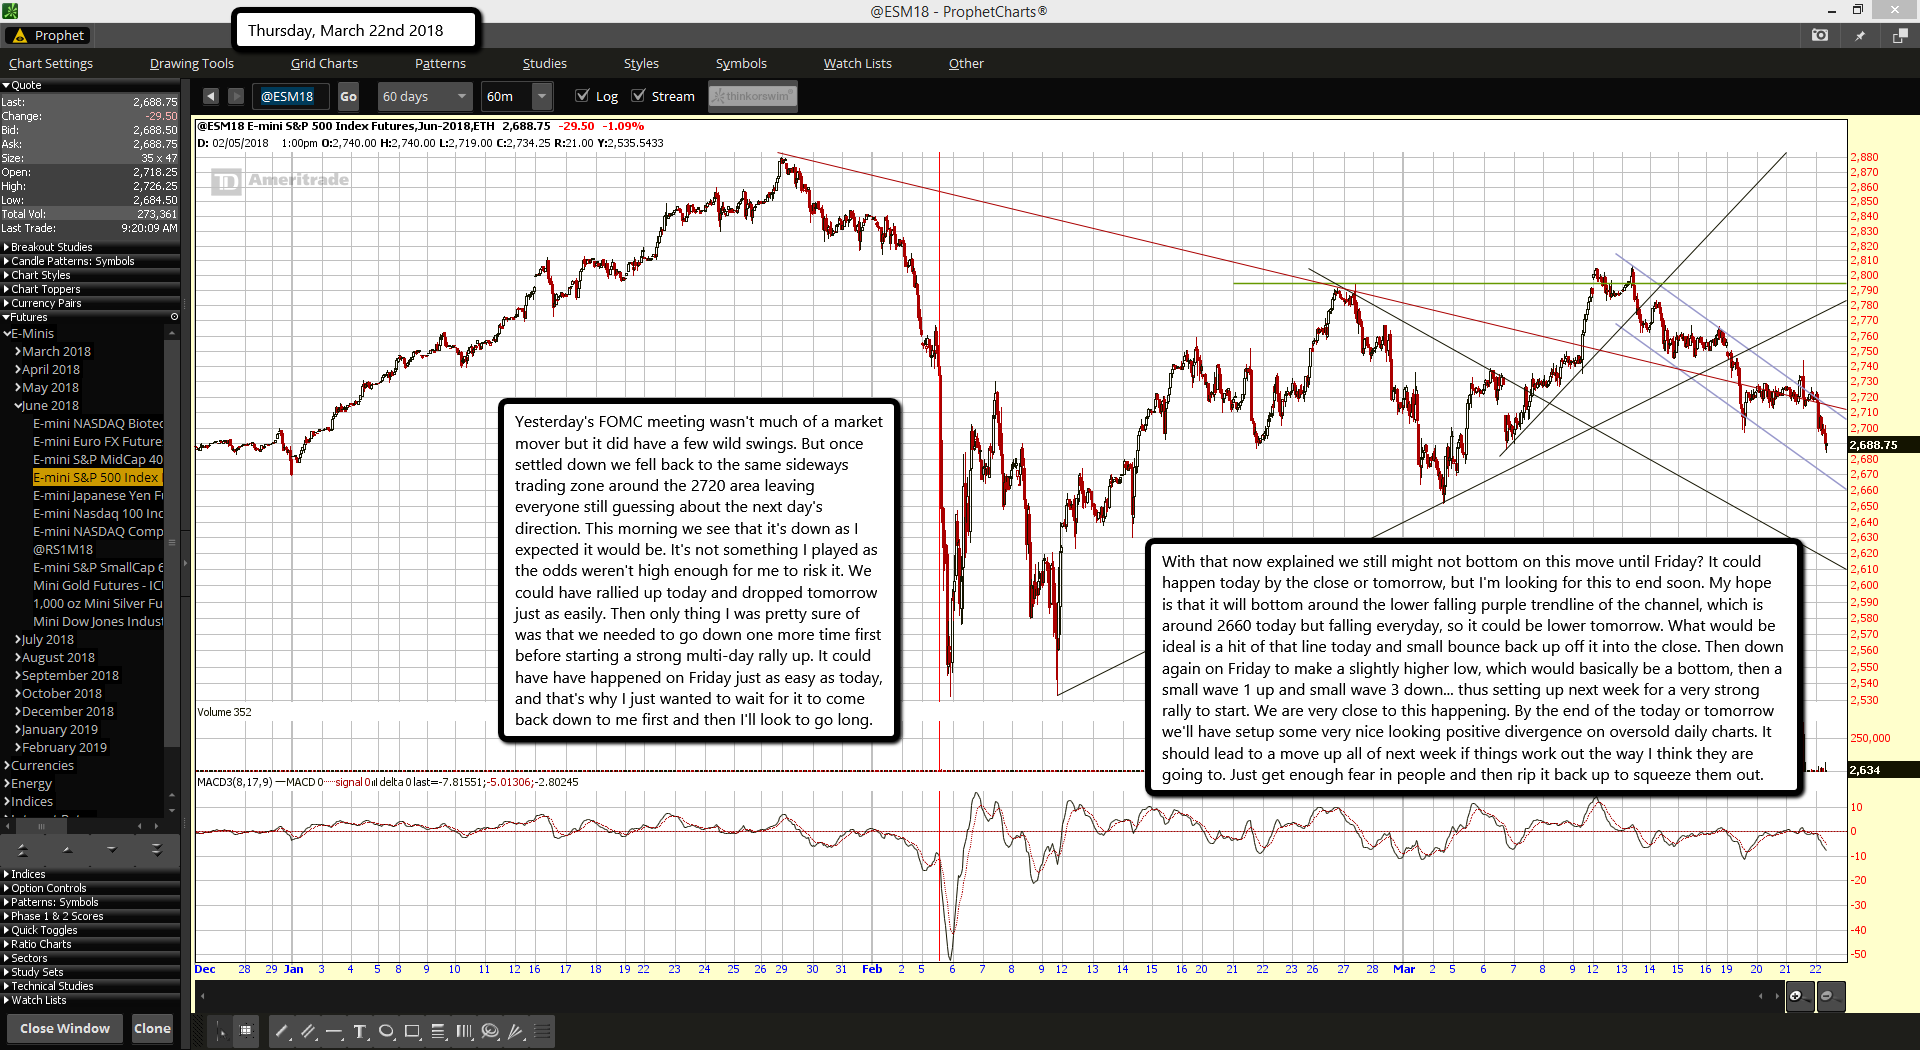
Yesterday's FOMC meeting wasn't much of a market mover but it did have a few wild swings. But once settled down we fell back to the same sideways trading zone around the 2720 area leaving everyone still guessing about the next day's direction. This morning we see that it's down as I expected it would be. It's not something I played as the odds weren't high enough for me to risk it. We could have rallied up today and dropped tomorrow just as easily. Then only thing I was pretty sure of was that we needed to go down one more time first before starting a strong multi-day rally up. It could have have happened on Friday just as easy as today, and that's why I just wanted to wait for it to come back down to me first and then I'll look to go long.

With that now explained we still might not bottom on this move until Friday? It could happen today by the close or tomorrow, but I'm looking for this to end soon. My hope is that it will bottom around the lower falling purple trendline of the channel, which is around 2660 today but falling everyday, so it could be lower tomorrow. What would be ideal is a hit of that line today and small bounce back up off it into the close. Then down again on Friday to make a slightly higher low, which would basically be a bottom, then a small wave 1 up and small wave 3 down... thus setting up next week for a very strong rally to start. We are very close to this happening. By the end of the today or tomorrow we'll have setup some very nice looking positive divergence on oversold daily charts. It should lead to a move up all of next week if things work out the way I think they are going to. Just get enough fear in people and then rip it back up to squeeze them out.

ES Morning Update March 21st 2018

0

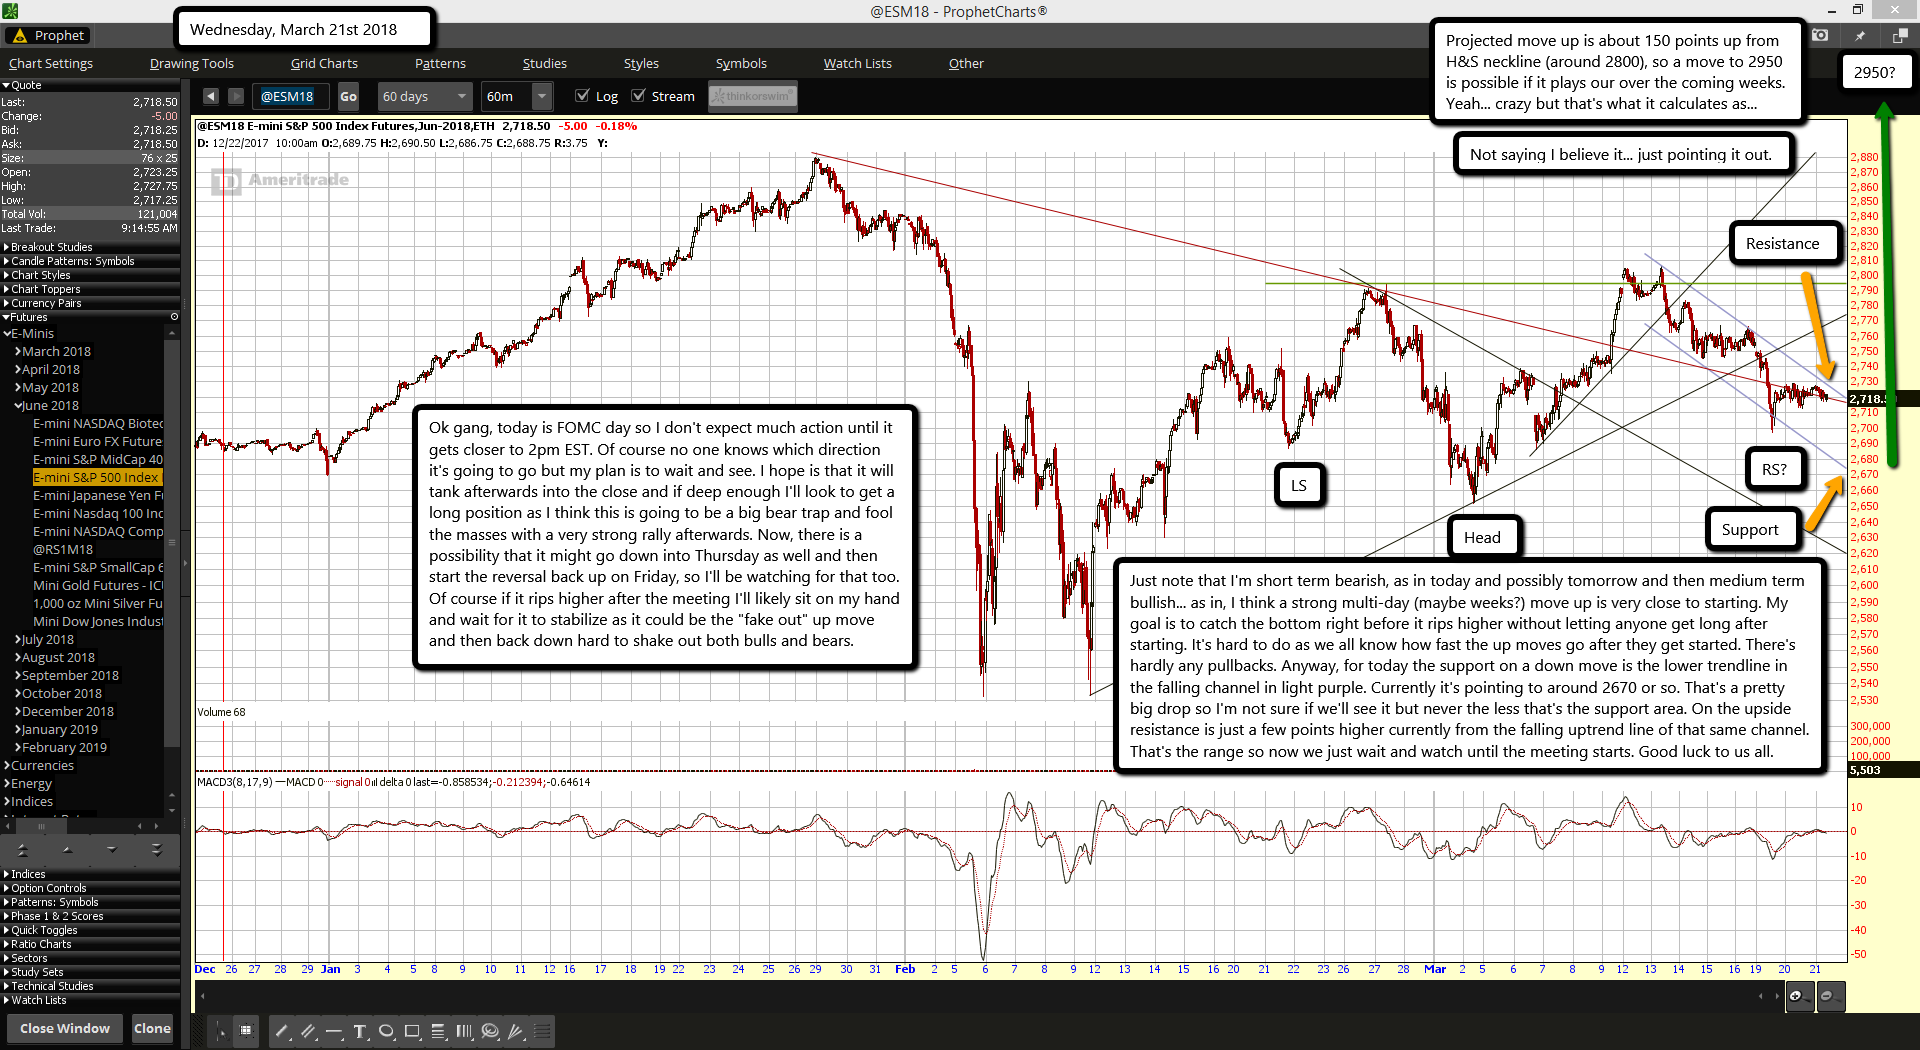
Ok gang, today is FOMC day so I don't expect much action until it gets closer to 2pm EST. Of course no one knows which direction it's going to go but my plan is to wait and see. I hope is that it will tank afterwards into the close and if deep enough I'll look to get a long position as I think this is going to be a big bear trap and fool the masses with a very strong rally afterwards. Now, there is a possibility that it might go down into Thursday as well and then start the reversal back up on Friday, so I'll be watching for that too. Of course if it rips higher after the meeting I'll likely sit on my hand and wait for it to stabilize as it could be the "fake out" up move and then back down hard to shake out both bulls and bears.

Just note that I'm short term bearish, as in today and possibly tomorrow and then medium term bullish... as in, I think a strong multi-day (maybe weeks?) move up is very close to starting. My goal is to catch the bottom right before it rips higher without letting anyone get long after starting. It's hard to do as we all know how fast the up moves go after they get started. There's hardly any pullbacks. Anyway, for today the support on a down move is the lower trendline in the falling channel in light purple. Currently it's pointing to around 2670 or so. That's a pretty big drop so I'm not sure if we'll see it but never the less that's the support area. On the upside resistance is just a few points higher currently from the falling uptrend line of that same channel. That's the range so now we just wait and watch until the meeting starts. Good luck to us all.

s2Member®