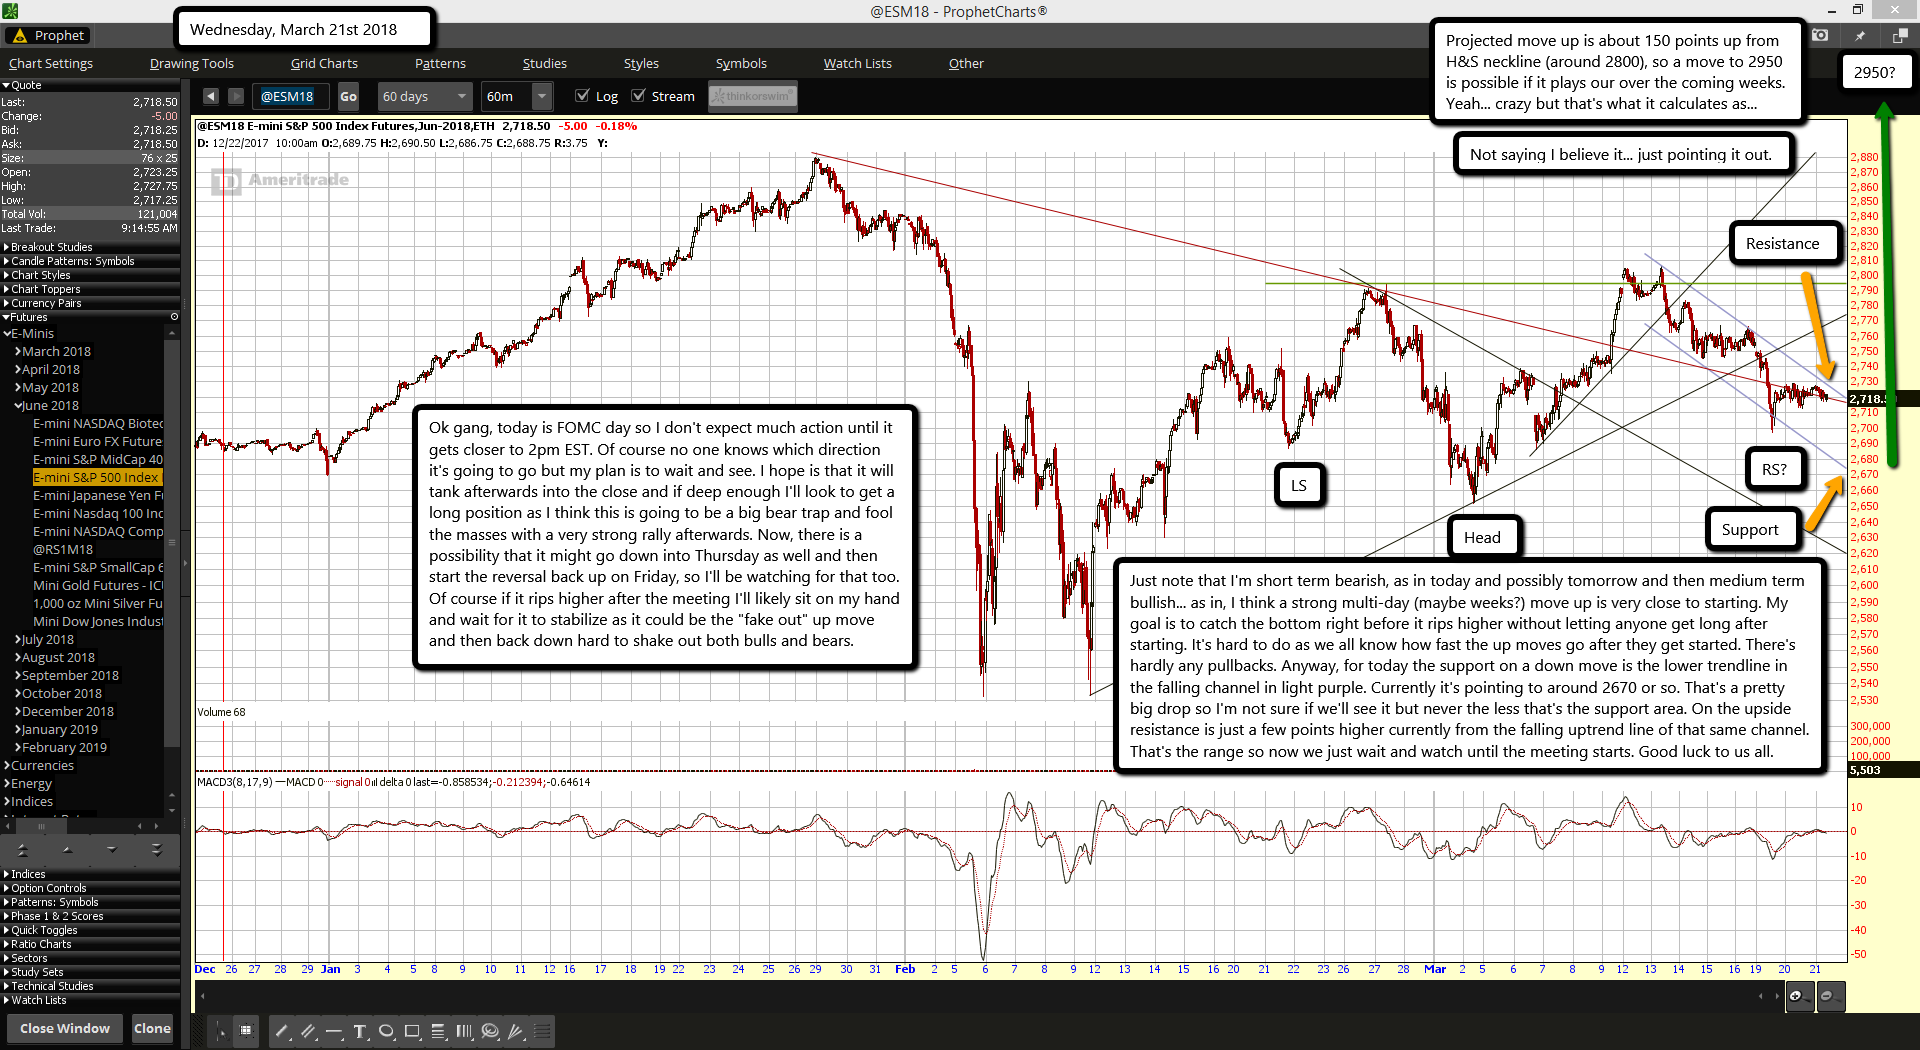
Ok gang, today is FOMC day so I don't expect much action until it gets closer to 2pm EST. Of course no one knows which direction it's going to go but my plan is to wait and see. I hope is that it will tank afterwards into the close and if deep enough I'll look to get a long position as I think this is going to be a big bear trap and fool the masses with a very strong rally afterwards. Now, there is a possibility that it might go down into Thursday as well and then start the reversal back up on Friday, so I'll be watching for that too. Of course if it rips higher after the meeting I'll likely sit on my hand and wait for it to stabilize as it could be the "fake out" up move and then back down hard to shake out both bulls and bears.
Just note that I'm short term bearish, as in today and possibly tomorrow and then medium term bullish... as in, I think a strong multi-day (maybe weeks?) move up is very close to starting. My goal is to catch the bottom right before it rips higher without letting anyone get long after starting. It's hard to do as we all know how fast the up moves go after they get started. There's hardly any pullbacks. Anyway, for today the support on a down move is the lower trendline in the falling channel in light purple. Currently it's pointing to around 2670 or so. That's a pretty big drop so I'm not sure if we'll see it but never the less that's the support area. On the upside resistance is just a few points higher currently from the falling uptrend line of that same channel. That's the range so now we just wait and watch until the meeting starts. Good luck to us all.
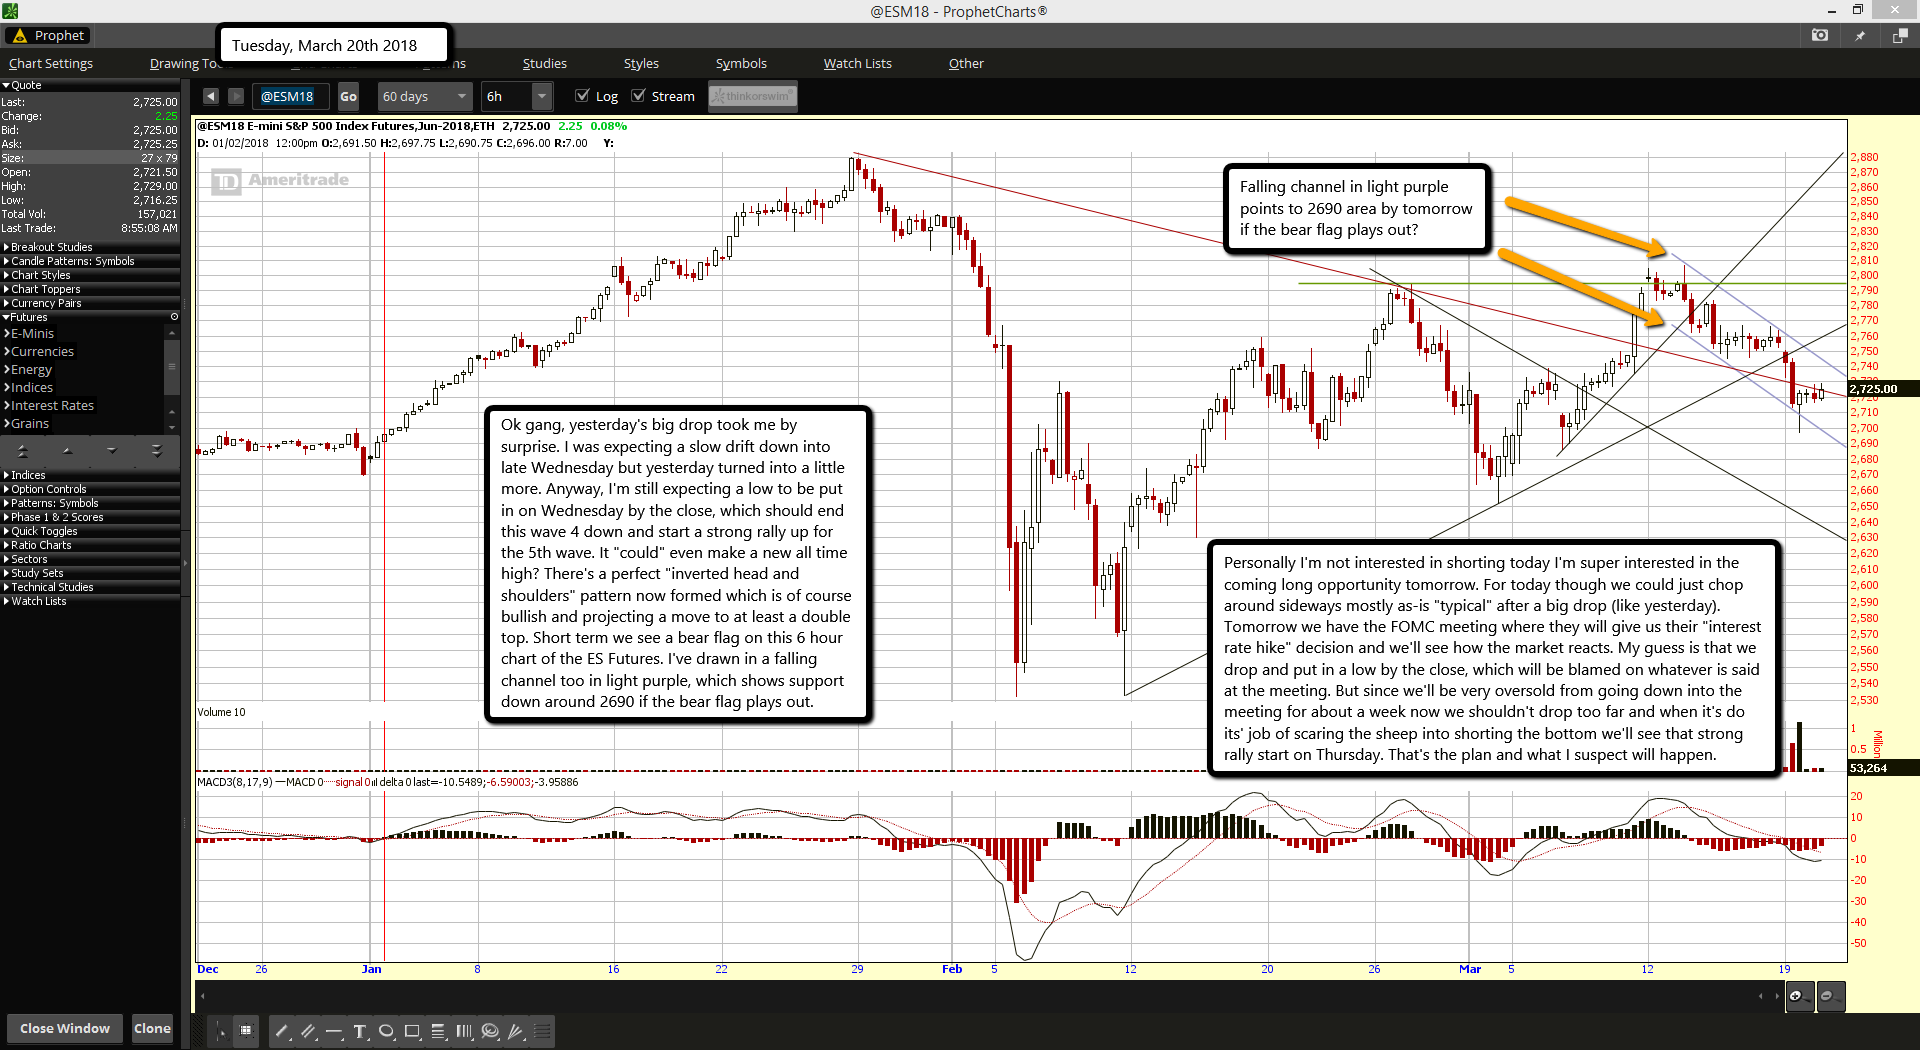
Ok gang, yesterday's big drop took me by surprise. I was expecting a slow drift down into late Wednesday but yesterday turned into a little more. Anyway, I'm still expecting a low to be put in on Wednesday by the close, which should end this wave 4 down and start a strong rally up for the 5th wave. It "could" even make a new all time high? There's a perfect "inverted head and shoulders" pattern now formed which is of course bullish and projecting a move to at least a double top. Short term we see a bear flag on this 6 hour chart of the ES Futures. I've drawn in a falling channel too in light purple, which shows support down around 2690 if the bear flag plays out.
Personally I'm not interested in shorting today I'm super interested in the coming long opportunity tomorrow. For today though we could just chop around sideways mostly as-is "typical" after a big drop (like yesterday). Tomorrow we have the FOMC meeting where they will give us their "interest rate hike" decision and we'll see how the market reacts. My guess is that we drop and put in a low by the close, which will be blamed on whatever is said at the meeting. But since we'll be very oversold from going down into the meeting for about a week now we shouldn't drop too far and when it's do its' job of scaring the sheep into shorting the bottom we'll see that strong rally start on Thursday. That's the plan and what I suspect will happen.
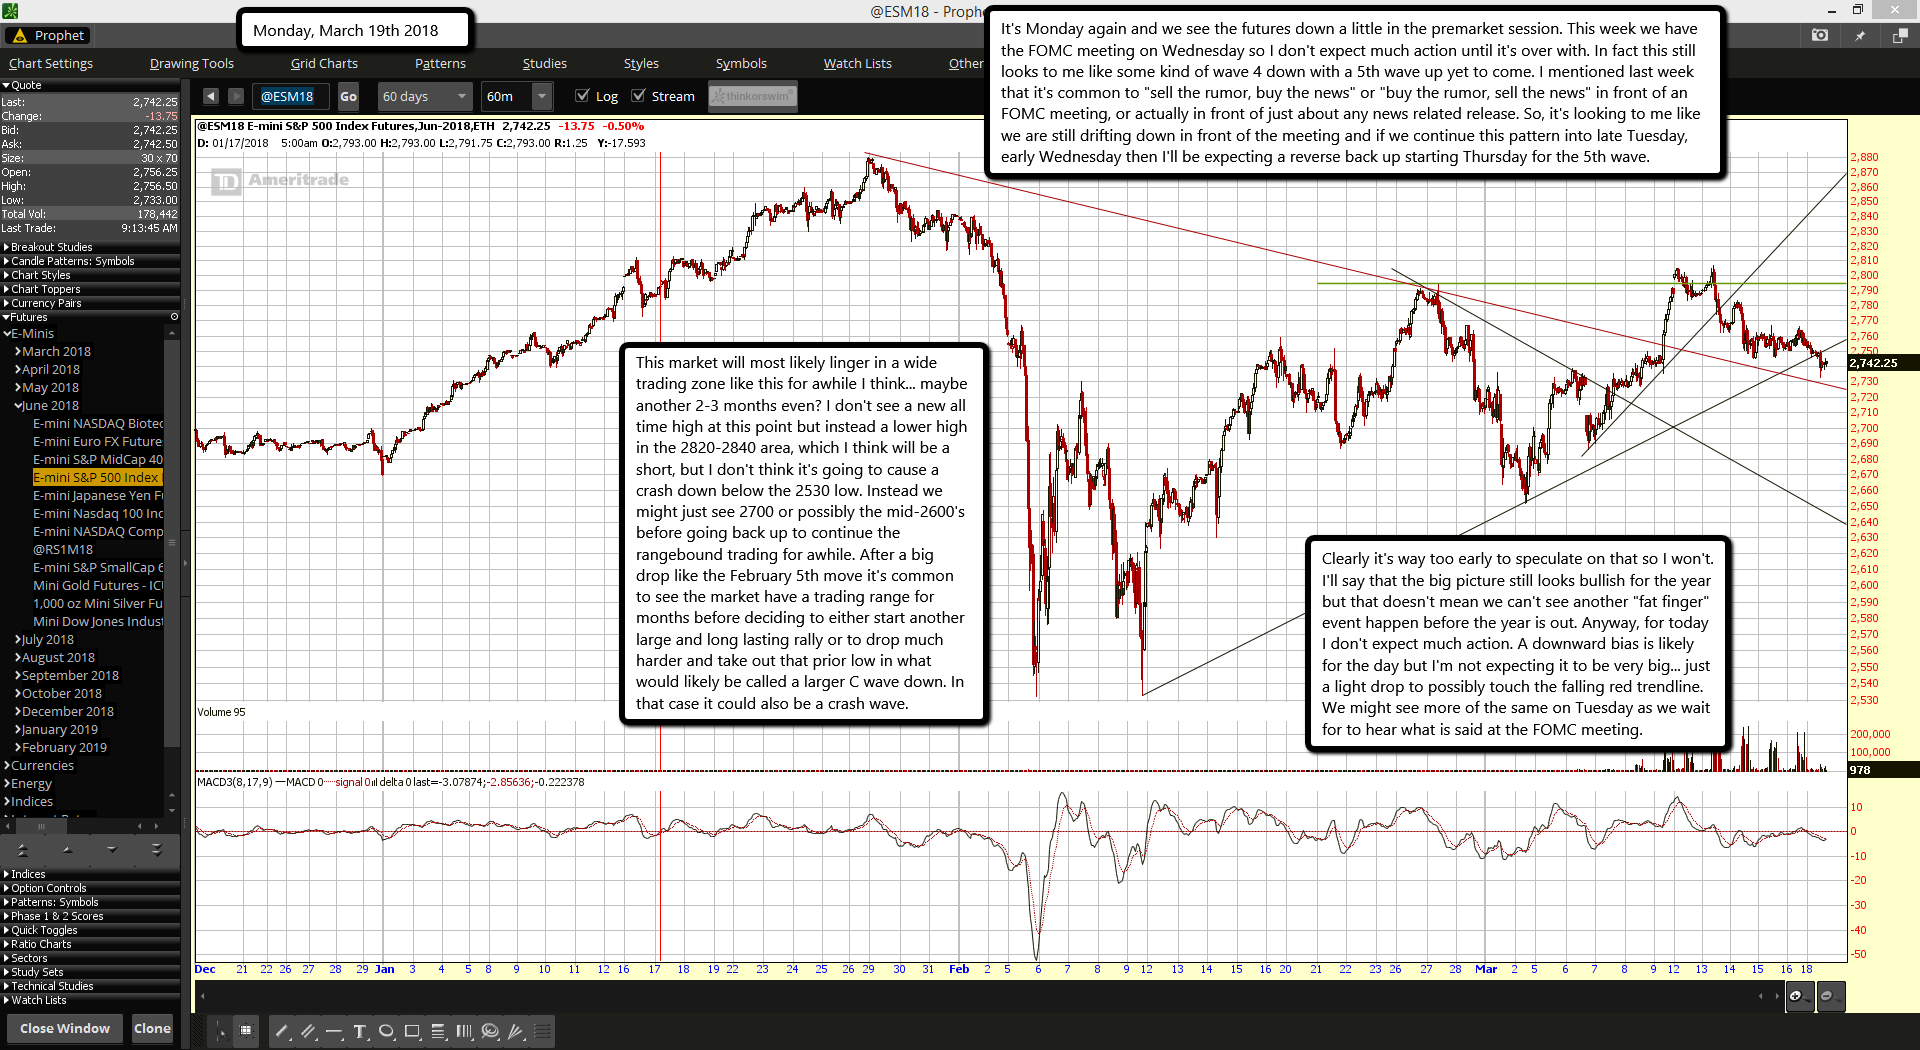
It's Monday again and we see the futures down a little in the premarket session. This week we have the FOMC meeting on Wednesday so I don't expect much action until it's over with. In fact this still looks to me like some kind of wave 4 down with a 5th wave up yet to come. I mentioned last week that it's common to "sell the rumor, buy the news" or "buy the rumor, sell the news" in front of an FOMC meeting, or actually in front of just about any news related release. So, it's looking to me like we are still drifting down in front of the meeting and if we continue this pattern into late Tuesday, early Wednesday then I'll be expecting a reverse back up starting Thursday for the 5th wave.
This market will most likely linger in a wide trading zone like this for awhile I think... maybe another 2-3 months even? I don't see a new all time high at this point but instead a lower high in the 2820-2840 area, which I think will be a short, but I don't think it's going to cause a crash down below the 2530 low. Instead we might just see 2700 or possibly the mid-2600's before going back up to continue the rangebound trading for awhile. After a big drop like the February 5th move it's common to see the market have a trading range for months before deciding to either start another large and long lasting rally or to drop much harder and take out that prior low in what would likely be called a larger C wave down. In that case it could also be a crash wave.
Clearly it's way too early to speculate on that so I won't. I'll say that the big picture still looks bullish for the year but that doesn't mean we can't see another "fat finger" event happen before the year is out. Anyway, for today I don't expect much action. A downward bias is likely for the day but I'm not expecting it to be very big... just a light drop to possibly touch the falling red trendline. We might see more of the same on Tuesday as we wait for to hear what is said at the FOMC meeting.
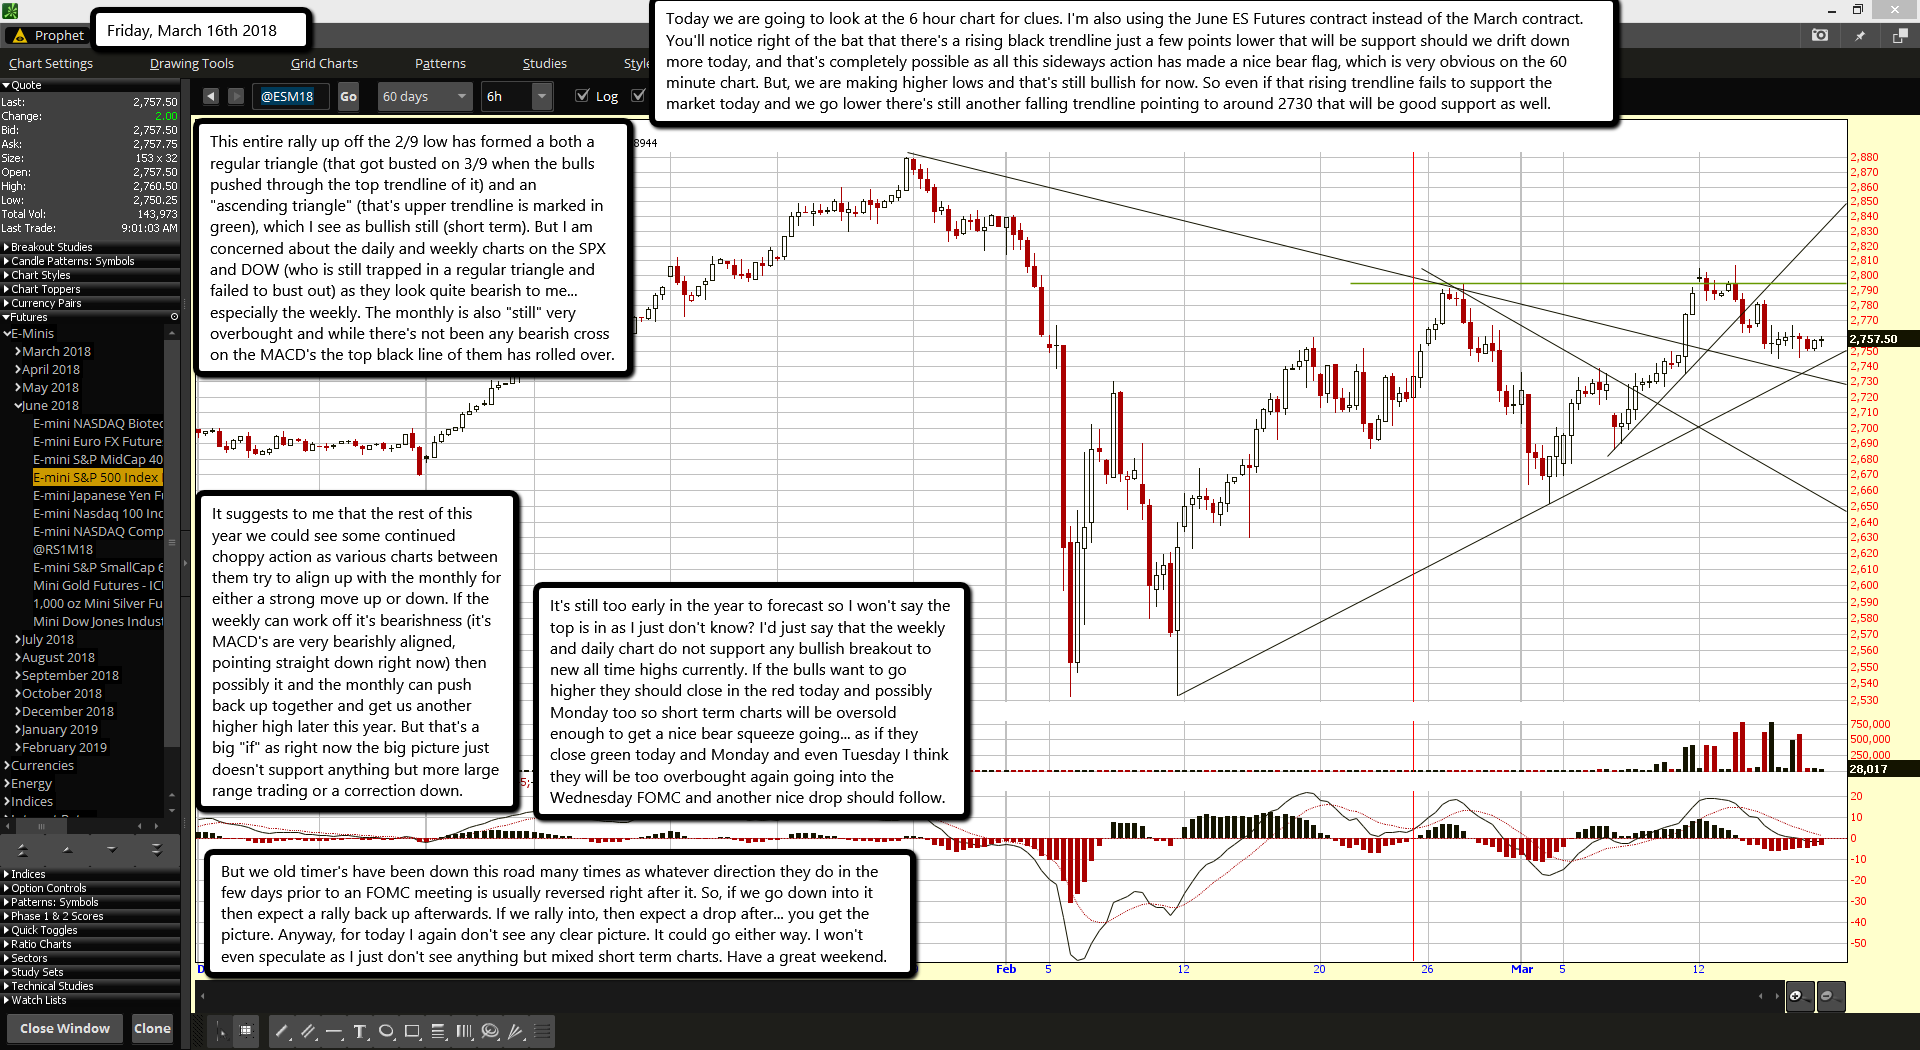
Today we are going to look at the 6 hour chart for clues. I'm also using the June ES Futures contract instead of the March contract. You'll notice right of the bat that there's a rising black trendline just a few points lower that will be support should we drift down more today, and that's completely possible as all this sideways action has made a nice bear flag, which is very obvious on the 60 minute chart. But, we are making higher lows and that's still bullish for now. So even if that rising trendline fails to support the market today and we go lower there's still another falling trendline pointing to around 2730 that will be good support as well.
This entire rally up off the 2/9 low has formed a both a regular triangle (that got busted on 3/9 when the bulls pushed through the top trendline of it) and an "ascending triangle" (that's upper trendline is marked in green), which I see as bullish still (short term). But I am concerned about the daily and weekly charts on the SPX and DOW (who is still trapped in a regular triangle and failed to bust out) as they look quite bearish to me... especially the weekly. The monthly is also "still" very overbought and while there's not been any bearish cross on the MACD's the top black line of them has rolled over.
It suggests to me that the rest of this year we could see some continued choppy action as various charts between them try to align up with the monthly for either a strong move up or down. If the weekly can work off it's bearishness (it's MACD's are very bearishly aligned, pointing straight down right now) then possibly it and the monthly can push back up together and get us another higher high later this year. But that's a big "if" as right now the big picture just doesn't support anything but more large range trading or a correction down.
It's still too early in the year to forecast so I won't say the top is in as I just don't know? I'd just say that the weekly and daily chart do not support any bullish breakout to new all time highs currently. If the bulls want to go higher they should close in the red today and possibly Monday too so short term charts will be oversold enough to get a nice bear squeeze going... as if they close green today and Monday and even Tuesday I think they will be too overbought again going into the Wednesday FOMC and another nice drop should follow.
But we old timer's have been down this road many times as whatever direction they do in the few days prior to an FOMC meeting is usually reversed right after it. So, if we go down into it then expect a rally back up afterwards. If we rally into, then expect a drop after... you get the picture. Anyway, for today I again don't see any clear picture. It could go either way. I won't even speculate as I just don't see anything but mixed short term charts. Have a great weekend.
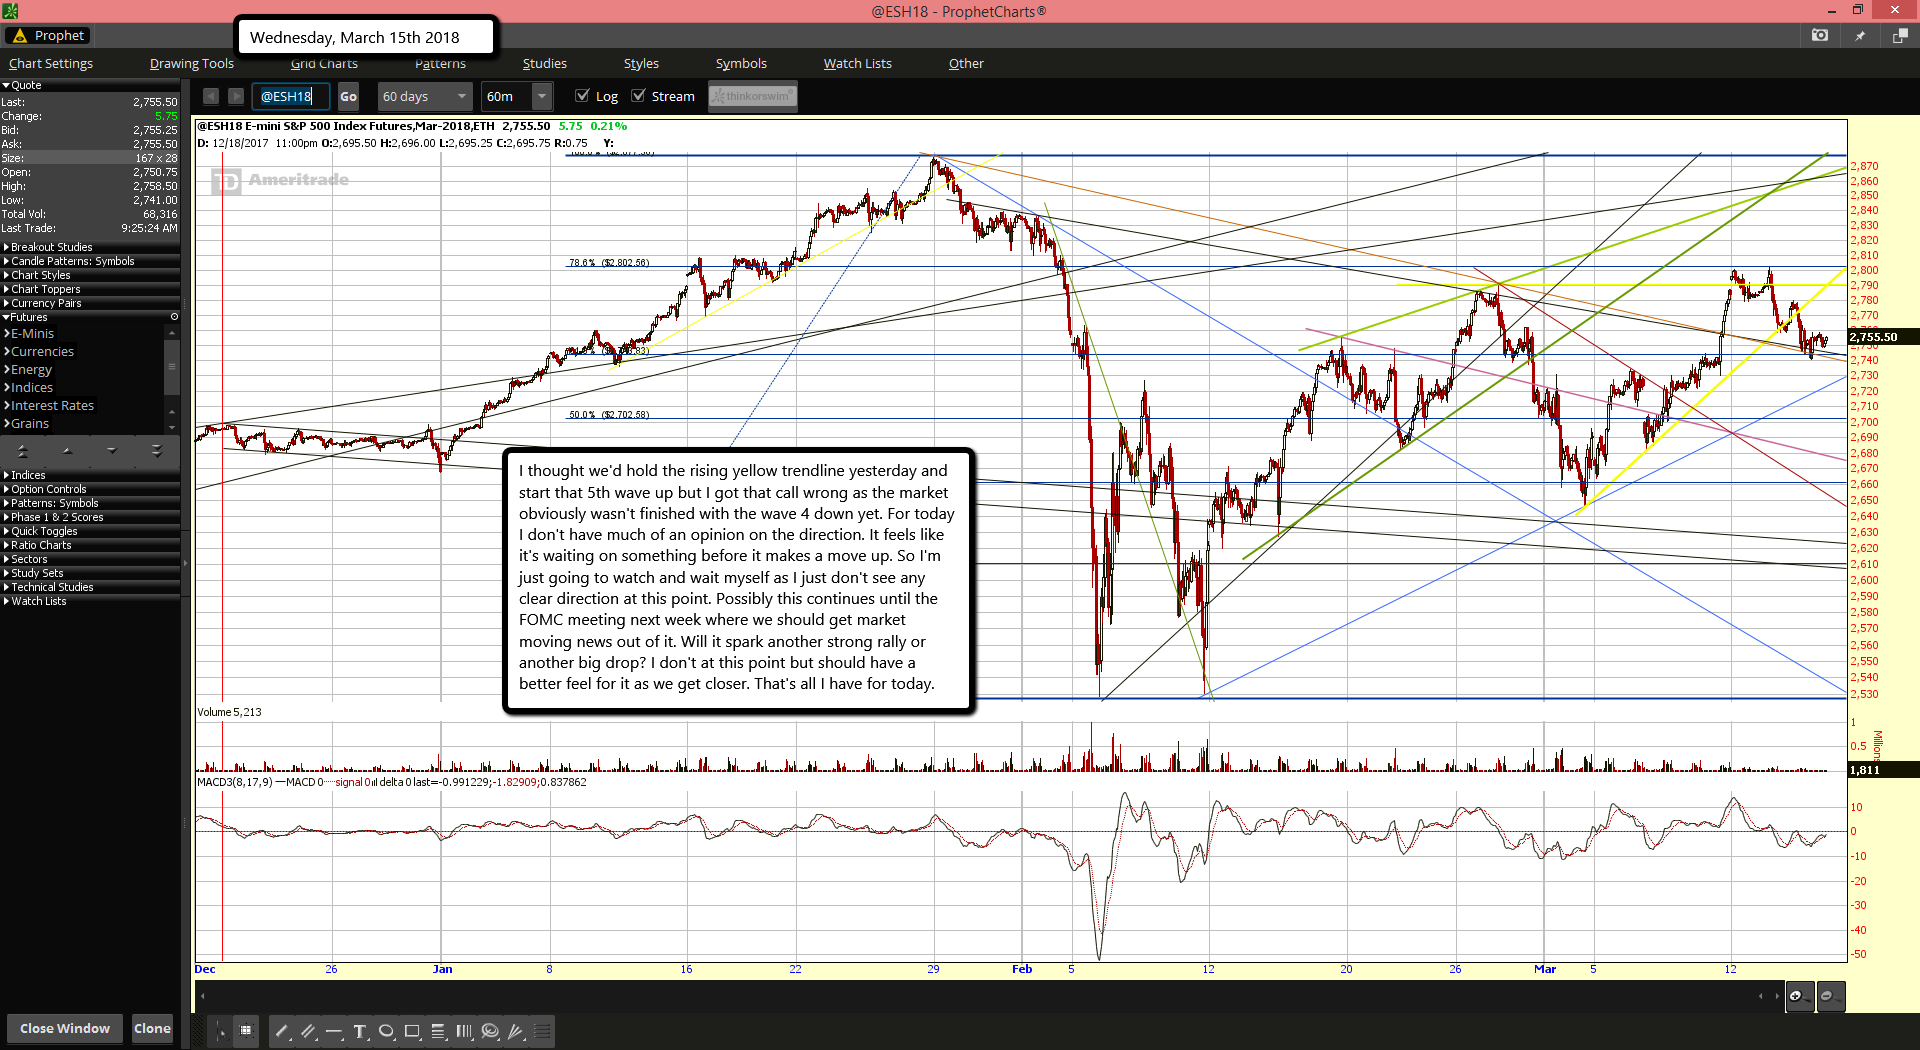
I thought we'd hold the rising yellow trendline yesterday and start that 5th wave up but I got that call wrong as the market obviously wasn't finished with the wave 4 down yet. For today I don't have much of an opinion on the direction. It feels like it's waiting on something before it makes a move up. So I'm just going to watch and wait myself as I just don't see any clear direction at this point. Possibly this continues until the FOMC meeting next week where we should get market moving news out of it. Will it spark another strong rally or another big drop? I don't at this point but should have a better feel for it as we get closer. That's all I have for today.
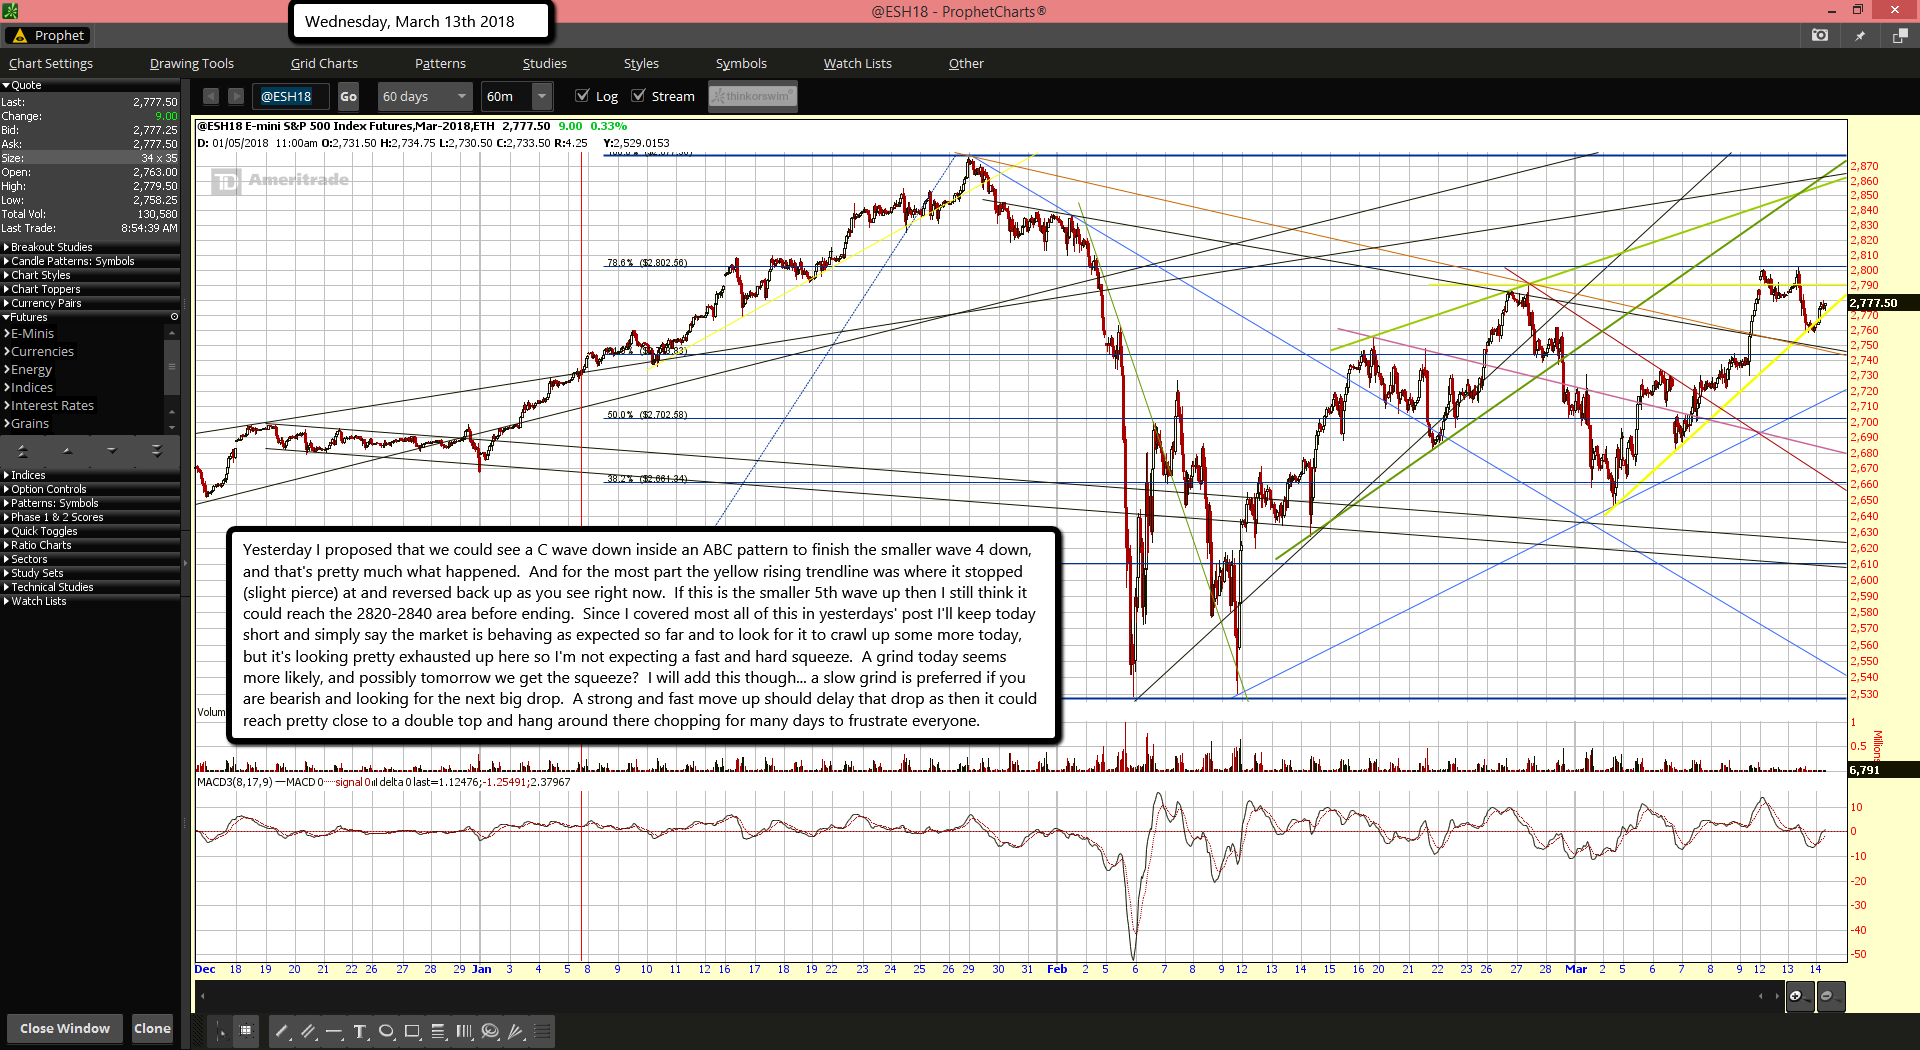
Yesterday I proposed that we could see a C wave down inside an ABC pattern to finish the smaller wave 4 down, and that's pretty much what happened. And for the most part the yellow rising trendline was where it stopped (slight pierce) at and reversed back up as you see right now. If this is the smaller 5th wave up then I still think it could reach the 2820-2840 area before ending. Since I covered most all of this in yesterdays' post I'll keep today short and simply say the market is behaving as expected so far and to look for it to crawl up some more today, but it's looking pretty exhausted up here so I'm not expecting a fast and hard squeeze. A grind today seems more likely, and possibly tomorrow we get the squeeze? I will add this though... a slow grind is preferred if you are bearish and looking for the next big drop. A strong and fast move up should delay that drop as then it could reach pretty close to a double top and hang around there chopping for many days to frustrate everyone.
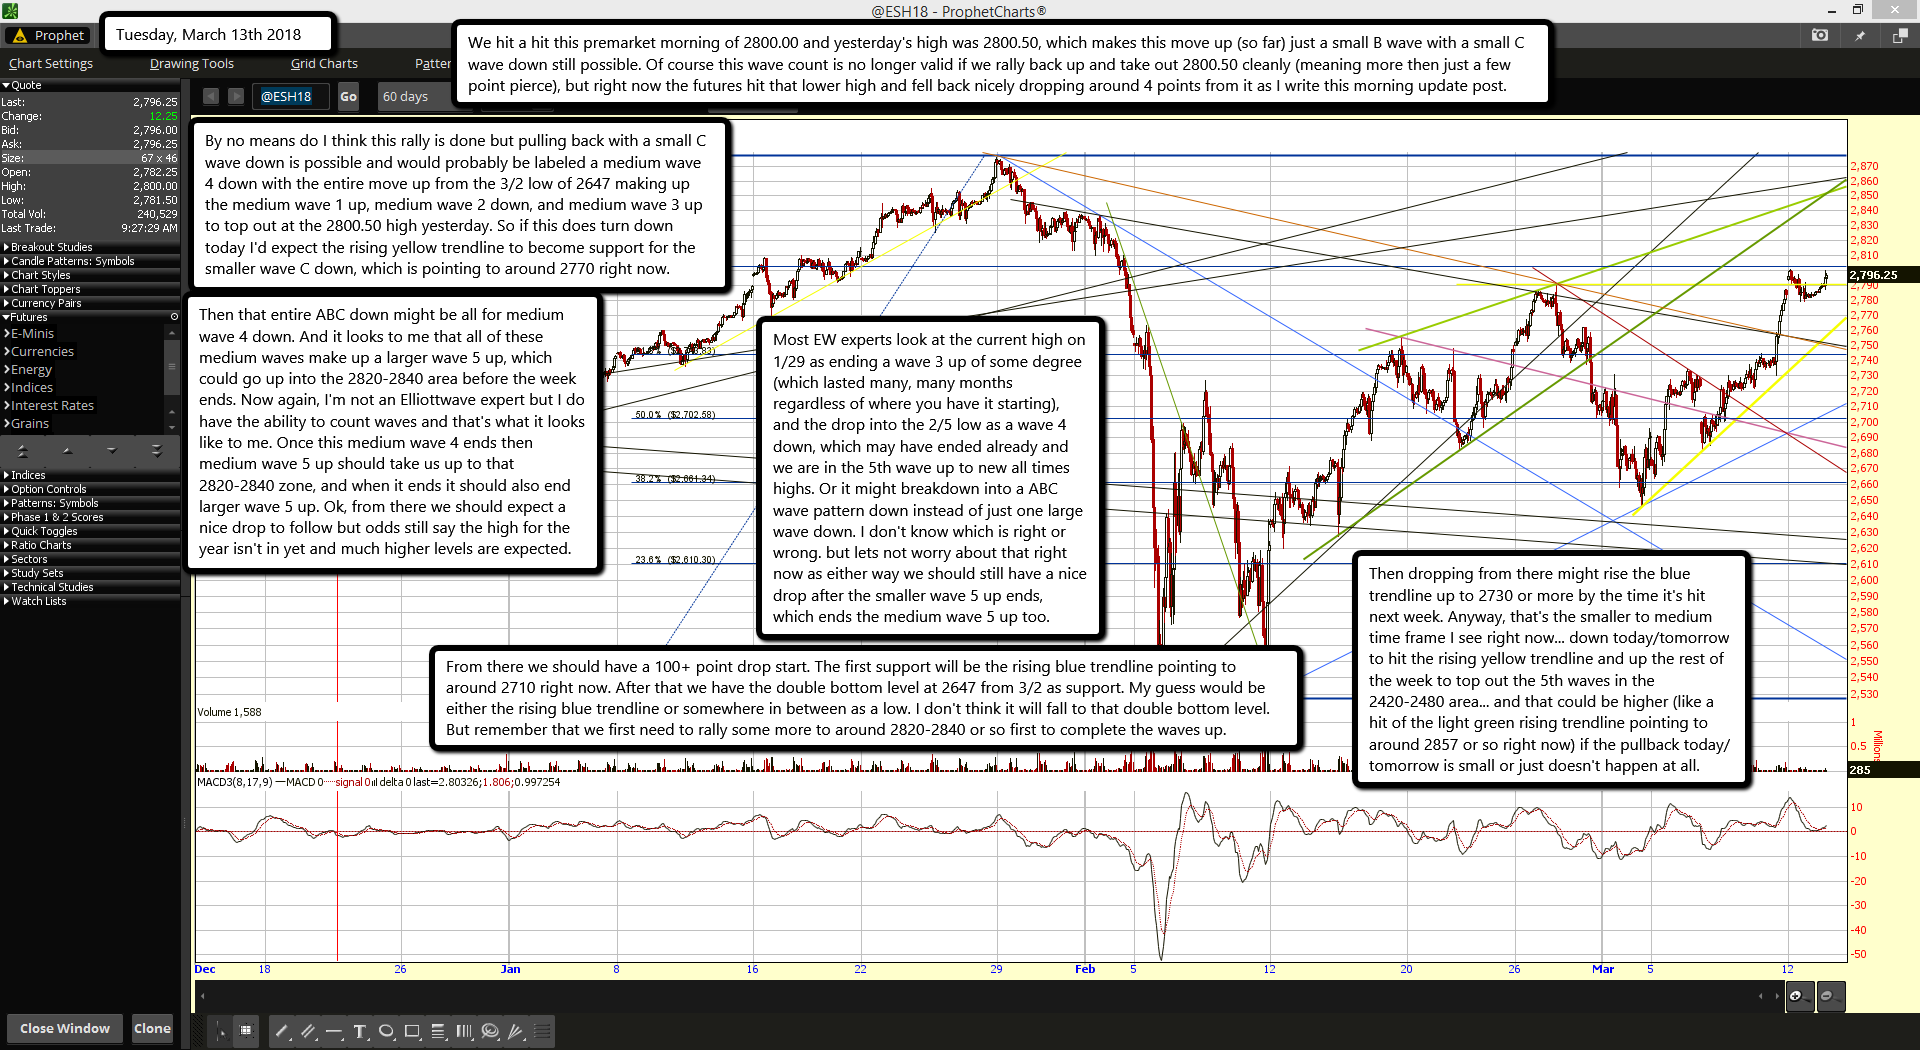
We hit a hit this premarket morning of 2800.00 and yesterday's high was 2800.50, which makes this move up (so far) just a small B wave with a small C wave down still possible. Of course this wave count is no longer valid if we rally back up and take out 2800.50 cleanly (meaning more then just a few point pierce), but right now the futures hit that lower high and fell back nicely dropping around 4 points from it as I write this morning update post.
By no means do I think this rally is done but pulling back with a small C wave down is possible and would probably be labeled a medium wave 4 down with the entire move up from the 3/2 low of 2647 making up the medium wave 1 up, medium wave 2 down, and medium wave 3 up to top out at the 2800.50 high yesterday. So if this does turn down today I'd expect the rising yellow trendline to become support for the smaller wave C down, which is pointing to around 2770 right now.
Then that entire ABC down might be all for medium wave 4 down. And it looks to me that all of these medium waves make up a larger wave 5 up, which could go up into the 2820-2840 area before the week ends. Now again, I'm not an Elliottwave expert but I do have the ability to count waves and that's what it looks like to me. Once this medium wave 4 ends then medium wave 5 up should take us up to that 2820-2840 zone, and when it ends it should also end larger wave 5 up. Ok, from there we should expect a nice drop to follow but odds still say the high for the year isn't in yet and much higher levels are expected.
Most EW experts look at the current high on 1/29 as ending a wave 3 up of some degree (which lasted many, many months regardless of where you have it starting), and the drop into the 2/5 low as a wave 4 down, which may have ended already and we are in the 5th wave up to new all times highs. Or it might breakdown into a ABC wave pattern down instead of just one large wave down. I don't know which is right or wrong. but lets not worry about that right now as either way we should still have a nice drop after the smaller wave 5 up ends, which ends the medium wave 5 up too.
From there we should have a 100+ point drop start. The first support will be the rising blue trendline pointing to around 2710 right now. After that we have the double bottom level at 2647 from 3/2 as support. My guess would be either the rising blue trendline or somewhere in between as a low. I don't think it will fall to that double bottom level. But remember that we first need to rally some more to around 2820-2840 or so first to complete the waves up.
Then dropping from there might rise the blue trendline up to 2730 or more by the time it's hit next week. Anyway, that's the smaller to medium time frame I see right now... down today/tomorrow to hit the rising yellow trendline and up the rest of the week to top out the 5th waves in the 2420-2480 area... and that could be higher (like a hit of the light green rising trendline pointing to around 2857 or so right now) if the pullback today/tomorrow is small or just doesn't happen at all.
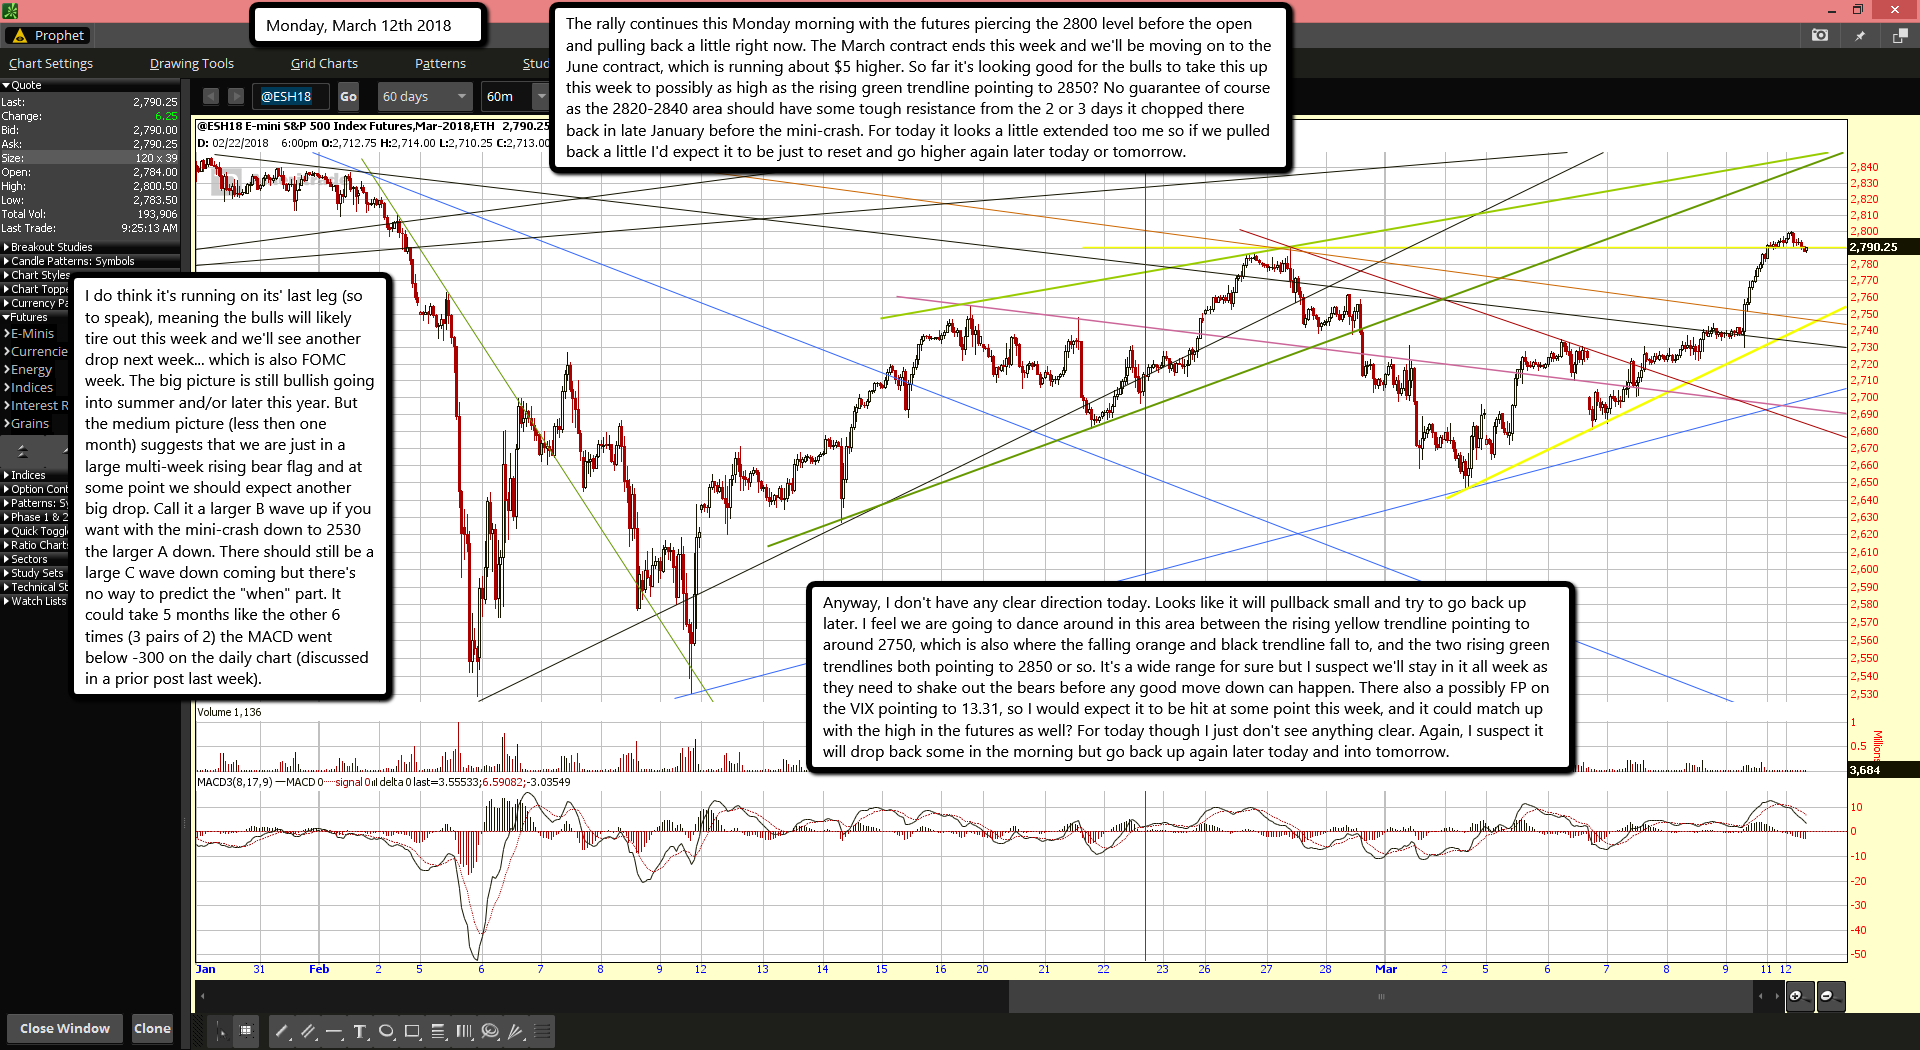
The rally continues this Monday morning with the futures piercing the 2800 level before the open and pulling back a little right now. The March contract ends this week and we'll be moving on to the June contract, which is running about $5 higher. So far it's looking good for the bulls to take this up this week to possibly as high as the rising green trendline pointing to 2850? No guarantee of course as the 2820-2840 area should have some tough resistance from the 2 or 3 days it chopped there back in late January before the mini-crash. For today it looks a little extended too me so if we pulled back a little I'd expect it to be just to reset and go higher again later today or tomorrow.
I do think it's running on its' last leg (so to speak), meaning the bulls will likely tire out this week and we'll see another drop next week... which is also FOMC week. The big picture is still bullish going into summer and/or later this year. But the medium picture (less then one month) suggests that we are just in a large multi-week rising bear flag and at some point we should expect another big drop. Call it a larger B wave up if you want with the mini-crash down to 2530 the larger A down. There should still be a large C wave down coming but there's no way to predict the "when" part. It could take 5 months like the other 6 times (3 pairs of 2) the MACD went below -300 on the daily chart (discussed in a prior post last week).
Anyway, I don't have any clear direction today. Looks like it will pullback small and try to go back up later. I feel we are going to dance around in this area between the rising yellow trendline pointing to around 2750, which is also where the falling orange and black trendline fall to, and the two rising green trendlines both pointing to 2850 or so. It's a wide range for sure but I suspect we'll stay in it all week as they need to shake out the bears before any good move down can happen. There also a possibly FP on the VIX pointing to 13.31, so I would expect it to be hit at some point this week, and it could match up with the high in the futures as well? For today though I just don't see anything clear. Again, I suspect it will drop back some in the morning but go back up again later today and into tomorrow.
President Donald Trump has promised for more than a year to give banks relief from the Dodd-Frank Act. The moment has arrived.
The Senate voted Tuesday to formally kick off the process of considering a bill that would mark the biggest congressional overhaul of the post-crisis banking law. In the coming days, the Senate is expected to debate and then pass the measure. It will then go to the House, where lawmakers would also have to approve it for it to reach Trump's desk.
The legislation is a compromise, with some Democrats voting to advance it Tuesday. The bill doesn't go nearly as far as many Republicans and some in the finance industry would like, leaving big Wall Street firms in particular close to empty handed. It mostly provides regulatory relief for small and regional banks, including raising the threshold for which lenders are considered 'too big to fail.'
Senate Banking Committee Chairman Mike Crapo, an Idaho Republican, sponsored the legislation and has been working behind the scenes with lawmakers in the House and Senate in recent days to hash out an amendment with some last-minute changes.
Democrats are divided on the bill, with progressives such as Massachusetts Senator Elizabeth Warren arguing it will put consumers at risk.
This tells me we are going to have another blow-off rally
And it also tells me that it should last about one quarter (3 months) and then we could top out like the 50% up rally from 1986 to 1987... and you know what happened after that! Yes, we have a serious chance of another crash coming later this year and into 2019.
Why you ask?
Because of similar events and similar patterns in the stock market. Back in 1986 Ronald Reagan passed his tax bill which fueled the stock up another 50% before topping out and then crashing. Here in late 2017 Donald Trump passed another tax bill and we've been rallying hard now for over a year, starting after he got elected.
We are not up 50% yet but since we were around 20,000 on the DOW when Trump was elected and the rally started we'd only have to reach 30,000 to match the 50% rally with Reagan... not impossible by any means.
Of course there's no rule that says we have to do exactly the same but odds are strong that another strong rally will happen soon and take us into the summer with bulls dancing in the streets.
Beside the tax bill this Dodd-Frank overhaul should add gasoline to the fire as it free's up banks to "take more risks" in my view. So I'd expect them to go aggressive in the stock market after it's passed. I don't think it's a good idea but maybe it's the hidden plan anyway (to peak the market and then crash it)?
If Trump is playing his cards right this could let him keep control of both the senate and congress with the coming elections in November, but then again a crash would have to be blamed on the Democrats and I'm not sure how that could be played off? Of course there's also the thought that Trump doesn't know what affect this will have on the stock market and has no idea that it could cause another crash? Only time will tell...
Another day of nothing. So far this morning the bulls nor the bears have any interest in this market. We are still stuck in the larger triangle pointing to around 2755 now with the black falling trendline and the red falling trendline on the upside and 2695 or so from the blue rising trendline. But the yellow rising trendline seems to be support for now, and I suspect we'll ride it all day today and push out any big move up or down until early next week. I'm sure everyone now see's the obvious head and shoulders pattern but I'm still not in favor of just shorting blindly assuming it's going to work. It's got a very bad track record over the last 10 years or so as SkyNet has taken over the market, which is now around 84% computer algo trading.
The internet has leveled the playing field for the retail trader versus the professionals and that means that both parties can now see the same patterns, which in turn means that you'll have them both on the same side of the trade... and that forces the market to go the opposite direction as it's not designed to let the masses win. Of course I don't have access to see where everyone is positioned so I don't know if there's more people bearish or bullish at this juncture in the market. Maybe the opposite is true and everyone see's this move up as a 5th wave that should go to new highs? Personally I can't imagine that many traders missing the obvious H&S pattern but anything is possible I guess.
Like I said I think the pattern works about half the time and fails the other half, so we should just ignore it and focus on other clues to forecast the next move. Unfortunately there doesn't seem to be anything clear in the technical analysis side as charts are mixed on different time frames of both the SPX and the ES Futures. Longer term, like week's and month's, we are still very overbought. But shorter term we are mostly neutral with the opportunity to go up strongly or down strongly. Anyway, I'll end it here and wish you all a great weekend. We'll see what Monday gives us as I think today will be just like yesterday... another Ground Hog Day.
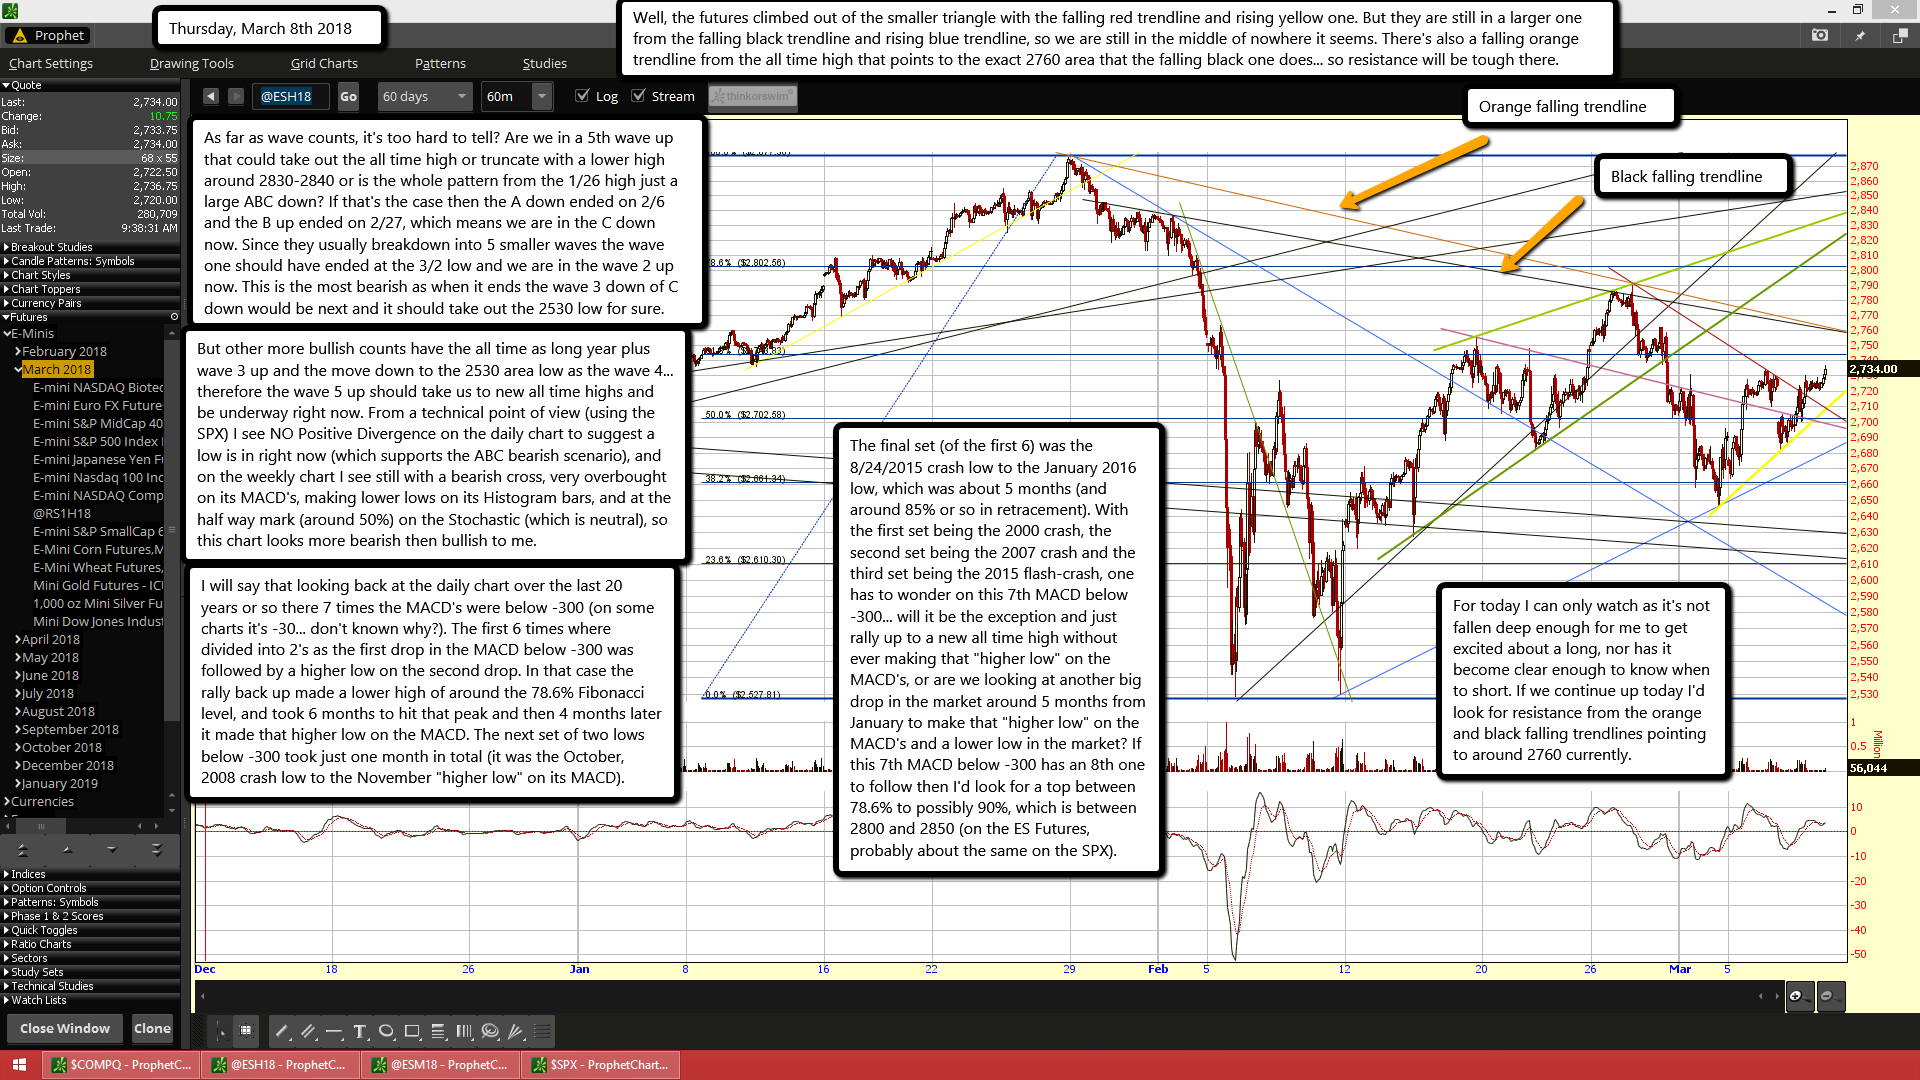
Well, the futures climbed out of the smaller triangle with the falling red trendline and rising yellow one. But they are still in a larger one from the falling black trendline and rising blue trendline, so we are still in the middle of nowhere it seems. There's also a falling orange trendline from the all time high that points to the exact 2760 area that the falling black one does... so resistance will be tough there.
As far as wave counts, it's too hard to tell? Are we in a 5th wave up that could take out the all time high or truncate with a lower high around 2830-2840 or is the whole pattern from the 1/26 high just a large ABC down? If that's the case then the A down ended on 2/6 and the B up ended on 2/27, which means we are in the C down now. Since they usually breakdown into 5 smaller waves the wave one should have ended at the 3/2 low and we are in the wave 2 up now. This is the most bearish as when it ends the wave 3 down of C down would be next and it should take out the 2530 low for sure.
But other more bullish counts have the all time as long year plus wave 3 up and the move down to the 2530 area low as the wave 4... therefore the wave 5 up should take us to new all time highs and be underway right now. From a technical point of view (using the SPX) I see NO Positive Divergence on the daily chart to suggest a low is in right now (which supports the ABC bearish scenario), and on the weekly chart I see still with a bearish cross, very overbought on its MACD's, making lower lows on its Histogram bars, and at the half way mark (around 50%) on the Stochastic (which is neutral), so this chart looks more bearish then bullish to me.
I will say that looking back at the daily chart over the last 20 years or so there 7 times the MACD's were below -300 (on some charts it's -30... don't known why?). The first 6 times where divided into 2's as the first drop in the MACD below -300 was followed by a higher low on the second drop. In that case the rally back up made a lower high of around the 78.6% Fibonacci level, and took 6 months to hit that peak and then 4 months later it made that higher low on the MACD. The next set of two lows below -300 took just one month in total (it was the October, 2008 crash low to the November "higher low" on its MACD).
The final set (of the first 6) was the 8/24/2015 crash low to the January 2016 low, which was about 5 months (and around 85% or so in retracement). With the first set being the 2000 crash, the second set being the 2007 crash and the third set being the 2015 flash-crash, one has to wonder on this 7th MACD below -300... will it be the exception and just rally up to a new all time high without ever making that "higher low" on the MACD's, or are we looking at another big drop in the market around 5 months from January to make that "higher low" on the MACD's and a lower low in the market? If this 7th MACD below -300 has an 8th one to follow then I'd look for a top between 78.6% to possibly 90%, which is between 2800 and 2850 (on the ES Futures, probably about the same on the SPX).
For today I can only watch as it's not fallen deep enough for me to get excited about a long, nor has it become clear enough to know when to short. If we continue up today I'd look for resistance from the orange and black falling trendlines pointing to around 2760 currently.
John F. Kennedy was well known for having an affair with Marilyn Monroe. Now everyone seems to be saying that Trump had one as well. Whether it's true or not isn't important, what's important is how focused the main stream propaganda machine seem to be about it.
With all the attention on Trump having this affair with a very beautiful woman they can gets people's attention off of the pedophile rings going on both inside the main stream media and of course with the Clinton's, Bushes, and all the high and powerful leaders of companies as well as congressmen and senators.
It's exactly the reason they are attacking him over and over with every piece of dirt they can find. Not that I'm supporting his affair but at least it was with a woman and not an 8 year boy (or younger) that this elite gay pedophiles are raping and killing in ritual sacrifices.
If you really want to know how deep this rabbit hole of corruption, pedophilia, fraud, theft, and ritual sacrifices you need to start following QANON (https://www.youtube.com/user/rmswill/videos) who tells you what Trump is really doing behind the scenes to save America from these satanists.
Here's the latest video:
And here's the Washington Post bashing Trump to the sheep will forget about Hilary and her pizza gate pedophile emails, as well as fraud in everything you can imagine.
Porn actress Stormy Daniels sues Trump, says hush agreement is null because he didn’t sign it
Adult-film star Stormy Daniels reportedly was paid to remain silent about a sexual relationship with Donald Trump before he was president.
Stormy Daniels, the porn star who says she was paid to keep quiet about her alleged affair with Donald Trump, sued the president Tuesday, asking the court to declare that her nondisclosure agreement before the 2016 election is void because Trump did not sign it.
In the lawsuit filed in Los Angeles Superior Court, Daniels — whose real name is Stephanie Clifford — said she had wanted to go public with the story of her alleged decade-old affair with Trump in the weeks leading up to the election. The lawsuit was first reported by NBC News.
Trump’s lawyer, Michael Cohen, and Daniels’s attorney at the time, Keith Davidson, negotiated what the lawsuit calls a “hush agreement” in which she would be paid $130,000. After delays and even a cancellation of the contract by Daniels on Oct. 17, the payment arrived on Oct. 27, 12 days before the election, according to emails reviewed by The Washington Post. Cohen said recently that he had used his own money to “facilitate” the payment.
The lawsuit suggests that Trump was aware of the agreement and that the money was intended to influence the election’s outcome. That intimation bolsters two complaints filed with the Federal Election Commission that say the payment violated election law because it was not reported as an in-kind campaign donation.
The lawsuit says: “Mr. Trump, with the assistance of his attorney, Mr. Cohen, aggressively sought to silence Ms. Clifford as part of an effort to avoid her telling the truth, thus helping to ensure he won the presidential election.”
Cohen has previously denied that the payment breached campaign finance law. But the lawsuit raises new accusations against Cohen, saying that “through intimidation and coercive tactics,” he caused Daniels this year to sign a statement denying the affair. The suit says Cohen has continued to try to “intimidate” Daniels into keeping quiet in recent weeks as reports about the deal and Daniels’s relationship with Trump have leaked out and Daniels has given television interviews.
Cohen did not respond Tuesday to a request for comment. Davidson, the attorney who negotiated the deal for Daniels, declined to comment.
The White House did not immediately respond to a request for comment Tuesday evening. A spokesman for the Trump campaign, Michael Glassner, declined to comment.
Gina Rodriguez, who has represented Daniels, referred all questions about the suit to Daniels’s new attorney, Michael Avenatti. He said in an email: “A Supreme Court Justice once said that ‘sunlight is the best disinfectant.’ And we fully intend on bringing as much sunlight to this matter as possible. Let the chips fall where they may.”
In the complaint, filed under Daniels’s real name — Clifford — the court is asked to declare the deal with Trump invalid and unenforceable, and it says Trump deliberately did not sign it so that he could later disavow knowledge of it.
A person familiar with the deal said it required the signature of Cohen or Trump, but not both. The person described as “buyer’s remorse” Daniels’s decision to sue 16 months after she was paid.
Appended to the complaint is a copy of the alleged agreement between Clifford and Trump, making the document public for the first time.
On Oct. 17, 2016, Cohen formed a limited liability corporation in Delaware that he used to send $130,000 to Daniels under her “Clifford” name, according to public records and a person familiar with the transaction. The lawsuit alleges that Cohen formed the LLC “to hide the true sources of funds to be used to pay Ms. Clifford, thus further insulating Mr. Trump from later discovery and scrutiny.”
The lawsuit landed on the same day that The Post reported that special counsel Robert S. Mueller III requested documents and interviewed witnesses about incidents involving Cohen.
Avenatti graduated from the University of Pennsylvania and George Washington University Law School, and founded the law firm Eagan Avenatti, LLP in 2007 with offices in Newport Beach, Calif., Los Angeles and San Francisco.
His website promotes Avenatti as an attorney, commentator and entrepreneur who has represented parties in cases brought against celebrity defendants, including Paris Hilton and Jim Carrey, as well as athletes, business executives and Fortune 100 companies. Avenatti “works closely with the press and media in connection with his legal practice — an area in which most lawyers falter and under-utilize,” the site says.
Avenatti has ties to Democrats. He gave nearly $6,000 to Democratic candidates in federal elections prior to 2008, including John F. Kerry and John Edwards when they were seeking the presidency. And according to his website, he spent five years working for a political consulting firm run by Rahm Emanuel, a Democratic operative who later became President Barack Obama’s chief of staff and is now mayor of Chicago.
“Somebody should ask the president and Mr. Cohen the following very simple questions: First, did Mr. Trump sign the agreement? And second, did he know about the payment and the agreement?” said Avenatti, reached by phone Tuesday evening. “These are very simple questions. The answers should likewise be very simple. The ramifications of the answers are significant.”
Karen Tynan, an attorney for the adult entertainment industry, described the suit as a smart move, avoiding the possibility of private arbitration.
“Stormy has got time to amend the complaint and add more causes of action in the next few weeks,” Tynan said in a message. “This is absolutely and unequivocally not a good development for Michael Cohen or the president.”
Now you tell me...
Should we be worried about some possible affair did 10 years ago or about fraud, corruption, and pedophile rings that have been destroying America for years?
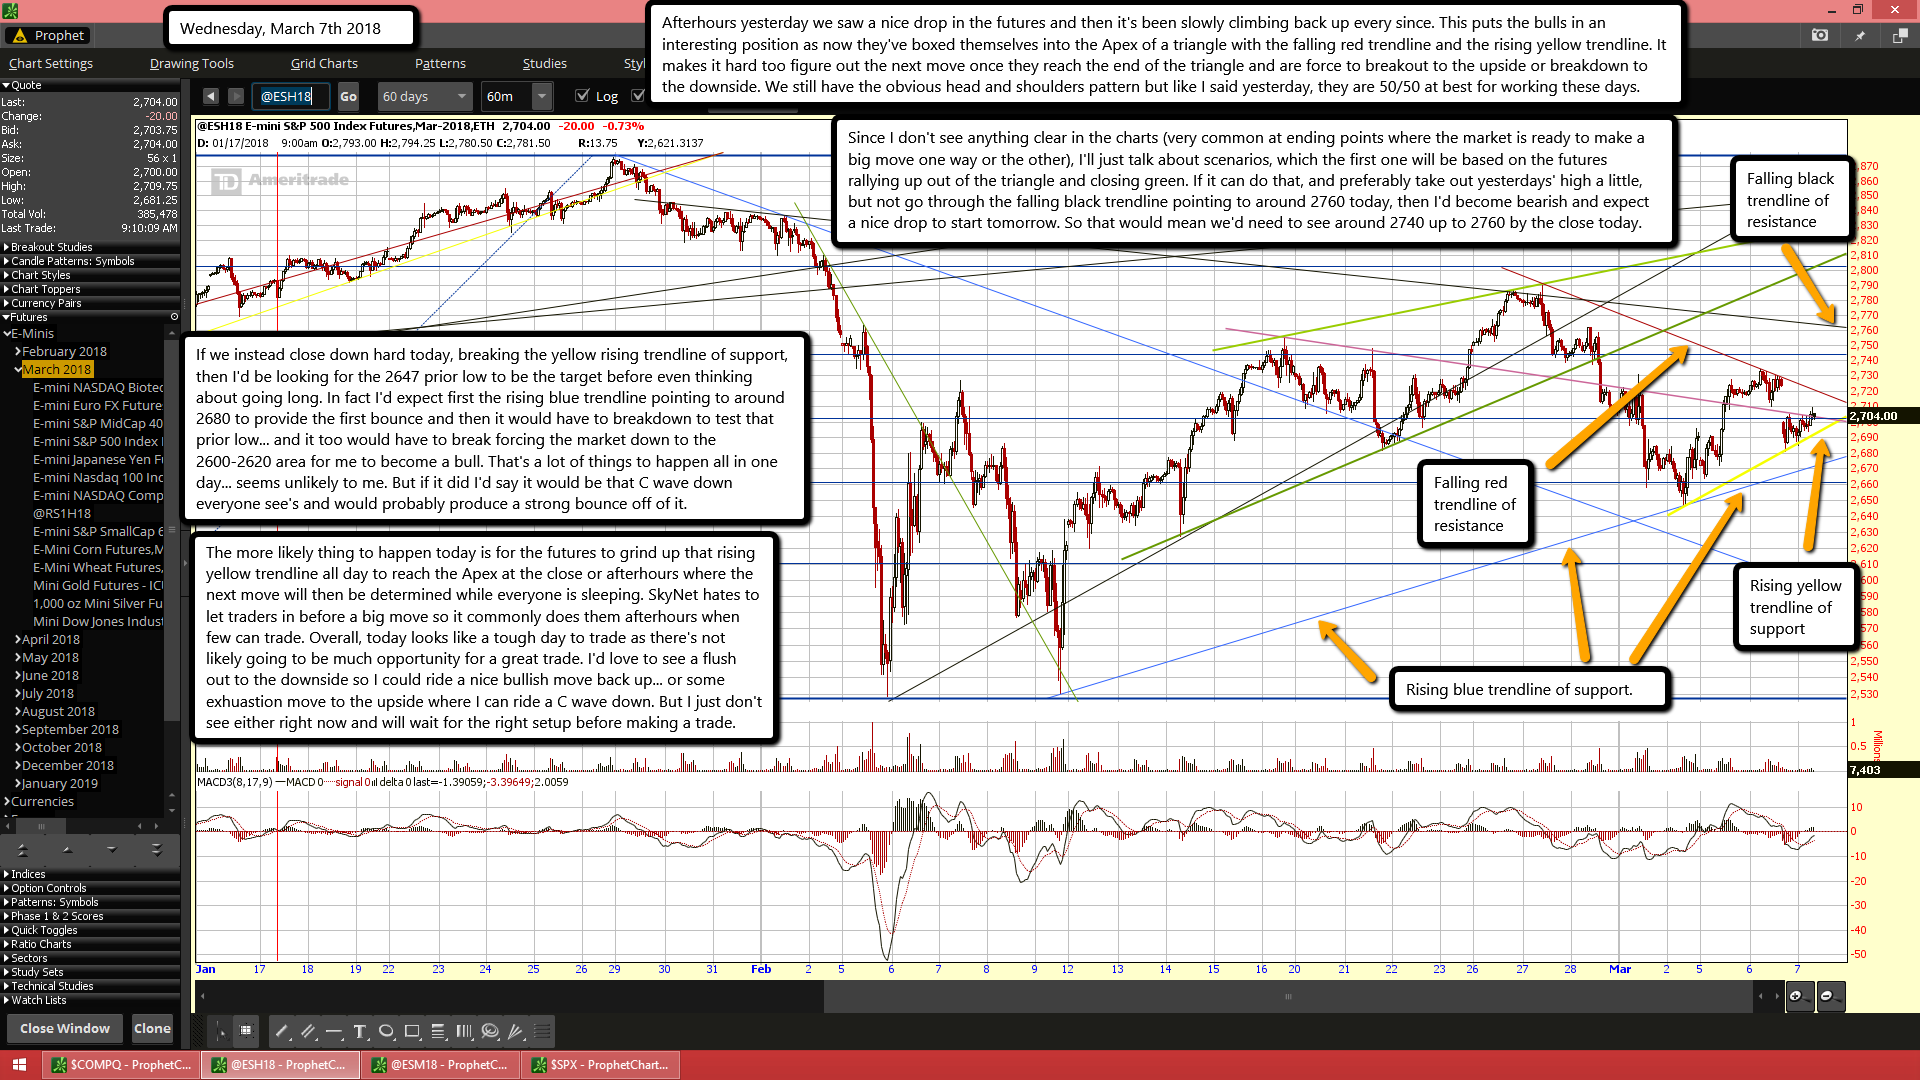
Afterhours yesterday we saw a nice drop in the futures and then it's been slowly climbing back up every since. This puts the bulls in an interesting position as now they've boxed themselves into the Apex of a triangle with the falling red trendline and the rising yellow trendline. It makes it hard too figure out the next move once they reach the end of the triangle and are force to breakout to the upside or breakdown to the downside. We still have the obvious head and shoulders pattern but like I said yesterday, they are 50/50 at best for working these days.
Since I don't see anything clear in the charts (very common at ending points where the market is ready to make a big move one way or the other), I'll just talk about scenarios, which the first one will be based on the futures rallying up out of the triangle and closing green. If it can do that, and preferably take out yesterdays' high a little, but not go through the falling black trendline pointing to around 2760 today, then I'd become bearish and expect a nice drop to start tomorrow. So that would mean we'd need to see around 2740 up to 2760 by the close today.
If we instead close down hard today, breaking the yellow rising trendline of support, then I'd be looking for the 2647 prior low to be the target before even thinking about going long. In fact I'd expect first the rising blue trendline pointing to around 2680 to provide the first bounce and then it would have to breakdown to test that prior low... and it too would have to break forcing the market down to the 2600-2620 area for me to become a bull. That's a lot of things to happen all in one day... seems unlikely to me. But if it did I'd say it would be that C wave down everyone see's and would probably produce a strong bounce off of it.
The more likely thing to happen today is for the futures to grind up that rising yellow trendline all day to reach the Apex at the close or afterhours where the next move will then be determined while everyone is sleeping. SkyNet hates to let traders in before a big move so it commonly does them afterhours when few can trade. Overall, today looks like a tough day to trade as there's not likely going to be much opportunity for a great trade. I'd love to see a flush out to the downside so I could ride a nice bullish move back up... or some exhuastion move to the upside where I can ride a C wave down. But I just don't see either right now and will wait for the right setup before making a trade.
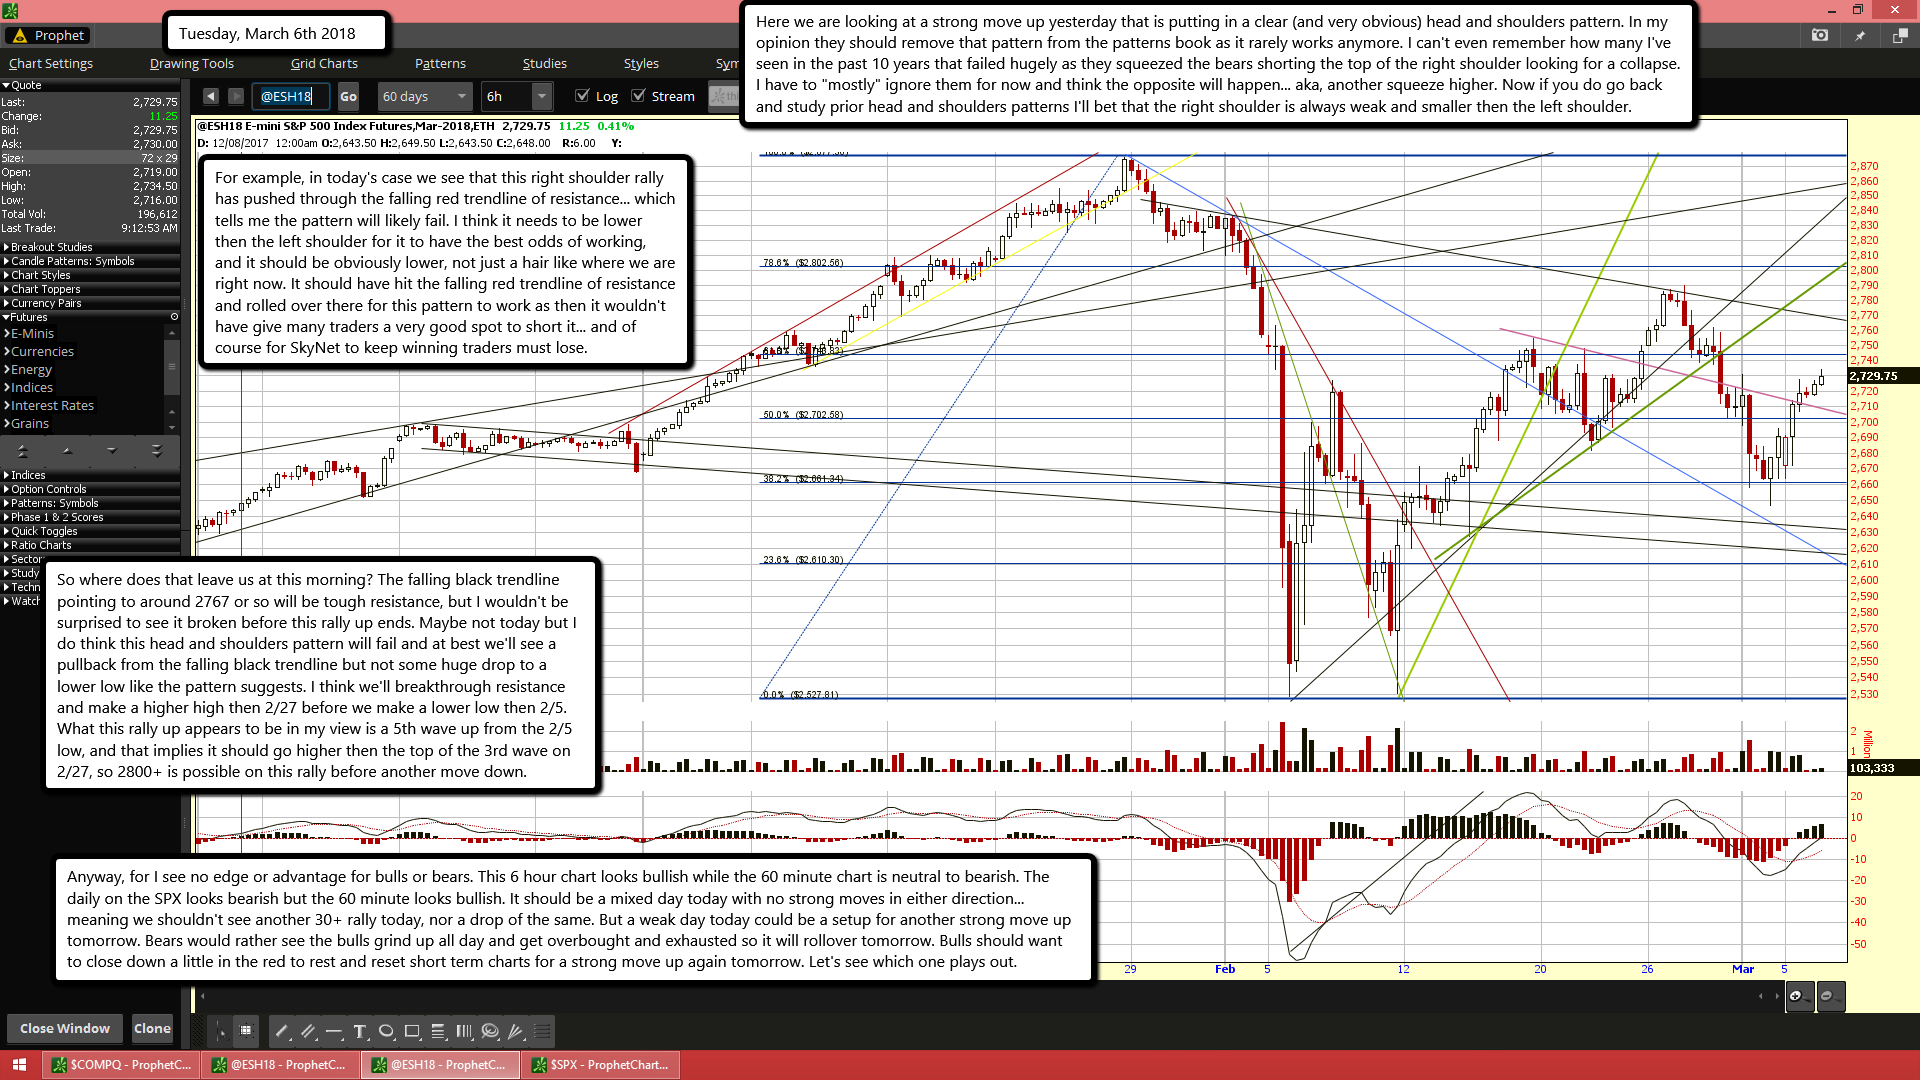
Here we are looking at a strong move up yesterday that is putting in a clear (and very obvious) head and shoulders pattern. In my opinion they should remove that pattern from the patterns book as it rarely works anymore. I can't even remember how many I've seen in the past 10 years that failed hugely as they squeezed the bears shorting the top of the right shoulder looking for a collapse. I have to "mostly" ignore them for now and think the opposite will happen... aka, another squeeze higher. Now if you do go back and study prior head and shoulders patterns I'll bet that the right shoulder is always weak and smaller then the left shoulder.
For example, in today's case we see that this right shoulder rally has pushed through the falling red trendline of resistance... which tells me the pattern will likely fail. I think it needs to be lower then the left shoulder for it to have the best odds of working, and it should be obviously lower, not just a hair like where we are right now. It should have hit the falling red trendline of resistance and rolled over there for this pattern to work as then it wouldn't have give many traders a very good spot to short it... and of course for SkyNet to keep winning traders must lose.
So where does that leave us at this morning? The falling black trendline pointing to around 2767 or so will be tough resistance, but I wouldn't be surprised to see it broken before this rally up ends. Maybe not today but I do think this head and shoulders pattern will fail and at best we'll see a pullback from the falling black trendline but not some huge drop to a lower low like the pattern suggests. I think we'll breakthrough resistance and make a higher high then 2/27 before we make a lower low then 2/5. What this rally up appears to be in my view is a 5th wave up from the 2/5 low, and that implies it should go higher then the top of the 3rd wave on 2/27, so 2800+ is possible on this rally before another move down.
Anyway, for I see no edge or advantage for bulls or bears. This 6 hour chart looks bullish while the 60 minute chart is neutral to bearish. The daily on the SPX looks bearish but the 60 minute looks bullish. It should be a mixed day today with no strong moves in either direction... meaning we shouldn't see another 30+ rally today, nor a drop of the same. But a weak day today could be a setup for another strong move up tomorrow. Bears would rather see the bulls grind up all day and get overbought and exhausted so it will rollover tomorrow. Bulls should want to close down a little in the red to rest and reset short term charts for a strong move up again tomorrow. Let's see which one plays out.
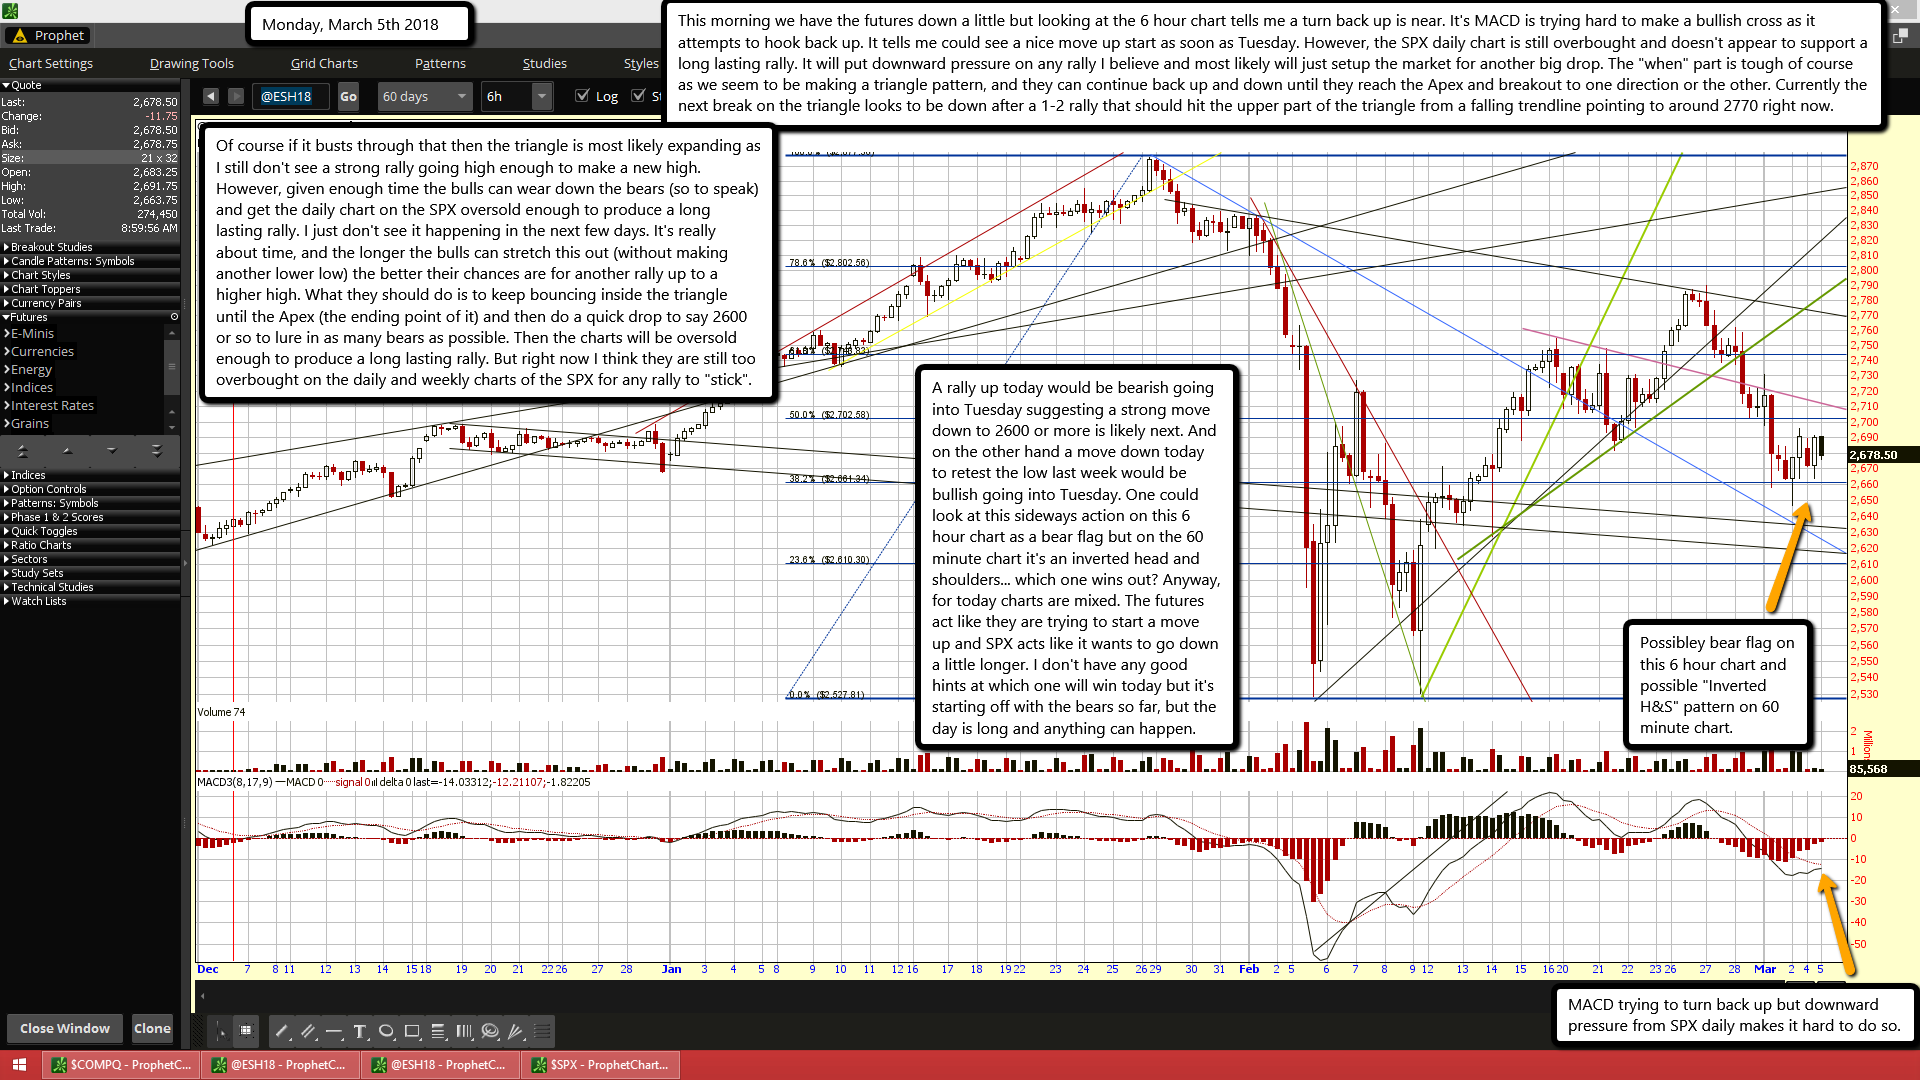
This morning we have the futures down a little but looking at the 6 hour chart tells me a turn back up is near. It's MACD is trying hard to make a bullish cross as it attempts to hook back up. It tells me could see a nice move up start as soon as Tuesday. However, the SPX daily chart is still overbought and doesn't appear to support a long lasting rally. It will put downward pressure on any rally I believe and most likely will just setup the market for another big drop. The "when" part is tough of course as we seem to be making a triangle pattern, and they can continue back up and down until they reach the Apex and breakout to one direction or the other. Currently the next break on the triangle looks to be down after a 1-2 rally that should hit the upper part of the triangle from a falling trendline pointing to around 2770 right now.
Of course if it busts through that then the triangle is most likely expanding as I still don't see a strong rally going high enough to make a new high. However, given enough time the bulls can wear down the bears (so to speak) and get the daily chart on the SPX oversold enough to produce a long lasting rally. I just don't see it happening in the next few days. It's really about time, and the longer the bulls can stretch this out (without making another lower low) the better their chances are for another rally up to a higher high. What they should do is to keep bouncing inside the triangle until the Apex (the ending point of it) and then do a quick drop to say 2600 or so to lure in as many bears as possible. Then the charts will be oversold enough to produce a long lasting rally. But right now I think they are still too overbought on the daily and weekly charts of the SPX for any rally to "stick".
A rally up today would be bearish going into Tuesday suggesting a strong move down to 2600 or more is likely next. And on the other hand a move down today to retest the low last week would be bullish going into Tuesday. One could look at this sideways action on this 6 hour chart as a bear flag but on the 60 minute chart it's an inverted head and shoulders... which one wins out? Anyway, for today charts are mixed. The futures act like they are trying to start a move up and SPX acts like it wants to go down a little longer. I don't have any good hints at which one will win today but it's starting off with the bears so far, but the day is long and anything can happen.
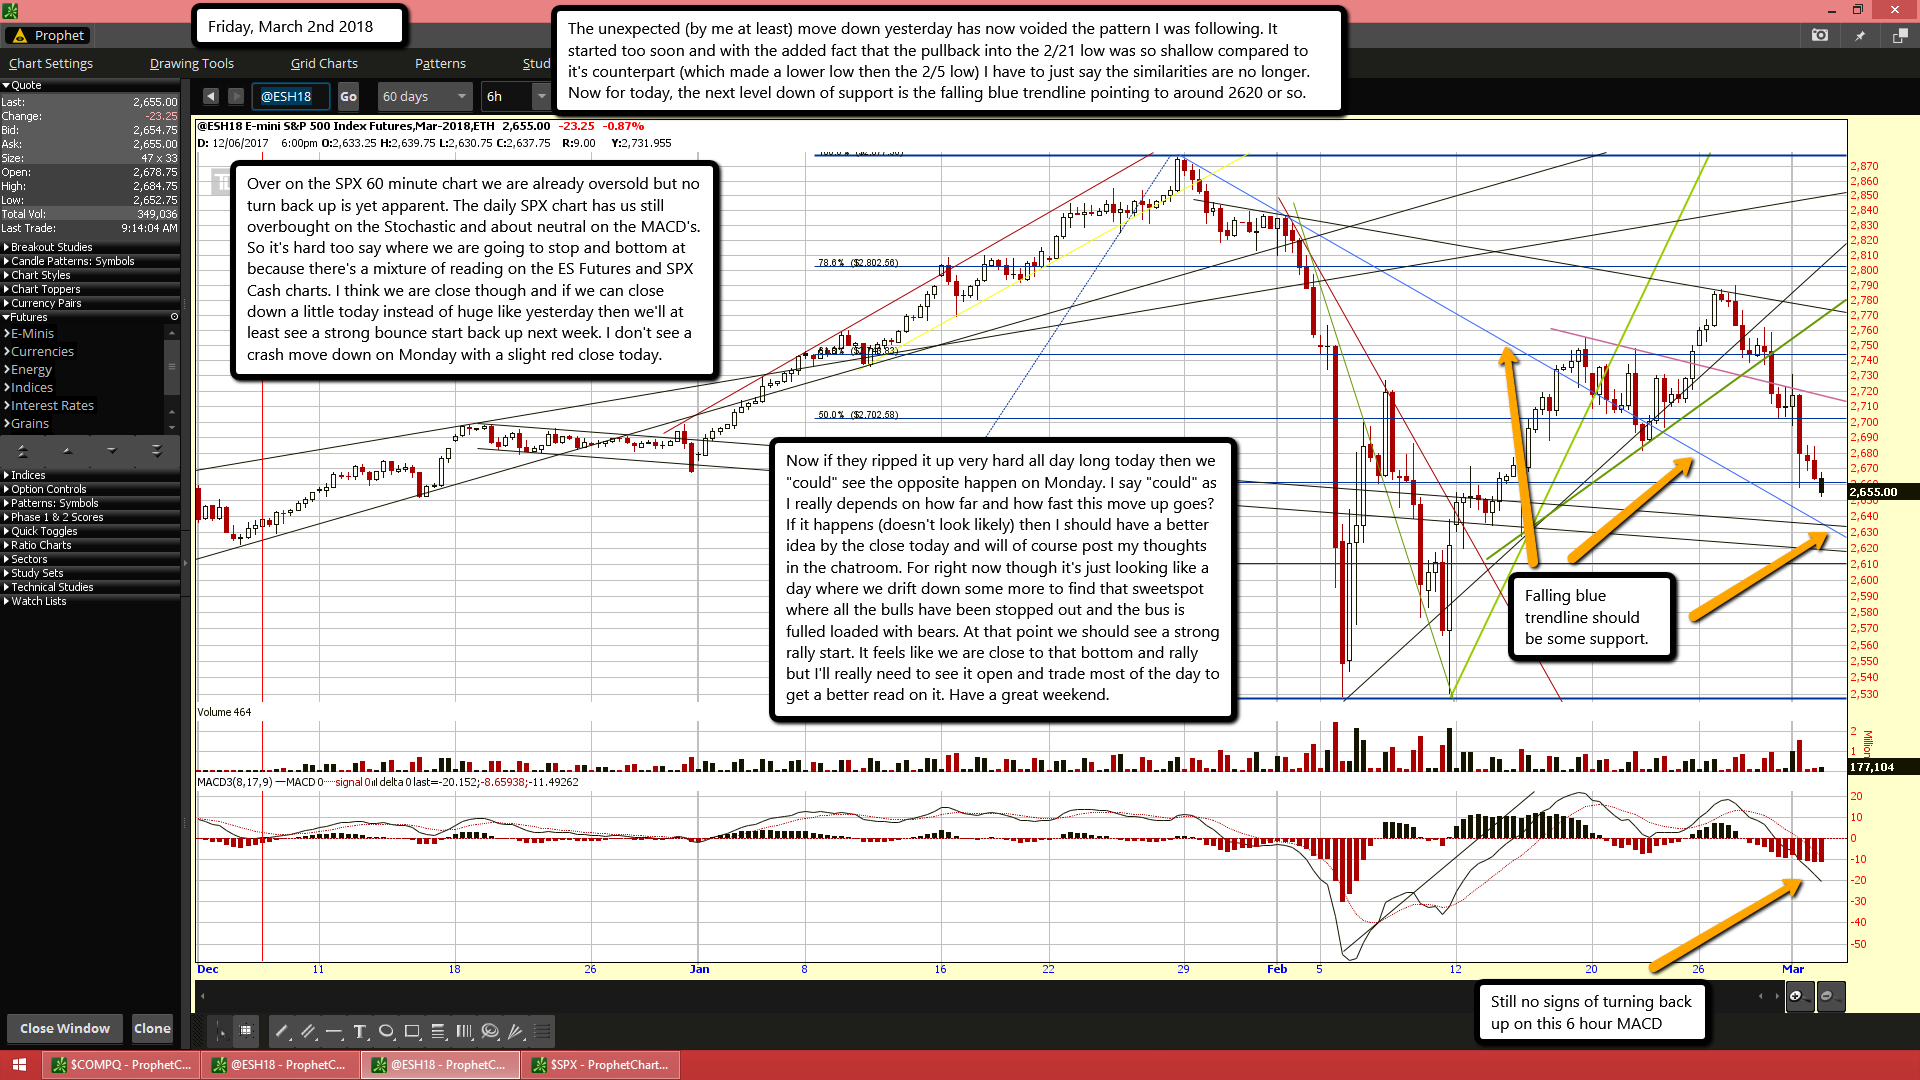
The unexpected (by me at least) move down yesterday has now voided the pattern I was following. It started too soon and with the added fact that the pullback into the 2/21 low was so shallow compared to it's counterpart (which made a lower low then the 2/5 low) I have to just say the similarities are no longer. Now for today, the next level down of support is the falling blue trendline pointing to around 2620 or so.
Over on the SPX 60 minute chart we are already oversold but no turn back up is yet apparent. The daily SPX chart has us still overbought on the Stochastic and about neutral on the MACD's. So it's hard too say where we are going to stop and bottom at because there's a mixture of reading on the ES Futures and SPX Cash charts. I think we are close though and if we can close down a little today instead of huge like yesterday then we'll at least see a strong bounce start back up next week. I don't see a crash move down on Monday with a slight red close today.
Now if they ripped it up very hard all day long today then we "could" see the opposite happen on Monday. I say "could" as I really depends on how far and how fast this move up goes? If it happens (doesn't look likely) then I should have a better idea by the close today and will of course post my thoughts in the chatroom. For right now though it's just looking like a day where we drift down some more to find that sweetspot where all the bulls have been stopped out and the bus is fulled loaded with bears. At that point we should see a strong rally start. It feels like we are close to that bottom and rally but I'll really need to see it open and trade most of the day to get a better read on it. Have a great weekend.
We’ve all been warned that it is coming, but as SHTFPlan.com's Mac Slavo notes, what is disturbing is that while technology surrounds us and *some* have concerns about privacy, most shrug at the massive amounts of data they are collecting about our lives, and the incredible level of control the system now has over each individual.
This bill passed, clinging to the broadest base of “good intentions” that it could muster, i.e. caring for those with disabilities and decline with age.
But in reality, it is a nose under the tent for a system that needs the ability to microchip dissenters, and to force cooperation on the part of the general population. In effect, everyone is now under their thumb with this, because anyone could doesn’t go along with the mass conditioning will be labeled ‘mentally –––’ and branded with a track-and-control chip. Game over.
At the first sign of suspicious behavior, or troubling social media profile, or a misunderstanding during an encounter, police and medical personnel – among others – will have the authority to declare someone ‘mentally disabled’ (or incapacitated, or temporarily insane, or unsound of mind, or whatever label is handy) just because they express discontent, anger or outage at the state of the world and political affairs. “Fake news” journalists can be shut down, and “conspiracy minded” individuals controlled… and of course, it will be abused. The tactics used against parents by CPS will be forged together with the creepy total surveillance of the fusion centers, etc. Potentially a very nasty police state.
This power will expand, and try again if it is slowed down or rejected. Whether it takes the form of an implanted chip, or a tracking number that is tied to each person, they will stop at nothing short of mark in everyone with identity tied to bank accounts, etc. They will insist you be on the grid in every way… and with this bill, they just got one step closer to controlling the future. All this has been foretold, and yet it is beyond anything anyone could have imagined.
Though the bill only targets those with conditions such as Alzheimers and autism, critics say the bill’s passage will open a “pandora’s box” of invasive government surveillance.
Six years ago, NBC Nightly News boldly predicted that all Americans would be fitted with RFID microchips by the year 2017. Though at the time, NBC’s prediction seemed far-fetched, the House recently passed a bill that would bring a micro-chipped populace closer to reality before year’s end. Last Thursday, the House passed HR 4919, also known as Kevin and Avonte’s Law, which would allow the US attorney general to award grants to law enforcement for the creation and operation of “locative tracking technology programs.”
Though the program’s mission is to find “individuals with forms of dementia or children with developmental disabilities who have wandered from safe environments,” it provides no restriction on the tracking programs inclusion of other individuals. The bill would also require the attorney general to work with the secretary of health and human services and unnamed health organizations to establish the “best practices” for the use of tracking devices.
Those in support of the legislation maintain that such programs could prevent tragedies where those with mental or cognitive disabilities wandered into dangerous circumstances. Yet, others have called these good intentions a “Trojan horse” for the expansion of a North American police state as the bill’s language could be very broadly interpreted.
“While this initiative may have noble intentions, ‘small and temporary’ programs in the name of safety and security often evolve into permanent and enlarged bureaucracies that infringe on the American people’s freedoms. That is exactly what we have here. A safety problem exists for people with Alzheimer’s, autism and other mental health issues, so the fix, we are told, is to have the Department of Justice, start a tracking program so we can use some device or method to track these individuals 24/7,” Representative Louie Gohmert (R-TX) said in a floor speech opposing the bill.
Gohmert’s assessment is spot-on. Giving local police the authority to decide who is micro-chipped and who is not based on their mental soundness is a recipe for disaster. Though the bill specifically mentions those with Alzheimer and autism, how long before these tracking programs are extended to those with ADHD and Bipolar disorder among other officially recognized disorders. Even the dislike of authority is considered a mental disorder known as “Oppositional Defiant Disorder,” which could also warrant micro-chipping in the future.
If these programs expand unchecked, how long will it be before all Americans are told that mass microchipping is necessary so that law enforcement and the government can better “protect” them? Many Americans have been content to trade their liberties for increased “security” in the post-9/11 world, particularly when the state uses these talking points. Yet, as Benjamin Franklin once said, “those who surrender freedom for security will not have, nor do they deserve, either one.”
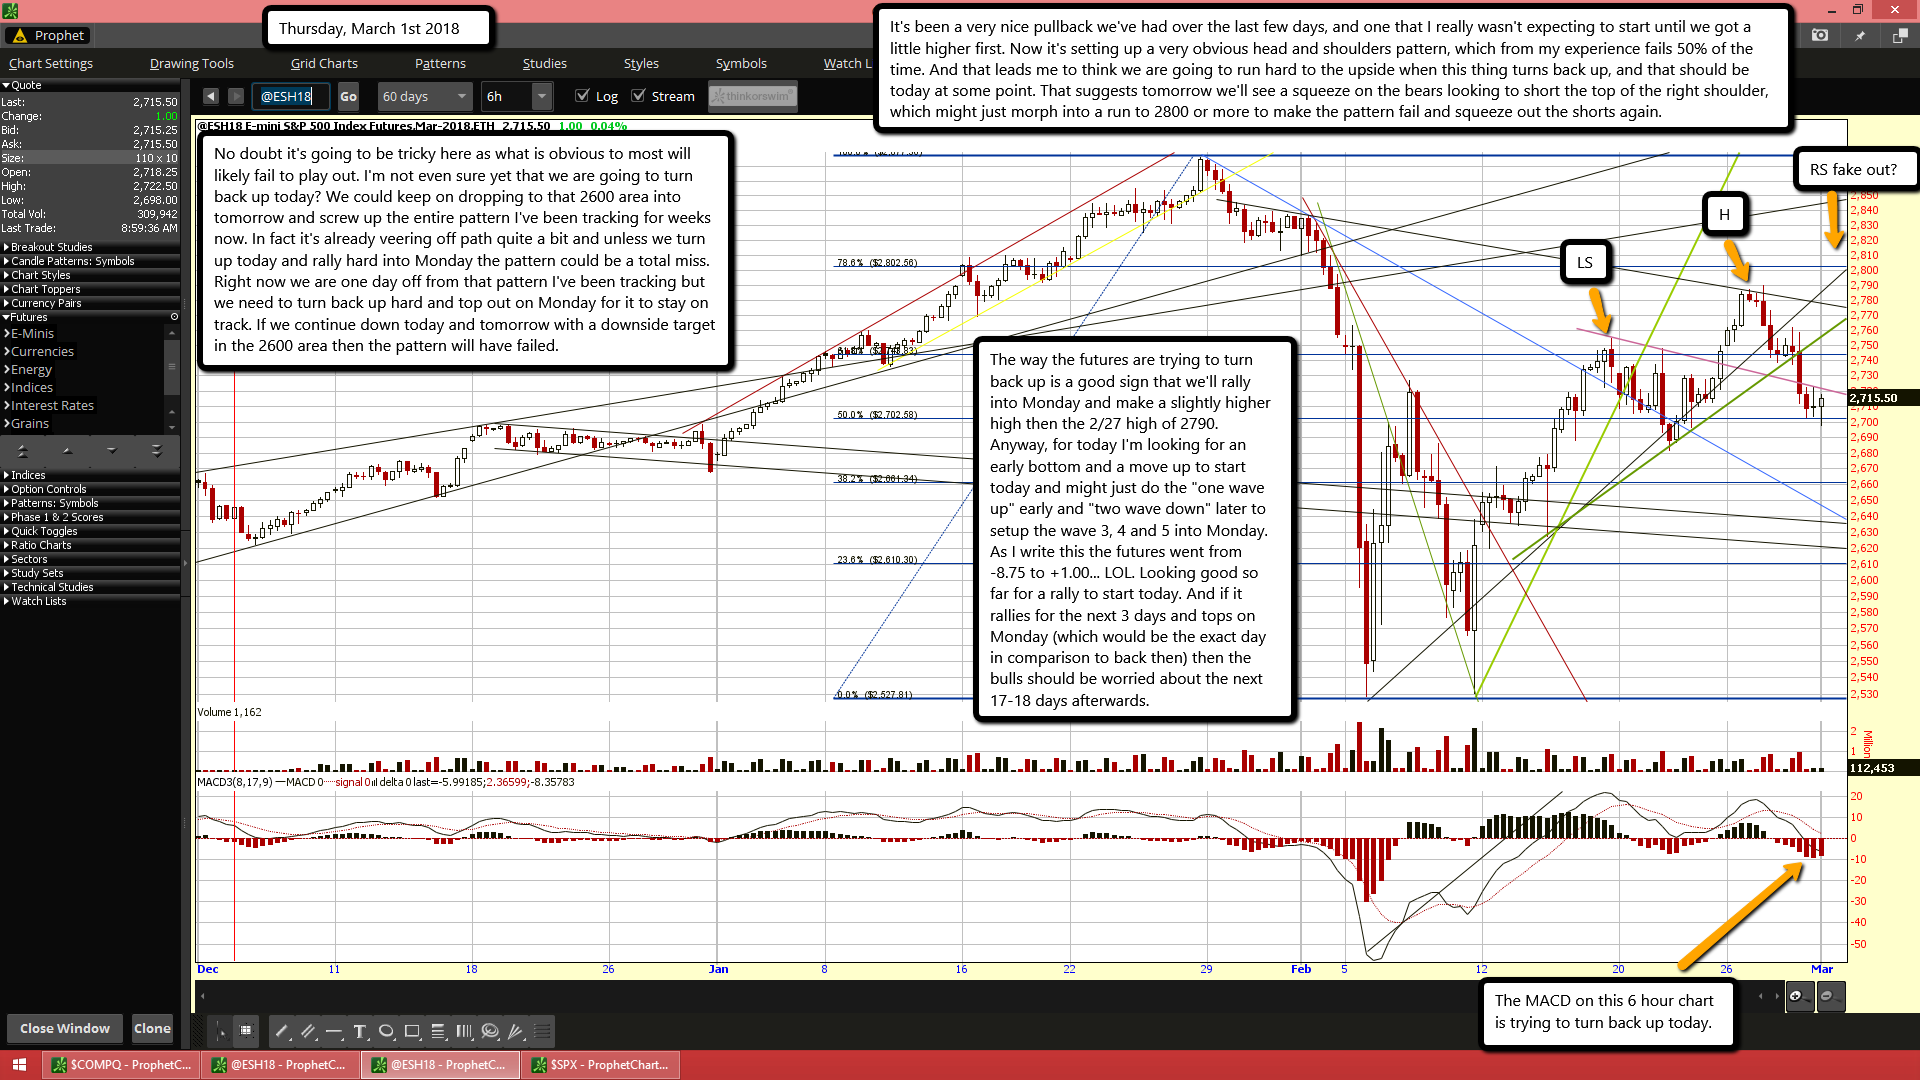
It's been a very nice pullback we've had over the last few days, and one that I really wasn't expecting to start until we got a little higher first. Now it's setting up a very obvious head and shoulders pattern, which from my experience fails 50% of the time. And that leads me to think we are going to run hard to the upside when this thing turns back up, and that should be today at some point. That suggests tomorrow we'll see a squeeze on the bears looking to short the top of the right shoulder, which might just morph into a run to 2800 or more to make the pattern fail and squeeze out the shorts again.
No doubt it's going to be tricky here as what is obvious to most will likely fail to play out. I'm not even sure yet that we are going to turn back up today? We could keep on dropping to that 2600 area into tomorrow and screw up the entire pattern I've been tracking for weeks now. In fact it's already veering off path quite a bit and unless we turn up today and rally hard into Monday the pattern could be a total miss. Right now we are one day off from that pattern I've been tracking but we need to turn back up hard and top out on Monday for it to stay on track. If we continue down today and tomorrow with a downside target in the 2600 area then the pattern will have failed.
The way the futures are trying to turn back up is a good sign that we'll rally into Monday and make a slightly higher high then the 2/27 high of 2790. Anyway, for today I'm looking for an early bottom and a move up to start today and might just do the "one wave up" early and "two wave down" later to setup the wave 3, 4 and 5 into Monday. As I write this the futures went from -8.75 to +1.00... LOL. Looking good so far for a rally to start today. And if it rallies for the next 3 days and tops on Monday (which would be the exact day in comparison to back then) then the bulls should be worried about the next 17-18 days afterwards.
The Dow Jones Industrial Average index recently suffered two trading sessions when it lost more than 1,000 points. But American stocks may face a much bigger meltdown, warns banking giant Morgan Stanley.
“Appetizer, not the main course,” the bank’s strategists wrote, describing the beginning of the year for the Dow, as quoted by Bloomberg.
The main threat to the stock market is higher bond yields and not faster inflation, according to analysts. A slowdown in the US economy could also be a factor for a decline in stocks.
“It’s when growth softens while inflation is still rising that returns suffer most,” Morgan Stanley wrote. “Strong global growth and a good first-quarter reporting season provided an important offset. We remain on watch for ‘tricky hand-off’ in the second quarter, as core inflation rises and activity indicators moderate.”
Despite the two bad days, the Dow is still up 2 percent since the beginning of the year, erasing all the losses.
Many analysts are comparing the current situation on the US stock markets to 2008 in the wake of the global financial crisis. At the time, stocks also hit several all-time highs, despite warning signs of the impending turmoil.
A recent Bank of America Merrill Lynch fund manager survey for February showed that 70 percent of those polled said the global economy is in its “late cycle.”
WOW... a banker telling us the future!
Sounds to me like we are going higher in the market as we know "they" all lie through their teeth.
My guess is we have another pullback into March of 2018 and then up strongly into Spring/Summer of the year. Then about the time they say it's over with and the market is back to being bullish I'd look out for the top.
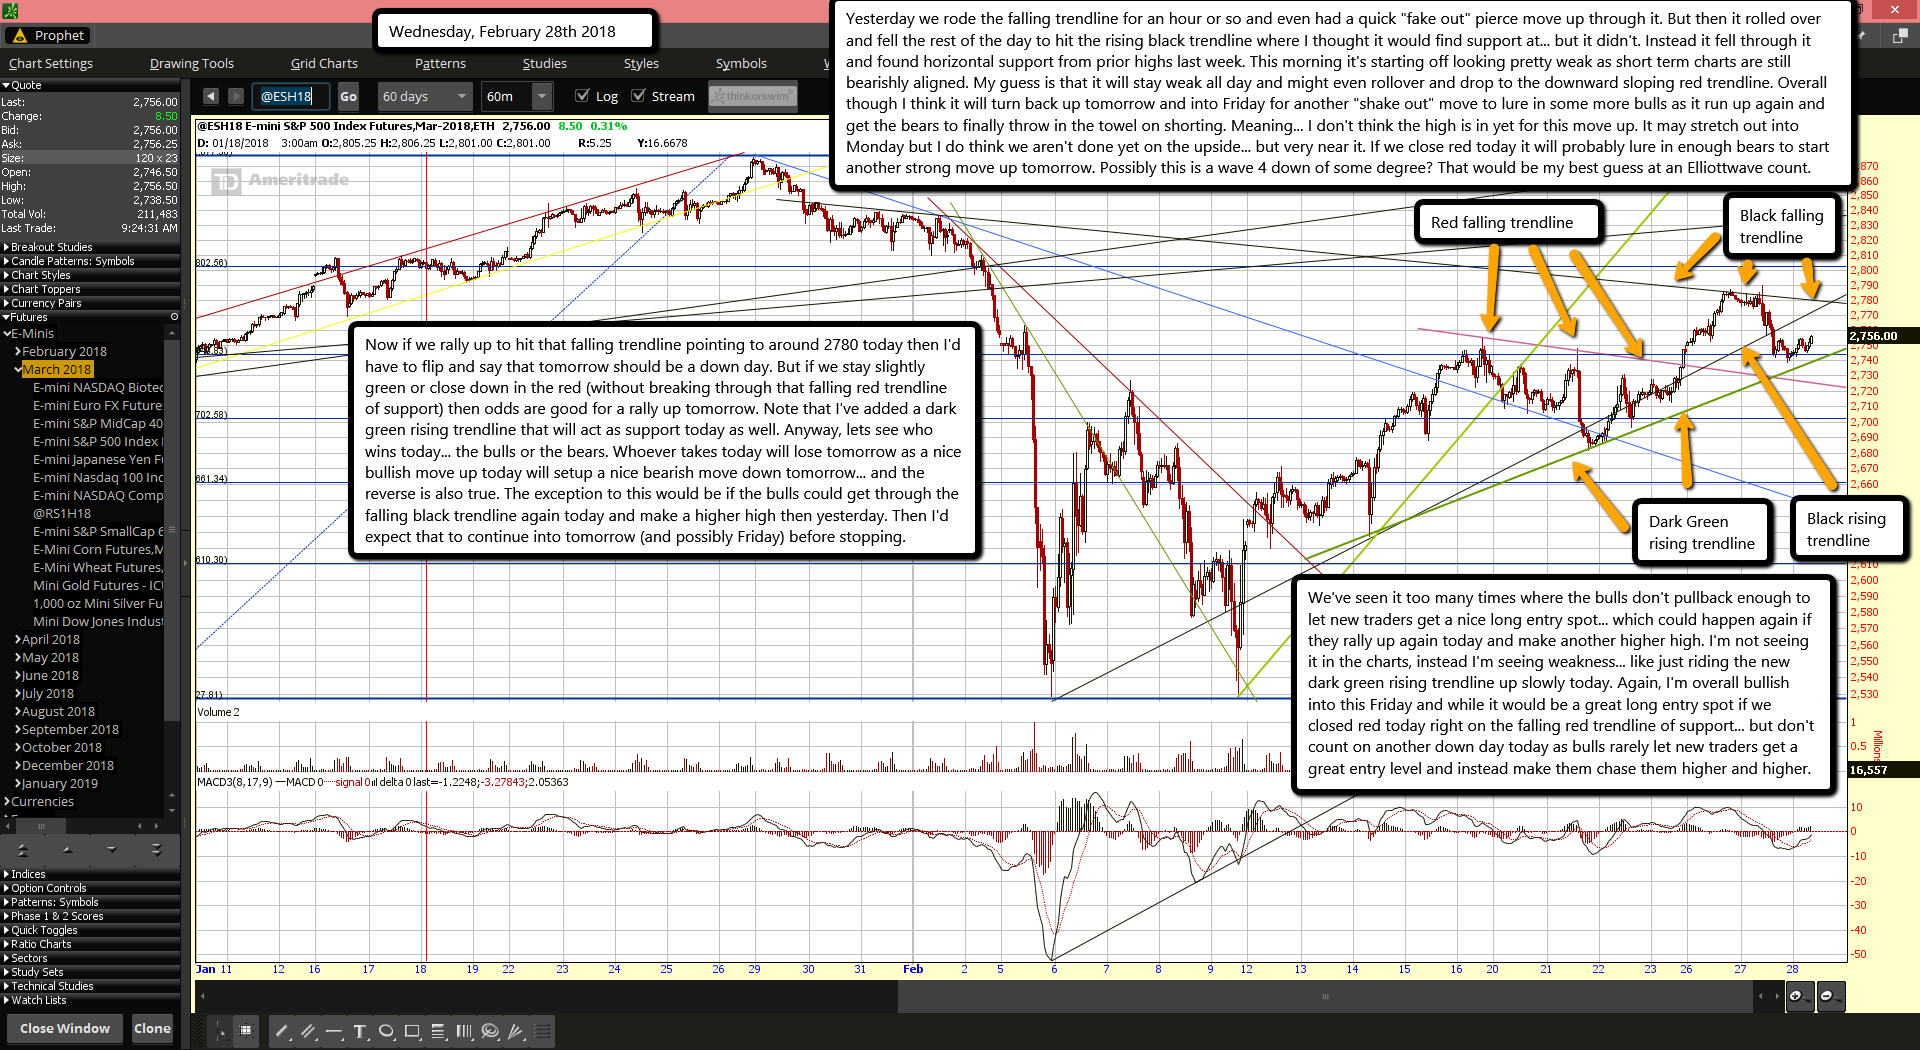
Yesterday we rode the falling trendline for an hour or so and even had a quick "fake out" pierce move up through it. But then it rolled over and fell the rest of the day to hit the rising black trendline where I thought it would find support at... but it didn't. Instead it fell through it and found horizontal support from prior highs last week. This morning it's starting off looking pretty weak as short term charts are still bearishly aligned. My guess is that it will stay weak all day and might even rollover and drop to the downward sloping red trendline. Overall though I think it will turn back up tomorrow and into Friday for another "shake out" move to lure in some more bulls as it run up again and get the bears to finally throw in the towel on shorting. Meaning... I don't think the high is in yet for this move up. It may stretch out into Monday but I do think we aren't done yet on the upside... but very near it. If we close red today it will probably lure in enough bears to start another strong move up tomorrow. Possibly this is a wave 4 down of some degree? That would be my best guess at an Elliottwave count.
Now if we rally up to hit that falling trendline pointing to around 2780 today then I'd have to flip and say that tomorrow should be a down day. But if we stay slightly green or close down in the red (without breaking through that falling red trendline of support) then odds are good for a rally up tomorrow. Note that I've added a dark green rising trendline that will act as support today as well. Anyway, lets see who wins today... the bulls or the bears. Whoever takes today will lose tomorrow as a nice bullish move up today will setup a nice bearish move down tomorrow... and the reverse is also true. The exception to this would be if the bulls could get through the falling black trendline again today and make a higher high then yesterday. Then I'd expect that to continue into tomorrow (and possibly Friday) before stopping.
We've seen it too many times where the bulls don't pullback enough to let new traders get a nice long entry spot... which could happen again if they rally up again today and make another higher high. I'm not seeing it in the charts, instead I'm seeing weakness... like just riding the new dark green rising trendline up slowly today. Again, I'm overall bullish into this Friday and while it would be a great long entry spot if we closed red today right on the falling red trendline of support... but don't count on another down day today as bulls rarely let new traders get a great entry level and instead make them chase them higher and higher.