Saturday, July 25, 2026
Home Blog Page 51

ES Morning Update February 20th 2018

0

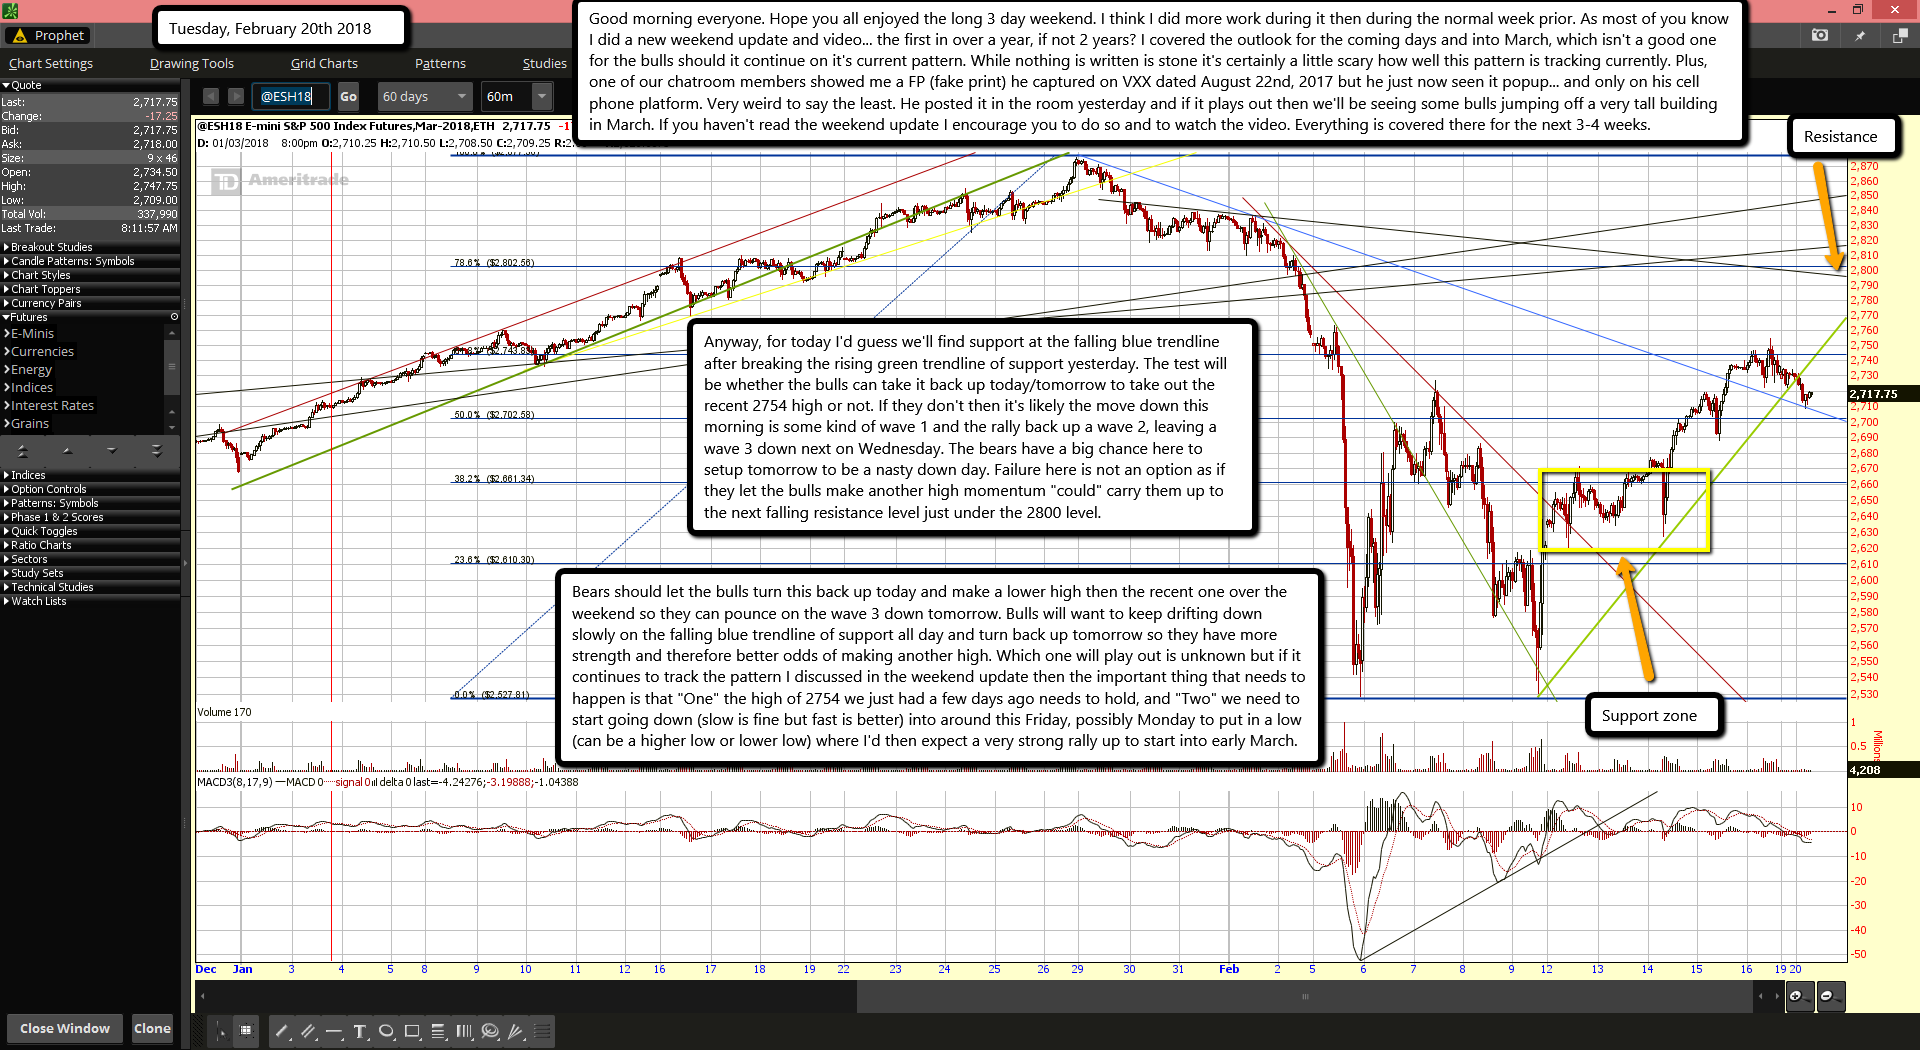
Good morning everyone. Hope you all enjoyed the long 3 day weekend. I think I did more work during it then during the normal week prior. As most of you know I did a new weekend update and video... the first in over a year, if not 2 years? I covered the outlook for the coming days and into March, which isn't a good one for the bulls should it continue on it's current pattern. While nothing is written is stone it's certainly a little scary how well this pattern is tracking currently. Plus, one of our chatroom members showed me a FP (fake print) he captured on VXX dated August 22nd, 2017 but he just now seen it popup... and only on his cell phone platform. Very weird to say the least. He posted it in the room yesterday and if it plays out then we'll be seeing some bulls jumping off a very tall building in March. If you haven't read the weekend update I encourage you to do so and to watch the video. Everything is covered there for the next 3-4 weeks.

Anyway, for today I'd guess we'll find support at the falling blue trendline after breaking the rising green trendline of support yesterday. The test will be whether the bulls can take it back up today/tomorrow to take out the recent 2754 high or not. If they don't then it's likely the move down this morning is some kind of wave 1 and the rally back up a wave 2, leaving a wave 3 down next on Wednesday. The bears have a big chance here to setup tomorrow to be a nasty down day. Failure here is not an option as if they let the bulls make another high momentum "could" carry them up to the next falling resistance level just under the 2800 level.

Bears should let the bulls turn this back up today and make a lower high then the recent one over the weekend so they can pounce on the wave 3 down tomorrow. Bulls will want to keep drifting down slowly on the falling blue trendline of support all day and turn back up tomorrow so they have more strength and therefore better odds of making another high. Which one will play out is unknown but if it continues to track the pattern I discussed in the weekend update then the important thing that needs to happen is that "One" the high of 2754 we just had a few days ago needs to hold, and "Two" we need to start going down (slow is fine but fast is better) into around this Friday, possibly Monday to put in a low (can be a higher low or lower low) where I'd then expect a very strong rally up to start into early March.

Is 2018 Setting Up A Stock Market Crash Or Inflationary Based Mega Rally-Part 2

0

[protect password="1987"]

It all started back in 2010 when I discovered the stock market was rigged!

On January 11th, 2010 I happened to check the end of the day price on the SPX and discovered something strange. The market was basically flat that day trading in a tight range with an intraday high of 1149.74 SPX and low of 1142.02, which was just barely over a 7 points swing. I didn't know anything about numerology back then but later learned the importance of the date and the numbers... which I will discuss later. What was showing up on the CNN Money site was a 97.70 drop that day on the SPX (which I started calling them "fake prints" or "FP's"), putting the low at 1047.28... almost a 100 point drop on a day that didn't move but around 7 points! Talk about a big mistake, this was a doosy and would been considered a flash crash back then! Of course I was a little suspicious about it and immediately thought it was a coded message for the insiders.
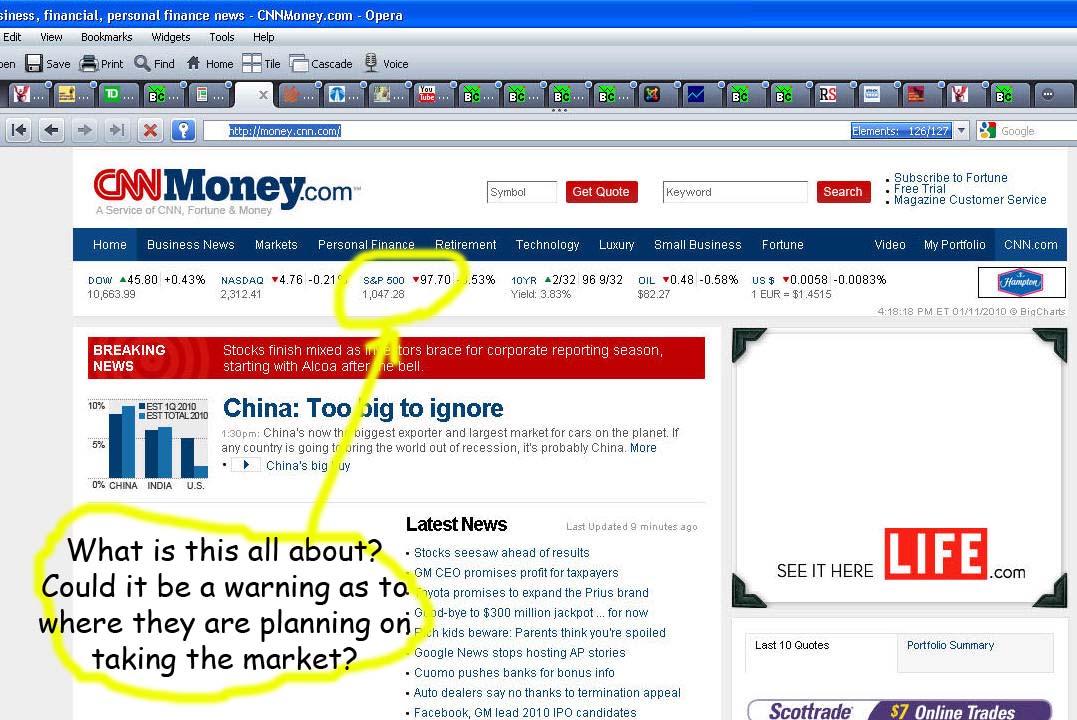
Low and behold just 25 days later (18 trading days) the SPX drops to hit that low and pierce it a few points before ripping back up for many months afterwards and finally topping out in April. Clearly this turned out to be a coded message to the insiders as to the coming low. This was also around the time I discovered the importance of Legatus events (http://legatus.org) as this was where the elite would meet and decide many things... including "when" to turn the stock market up or down. While every Legatus meeting wasn't a "turn" in the stock market many were. In fact the "pilgrimages" seemed to be the most important ones. Strangely there was a Legatus meeting between February 4th through the 6th of that year and the market bottomed right in the middle on the 5th... coincidence? I think not.
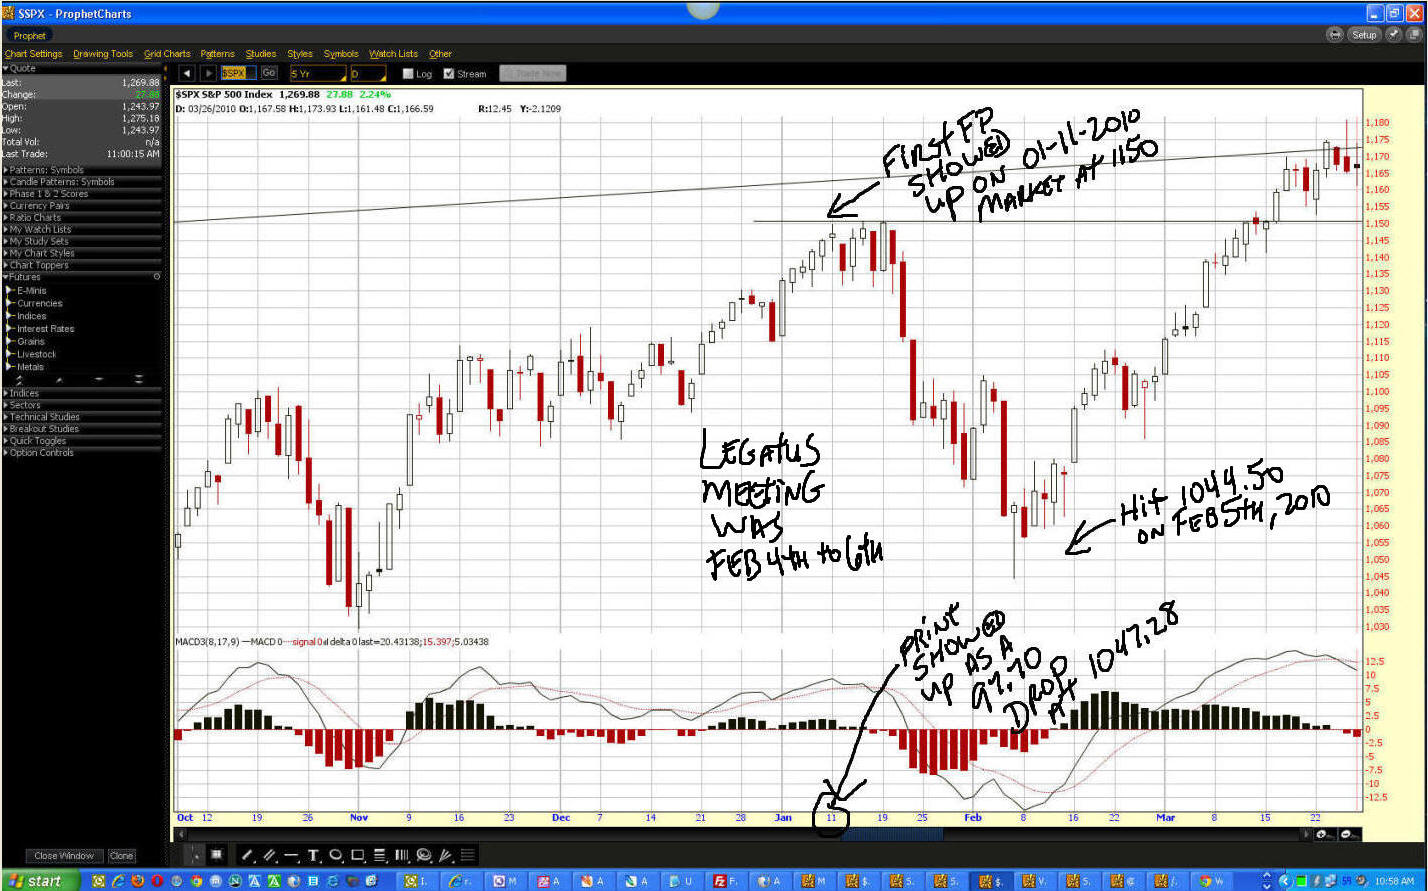
Ok, so that's all weird enough but after I learned (it was many months later) a little about numerology I went back to look at the numbers in that date and print. You see, the elite use numbers in everything and some of the most powerful to them are multiples of the number "eleven", and that would include numbers like 111, 1111, 22, 222, 33, 333, 444, 55, etc... as they are all dividable by 11. Of course the satanic number 666 or 999 (which is 666 upside down) is very important to them too. In fact they bottomed the SPX in the 2009 crash low at 666.79 just for that reason... to show off and gain power from satan because they control the stock market. (There apparently are about 5 different factions of the illuminati and the zionist are the one's controlling the market, but they all use numerology).

Getting back to that coded fake print...

First off you'll see that the date they put the print out for all to see was on the 11th of the month... next we see that the low target was 1047.28, which if you add the 4+7 together you get 11, then the 28 is 2+8, or 10. Now in numerology there's no "zero's", so they just drop them... therefore the 10 becomes just a 1, and the 1047 becomes 1011, or 111 (dropping the zero) and then all together it's 111.1, or just 1111. That's a clear code for the insiders that's the FP is a real one. To double confirm it they put it out on the 11th of the month. Insiders knew how to decipher the code and knew the low would be around the next Legatus meeting, but I was not a "member" of their satanic group so it took me many years (still learning) to understand as much as I do today.

In their rules of numerology the number 11 and multiples of it do NOT breakdown and are left as a whole number. You only add together the other digits to come up with some final number and drop out the zero's. It's tricky to understand and I certainly am NO master at it. I just have learned to play around with the numbers to see what they are saying. Then I look for further conformation with other stuff, like possibly a Legatus event and/or technical analysis and some Elliottwave.

Now if you think it's all bologna then look at this...

Later that year on May 6th, 2010 we saw a flash crash happen, but what was interesting was that it was foretold with a FP the night before around 5 minutes until midnight. I did not see it until after it happened so in the image below you'll see both the FP showing a low of 1056 on S&P500 Futures (Symbol is: /ES) and what happened the next day.
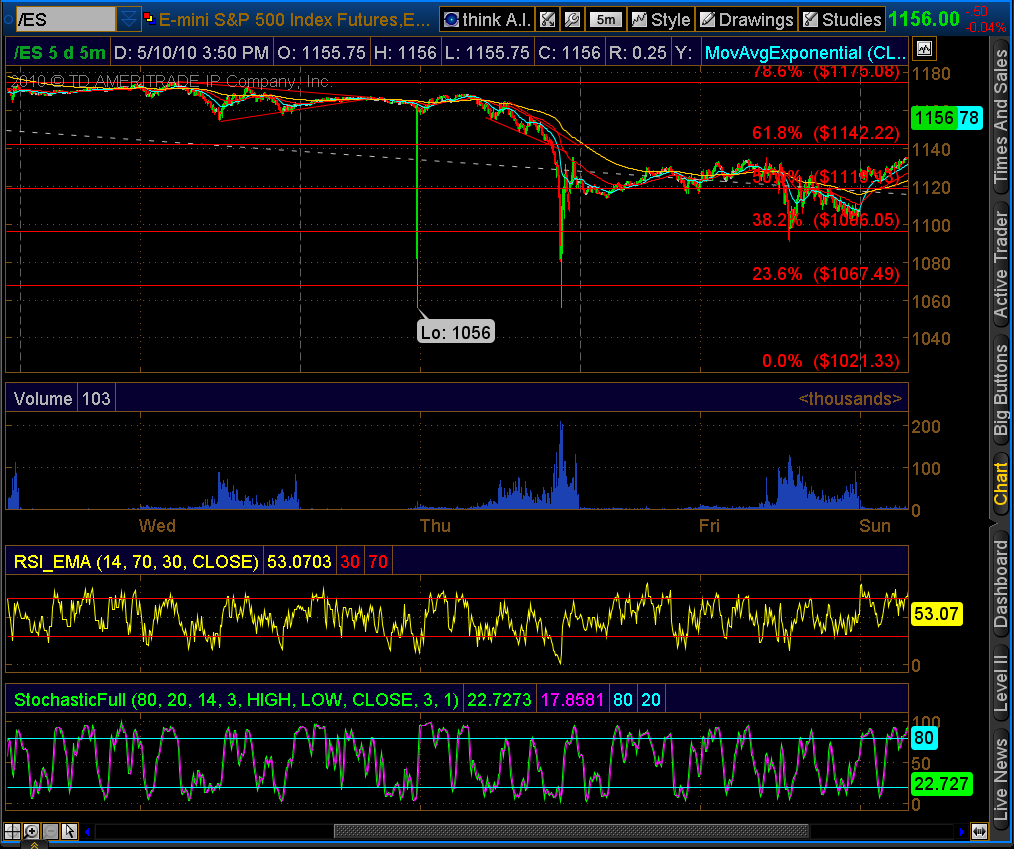
Here's another image of it on the one minute chart. You'll notice that 1056 broken down in numerology is 111, as you'll add the 5+6 to get 11, then put the 1 in front of it and drop the zero. The market dropped to almost that 1056 level the next day on May 6th, 2010 before bottoming and reversing back up hard and fast. Clearly this was another signal to the insiders.

There are many numbers used in the elites' numerology but 11, 22, 33, 322, 23, 666, and 911 are favorites I've noticed. They mix and match them and show them in television shows and movies. It's not easy to figure them out, especially for an outsider, but I do my best when I spot something of interest to note it and use it with other stuff to "try" and figure out where the market is going next.

Moving on to the current market and the "possible" near term moves...

On January 26th, 2018 the DOW hit a high of 26,616.71... which has three "six's" in it, and only about 50 points shy of being 26,666! This was a code for those that saw it. And for those that missed it there was the 666 point drop on the DOW on Friday, February 2nd 2018... another signal to the insiders.

The day before the top in the stock market we saw crude oil futures hit a high of 66.66 on January 25th... yet another signal to those "in the know". One or two times I'd call it a coincidence, but time after time after time I'd have to call it a coded message.

You know I told you that the elite use television shows and the movies for signals as well... right? For example the movies "Inception (2010)" and "Lucy (2014)" both had scenes in them where they showed a passport with the expiration dates saying August 24th, 2015... the date of the Flash Crash. If you were a real insiders you would have shorted the market the day before that and made a ton of money. That's past history for now but I wanted to give you proof on it anyway.

Ok Red, I get the message... now what else have you got for me?

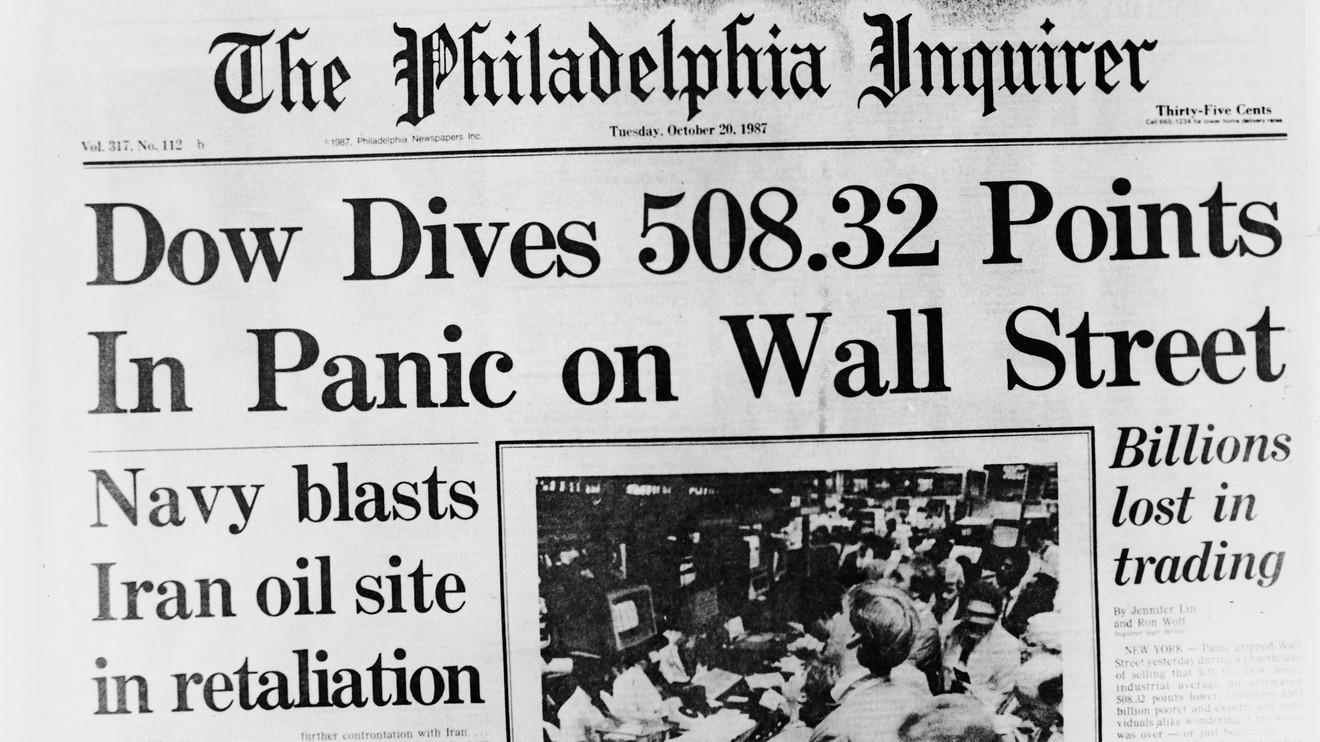
Glad you ask that as it's time to move on to what I've recently discovered that has me a little worried about the month of March. First off I have to "make note" of things the elite say via some article or news story, and one of them is by Bank of America, which we all know is one of the banks on the "inside". Late last year they put out a warning news story titled "Bank of America: Flash crash in 2018 then war to follow", which I reported on my site (https://reddragonleo.com/2017/11/29/bank-of-america-flash-crash-in-2018-then-war-to-follow/). This got me thinking about 1987 again so I decided to study it some more as it was the worst crash year of the three they mentioned (1987, 1994, and 1998), and we seem to be tracking it better right now then the other two right now.

One of the things I like to do is to use a site called "Time and Date" (http://www.timeanddate.com) to play with the numbers as I know how much they are used by the elite to foretell the future. So I go back to look at the DOW in 1987 and here is what I discovered...

  1. The TOP was on August 25th 1987 with a close of 2,722.40
  2. The LOW on the first move down was on September 8th with a close of 2,545.12 (a 252.92 drop so far or 9.2%)
  3. Time from TOP to first low was 14 calender days.
  4. The first move UP topped on September 14th with a close of 2,613.04, which was a "lower high" and about a 55.6% retracement or so. (I'm not counting 9/1/87 as I'm looking for multiday bounce moves, not a half day or one day fast bounce that gets reversed thereafter)
  5. From the first low to that first rally high it took 6 calendar days, and 20 days from the TOP.
  6. Next the market dropped to a "lower low" of 2,468.99 on September 22nd before reversing hard that day to start the next move up. (a 277.71 drop so far or 10.1%)
  7. From that last high down to that new lower low took 8 calendar days and is 28 days in total from the TOP.
  8. The second rally UP topped on October 2nd with a high of 2,662.30, which was about a 70% move up from the second lower low and was a little higher then the first move UP was.
  9. This move up from the LOW took 10 calendar days and is now 38 days from the TOP.
  10. From that second rally high the market started down slowly and then faster until it crashed on October 19th and put in a slight lower low on the 20th before rallying back up hard to end the entire move down.
  11. That move down took 17 calendar days to make the entire move from the all time TOP high a 55 day pattern move with the intraday low the next day at 1,616.20 for a total drop of about 40% or so.

Now let's look at today's recent high to compare...

  1. The DOW topped on January 26th, 2018 with a high of 26,616.71
  2. It then fell to hit an intraday low of 23,360.29 on February 2nd, 2018 (a 3,256.42 point drop so far or 12.2%)
  3. From the TOP to the first low was 14 calendar days.
  4. The first move UP topped on February 16th with an intraday high of 25,432.42, a 2,072.13 point retracement, which is about a 63.6% so far... (I'm not counting 2/6/18 as I'm looking for multiday bounce moves, not a half day or one day fast bounce that gets reversed thereafter)
  5. From the first low to that first rally high it took 7 calendar days, and 21 days from the TOP.

So far the highs to lows are tracking fairly close... time wise I mean. I wouldn't expect them to be exact but to resemble each other a little if the same thing is going to happen in March of 2018 as it did in October of 1987? While I hope I'm completely wrong on this and that we DO NOT Crash I have to follow this pattern closely... and if it continues we should have a move down next week that about 8 days and puts us around day 28 from the January 26th all time high. The 28 day mark points to February 23rd, 2018 while the 8 down days from the bounce high is yet to be known as we could go a little higher Tuesday morning, or have topped on Friday?

While in 1987 the first drop was 14 days and in 2018 the first drop was also 14 days the move up in 1987 was 6 days and if we topped on Friday then it was 7 days up... a slight difference, but one that I'd expect to see so they wouldn't be too obvious.

In 1987 it the market was setting up a nice looking "Inverted Head and Shoulders" pattern with the first low being the "left shoulder" the lower low being the "head" and the slow move down that started the crash move being the "right shoulder"... that is, until it FAILED and made a lower low then the "head" of the pattern. That move down all started from the last important high on day 38 from the top. If you compare that to today it will point to March 5th being the last high (should be higher then this current rally but lower then the all time high) before the 17 day drop into the crash low. In total the 1987 crash took 55 calendar days and the 1929 crash took 56 days... very close if you ask me.

So where does this all lead us to today and is it really that close to suggest the same will happen again?

Normally I say that there's low odds of this happening again, but all those additional clues via codes with numbers and Bank of America waring of a crash has me very concerned. Then there's this... and I mean THIS! Yeah, it's a biggy that just can't be a random coincidence. I'm talking about how many days it is from the August 25th, 1987 high to the January 26th, 2018 high. If you don't count August 25th and start counting the day afterwards you'll get a total of 11,111 days from that top in 1987 to the top in 2018! Tell me that's just a coincidence and I'll sell you some oceanfront property in Kansas!

Now look, I hope I'm totally wrong on this but there's a lot of "code's" popping up in the numbers here that just shouldn't be ignored. You have a top on crude oil of 66.66, the DOW have a 666 point drop, 11,111 days from top to top, and if you breakdown the high in the SPX of 2872.87 you could say it looks like a code for 1987! Just add the 2+8 to make 10, drop the zero... then the 7+2 is 9, so you have a 1 and a 9 so far with a .87 left. Yeah, it's reaching and not really numerology but with all the other codes too this one could mean 1987.

However, in all fairness I haven't had time to compare today to 1994 or 1998 as I just don't have the time right now... and it's tracking 1987 fairly well right now. So I'm looking for some differences to appear between the current market and that in 1987, and that could be something as simple as a "higher low" setting up on the next move down next week instead of a lower low like on 9/22/1987... then another strong rally up that goes a little higher then this current bounce rally high. Maybe it takes a little longer to top and passes the 38 day mark of March 5th? It's at that point I'd be quite worried as the next 17 days the bulls will be sweating bullets time stamped 1929 and 1987! If the market can get through March without crashing I'll be a happy camper as I have other investments I'm in that really need a bull market or sideways choppy one to do well. A crash of that magnitude will be bad for everyone. But if it happens we could see some massive buying opportunities show up as inflation will surely follow... plus a war if Bank of America is correct.

If your head is spinning now... join the crowd!

There are just too many strange patterns, numbers and codes to completely refuse to believe that the market can crash in March. While I'm not a fortune teller and can NOT tell you for 100% sure that the market is going to crash I feel I needed to inform everyone of these information. You can make your own judgement on it and trade accordingly. I've never actually met anyone who called a crash in advance and successfully traded it. I hope I'm completely wrong on it and that we end up following some pattern in 1994 or 1998, but so far we are tracking 1987 the best I believe. I encourage you to study the other years and see what you come up with. The high in 1994 was on January 31st and it is 8761 days until the January 26th, 2018 high... not any ritual number that I'm aware of? The high in 1998 was July 20th and it is 7130 days from our recent high... again, not any codes there.

Anyway, make of it what you will. It's my first weekend update and video in a very long time. I felt it was of importance and should be shared with as many real people as possible. Share with your friends but please don't copy the video and text to repost publicly as that just leads to SkyNet reading it and getting too much exposure, which could change the outcome for the good or bad? If you have questions or comments feel free to stop in the chatroom. There's only a few of us and we don't chat all day. However it's a good group of people and fun to hang out with when the market stresses you out.

Good luck to us all this coming March...

Red
[/protect]

Is 2018 Setting Up A Stock Market Crash Or Inflationary Based Mega Rally?

0

February 18th 2018

A Strange Pattern Is Developing and so far I don't see anyone talking about it...

It's been over a year, maybe several years, since I've done a weekend post and video but I feel compelled to share what I've discovered recently. It's something I hope doesn't play out but so far is tracking out day to day almost perfectly.

Of course there are just as many diehard bears out there that are still calling for a stock market crash today, tomorrow, or soon... just like they have been for many years now. And there's the mega-bulls that are looking for the DOW to hit 100,000 or some crazy number. Which one is right, or are they both right? So far the crash callers have been wrong time after time as the market just keeps on going up and up and up.

The market has changed a lot in the last 18 years I believe with computer algorithms making up 84% of the trading each day, and with the Fed's injecting trillions of dollars into the system with one Quantitative Easing program after another to keep the market going up. That's at least until recently as they are now slowly rising interest rates and attempting to reverse the money injection, which some say caused the recent 10.8% drop in late January into February.

Others say that it was caused because Jerome Powell replaced Janet Yellen as the new Federal Reserve Chairman and the deep state that runs the stock market didn't like it... therefore they decided to tank the market to punish Trump for his decision. Some say he isn't Jewish as well and that the deep state always put a Jew in office as they are "one of them" and can be controlled. I don't know what to believe about that issue but certainly the market was super overbought from a technical point of view and needed to pullback anyway. The timing of it was and still is suspicious.

Anyway, what I have to show you deals with "codes" and "numerology" that the deep state (the elite, illuminati, cabal, skull and bones society, free masons, or whatever name they hide under?), use to tell their buddies on the inside what's going to happen next in the market. Now a true member (which I'm NOT) could read these codes perfectly and know exactly what's coming next, when it's coming, and when it ends... but I have to just guess at it and use the knowledge I've discovered over the last 9 years while writing this blog.

So, with that preface I must add that there is a super computer "AI" (artificial intelligence... I call it "SkyNet" from the Terminator movie) that reads every post, page, blog, website, tweet, chat, etc... on the internet and if certain things are said that "they" (the elite) don't like then it tends to get no traffic or worst the site gets attacked by "bot's" to slow it down to a point that no one can get it to load where they can read. In fact, SkyNet even watches youtube video's and converts them from speech to text so it can decide again if it gets traffic exposure or not.

Therefore I have to be careful on exposing this information to SkyNet as I only want to help a few fellow traders by giving them what I've discovered so they can be on the look out for it and not get caught on the wrong side of the trade should this actually happen? In order to keep this information away from SkyNet reading it I've decided to password protect it and require a real person to login to my site to get access to the password so they can read it. I apologize to those of you who think is too much trouble but I really must keep this information only in the hands of real people and NOT spread over the internet where SkyNet can read it easily. So I ask you NOT to copy the text or the video and repost it on the internet. It's free to view for all, so that's not too much to ask of you I think. I'm also putting the video up on Wistia instead of Youtube so hopefully it goes unnoticed by SkyNet.

To read the rest of this post and view the video you must create a new account and login to get access to the passworded page... which is located here:

Is 2018 Setting Up A Stock Market Crash Or Inflationary Based Mega Rally-Part 2

https://reddragonleo.com/2018/02/19/is-2018-setting-up-a-stock-market-crash-or-inflationary-based-mega-rally-part-2/

The password is: 1987


ES Morning Update February 16th 2018

0

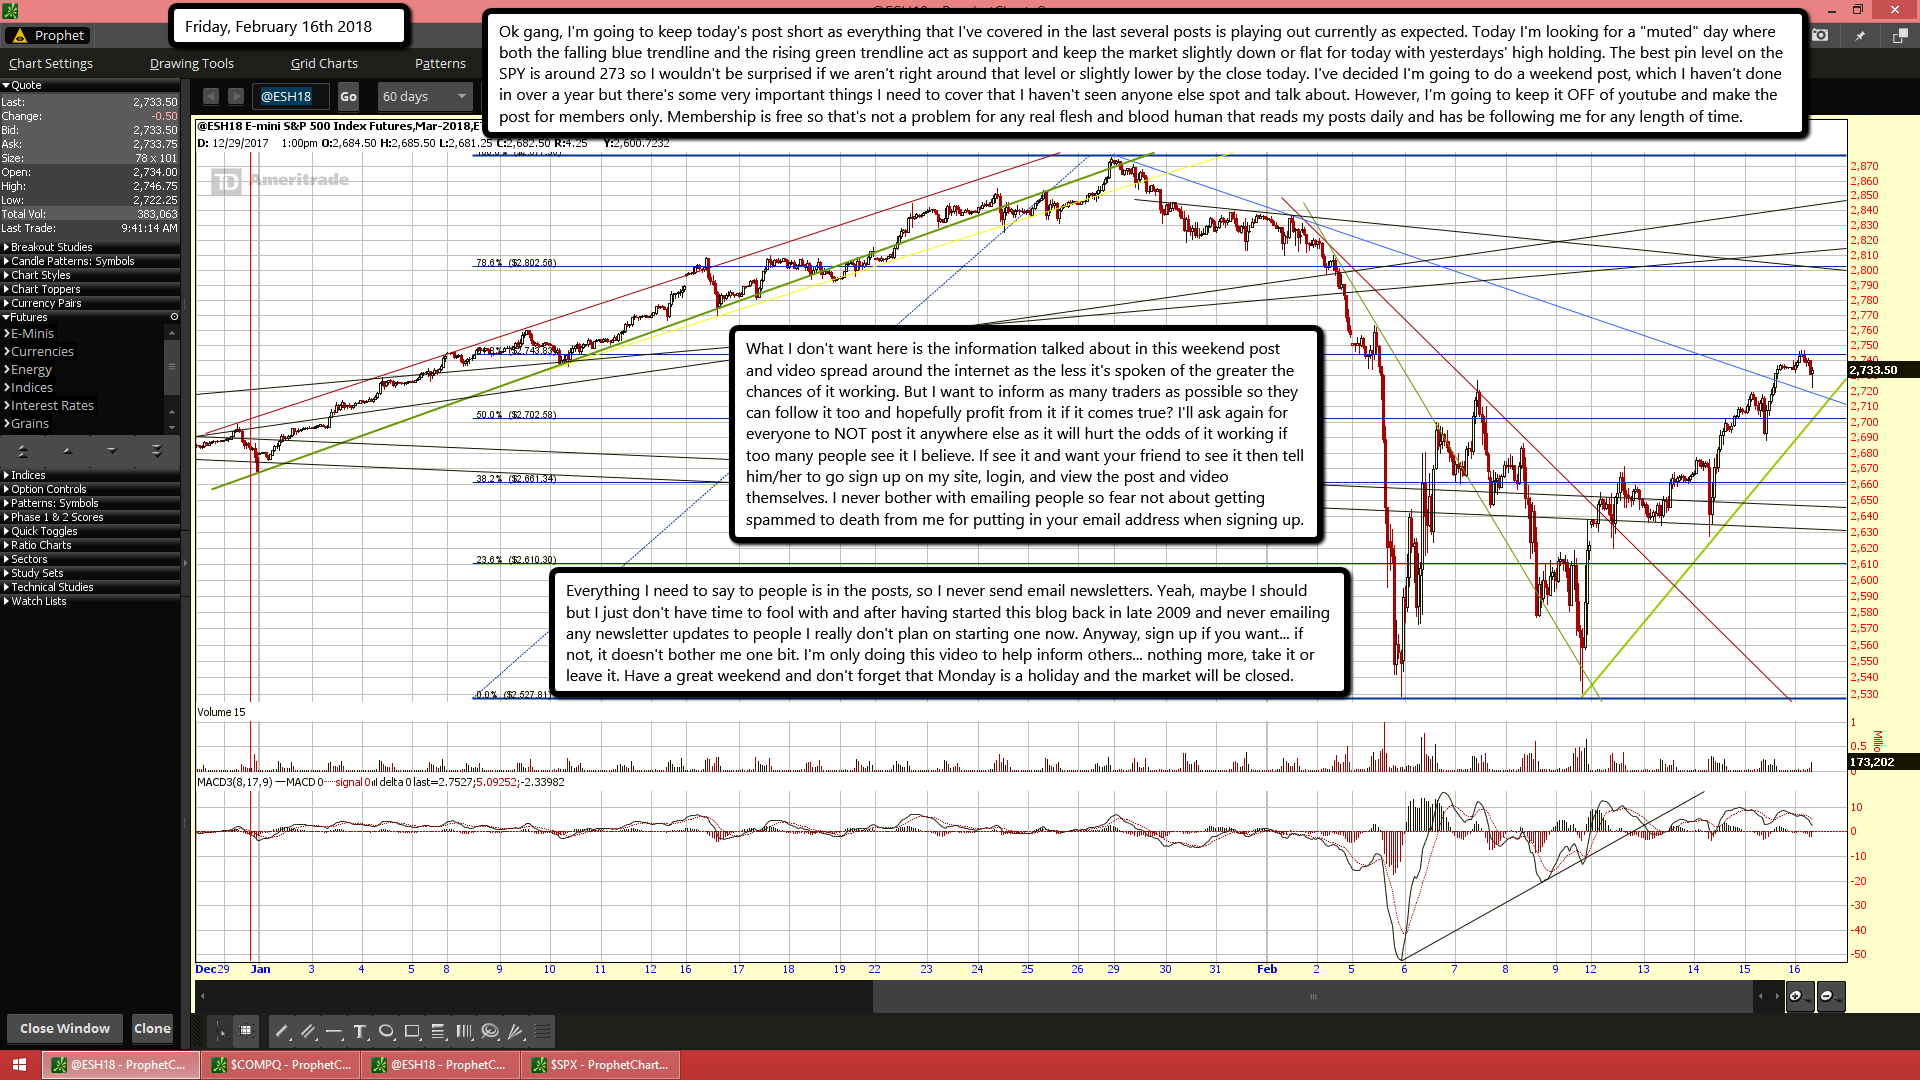
Ok gang, I'm going to keep today's post short as everything that I've covered in the last several posts is playing out currently as expected. Today I'm looking for a "muted" day where both the falling blue trendline and the rising green trendline act as support and keep the market slightly down or flat for today with yesterdays' high holding. The best pin level on the SPY is around 273 so I wouldn't be surprised if we aren't right around that level or slightly lower by the close today. I've decided I'm going to do a weekend post, which I haven't done in over a year but there's some very important things I need to cover that I haven't seen anyone else spot and talk about. However, I'm going to keep it OFF of youtube and make the post for members only. Membership is free so that's not a problem for any real flesh and blood human that reads my posts daily and has be following me for any length of time.

What I don't want here is the information talked about in this weekend post and video spread around the internet as the less it's spoken of the greater the chances of it working. But I want to inform as many traders as possible so they can follow it too and hopefully profit from it if it comes true? I'll ask again for everyone to NOT post it anywhere else as it will hurt the odds of it working if too many people see it I believe. If see it and want your friend to see it then tell him/her to go sign up on my site, login, and view the post and video themselves. I never bother with emailing people so fear not about getting spammed to death from me for putting in your email address when signing up.

Everything I need to say to people is in the posts, so I never send email newsletters. Yeah, maybe I should but I just don't have time to fool with and after having started this blog back in late 2009 and never emailing any newsletter updates to people I really don't plan on starting one now. Anyway, sign up if you want... if not, it doesn't bother me one bit. I'm only doing this video to help inform others... nothing more, take it or leave it. Have a great weekend and don't forget that Monday is a holiday and the market will be closed.

ES Morning Update February 15th 2018

0

Nice move up again this morning I see. It's now acting like a wave 3 to me, so if we can pullback small around the open for a wave 4 down, then back up into the close for a wave 5 up then we should complete all 5 waves inside this C wave up and end this rally. Now... with that said, I don't see a huge drop on Friday. It's likely to pin at some level that makes the most options expire worthless so the market makers can keep the most money. The max pain site says that at 273 on the SPY or around 2730 for the futures and SPX. What might happen is that we only do the wave 4 down today and push out that wave 5 up until tomorrow... which would still be fine I think with my current forecast on the market for next month.

Anyway, I'll keep today's post short and sweet. I'm looking for a wave 4 down at some point today, which should be smaller then the wave 2 down, and I think it was the move down from the 2/12 high of 2655.00 to the 2620.00 low on the same day. From there the wave 3 up started (still inside the larger C wave up) and subdivided into 5 smaller waves... which I think this move up from yesterdays' low to this morning's high was the 5th wave inside that wave 3 up. Anyway, I just want to see a small wave 4 down and 5 up today or tomorrow to end this larger C wave up from the 2530.25 low on 2/9. Next week we should start back down again if everything is still on track, but it should be choppy and not easy to figure out the direction each day. This is the period where it shakes out both bulls and bears. No new high should be put in next week as the high for this rally should be today or tomorrow... that's "if" this all plays out like I think it will?

ES Morning Update February 14th 2018

0

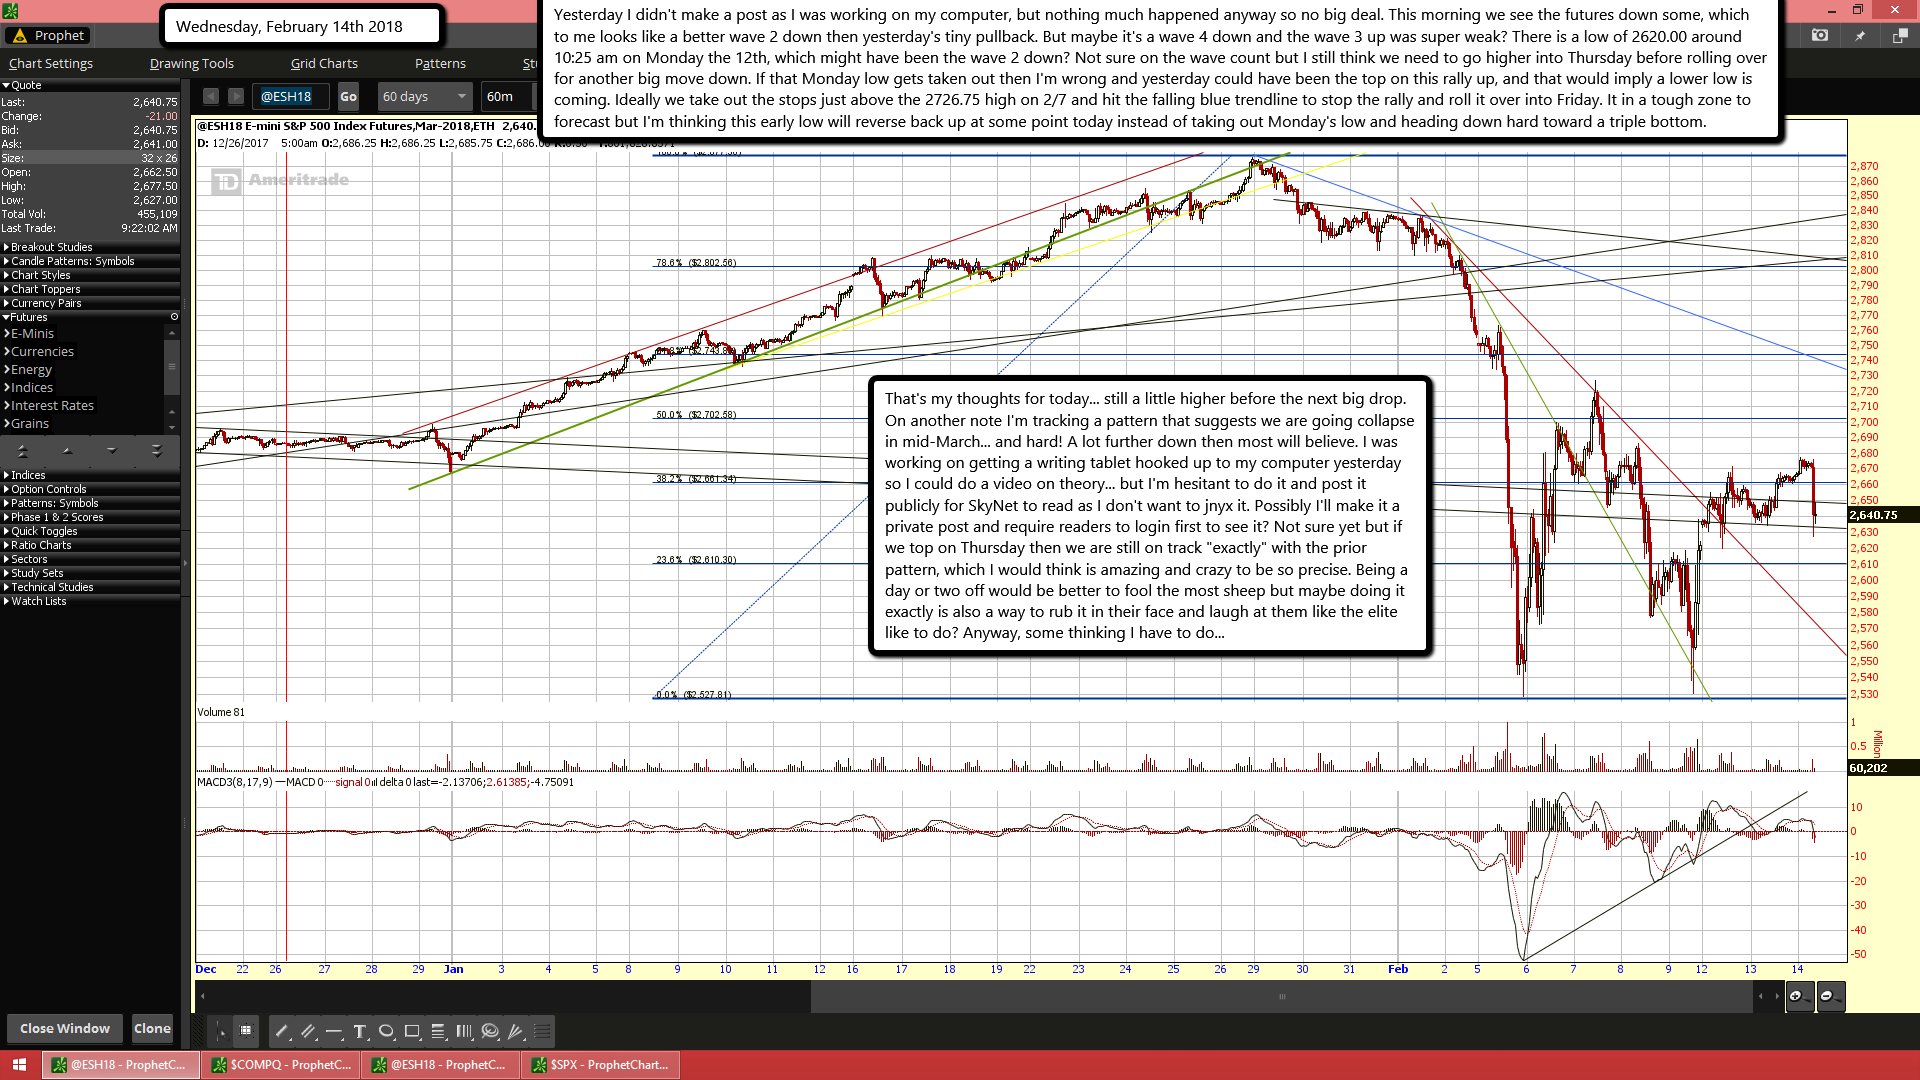
Yesterday I didn't make a post as I was working on my computer, but nothing much happened anyway so no big deal. This morning we see the futures down some, which to me looks like a better wave 2 down then yesterday's tiny pullback. But maybe it's a wave 4 down and the wave 3 up was super weak? There is a low of 2620.00 around 10:25 am on Monday the 12th, which might have been the wave 2 down? Not sure on the wave count but I still think we need to go higher into Thursday before rolling over for another big move down. If that Monday low gets taken out then I'm wrong and yesterday could have been the top on this rally up, and that would imply a lower low is coming. Ideally we take out the stops just above the 2726.75 high on 2/7 and hit the falling blue trendline to stop the rally and roll it over into Friday. It in a tough zone to forecast but I'm thinking this early low will reverse back up at some point today instead of taking out Monday's low and heading down hard toward a triple bottom.

That's my thoughts for today... still a little higher before the next big drop. On another note I'm tracking a pattern that suggests we are going collapse in mid-March... and hard! A lot further down then most will believe. I was working on getting a writing tablet hooked up to my computer yesterday so I could do a video on theory... but I'm hesitant to do it and post it publicly for SkyNet to read as I don't want to jnyx it. Possibly I'll make it a private post and require readers to login first to see it? Not sure yet but if we top on Thursday then we are still on track "exactly" with the prior pattern, which I would think is amazing and crazy to be so precise. Being a day or two off would be better to fool the most sheep but maybe doing it exactly is also a way to rub it in their face and laugh at them like the elite like to do? Anyway, some thinking I have to do...

Goldman Sachs: Get ready for most cryptocurrencies to hit zero

0

The tumble in cryptocurrencies that erased nearly $US500 billion of market value over the past month could get a lot worse, according to Goldman Sachs's global head of investment research.

Most digital currencies are unlikely to survive in their current form, and investors should prepare for coins to lose all their value as they're replaced by future competitors, Goldman's Steve Strongin said in a report this week. While he didn't posit a timeframe for losses in existing coins, he said recent price swings indicated a bubble and that the tendency for different coins to move in lockstep wasn't rational.

"The high correlation between the different cryptocurrencies worries me," Strongin said. "Because of the lack of intrinsic value, the currencies that don't survive will most likely trade to zero."

Today's digital coins lack long-term staying power because of slow transaction times, security challenges and high maintenance costs, according to Strongin.

He said the introduction of regulated bitcoin futures hasn't addressed those concerns and he dismissed the idea of a first-mover advantage -- noting that few of internet bubble's high fliers survived after the late 1990s.

"Are any of today's cryptocurrencies going to be an Amazon or a Google, or will they end up like many of the now-defunct search engines?," Strongin wrote.

"Just because we are in a speculative bubble does not mean current prices can't increase for a handful of survivors," he said. "At the same time, it probably does mean that most, if not all, will never see their recent peaks again."

Strongin was more upbeat about the blockchain technology that underlies digital currencies, saying it could help improve financial ledgers. But even there he sounded a note of caution, arguing that current technology doesn't yet offer the speed required for market transactions.


Isn't it funny how the crypto world was started around the bottom of the 2009 stock market crash low and promoted as a way to get free of the Federal Reserves "fiat" money system and now that every sheep has put their money into it the same guys promoting it are now likely behind crashing it.

Why is that?

I personally think it was the "backdoor" way to introduce a cashless society to the sheep so they would accept it willingly thinking they were free of the criminal cartel running the system only to find out that the thing they feared most (the theft of their physical cash through taxes and mass money printing to devalue it) has be replaced with digits locked up in some computer algorithm that doesn't allow them to access it easily without time delays and fee's... which by the time they get it converted back to cash the price of it has crashed!

Either way they are screwed as having digits locked up in some algorithm is scary as hell to me as if you lose the key you have totally lost all your money.  That doesn't include the huge moves up and down in value it has every day!  To me it's EXACT what the elite wanted in the first place.... a "cashless" society.

The next step is to get rid of all the independent crypto's and replace them with one they control and is backed by something like SDR's (special drawing rights).  I did a post sometime back about Goldman Sachs stating that they are going to do their own crypto currency at some point... whether they do it or some one else the next move by the elite will be to destroy the freely traded and non-regulated or controlled crypto's and replace them with something under their thumb.

Red

ES Morning Update February 12th 2018

0

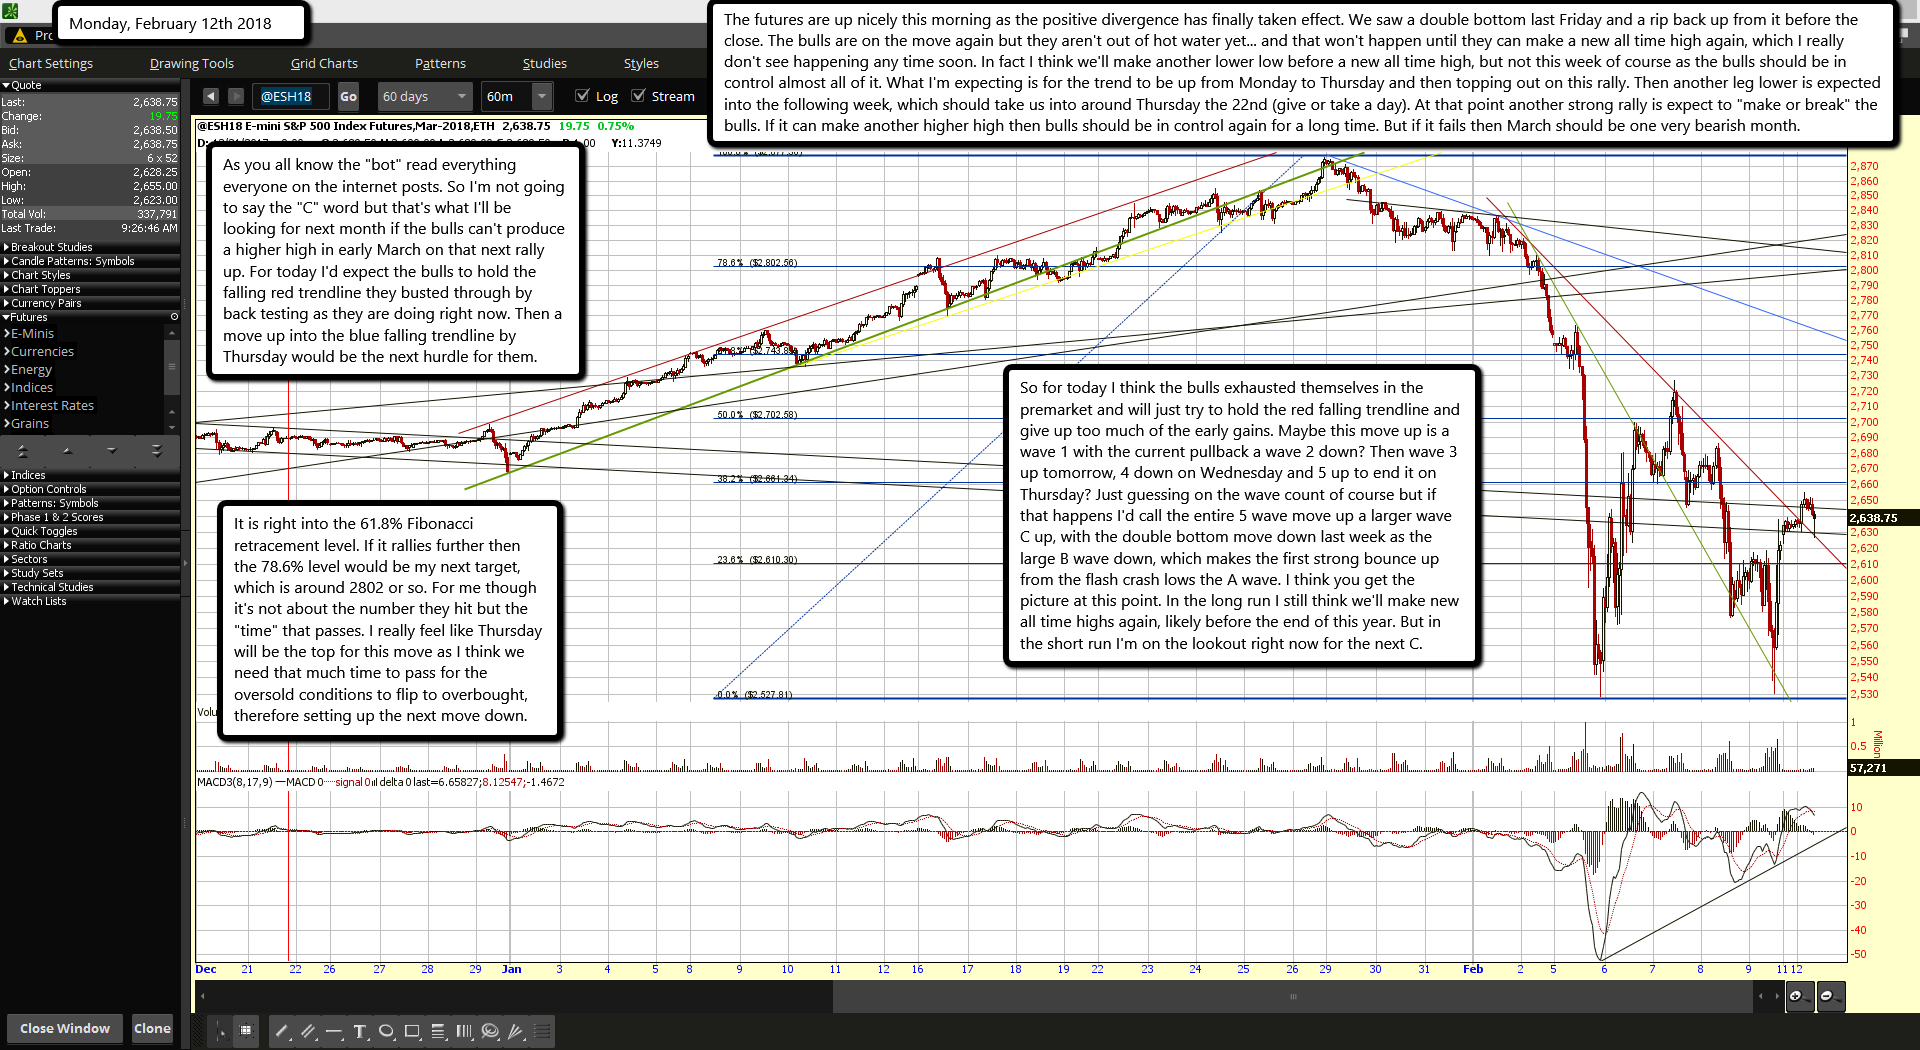
The futures are up nicely this morning as the positive divergence has finally taken effect. We saw a double bottom last Friday and a rip back up from it before the close. The bulls are on the move again but they aren't out of hot water yet... and that won't happen until they can make a new all time high again, which I really don't see happening any time soon. In fact I think we'll make another lower low before a new all time high, but not this week of course as the bulls should be in control almost all of it. What I'm expecting is for the trend to be up from Monday to Thursday and then topping out on this rally. Then another leg lower is expected into the following week, which should take us into around Thursday the 22nd (give or take a day). At that point another strong rally is expect to "make or break" the bulls. If it can make another higher high then bulls should be in control again for a long time. But if it fails then March should be one very bearish month.

As you all know the "bot" read everything everyone on the internet posts. So I'm not going to say the "C" word but that's what I'll be looking for next month if the bulls can't produce a higher high in early March on that next rally up. For today I'd expect the bulls to hold the falling red trendline they busted through by back testing as they are doing right now. Then a move up into the blue falling trendline by Thursday would be the next hurdle for them.

It is right into the 61.8% Fibonacci retracement level. If it rallies further then the 78.6% level would be my next target, which is around 2802 or so. For me though it's not about the number they hit but the "time" that passes. I really feel like Thursday will be the top for this move as I think we need that much time to pass for the oversold conditions to flip to overbought, therefore setting up the next move down.

So for today I think the bulls exhausted themselves in the premarket and will just try to hold the red falling trendline and give up too much of the early gains. Maybe this move up is a wave 1 with the current pullback a wave 2 down? Then wave 3 up tomorrow, 4 down on Wednesday and 5 up to end it on Thursday? Just guessing on the wave count of course but if that happens I'd call the entire 5 wave move up a larger wave C up, with the double bottom move down last week as the large B wave down, which makes the first strong bounce up from the flash crash lows the A wave. I think you get the picture at this point. In the long run I still think we'll make new all time highs again, likely before the end of this year. But in the short run I'm on the lookout right now for the next C.

ES Morning Update February 9th 2018

0

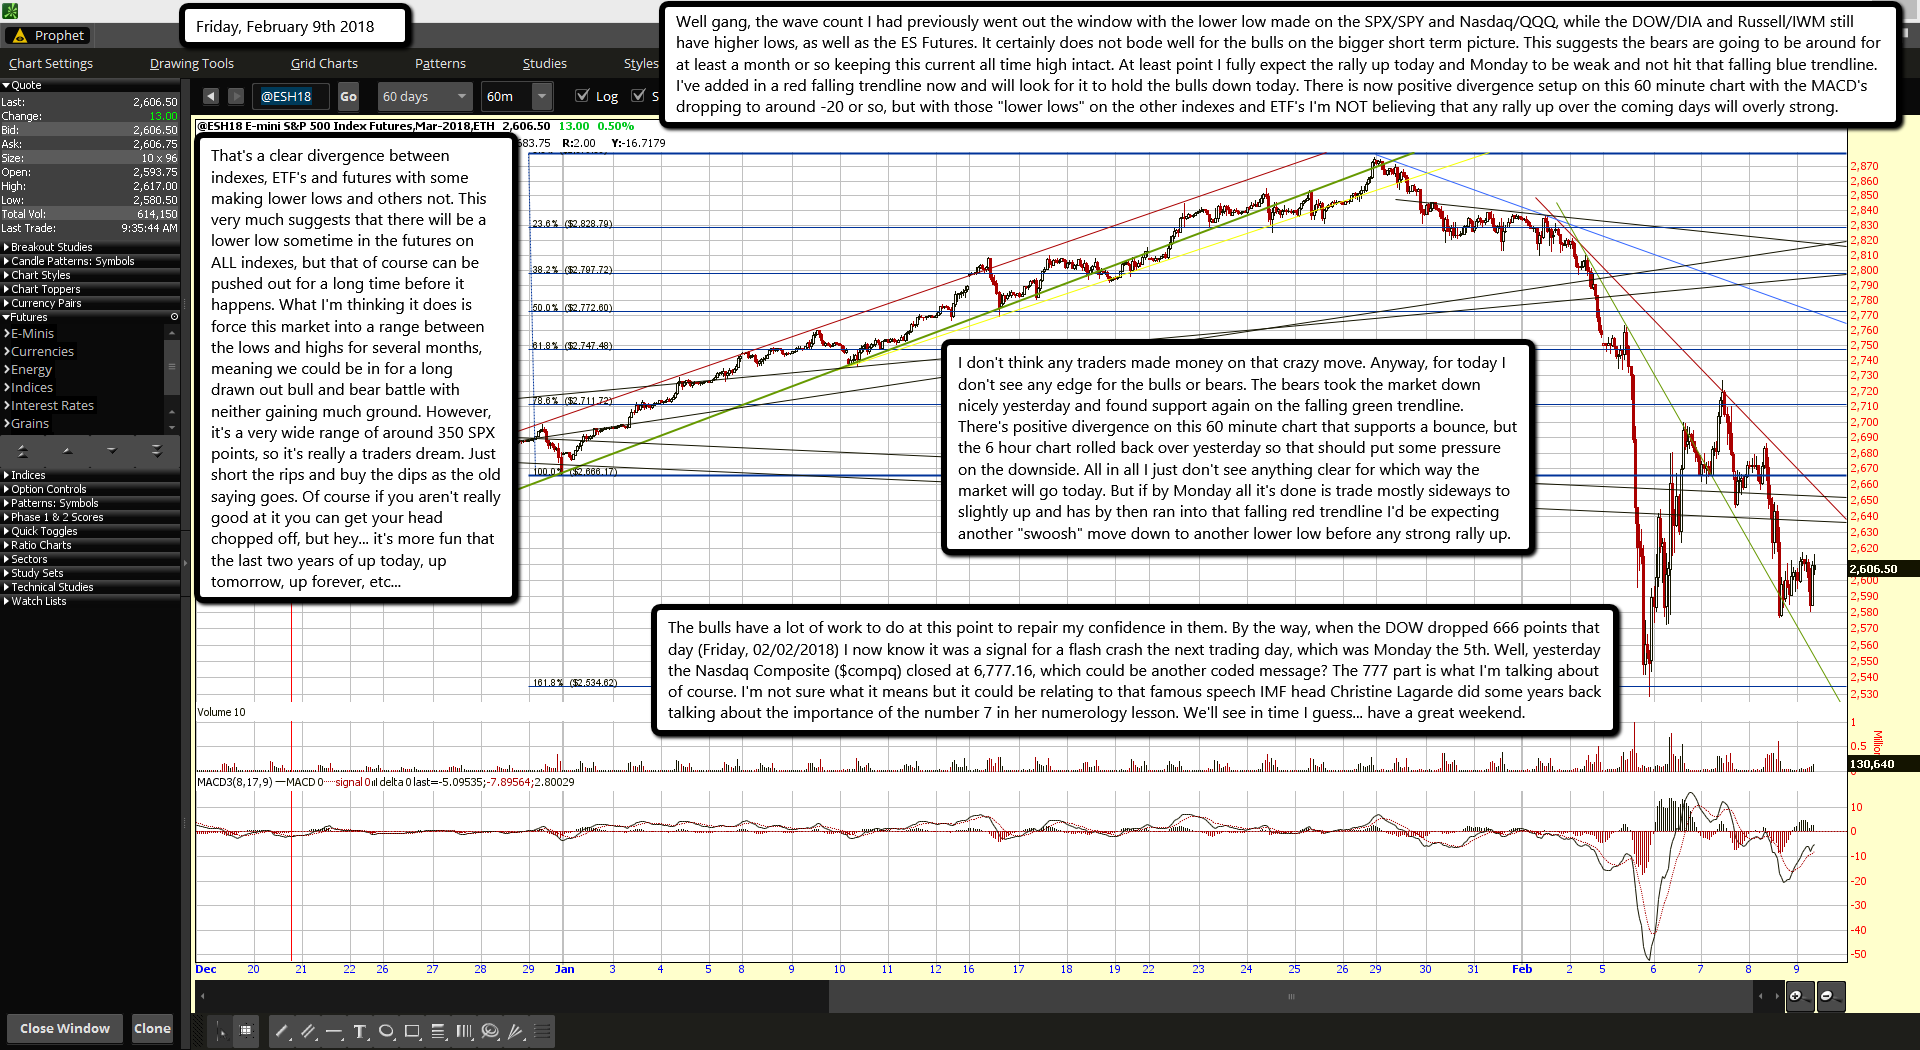
Well gang, the wave count I had previously went out the window with the lower low made on the SPX/SPY and Nasdaq/QQQ, while the DOW/DIA and Russell/IWM still have higher lows, as well as the ES Futures. It certainly does not bode well for the bulls on the bigger short term picture. This suggests the bears are going to be around for at least a month or so keeping this current all time high intact. At least point I fully expect the rally up today and Monday to be weak and not hit that falling blue trendline. I've added in a red falling trendline now and will look for it to hold the bulls down today. There is now positive divergence setup on this 60 minute chart with the MACD's dropping to around -20 or so, but with those "lower lows" on the other indexes and ETF's I'm NOT believing that any rally up over the coming days will overly strong.

That's a clear divergence between indexes, ETF's and futures with some making lower lows and others not. This very much suggests that there will be a lower low sometime in the futures on ALL indexes, but that of course can be pushed out for a long time before it happens. What I'm thinking it does is force this market into a range between the lows and highs for several months, meaning we could be in for a long drawn out bull and bear battle with neither gaining much ground. However, it's a very wide range of around 350 SPX points, so it's really a traders dream. Just short the rips and buy the dips as the old saying goes. Of course if you aren't really good at it you can get your head chopped off, but hey... it's more fun that the last two years of up today, up tomorrow, up forever, etc...

I don't think any traders made money on that crazy move. Anyway, for today I don't see any edge for the bulls or bears. The bears took the market down nicely yesterday and found support again on the falling green trendline. There's positive divergence on this 60 minute chart that supports a bounce, but the 6 hour chart rolled back over yesterday so that should put some pressure on the downside. All in all I just don't see anything clear for which way the market will go today. But if by Monday all it's done is trade mostly sideways to slightly up and has by then ran into that falling red trendline I'd be expecting another "swoosh" move down to another lower low before any strong rally up.

The bulls have a lot of work to do at this point to repair my confidence in them. By the way, when the DOW dropped 666 points that day (Friday, 02/02/2018) I now know it was a signal for a flash crash the next trading day, which was Monday the 5th. Well, yesterday the Nasdaq Composite ($compq) closed at 6,777.16, which could be another coded message? The 777 part is what I'm talking about of course. I'm not sure what it means but it could be relating to that famous speech IMF head Christine Lagarde did some years back talking about the importance of the number 7 in her numerology lesson. We'll see in time I guess... have a great weekend.

ES Morning Update February 8th 2018

0

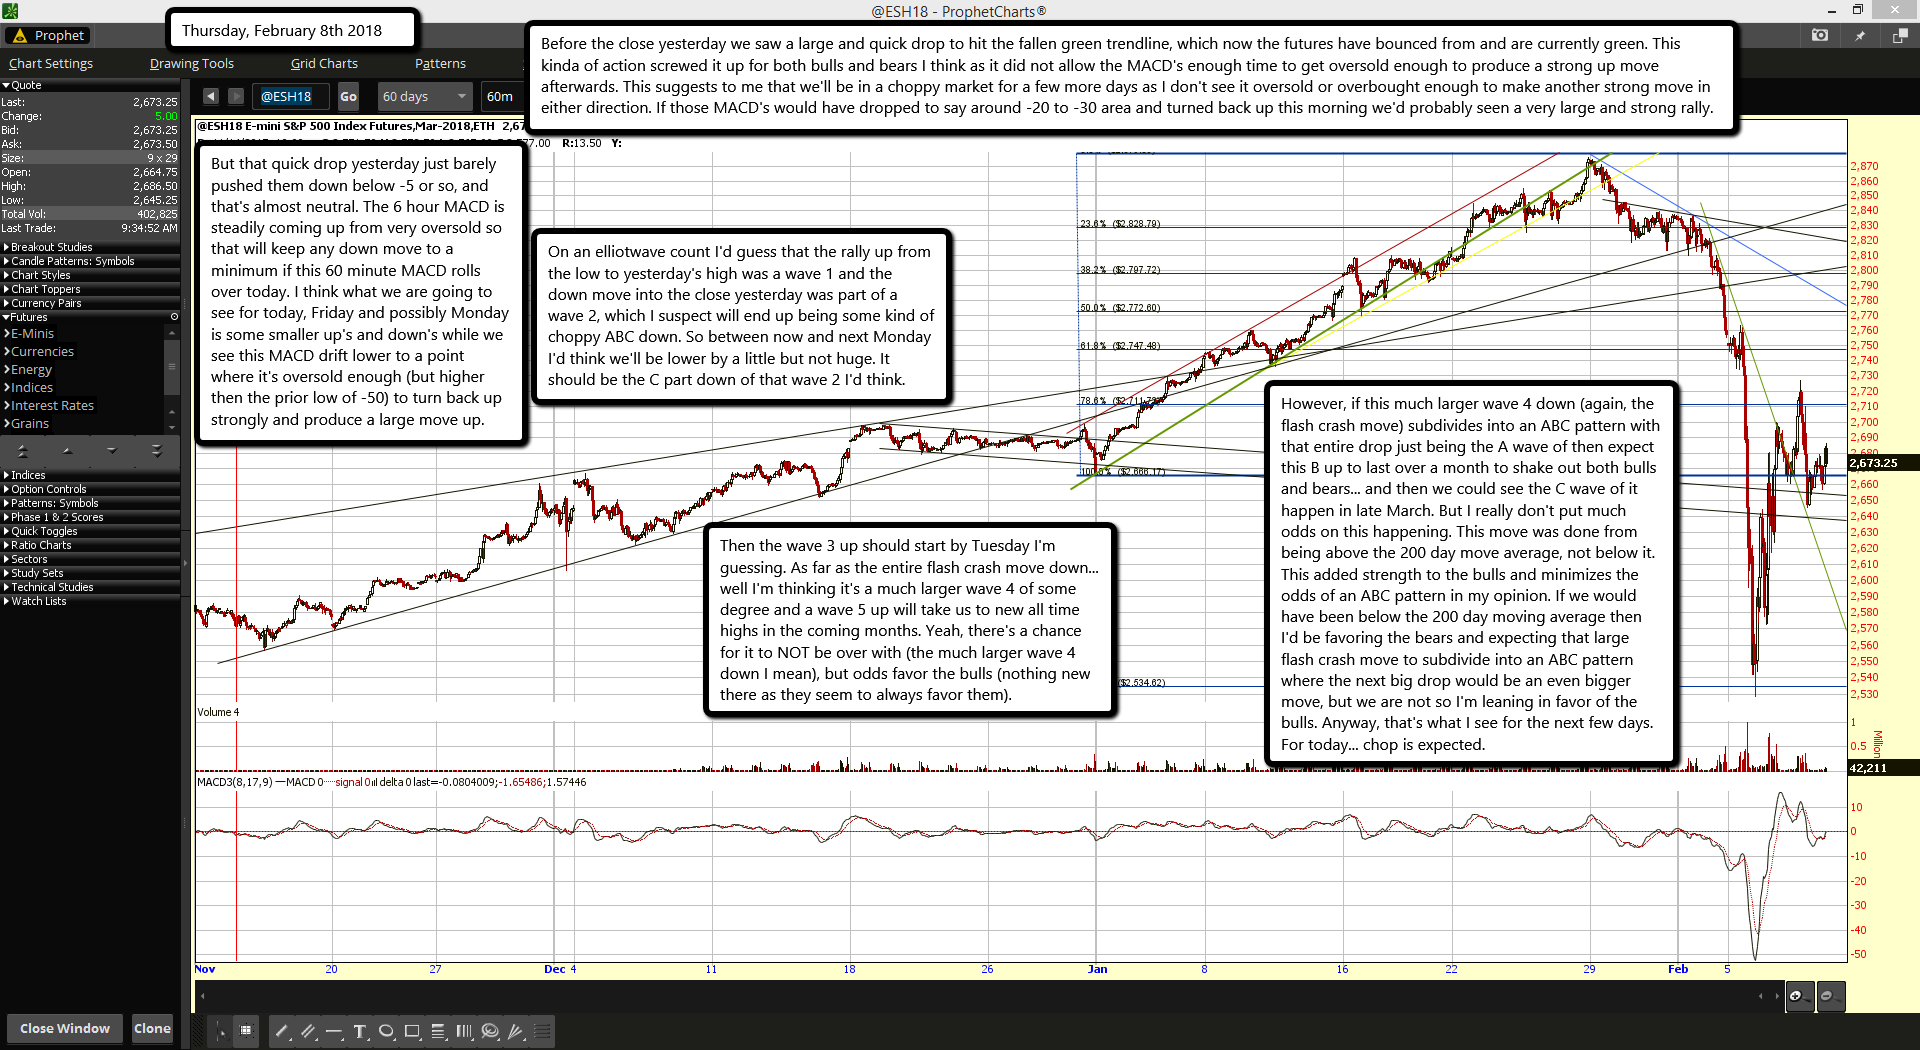
Before the close yesterday we saw a large and quick drop to hit the fallen green trendline, which now the futures have bounced from and are currently green. This kinda of action screwed it up for both bulls and bears I think as it did not allow the MACD's enough time to get oversold enough to produce a strong up move afterwards. This suggests to me that we'll be in a choppy market for a few more days as I don't see it oversold or overbought enough to make another strong move in either direction. If those MACD's would have dropped to say around -20 to -30 area and turned back up this morning we'd probably seen a very large and strong rally.

But that quick drop yesterday just barely pushed them down below -5 or so, and that's almost neutral. The 6 hour MACD is steadily coming up from very oversold so that will keep any down move to a minimum if this 60 minute MACD rolls over today. I think what we are going to see for today, Friday and possibly Monday is some smaller up's and down's while we see this MACD drift lower to a point where it's oversold enough (but higher then the prior low of -50) to turn back up strongly and produce a large move up.

On an elliotwave count I'd guess that the rally up from the low to yesterday's high was a wave 1 and the down move into the close yesterday was part of a wave 2, which I suspect will end up being some kind of choppy ABC down. So between now and next Monday I'd think we'll be lower by a little but not huge. It should be the C part down of that wave 2 I'd think.

Then the wave 3 up should start by Tuesday I'm guessing. As far as the entire flash crash move down... well I'm thinking it's a much larger wave 4 of some degree and a wave 5 up will take us to new all time highs in the coming months. Yeah, there's a chance for it to NOT be over with (the much larger wave 4 down I mean), but odds favor the bulls (nothing new there as they seem to always favor them).

However, if this much larger wave 4 down (again, the flash crash move) subdivides into an ABC pattern with that entire drop just being the A wave of then expect this B up to last over a month to shake out both bulls and bears... and then we could see the C wave of it happen in late March. But I really don't put much odds on this happening. This move was done from being above the 200 day move average, not below it. This added strength to the bulls and minimizes the odds of an ABC pattern in my opinion. If we would have been below the 200 day moving average then I'd be favoring the bears and expecting that large flash crash move to subdivide into an ABC pattern where the next big drop would be an even bigger move, but we are not so I'm leaning in favor of the bulls. Anyway, that's what I see for the next few days. For today... chop is expected.

ES Morning Update February 7th 2018

0

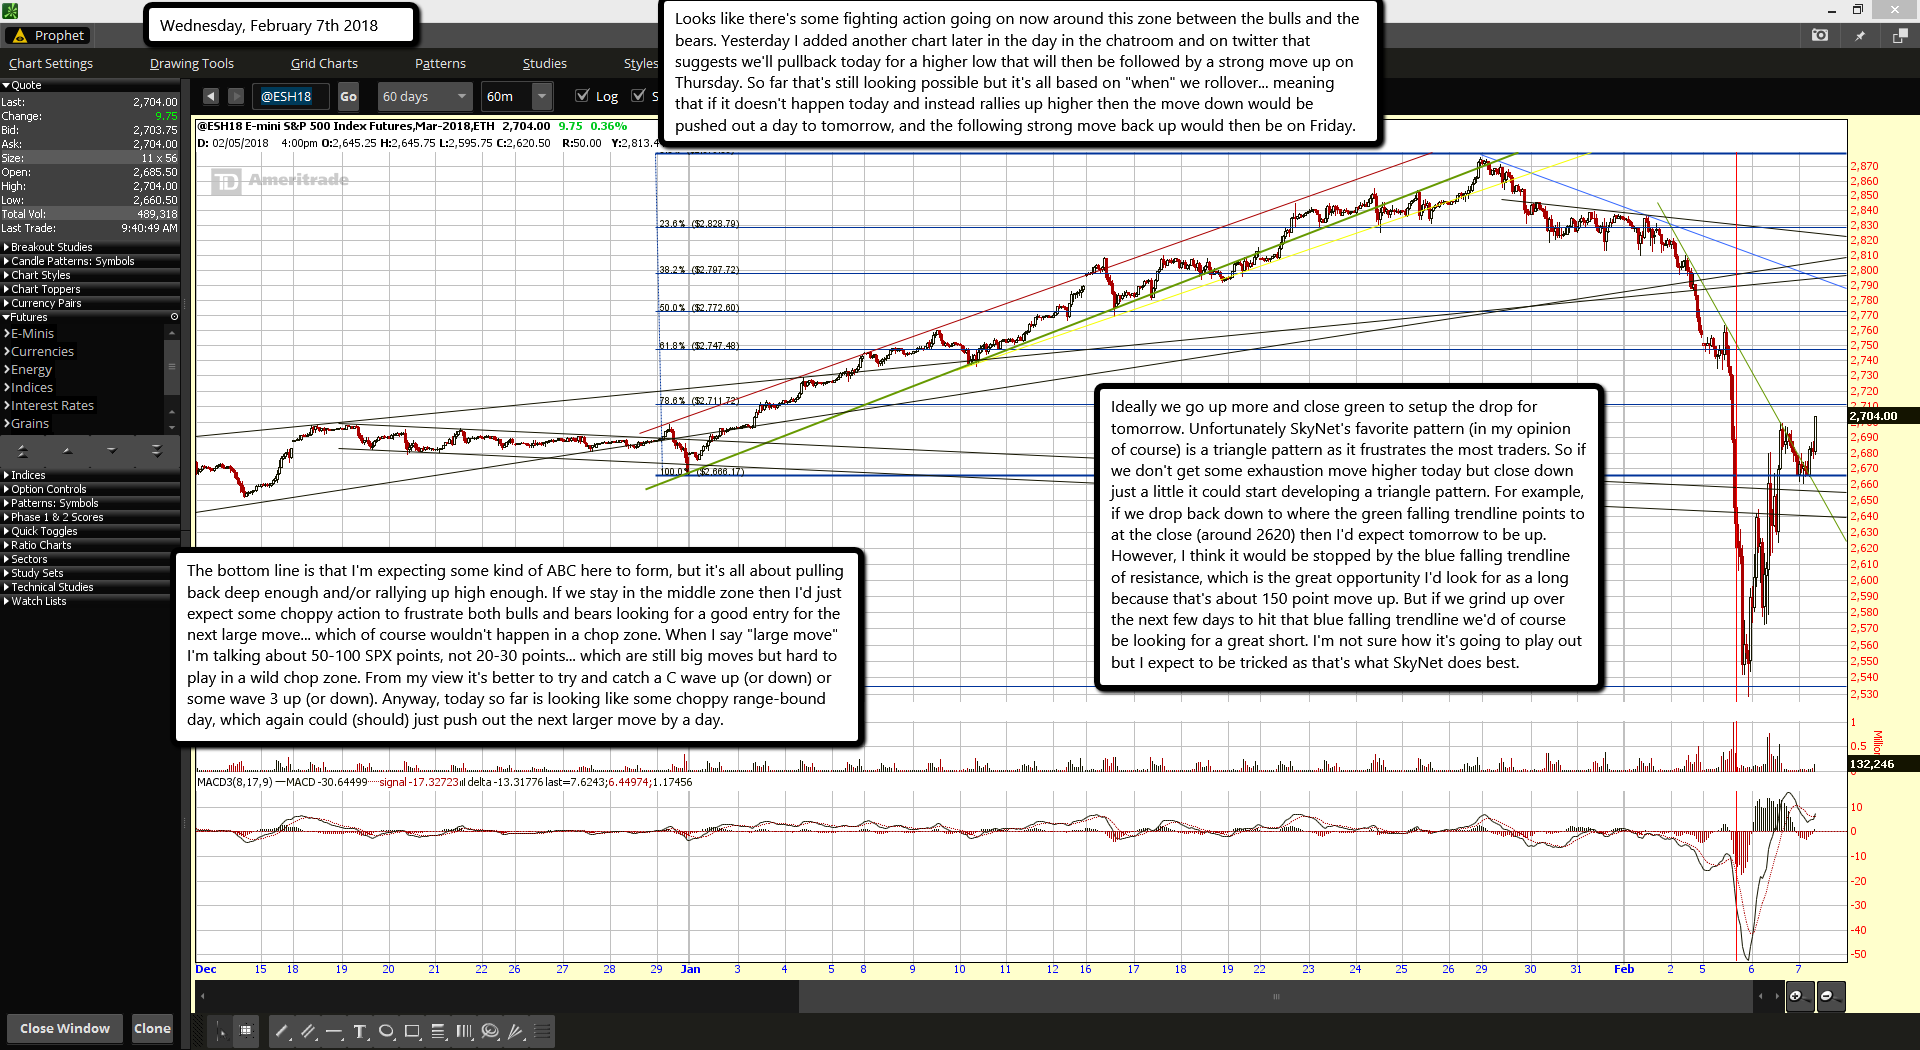
Looks like there's some fighting action going on now around this zone between the bulls and the bears. Yesterday I added another chart later in the day in the chatroom and on twitter that suggests we'll pullback today for a higher low that will then be followed by a strong move up on Thursday. So far that's still looking possible but it's all based on "when" we rollover... meaning that if it doesn't happen today and instead rallies up higher then the move down would be pushed out a day to tomorrow, and the following strong move back up would then be on Friday.

The bottom line is that I'm expecting some kind of ABC here to form, but it's all about pulling back deep enough and/or rallying up high enough. If we stay in the middle zone then I'd just expect some choppy action to frustrate both bulls and bears looking for a good entry for the next large move... which of course wouldn't happen in a chop zone. When I say "large move" I'm talking about 50-100 SPX points, not 20-30 points... which are still big moves but hard to play in a wild chop zone. From my view it's better to try and catch a C wave up (or down) or some wave 3 up (or down). Anyway, today so far is looking like some choppy range-bound day, which again could (should) just push out the next larger move by a day.

Ideally we go up more and close green to setup the drop for tomorrow. Unfortunately SkyNet's favorite pattern (in my opinion of course) is a triangle pattern as it frustrates the most traders. So if we don't get some exhaustion move higher today but close down just a little it could start developing a triangle pattern. For example, if we drop back down to where the green falling trendline points to at the close (around 2620) then I'd expect tomorrow to be up. However, I think it would be stopped by the blue falling trendline of resistance, which is the great opportunity I'd look for as a long because that's about 150 point move up. But if we grind up over the next few days to hit that blue falling trendline we'd of course be looking for a great short. I'm not sure how it's going to play out but I expect to be tricked as that's what SkyNet does best.

ES Morning Update February 6th 2018

0

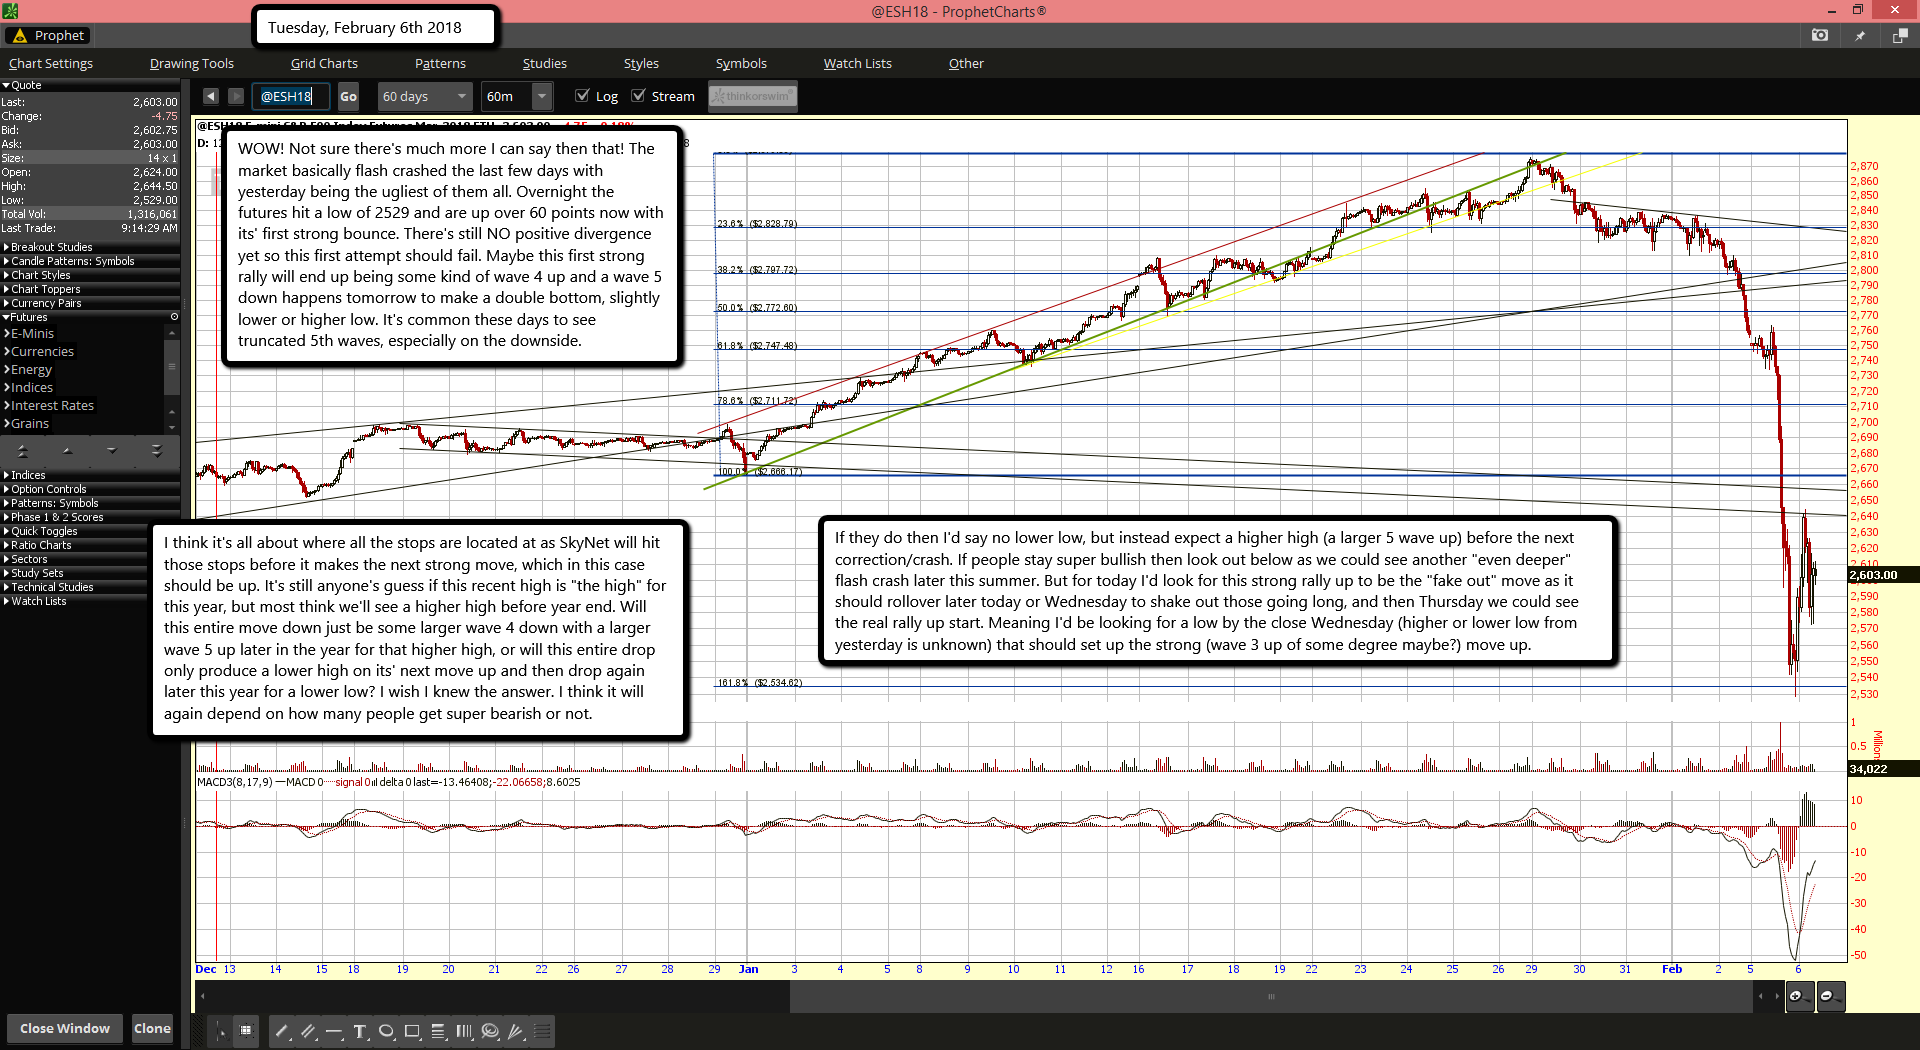
WOW! Not sure there's much more I can say then that! The market basically flash crashed the last few days with yesterday being the ugliest of them all. Overnight the futures hit a low of 2529 and are up over 60 points now with its' first strong bounce. There's still NO positive divergence yet so this first attempt should fail. Maybe this first strong rally will end up being some kind of wave 4 up and a wave 5 down happens tomorrow to make a double bottom, slightly lower or higher low. It's common these days to see truncated 5th waves, especially on the downside.

I think it's all about where all the stops are located at as SkyNet will hit those stops before it makes the next strong move, which in this case should be up. It's still anyone's guess if this recent high is "the high" for this year, but most think we'll see a higher high before year end. Will this entire move down just be some larger wave 4 down with a larger wave 5 up later in the year for that higher high, or will this entire drop only produce a lower high on its' next move up and then drop again later this year for a lower low? I wish I knew the answer. I think it will again depend on how many people get super bearish or not.

If they do then I'd say no lower low, but instead expect a higher high (a larger 5 wave up) before the next correction/crash. If people stay super bullish then look out below as we could see another "even deeper" flash crash later this summer. But for today I'd look for this strong rally up to be the "fake out" move as it should rollover later today or Wednesday to shake out those going long, and then Thursday we could see the real rally up start. Meaning I'd be looking for a low by the close Wednesday (higher or lower low from yesterday is unknown) that should set up the strong (wave 3 up of some degree maybe?) move up.

ES Morning Update February 5th 2018

0

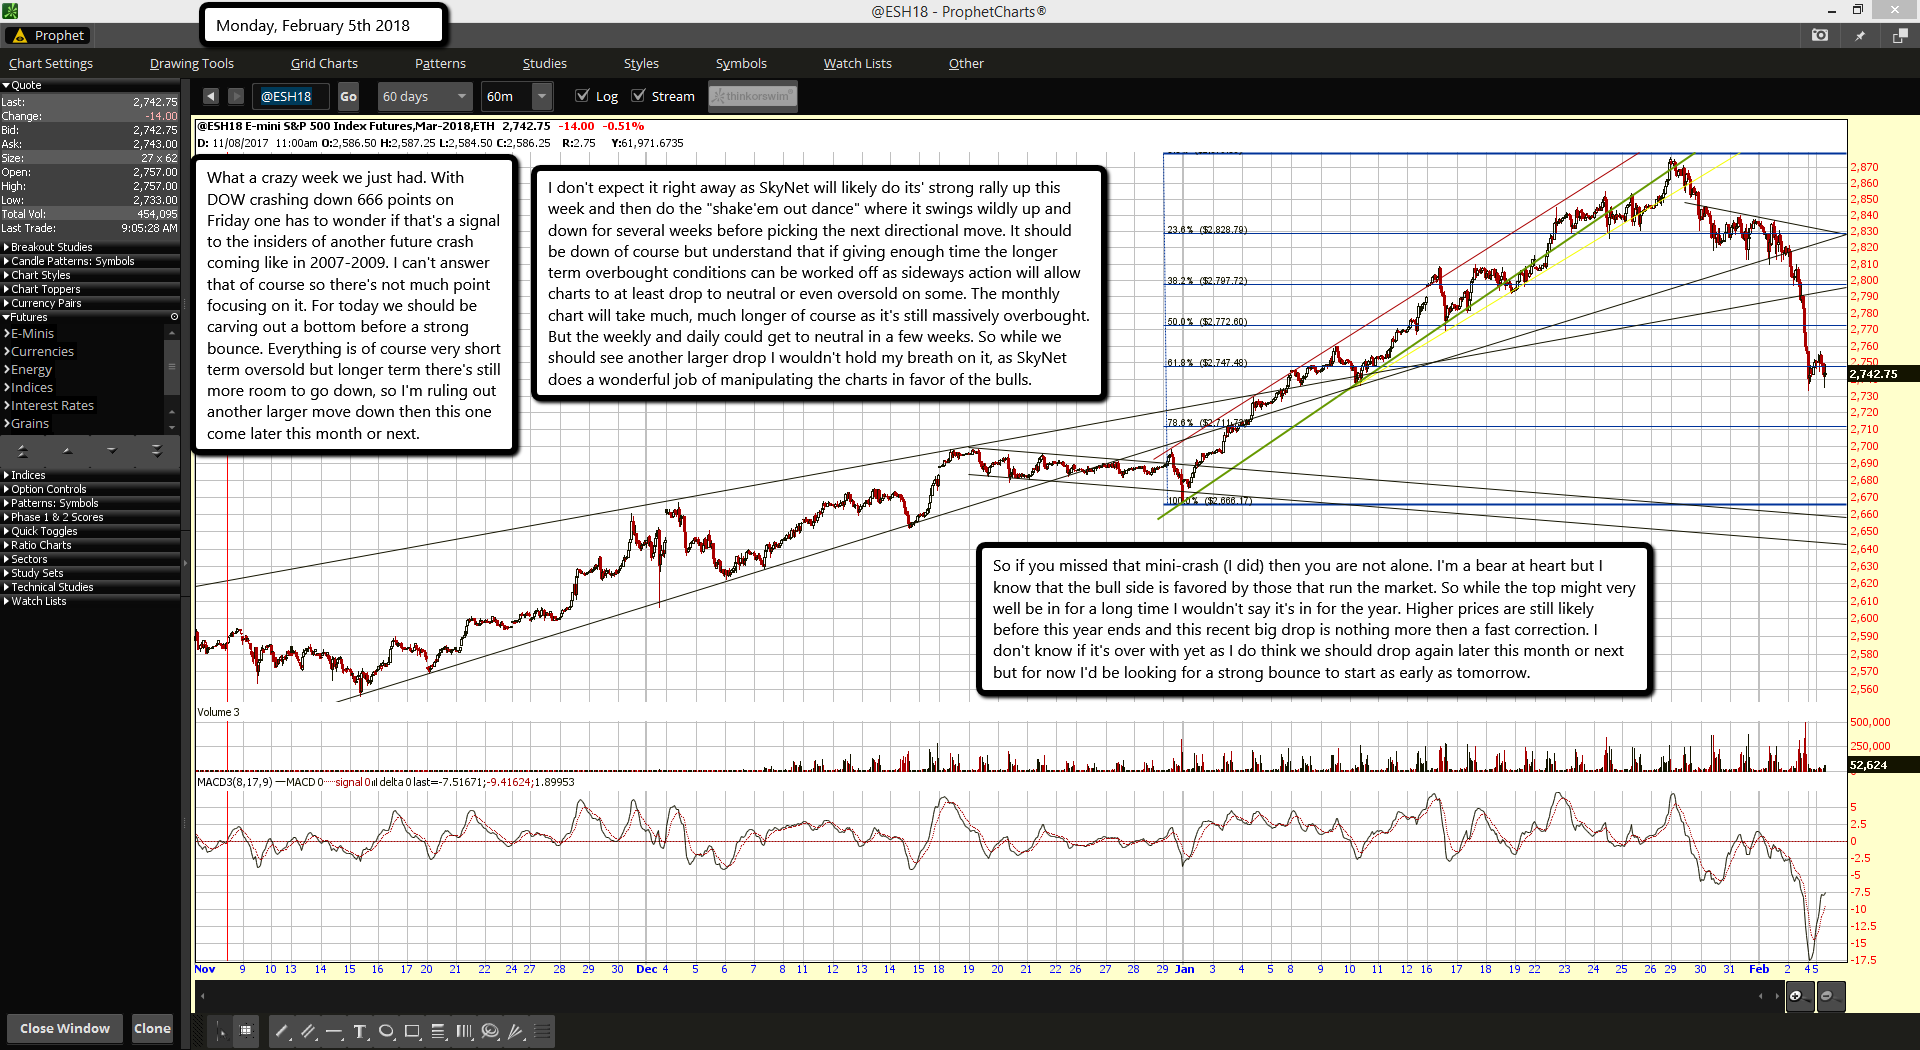
What a crazy week we just had. With DOW crashing down 666 points on Friday one has to wonder if that's a signal to the insiders of another future crash coming like in 2007-2009. I can't answer that of course so there's not much point focusing on it. For today we should be carving out a bottom before a strong bounce. Everything is of course very short term oversold but longer term there's still more room to go down, so I'm ruling out another larger move down then this one come later this month or next.

I don't expect it right away as SkyNet will likely do its' strong rally up this week and then do the "shake'em out dance" where it swings wildly up and down for several weeks before picking the next directional move. It should be down of course but understand that if giving enough time the longer term overbought conditions can be worked off as sideways action will allow charts to at least drop to neutral or even oversold on some. The monthly chart will take much, much longer of course as it's still massively overbought. But the weekly and daily could get to neutral in a few weeks. So while we should see another larger drop I wouldn't hold my breath on it, as SkyNet does a wonderful job of manipulating the charts in favor of the bulls.

So if you missed that mini-crash (I did) then you are not alone. I'm a bear at heart but I know that the bull side is favored by those that run the market. So while the top might very well be in for a long time I wouldn't say it's in for the year. Higher prices are still likely before this year ends and this recent big drop is nothing more then a fast correction. I don't know if it's over with yet as I do think we should drop again later this month or next but for now I'd be looking for a strong bounce to start as early as tomorrow.

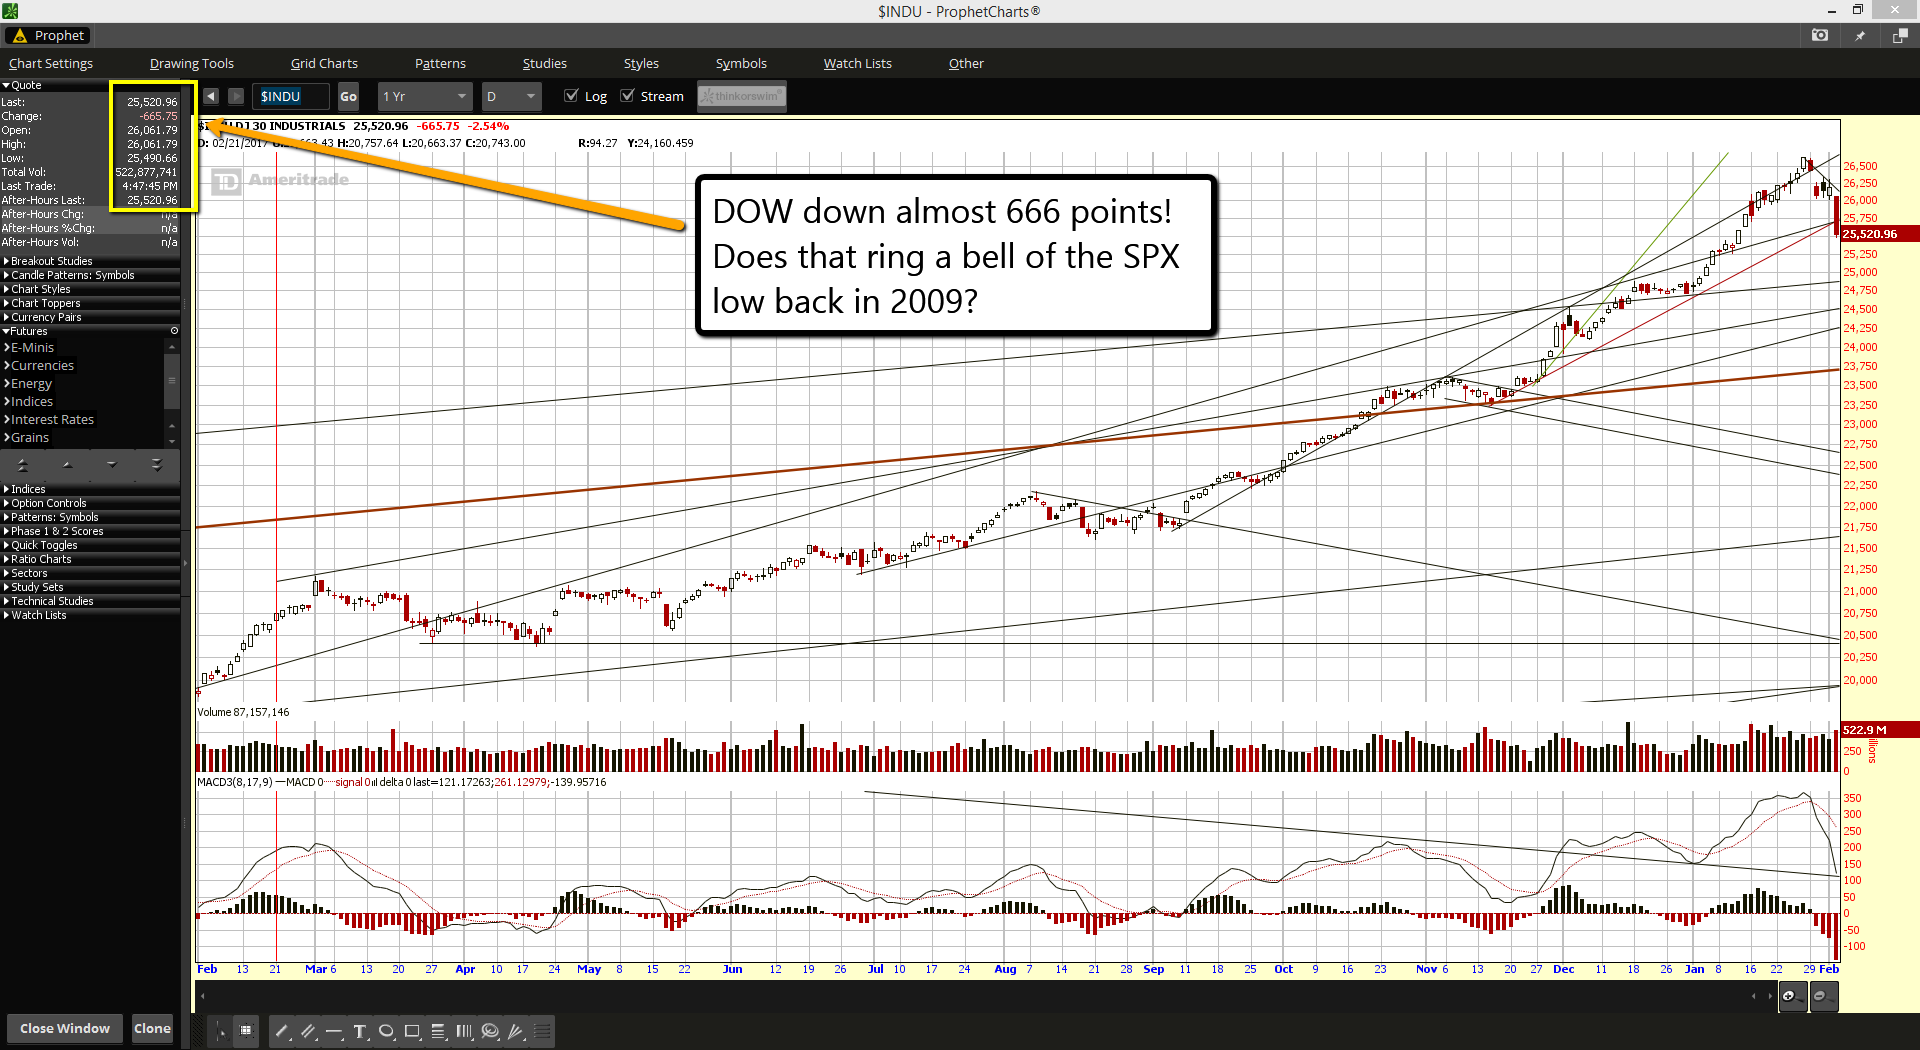
DOW down almost 666 points… does that ring a bell?

0

Reminds me of March 6th, 2009 when the SPX hit a low of 666...

ES Morning Update February 2nd 2018

0

The futures have fallen again as the bears won't let the bulls breathe. I have to say it's been really hard trying to figure this market out as I was really expecting a strong bounce today from an inverted head and shoulders pattern that formed yesterday but now has clearly failed. The futures are now at the 38.2% retracement level and very oversold. There is a slight hook trying to form on the MACD's right now, and it did put in a higher low then the previous one. So positive divergence could be forming too if it turns back up after the open.

One thing for sure is that bulls are finally getting a taste of what the bears have been experiencing for the last two years. This move down looks like a nice clean ABC move as well so it might be ending here soon. I say "might" as I don't want to be try and be cute here as I've had a hard time recently predicting the next move. It's so rare to see a drop last this long that I'm sure many people were fooled too. I see it bouncing a little right now as I write this morning update as it was down over 20 points when I started. It must have been a reaction to the non-farm payroll report (now called "Employment Situation").

Looking over at the 6 hour chart it does NOT show any positive divergence, so a lower low is still possible in the coming future. I would not expect it too soon though as a multi-day or week bounce could happen, and is common before an even bigger drop. Meaning that if this indeed was the top (or a very important and long lasting one, but not necessarily the top for the year), then this first ABC move down could be just a larger A wave down, with a larger B wave up that could last all of next week as it shakes out both bulls and bears... then a larger C drop should happen to form the positive divergence on that 6 hour chart.

I can't believe I'm suggesting here that another larger drop is possible as this non-stop bull for the last 2 years has me brainwashed into thinking every small dip will be bought, but we are still very, very overbought on daily, weekly and monthly charts so a multi-week correction is likely here versus the typical buy the dip crap. Anyway, let's see if the market can bounce here afer the open and start that larger B wave up that should extend into next week easily. Have a great weekend and I hope you have had better success recently with the market then I have... LOL.

ES Morning Update February 1st 2018

0

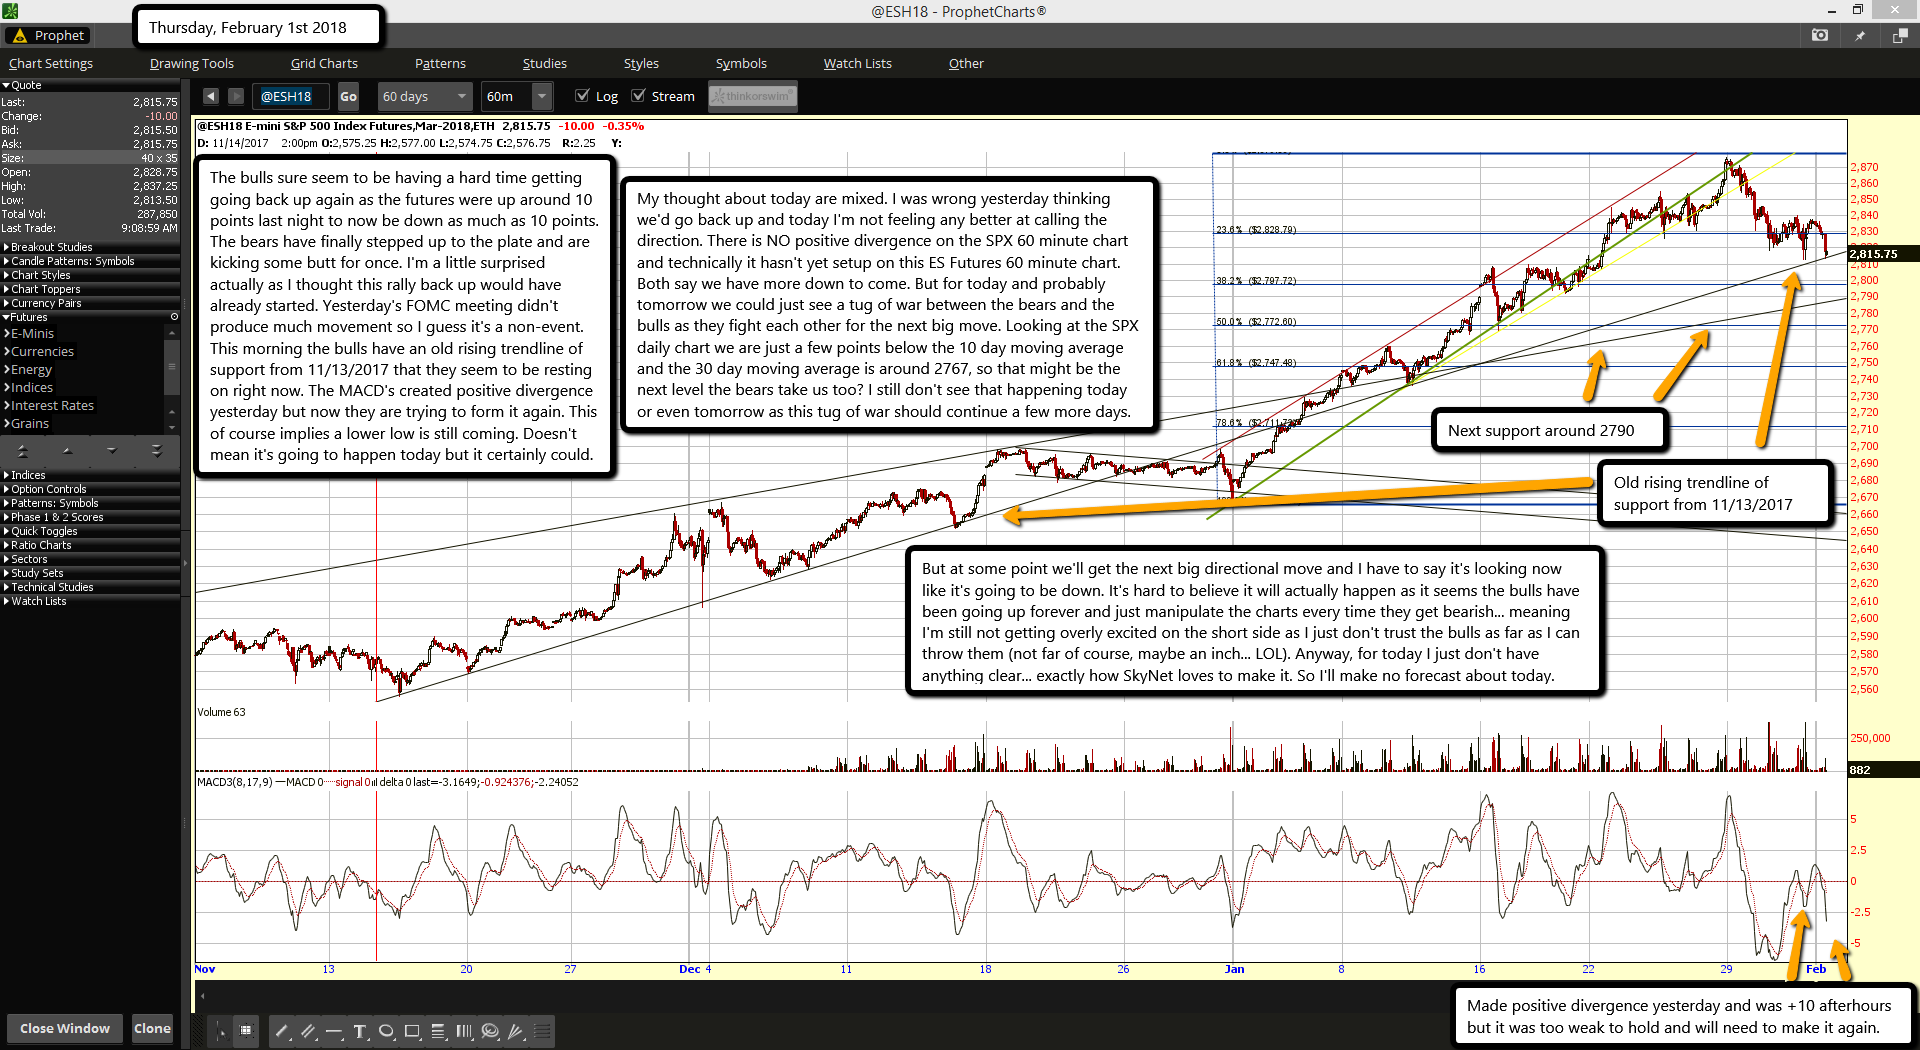
The bulls sure seem to be having a hard time getting going back up again as the futures were up around 10 points last night to now be down as much as 10 points. The bears have finally stepped up to the plate and are kicking some butt for once. I'm a little surprised actually as I thought this rally back up would have already started. Yesterday's FOMC meeting didn't produce much movement so I guess it's a non-event. This morning the bulls have an old rising trendline of support from 11/13/2017 that they seem to be resting on right now. The MACD's created positive divergence yesterday but now they are trying to form it again. This of course implies a lower low is still coming. Doesn't mean it's going to happen today but it certainly could.

My thought about today are mixed. I was wrong yesterday thinking we'd go back up and today I'm not feeling any better at calling the direction. There is NO positive divergence on the SPX 60 minute chart and technically it hasn't yet setup on this ES Futures 60 minute chart. Both say we have more down to come. But for today and probably tomorrow we could just see a tug of war between the bears and the bulls as they fight each other for the next big move. Looking at the SPX daily chart we are just a few points below the 10 day moving average and the 30 day moving average is around 2767, so that might be the next level the bears take us too? I still don't see that happening today or even tomorrow as this tug of war should continue a few more days.

But at some point we'll get the next big directional move and I have to say it's looking now like it's going to be down. It's hard to believe it will actually happen as it seems the bulls have been going up forever and just manipulate the charts every time they get bearish... meaning I'm still not getting overly excited on the short side as I just don't trust the bulls as far as I can throw them (not far of course, maybe an inch... LOL). Anyway, for today I just don't have anything clear... exactly how SkyNet loves to make it. So I'll make no forecast about today.

ES Morning Update January 31st 2018

0

The bears sure slapped the bulls hard yesterday. I really wasn't expecting that big of a drop. I did think we'd dip below the 2840 area to clear out the bulls' stops but not down as low as 2818. However, we all know how overbought the market is so a larger move then expected is exactly what was needed to shake out some longs. Today we wait on the FOMC meeting and it's hard too know which way we will go next. On one hand we have a very clean looking bear flag formed now but we got so short term oversold yesterday that a move up is just as likely. As much as I lean toward the bear side as I know in my heart that this market is 100% rigged with fake earnings on companies, insider buying and selling and sector rotation, I have to also know that the bulls will likely win this battle again.

Does it mean for sure that the down move is over with? No, it just means that odds favor an up move after the FOMC meeting, but how high it goes is unknown. It could make a lower high into Friday for example and then next week we could see another move down. Or it could continue higher with a new all time high... but either way the odds favor the bulls today, both before and after the FOMC meeting. SkyNet doesn't usually give the bears a chance to wake up and join the party but instead does the entire move down super quick (like 2 days max) so the bears miss it all and chase the bottom. So for now I'm bullish and will try to buy any dip that happens around the 2pm meeting.

It's hard to do sometimes as those wild swings are very fast up and down. I'd love to see a fast move down to hit an old rising trendline around 2810 area right now, and then rip back up the rest of the day. But I wouldn't count on it. On the bigger picture though the daily chart of the SPX finally rolled over and (almost?) got a bearish cross on its' MACD's. Of course that implies that it will also turn back up at some point and make a lower high to setup negative divergence... which means the market will make a higher high while the MACD does the opposite. To me that could take several months to setup, or at least several weeks. It again implies that higher highs in the market are coming before some important top develops that allows a 10%+ correction.

ES Morning Update January 30th 2018

0

Well, the bears chose to take it down yesterday, which with today's gap down is a pretty good move in total. But I fear this is going to be a "sell the rumor, buy the news" event after the FOMC tomorrow. We are down in that range of support now that I spoke of on yesterday's post. It's pierced through the 2480 area a little to run the bulls stops I'd guess. If all goes as expected I'd think we'll see a bottom put in today and back up tomorrow after the FOMC meeting. You can see on this 6 hour chart of the ES Futures that the MACD's have fallen nicely and are approaching the zero area where turns back up are common. I say that I took this short as I really was 50/50 on the break of the rising green trendline yesterday. And there's the fact that the 6 hour MACD has gotten other bearish crosses recently that faked me out thinking this time it's going to break. That's when the bears get creamed shorting it expecting it to break, only to see it scream higher again. So now I'll be waiting for this to bottom today and/or tomorrow before the FOMC meeting so I can go long when everyone is super bearish again. I can't add much more then that as I spelled it out fairly well on yesterday's post.

ES Morning Update January 29th 2018

0

Finally seeing a little weakness this Monday morning but it's coming from a high that's far above support, so while this might look impressive it's still nothing for the bears to get excited about.  Major support is down at 2840 area of course but the 2855 prior highs and 2860 area from the rising yellow trendline will likely stop the move down today.  Tomorrow of course is another story, but what I think might end up happening is quick and short pullback down to that 2840 area going into the FOMC meeting and then back up afterwards.  Previously I thought it might be a turn down, but that would require going up into the meeting, or at least going sideways mostly with a slant upward.

This move down is too far in my opinion but not yet confirmed.  If the yellow rising trendline of support hold and we go back up tomorrow and/or Wednesday then it's still possible to have the turn down shortly after the meeting.  But if the trendline breaks before the meeting, then odds favor the meeting area becoming a turn back up, which then could push the market another 100 points or more higher.  You know how the market loves the "even numbers" levels to target, which right now the one just above is the 2900 level, and we've got as close as 2878 over the weekend.

Therefore I'd expect the 2900 level to be a no brainier for the next rally up after the FOMC should the market pullback in front of it.  It's really as simple as this... for the bears to take the market down 100 or more points they need the rising yellow trendline to hold and a continued up move into this Wednesday with a new all time high hit (ideally just a few points under or over 2900).  Or if we go down into the meeting we should turn back up afterwards and blow through 2900 and make a run for the even bigger and more powerful "even number" level of 3000 SPX.

It can really go either way at this point but the bears need to keep the market up the next few days to get it extremely overbought.  The bulls want to push it down to get work off the overbought conditions so it will be at least neutral or at best oversold (unlikely there).  On the 60 minute chart of the ES Futures the MACD's are already down to almost zero this morning from a +7.5 area high.  So they are neutral right now and a turn back up is likely before the close.

My guess is again that they will indeed turn up and ride the rising yellow trendline of support into the close.  It should then have everyone guessing as to whether it's a B wave up with the move down at the open the A wave... which suggests a C wave down tomorrow to break the yellow rising trendline.  If that happens it will likely kill the bears chance of a large 100+ point move down over the coming weeks as that 2840 area is probaby going to put in the low before another 100+ move up happens after the FOMC meeting.  So at the close bears really want to see the turn back up today continue tomorrow to make another all time high.  Will it happen this way or will the bears screw up and go for the tiny move down into Wednesday?  I'll be ready either ay with a great short from a new all time high right after the FOMC meeting or a long from the next bear squeeze.

ES Morning Update January 26th 2018

0

Looks like another rally this morning to open up the normal trading seession.  Will it hold or fold is the question?  It looks like a triple top on the futures so far and it's really do or die time for both the bulls and the bears.  If the bulls can't get through it today they risk falling down in some nasty wave come afterhours or over the weekend.... which leaves Monday as possibly gaping down.  The SPX 60 minute chart is also losing steam on the bullish side.  For the first time since this strong rally up started around the first of January I now see a bearish cross on that MACD... but it's just barely and with the expected strong open coming that could easily cross back to bullish again.  However, it's the first sign of weakness on the bulls part and that is important.

The Histogram bars have fallen below the zero line for the first time since the rally started as well.  It's been a super strong move up from the first of the month but it's looking tired.  It can still go higher of course but cracks are showing now.  This again leads to believe that the FOMC meeting next week will be a "turning zone", where it might not happen in front of the meeting but should after the meeting (give or take a few days).  If the bears can hold this triple top today they stand a chance I think of pushing it down to that prior support zone around 2800 but if the bulls breakthrough today then the current 2840 area will be solid support and tough to break if the bears ever get a move down started.

From looking at various chart time frames it looks more to me like a sideways trading range is going to form and hold for awhile until overbought charts can be reset.  This assumes nothing much comes out of the FOMC meeting.  If something does come out that is looked out negatively then we should start a 1-3 week correction.  If not... then I'd expect rangebound for a similar period.  The range however isn't formed as I do think it will be wider then the current 2830-2850 area.  Possibly it will reach down to 2800 and up to the current 2850 area high?  Again it's unknown currently.  If we have a correction instead then I'd look for 5-10% max, but probably only 3%-5% on this first correction in a long, long time.  That would be about 85 points down to 143 points if the top is 2855.

Again, it's all about getting that turn down started with some negative news... otherwise we are more likely to be trapped in a trading range for awhile and there'll be no correction as when the trade range ends the bull market should continue.  For today though my thoughts are that the current triple top will hold and we'll drift back down into the 2840 area of support where we'll be mostly rangebound until the close.

s2Member®