Another week is here guys and it's hard to believe that not only is October almost over but the entire year of 2016 is nearing the end as well. The November 8th election is just 12 trading days away now... what will the gangsters do? Will they tank it in beforehand, rip it to new highs or just continue with the chop? We'll only know after the fact I guess...
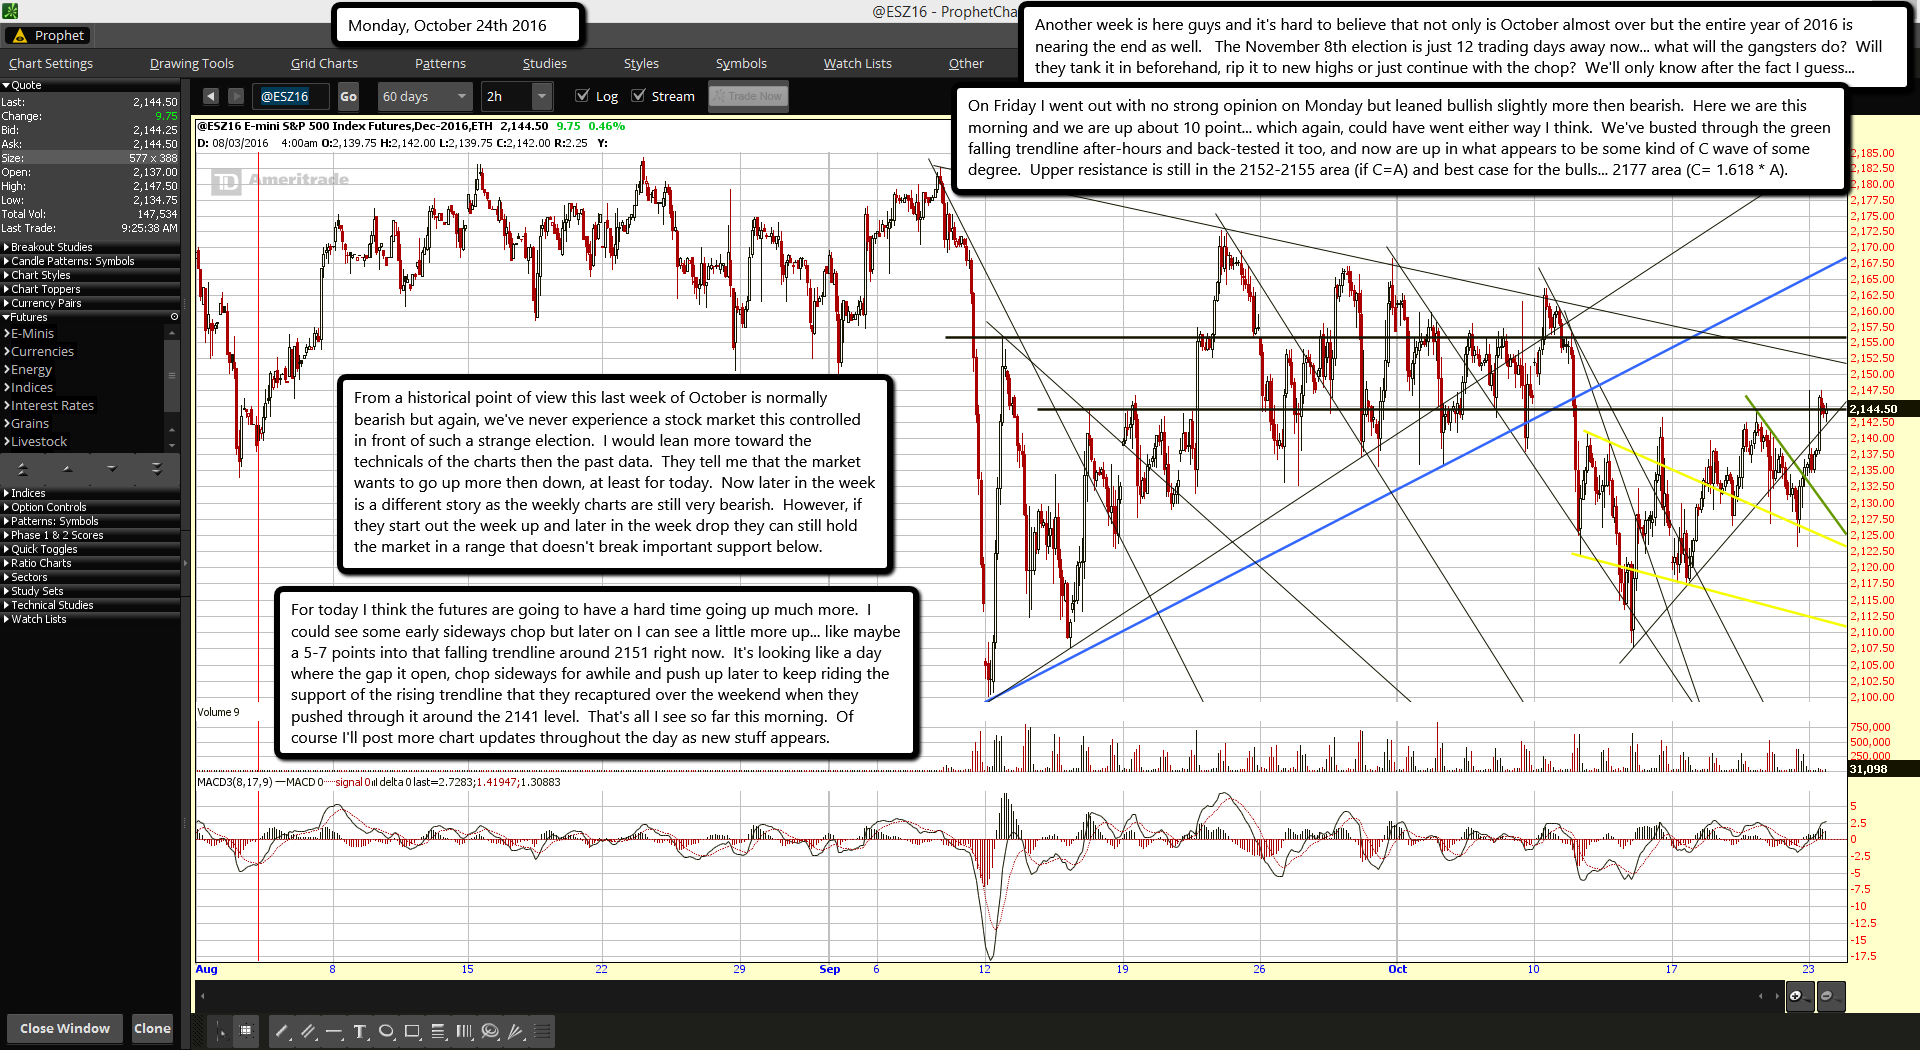
On Friday I went out with no strong opinion on Monday but leaned bullish slightly more then bearish. Here we are this morning and we are up about 10 point... which again, could have went either way I think. We've busted through the green falling trendline after-hours and back-tested it too, and now are up in what appears to be some kind of C wave of some degree. Upper resistance is still in the 2152-2155 area (if C=A) and best case for the bulls... 2177 area (C= 1.618 * A).
From a historical point of view this last week of October is normally bearish but again, we've never experience a stock market this controlled in front of such a strange election. I would lean more toward the technicals of the charts then the past data. They tell me that the market wants to go up more then down, at least for today. Now later in the week is a different story as the weekly charts are still very bearish. However, if they start out the week up and later in the week drop they can still hold the market in a range that doesn't break important support below.
For today I think the futures are going to have a hard time going up much more. I could see some early sideways chop but later on I can see a little more up... like maybe a 5-7 points into that falling trendline around 2151 right now. It's looking like a day where the gap it open, chop sideways for awhile and push up later to keep riding the support of the rising trendline that they recaptured over the weekend when they pushed through it around the 2141 level. That's all I see so far this morning. Of course I'll post more chart updates throughout the day as new stuff appears.
Smartmatic, a U.K.-based voting technology company with deep ties to George Soros, has control over voting machines in 16 states including battleground zones like Arizona, Colorado, Florida, Michigan, Nevada, Pennsylvania and Virginia. Other jurisdictions affected are California, District of Columbia, Illinois, Louisiana, Missouri, New Jersey, Oregon, Washington and Wisconsin.
Its website includes a flow-chart that describes how the company has contributed to elections in the U.S. from 2006-2015 with “57,000 voting and counting machines deployed” and “35 million voters assisted.”
In 2005, Smartmatic bought-out California-based Sequoia Voting Systems and entered the world of U.S. elections.
According to Smarmatic’s website, “In less than one year Smartmatic tripled Sequoia’s market share” and “has offered technology and support services to the Electoral Commissions of 307 counties in 16 States.”
Among the “case studies” that Smartmatic lists on its website as examples of its work are Venezuela, where it has been facilitating elections since 2004 when it “won a bid to provide Venezuela with a reliable voting system.”
It also lists Cook County, Illinois as another success story, when in “in 2006, Smartmatic signed what at the moment was the largest election automation contract in US history.” Cook County includes Chicago and its suburbs, a geographic zone that has historically and lately been subject to criticism for voter fraud.
The chairman of Smartmatic is Lord Mark Malloch-Brown, who sits in the British House of Lords and on the board of George Soros’s Open Society Foundations. He was formerly the vice-chairman of Soros’s Investment Funds and even the deputy secretary-general of the United Nations when he worked as chief of staff to Kofi Annan.
Malloch-Brown’s resume includes stints as vice-president of the UN World Bank and in British Prime Minister Gordon Brown’s cabinet.
In addition to a close relationship with Soros, Malloch-Brown has worked with consulting firms that are well-connected to Bill and Hillary Clinton. He was an international partner with the Sawyer-Miller consulting firm and was a senior adviser to FTI Consulting.
One of Sawyer-Miller’s alumni is Mandy Grunwald, who ran the firm’s communication contract for Bill Clinton’s 1992 presidential run. She was also the head of communications for Hillary Clinton’s unsuccessful 2008 presidential bid.
Jackson Dunn, who is a senior managing director with FTI Consulting, spent 15 years in Washington where he worked as an aide to President Bill Clinton and Sen. Hilllary Clinton.
Smartmatic has already encountered controversy in the ongoing presidential contest. It ran the online balloting for the Utah Republican caucus last March, when many critics said it was impossible to secure personal electronic devices that are used to register and vote.
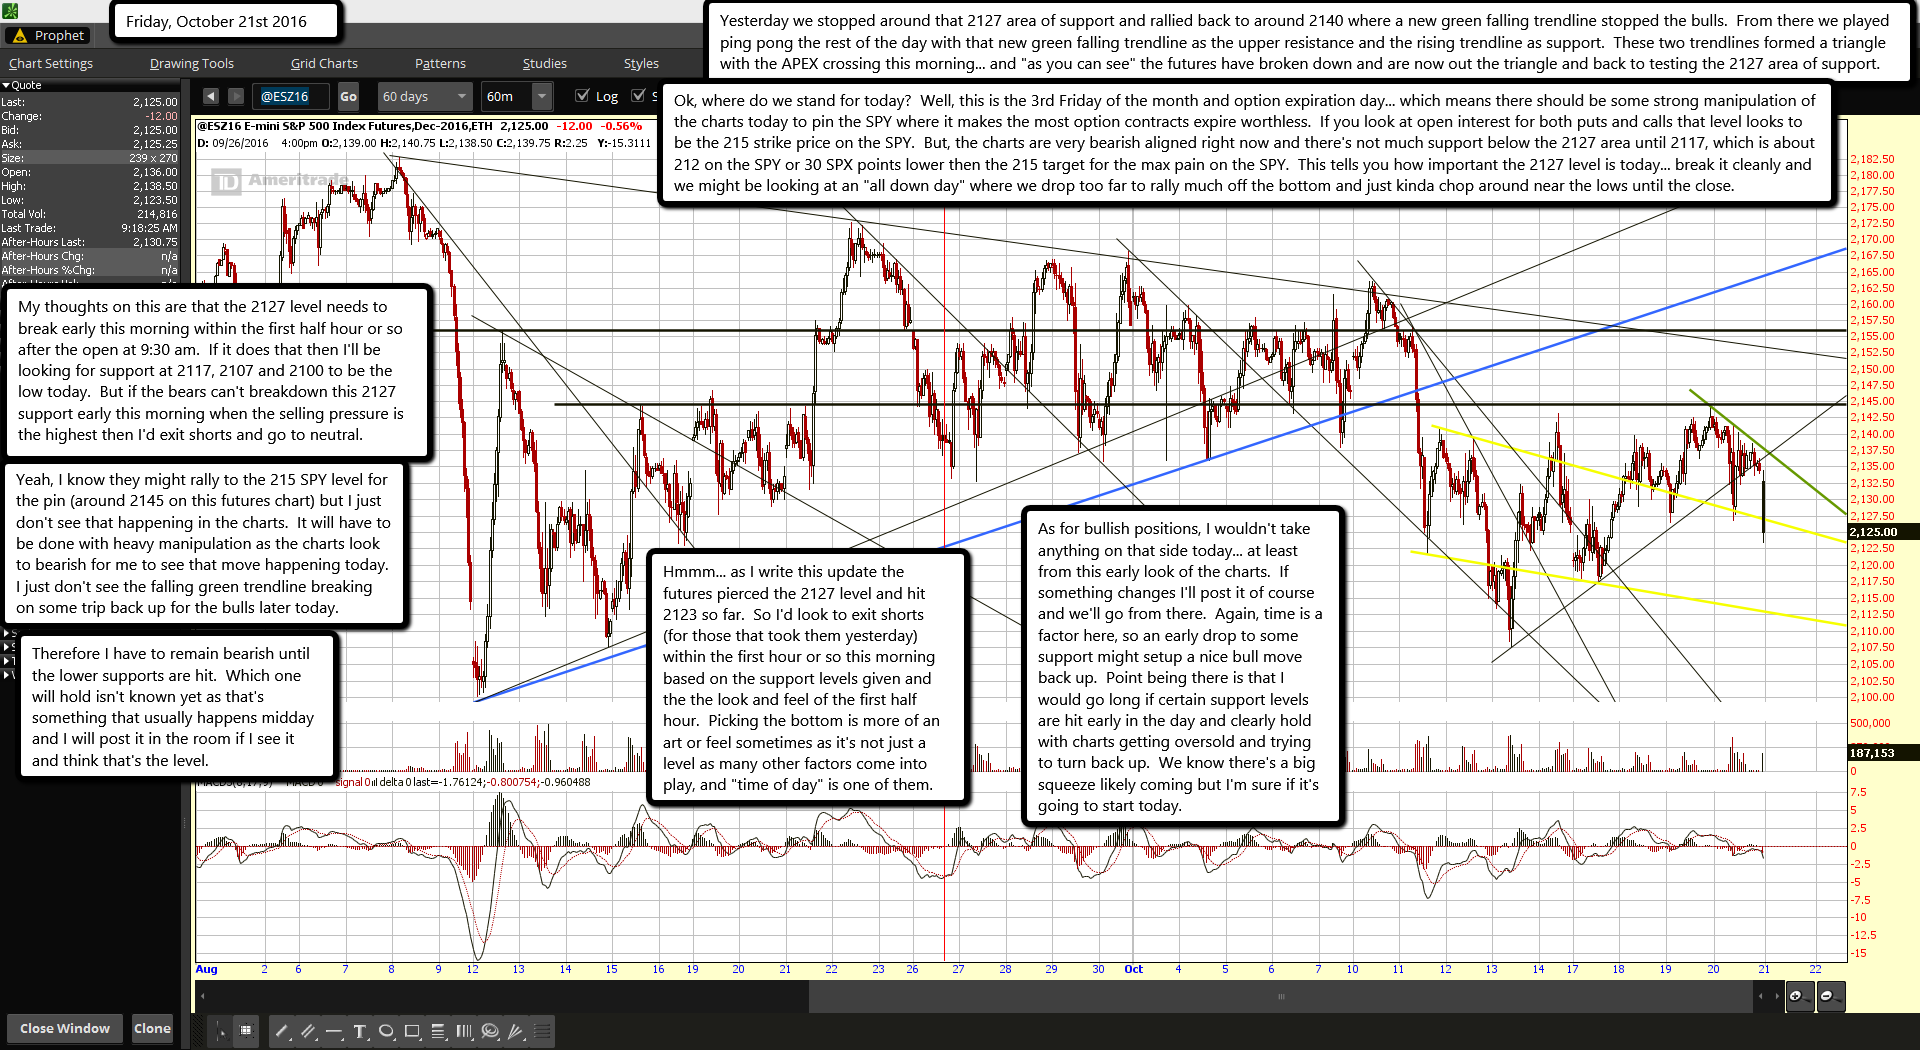
Yesterday we stopped around that 2127 area of support and rallied back to around 2140 where a new green falling trendline stopped the bulls. From there we played ping pong the rest of the day with that new green falling trendline as the upper resistance and the rising trendline as support. These two trendlines formed a triangle with the APEX crossing this morning... and "as you can see" the futures have broken down and are now out the triangle and back to testing the 2127 area of support.
Ok, where do we stand for today? Well, this is the 3rd Friday of the month and option expiration day... which means there should be some strong manipulation of the charts today to pin the SPY where it makes the most option contracts expire worthless. If you look at open interest for both puts and calls that level looks to be the 215 strike price on the SPY. But, the charts are very bearish aligned right now and there's not much support below the 2127 area until 2117, which is about 212 on the SPY or 30 SPX points lower then the 215 target for the max pain on the SPY. This tells you how important the 2127 level is today... break it cleanly and we might be looking at an "all down day" where we drop too far to rally much off the bottom and just kinda chop around near the lows until the close.
My thoughts on this are that the 2127 level needs to break early this morning within the first half hour or so after the open at 9:30 am. If it does that then I'll be looking for support at 2117, 2107 and 2100 to be the low today. But if the bears can't breakdown this 2127 support early this morning when the selling pressure is the highest then I'd exit shorts and go to neutral.
Yeah, I know they might rally to the 215 SPY level for the pin (around 2145 on this futures chart) but I just don't see that happening in the charts. It will have to be done with heavy manipulation as the charts look to bearish for me to see that move happening today. I just don't see the falling green trendline breaking on some trip back up for the bulls later today.
Therefore I have to remain bearish until the lower supports are hit. Which one will hold isn't known yet as that's something that usually happens midday and I will post it in the room if I see it and think that's the level.
Hmmm... as I write this update the futures pierced the 2127 level and hit 2123 so far. So I'd look to exit shorts (for those that took them yesterday) within the first hour or so this morning based on the support levels given and the the look and feel of the first half hour. Picking the bottom is more of an art or feel sometimes as it's not just a level as many other factors come into play, and "time of day" is one of them.
As for bullish positions, I wouldn't take anything on that side today... at least from this early look of the charts. If something changes I'll post it of course and we'll go from there. Again, time is a factor here, so an early drop to some support might setup a nice bull move back up. Point being there is that I would go long if certain support levels are hit early in the day and clearly hold with charts getting oversold and trying to turn back up. We know there's a big squeeze likely coming but I'm sure if it's going to start today.
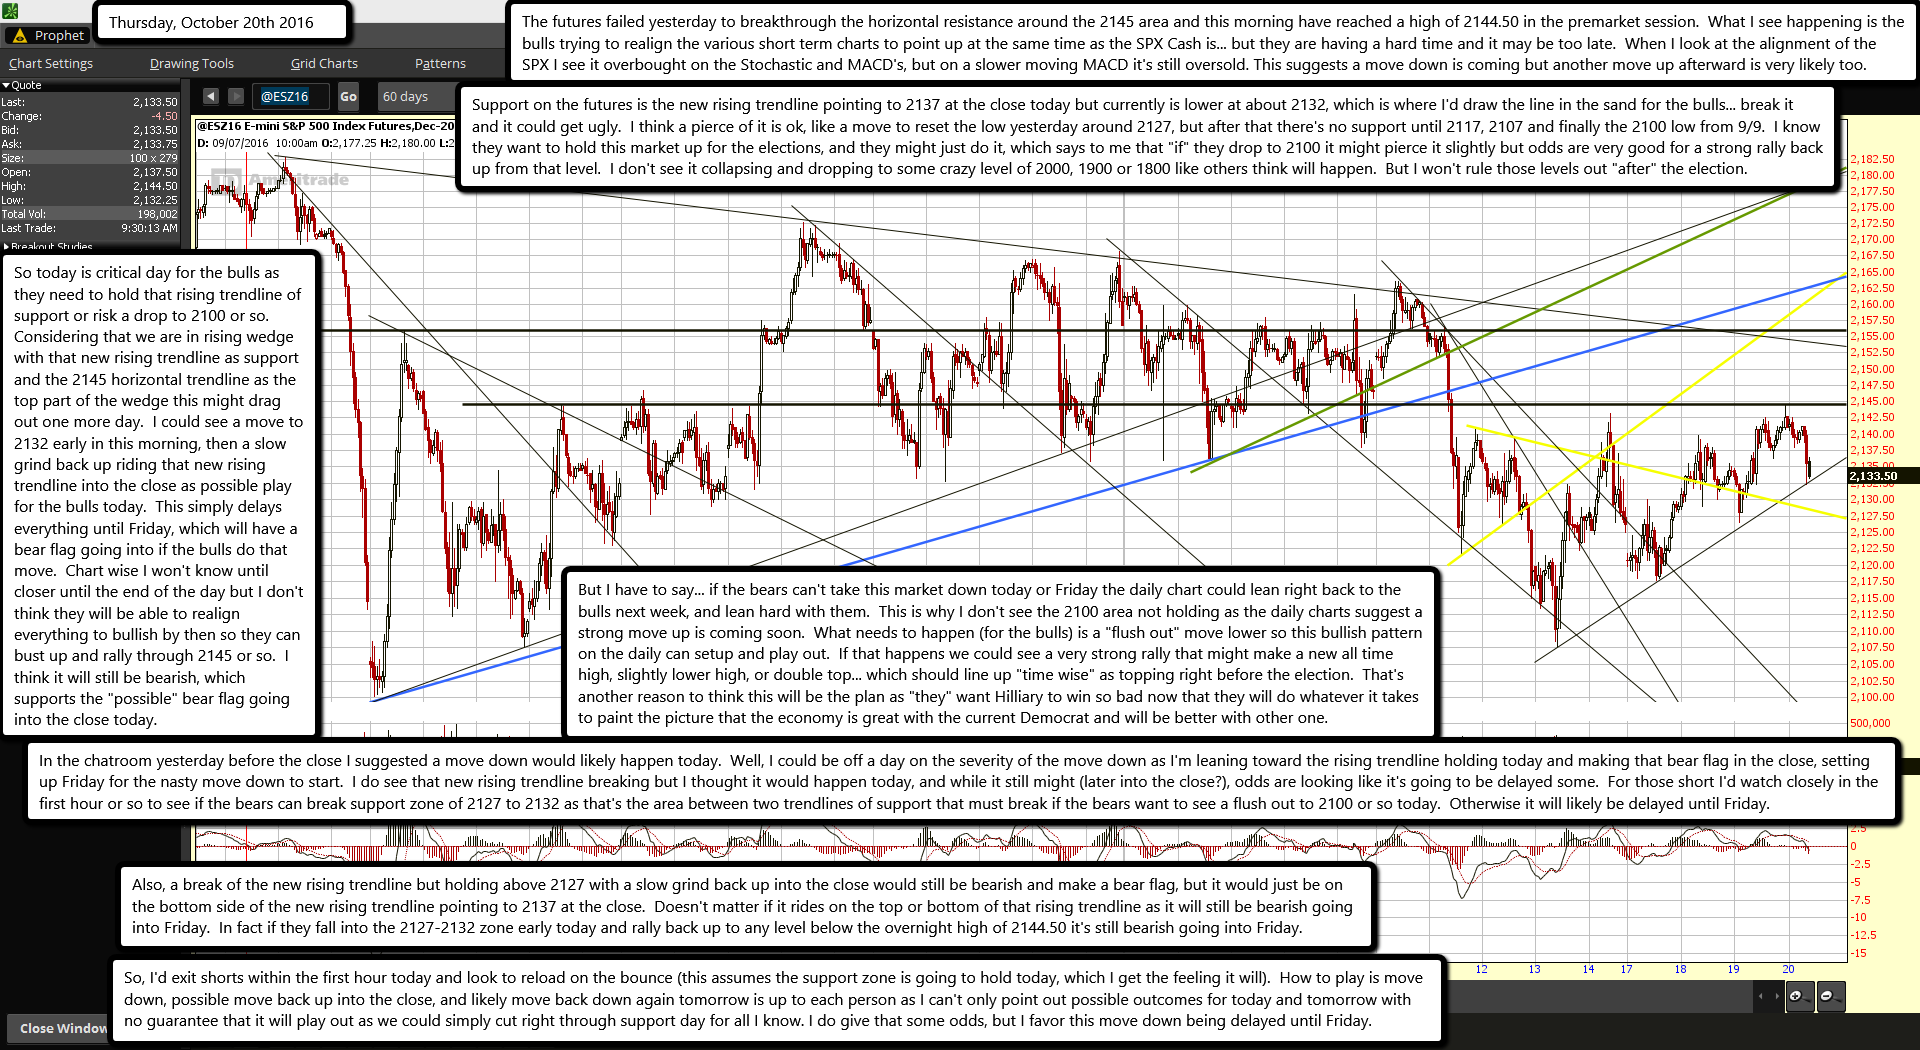
The futures failed yesterday to breakthrough the horizontal resistance around the 2145 area and this morning have reached a high of 2144.50 in the premarket session. What I see happening is the bulls trying to realign the various short term charts to point up at the same time as the SPX Cash is... but they are having a hard time and it may be too late. When I look at the alignment of the SPX I see it overbought on the Stochastic and MACD's, but on a slower moving MACD it's still oversold. This suggests a move down is coming but another move up afterward is very likely too.
Support on the futures is the new rising trendline pointing to 2137 at the close today but currently is lower at about 2132, which is where I'd draw the line in the sand for the bulls... break it and it could get ugly. I think a pierce of it is ok, like a move to reset the low yesterday around 2127, but after that there's no support until 2117, 2107 and finally the 2100 low from 9/9. I know they want to hold this market up for the elections, and they might just do it, which says to me that "if" they drop to 2100 it might pierce it slightly but odds are very good for a strong rally back up from that level. I don't see it collapsing and dropping to some crazy level of 2000, 1900 or 1800 like others think will happen. But I won't rule those levels out "after" the election.
So today is critical day for the bulls as they need to hold that rising trendline of support or risk a drop to 2100 or so. Considering that we are in rising wedge with that new rising trendline as support and the 2145 horizontal trendline as the top part of the wedge this might drag out one more day. I could see a move to 2132 early in this morning, then a slow grind back up riding that new rising trendline into the close as possible play for the bulls today. This simply delays everything until Friday, which will have a bear flag going into if the bulls do that move. Chart wise I won't know until closer until the end of the day but I don't think they will be able to realign everything to bullish by then so they can bust up and rally through 2145 or so. I think it will still be bearish, which supports the "possible" bear flag going into the close today.
But I have to say... if the bears can't take this market down today or Friday the daily chart could lean right back to the bulls next week, and lean hard with them. This is why I don't see the 2100 area not holding as the daily charts suggest a strong move up is coming soon. What needs to happen (for the bulls) is a "flush out" move lower so this bullish pattern on the daily can setup and play out. If that happens we could see a very strong rally that might make a new all time high, slightly lower high, or double top... which should line up "time wise" as topping right before the election. That's another reason to think this will be the plan as "they" want Hilliary to win so bad now that they will do whatever it takes to paint the picture that the economy is great with the current Democrat and will be better with other one.
In the chatroom yesterday before the close I suggested a move down would likely happen today. Well, I could be off a day on the severity of the move down as I'm leaning toward the rising trendline holding today and making that bear flag in the close, setting up Friday for the nasty move down to start. I do see that new rising trendline breaking but I thought it would happen today, and while it still might (later into the close?), odds are looking like it's going to be delayed some. For those short I'd watch closely in the first hour or so to see if the bears can break support zone of 2127 to 2132 as that's the area between two trendlines of support that must break if the bears want to see a flush out to 2100 or so today. Otherwise it will likely be delayed until Friday.
Also, a break of the new rising trendline but holding above 2127 with a slow grind back up into the close would still be bearish and make a bear flag, but it would just be on the bottom side of the new rising trendline pointing to 2137 at the close. Doesn't matter if it rides on the top or bottom of that rising trendline as it will still be bearish going into Friday. In fact if they fall into the 2127-2132 zone early today and rally back up to any level below the overnight high of 2144.50 it's still bearish going into Friday.
So, I'd exit shorts within the first hour today and look to reload on the bounce (this assumes the support zone is going to hold today, which I get the feeling it will). How to play is move down, possible move back up into the close, and likely move back down again tomorrow is up to each person as I can't only point out possible outcomes for today and tomorrow with no guarantee that it will play out as we could simply cut right through support day for all I know. I do give that some odds, but I favor this move down being delayed until Friday.
The technical analysis team at HSBC is warning recent stock market moves look eerily similar to just before 1987’s ‘Black Monday’, which saw the largest one-day market crash in history.
On October 19, 1987, the Dow Jones Industrial Average which comprises the 30 large US publicly traded companies, lost 22.6 percent of its value.
In a note to clients released Wednesday, Murray Gunn, the head of technical analysis for HSBC, said he was on red alert for an imminent sell-off in stocks in the light of the price action over the past few weeks.
"With the US stock market selling off aggressively on October 11, we now issue a RED ALERT. The possibility of a severe fall in the stock market is now very high," Gunn wrote.
Other financial firms have also issued red alert warnings. Citigroup told clients that investors aren't adequately hedging US election risk. The managing director at Citi Thomas Fitzpatrick has also pointed at the market's similarities to the 1987 crash.
The volatility has continued to rise since the end of the summer and the recent sell-off was seen across many areas of the market, and not just selected groups, according to the HSBC analyst.
Last month, Gunn warned stocks were under an "orange alert."Following the Dow Jones’ 200-point decline on Tuesday, Gunn threw up the ultimate warning signal, saying the drop is here.
The key levels that HSBC team is watching are 17,992 in the Dow Jones Industrial Average and 2,116 in the S&P 500.
"As long as those levels remain intact, the bulls still have a slight hope. But should those levels break and the markets close below, which now seems more likely, it would be a clear sign that the bears have taken over and are starting to feast,” Gunn said.
“The possibility of a severe fall in the stock market is now very high," he added.
Well guys...
I guess we are about to rally hard as this is the 2nd article I've found calling for a crash. You know the deal by now, the main stream media (MSM) are paid to mislead the sheep (the retail public... aka, you and I) into the wrong side of the market.
It's clear to me now that they plan to dip a little to make it look like it's going to crash and then they will rip it back up and steal all the money from the sheep that shorted it and put in stop losses. This is so common now and everyone with half a brain can figure out the scam.
Financial advisers and market strategists usually warn their clients that the market's performance in the past is not a reliable guide for its future moves.
But when Citi's Tom Fitzpatrick and his team overlaid the current chart of the benchmark S&P 500 with the index in 1987 — right before the crash — they got "the chills."
On October 19, 1987, the Dow Jones Industrial Average suffered its biggest daily percentage loss, erasing 22.6% of its value. The S&P 500 also crashed.
Fitzpatrick is a top strategist at Citi and studies charts of trading patterns to forecast changes in the stock market.
Besides the similarity in the chart, Fitzpatrick cited four other reasons for his concern about the market right now.
He said in a note on Friday:
There's heightened concern about Europe and its banks. TheUK has set a March 2017 datefor when it will begin legal proceedings to exit the European Union, andDeutsche Bankfailed to reach a swift deal that would lower its $14 billion fine with US authorities.
We're in "the most polarizingUS presidential electionin modern times."
More reports are circulating about central banks inJapanandEuroperemoving some of the economic stimulus they've provided by tapering their bond purchases. This is raising concerns about the efficacy of central bank policy around the world, Fitzpatrick said.
And finally, some peculiar market moves: a 16% move in oil prices within a week; a 20-basis-point shift in US 10-year yields in five days; and a $90 move in gold prices in nine days. The Chinese yuan and British pound have made massive moves in a short period of time, too.
Fitzpatrick said the support level to watch for the S&P 500 is 2,119. That's the critical floor below which traders are unlikely to allow the index to fall; if it breaks support, they'll be looking for a new floor.
On Monday, the S&P 500 opened at 2,165.05 and was up by 0.7% in early trading. It has gained 6% this year.
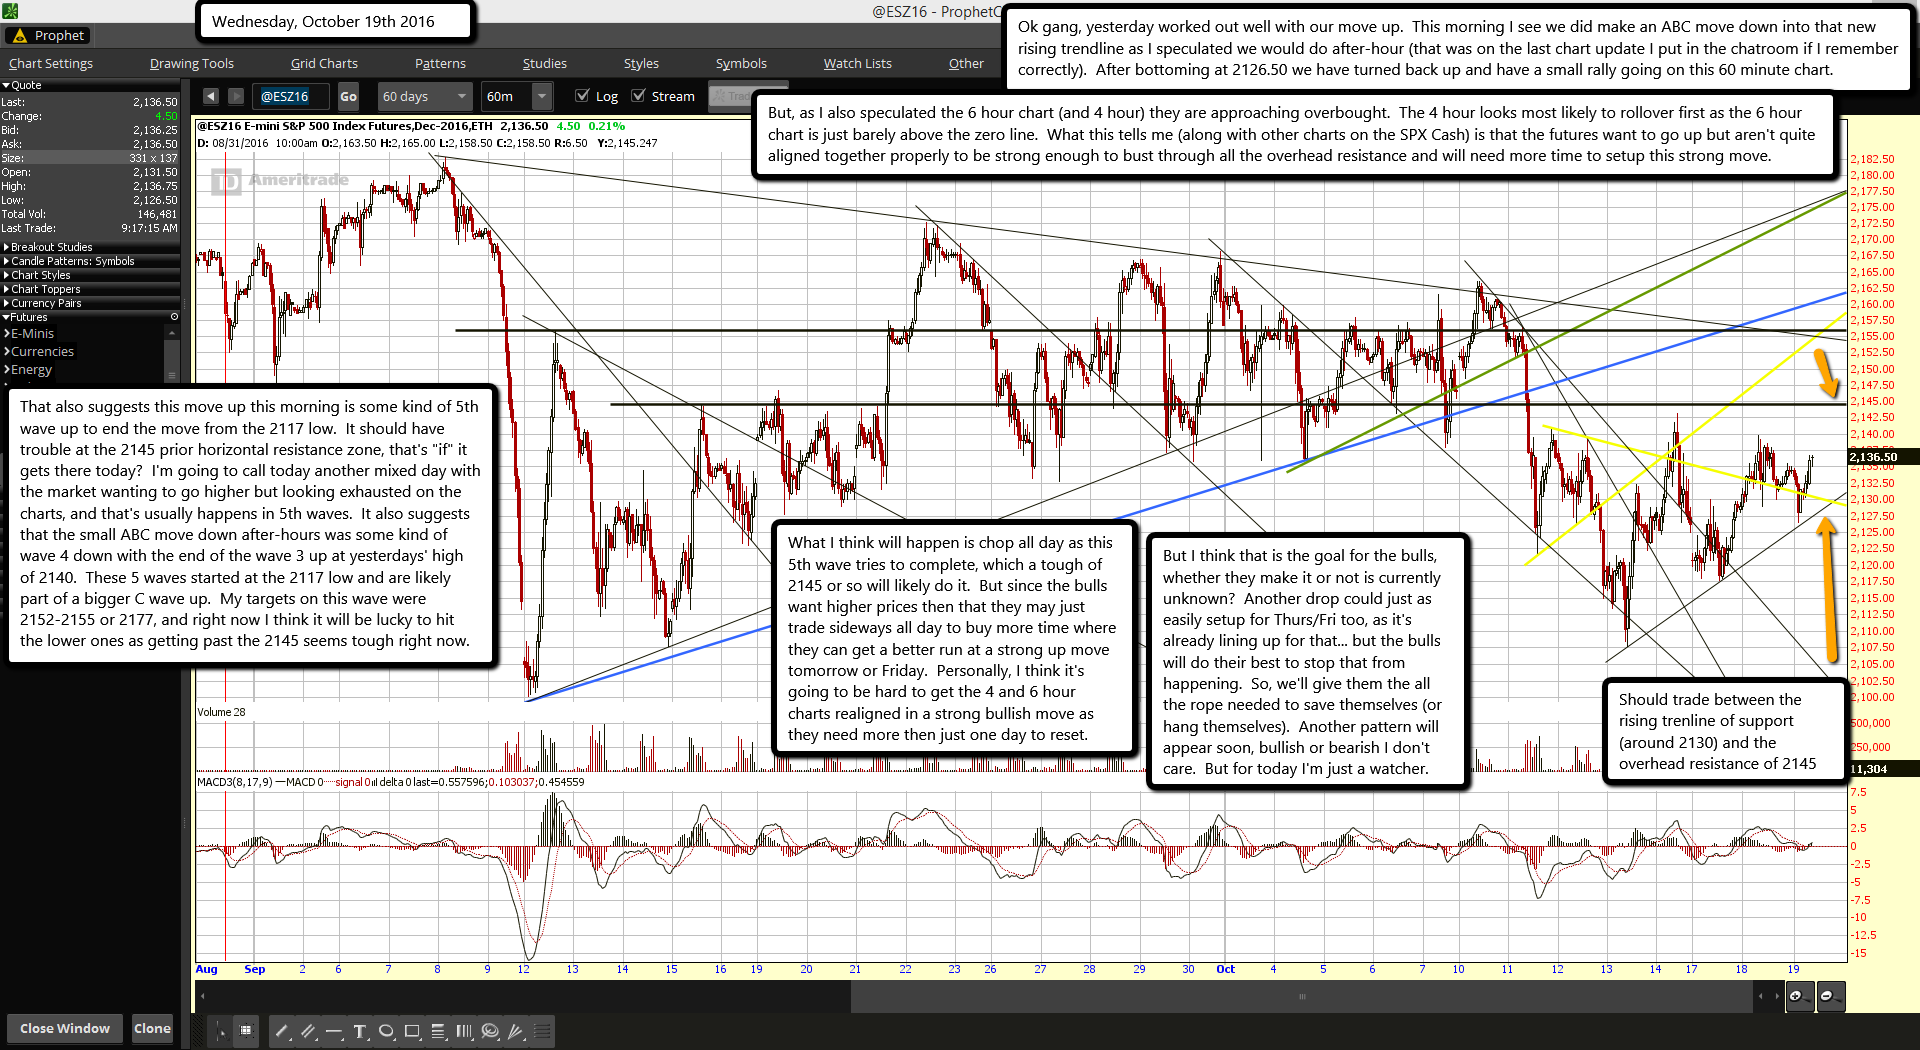
Ok gang, yesterday worked out well with our move up. This morning I see we did make an ABC move down into that new rising trendline as I speculated we would do after-hour (that was on the last chart update I put in the chatroom if I remember correctly). After bottoming at 2126.50 we have turned back up and have a small rally going on this 60 minute chart.
But, as I also speculated the 6 hour chart (and 4 hour) they are approaching overbought. The 4 hour looks most likely to rollover first as the 6 hour chart is just barely above the zero line. What this tells me (along with other charts on the SPX Cash) is that the futures want to go up but aren't quite aligned together properly to be strong enough to bust through all the overhead resistance and will need more time to setup this strong move.
That also suggests this move up this morning is some kind of 5th wave up to end the move from the 2117 low. It should have trouble at the 2145 prior horizontal resistance zone, that's "if" it gets there today? I'm going to call today another mixed day with the market wanting to go higher but looking exhausted on the charts, and that's usually happens in 5th waves. It also suggests that the small ABC move down after-hours was some kind of wave 4 down with the end of the wave 3 up at yesterdays' high of 2140. These 5 waves started at the 2117 low and are likely part of a bigger C wave up. My targets on this wave were 2152-2155 or 2177, and right now I think it will be lucky to hit the lower ones as getting past the 2145 seems tough right now.
What I think will happen is chop all day as this 5th wave tries to complete, which a tough of 2145 or so will likely do it. But since the bulls want higher prices then that they may just trade sideways all day to buy more time where they can get a better run at a strong up move tomorrow or Friday. Personally, I think it's going to be hard to get the 4 and 6 hour charts realigned in a strong bullish move as they need more then just one day to reset.
But I think that is the goal for the bulls, whether they make it or not is currently unknown? Another drop could just as easily setup for Thurs/Fri too, as it's already lining up for that... but the bulls will do their best to stop that from happening. So, we'll give them the all the rope needed to save themselves (or hang themselves). Another pattern will appear soon, bullish or bearish I don't care. But for today I'm just a watcher.
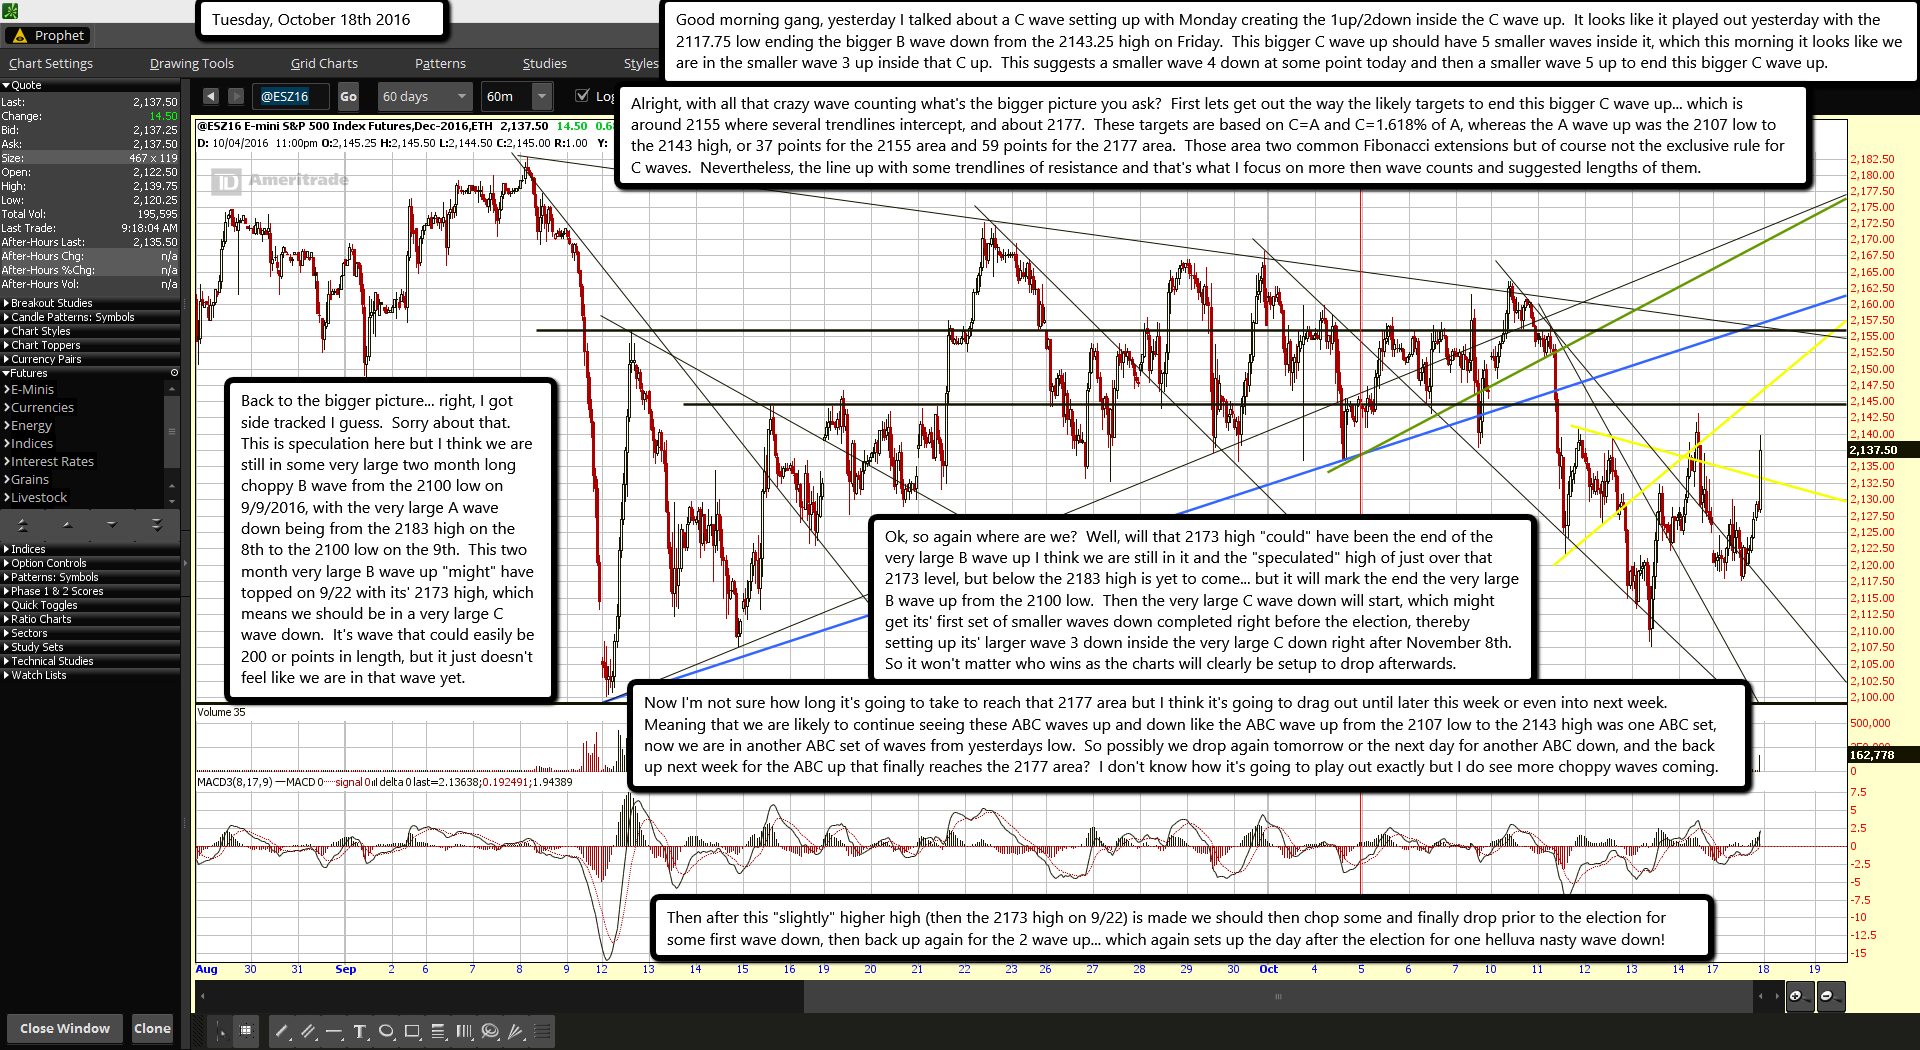
Good morning gang, yesterday I talked about a C wave setting up with Monday creating the 1up/2down inside the C wave up. It looks like it played out yesterday with the 2117.75 low ending the bigger B wave down from the 2143.25 high on Friday. This bigger C wave up should have 5 smaller waves inside it, which this morning it looks like we are in the smaller wave 3 up inside that C up. This suggests a smaller wave 4 down at some point today and then a smaller wave 5 up to end this bigger C wave up.
Alright, with all that crazy wave counting what's the bigger picture you ask? First lets get out the way the likely targets to end this bigger C wave up... which is around 2155 where several trendlines intercept, and about 2177. These targets are based on C=A and C=1.618% of A, whereas the A wave up was the 2107 low to the 2143 high, or 37 points for the 2155 area and 59 points for the 2177 area. Those area two common Fibonacci extensions but of course not the exclusive rule for C waves. Nevertheless, the line up with some trendlines of resistance and that's what I focus on more then wave counts and suggested lengths of them.
Back to the bigger picture... right, I got side tracked I guess. Sorry about that. This is speculation here but I think we are still in some very large two month long choppy B wave from the 2100 low on 9/9/2016, with the very large A wave down being from the 2183 high on the 8th to the 2100 low on the 9th. This two month very large B wave up "might" have topped on 9/22 with its' 2173 high, which means we should be in a very large C wave down. It's wave that could easily be 200 or points in length, but it just doesn't feel like we are in that wave yet.
Ok, so again where are we? Well, will that 2173 high "could" have been the end of the very large B wave up I think we are still in it and the "speculated" high of just over that 2173 level, but below the 2183 high is yet to come... but it will mark the end the very large B wave up from the 2100 low. Then the very large C wave down will start, which might get its' first set of smaller waves down completed right before the election, thereby setting up its' larger wave 3 down inside the very large C down right after November 8th. So it won't matter who wins as the charts will clearly be setup to drop afterwards.
Now I'm not sure how long it's going to take to reach that 2177 area but I think it's going to drag out until later this week or even into next week. Meaning that we are likely to continue seeing these ABC waves up and down like the ABC wave up from the 2107 low to the 2143 high was one ABC set, now we are in another ABC set of waves from yesterdays low. So possibly we drop again tomorrow or the next day for another ABC down, and the back up next week for the ABC up that finally reaches the 2177 area? I don't know how it's going to play out exactly but I do see more choppy waves coming.
Then after this "slightly" higher high (then the 2173 high on 9/22) is made we should then chop some and finally drop prior to the election for some first wave down, then back up again for the 2 wave up... which again sets up the day after the election for one helluva nasty wave down!
Final note for those that went long yesterday... don't be greedy. Take profits as I don't know for certain that this opening gap up will have a smaller wave 4 down and smaller wave 5 up later today. It might only be another ABC pattern move instead of a 5 wave move? So be smart.
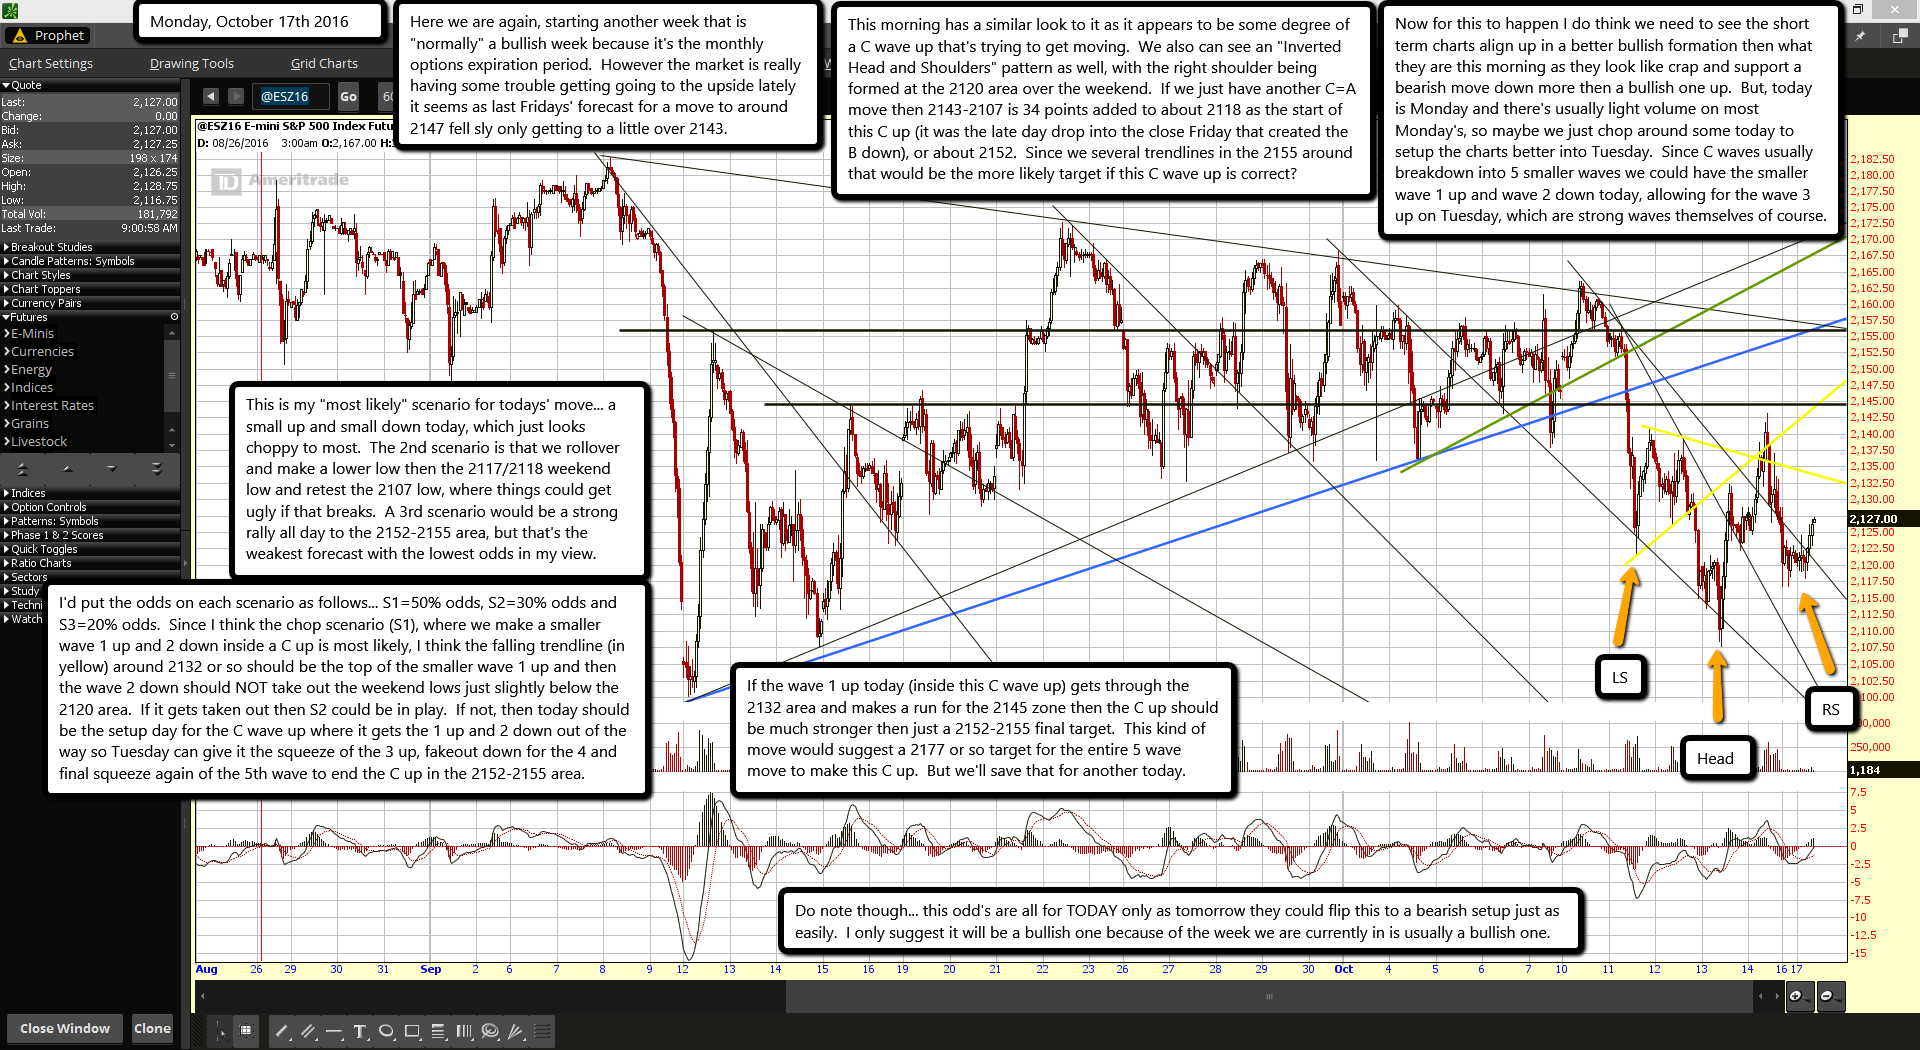
Here we are again, starting another week that is "normally" a bullish week because it's the monthly options expiration period. However the market is really having some trouble getting going to the upside lately it seems as last Fridays' forecast for a move to around 2147 fell sly only getting to a little over 2143.
This morning has a similar look to it as it appears to be some degree of a C wave up that's trying to get moving. We also can see an "Inverted Head and Shoulders" pattern as well, with the right shoulder being formed at the 2120 area over the weekend. If we just have another C=A move then 2143-2107 is 34 points added to about 2118 as the start of this C up (it was the late day drop into the close Friday that created the B down), or about 2152. Since we several trendlines in the 2155 around that would be the more likely target if this C wave up is correct?
Now for this to happen I do think we need to see the short term charts align up in a better bullish formation then what they are this morning as they look like crap and support a bearish move down more then a bullish one up. But, today is Monday and there's usually light volume on most Monday's, so maybe we just chop around some today to setup the charts better into Tuesday. Since C waves usually breakdown into 5 smaller waves we could have the smaller wave 1 up and wave 2 down today, allowing for the wave 3 up on Tuesday, which are strong waves themselves of course.
This is my "most likely" scenario for todays move... a small up and small down today, which just looks choppy to most. The 2nd scenario is that we rollover and make a lower low then the 2117/2118 weekend low and retest the 2107 low, where things could get ugly if that breaks. A 3rd scenario would be a strong rally all day to the 2152-2155 area, but that's the weakest forecast with the lowest odds in my view.
I'd put the odds on each scenario as follows... S1=50% odds, S2=30% odds and S3=20% odds. Since I think the chop scenario (S1), where we make a smaller wave 1 up and 2 down inside a C up is most likely, I think the falling trendline (in yellow) around 2132 or so should be the top of the smaller wave 1 up and then the wave 2 down should NOT take out the weekend lows just slightly below the 2120 area. If it gets taken out then S2 could be in play. If not, then today should be the setup day for the C wave up where it gets the 1 up and 2 down out of the way so Tuesday can give it the squeeze of the 3 up, fakeout down for the 4 and final squeeze again of the 5th wave to end the C up in the 2152-2155 area.
If the wave 1 up today (inside this C wave up) gets through the 2132 area and makes a run for the 2145 zone then the C up should be much stronger then just a 2152-2155 final target. This kind of move would suggest a 2177 or so target for the entire 5 wave move to make this C up. But we'll save that for another today.
Do note though... this odds are all for TODAY only as tomorrow they could flip this to a bearish setup just as easily. I only suggest it will be a bullish one because of the week we are currently in is usually a bullish one.
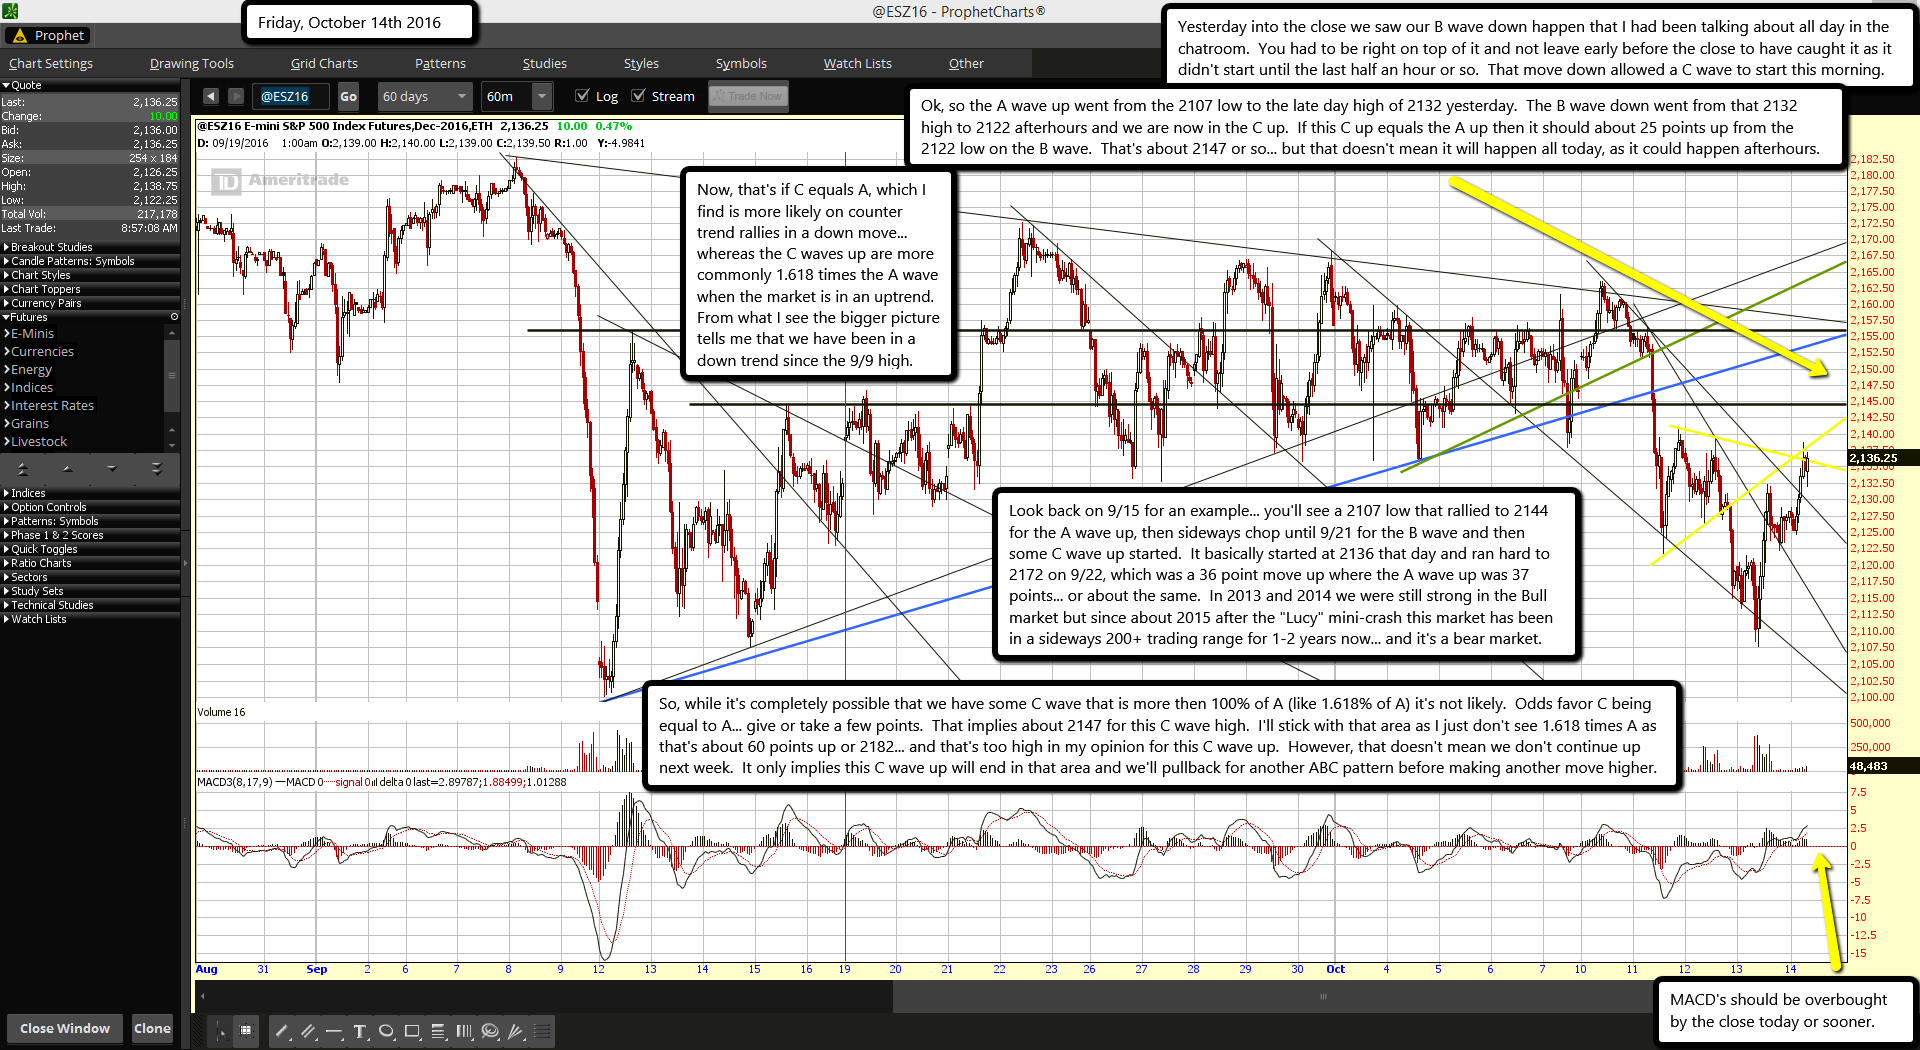
Yesterday into the close we saw our B wave down happen that I had been talking about all day in the chatroom. You had to be right on top of it and not leave early before the close to have caught it as it didn't start until the last half an hour or so. That move down allowed a C wave to start this morning.
Ok, so the A wave up went from the 2107 low to the late day high of 2132 yesterday. The B wave down went from that 2132 high to 2122 afterhours and we are now in the C up. If this C up equals the A up then it should about 25 points up from the 2122 low on the B wave. That's about 2147 or so... but that doesn't mean it will happen all today, as it could happen afterhours.
Now, that's if C equals A, which I find is more likely on counter trend rallies in a down move... whereas the C waves up are more commonly 1.618 times the A wave when the market is in an uptrend. From what I see the bigger picture tells me that we have been in a down trend since the 9/9 high.
Look back on 9/15 for an example... you'll see a 2107 low that rallied to 2144 for the A wave up, then sideways chop until 9/21 for the B wave and then some C wave up started. It basically started at 2136 that day and ran hard to 2172 on 9/22, which was a 36 point move up where the A wave up was 37 points... or about the same. In 2013 and 2014 we were still strong in the Bull market but since about 2015 after the "Lucy" mini-crash this market has been in a sideways 200+ trading range for 1-2 years now... and it's a bear market.
So, while it's completely possible that we have some C wave that is more then 100% of A (like 1.618% of A) it's not likely. Odds favor C being equal to A... give or take a few points. That implies about 2147 for this C wave high. I'll stick with that area as I just don't see 1.618 times A as that's about 60 points up or 2182... and that's too high in my opinion for this C wave up. However, that doesn't mean we don't continue up next week. It only implies this C wave up will end in that area and we'll pullback for another ABC pattern before making another move higher.
Traders work at the Goldman Sachs Group Inc. booth on the floor of the New York Stock Exchange (NYSE).
Goldman Sachs will begin lending money to regular people Thursday, after almost 150 years of avoiding them like the plague. The company that made its name as a banker to big business, government and the rich is launching Marcus, a new consumer finance business named after the bank's founder, Marcus Goldman.
The move has been long anticipated — last spring, Goldman hired an executive from credit card company Discover to lead the new consumer lending business. Since then, Goldman has gone on a hiring spree, plucking talent from the online lending company Lending Club and picking up a former Consumer Financial Protection Bureau official to make sure it stays out of trouble with the regulators.
The first offering from Marcus will be loans for consumers wanting to pay off their credit card debt. The loans, of up to $30,000, will come with fixed interest rates and terms of two to six years. The market for these credit card consolidation loans is highly competitive, and puts Goldman head to head with the biggest online "marketplace lenders" like Lending Club and Prosper. About 60% of Lending Club's loans, the company says, are for refinancing existing loans or paying off credit cards.
Marcus's annual rates will range from 6% to 23%, according to information published Thursday morning on its website. And while Goldman hasn't disclosed exactly how the loans will be underwritten, Marcus says in a disclosure that the rates will depend on borrowers' credit score, credit history, and how long the loan's term is. Marcus's website says that "only the most creditworthy applicants qualify for the lowest rates." Online lending businesses that offer relatively large unsecured loans traditionally target borrowers with good credit, so that they can offer lower rates than credit cards.
But Goldman has hinted that despite some similarities to how other online lenders work, it may have some distinct advantages.
Online lenders like Lending Club have to raise huge amounts of capital or borrow money from investors like hedge funds to be able to pay for all those loans they dish out to customers. Goldman happens to have plenty of money on hand, and can easily fund a consumer lending business. And unlike large banks, Goldman doesn't offer credit cards, meaning the conflict of offering both credit and a loan to pay it off isn't an issue.
At first, Goldman says the loans will be offered to "millions of prospective customers," who will receive an invite in the mail. (Despite being internet-based businesses, big online lenders are massive users of direct mail marketing). Stephen Scherr, the Goldman Sachs executive who heads up its chartered bank and is the company's chief strategy officer, said at a conference last month that Goldman would use a "conventional setup for customer acquisition."
According to the New York Times, the choice of the name Marcus name was the subject of "much internal discussion," and beat out "Samuel," which was the first name of Samuel Sachs, the bank's co-founder. The single first name, reminiscent of startup health insurer Oscar, online mattress retailer Casper or student debt refinancing company Earnest, is "intended to convey a tech-era trendiness from a company that is not known for its youthful bona fides," the Times reported.
"For many who manage debt payments on high-interest rate credit cards, a straightforward personal loan is a better solution," Marcus chief Harit Talwar said in a statement. "Marcus offers an option for consumers who are searching for a simpler alternative to credit card borrowing, where rates can change and multiple fees can be charged."
The lending business is not the company's only foray into Main Street banking. Goldman previously bought GE Capital's online consumer banking business, acquiring some 150,000 accounts and later relaunched and rebranded it as part of GS Bank in April. The bank acquired $8 billion worth of deposits and $8 billion of certificates of deposit as part of the deal, and has since added on some $3 billion more, Scherr said last month.
My thoughts...
If Goldman is now going to lend to the sheep (aka... us, the dumb public) then you know it's a sign that a major top in the stock market is coming soon as that's what happened with the real estate bubble in the end as well. If you remember you couldn't qualify for crap back in 2002 without a perfect credit score, 5-10% down payment, 3-5 years at the same job (with tax returns... no "independent contractors"), but by 2005 that all changed.
You could walk in to a mortgage on a new home with no down payment, no tax returns, no proof a income, and a horrible credit score. If you could fog a mirror you were approved. Of course it topped out and ended around January of 2007 and then the stock market crashed later that year.
Clearly this is a major sign that Goldman is planning on pumping up the stock market for one final wave up of buying... but it will be the sheep buying it as Goldman Sucks sells into it. They know the crash is coming and the exact date I'd bet. But, I don't see this lasting 2 years like the real estate bubble did... instead I'd give it 6-9 months tops.
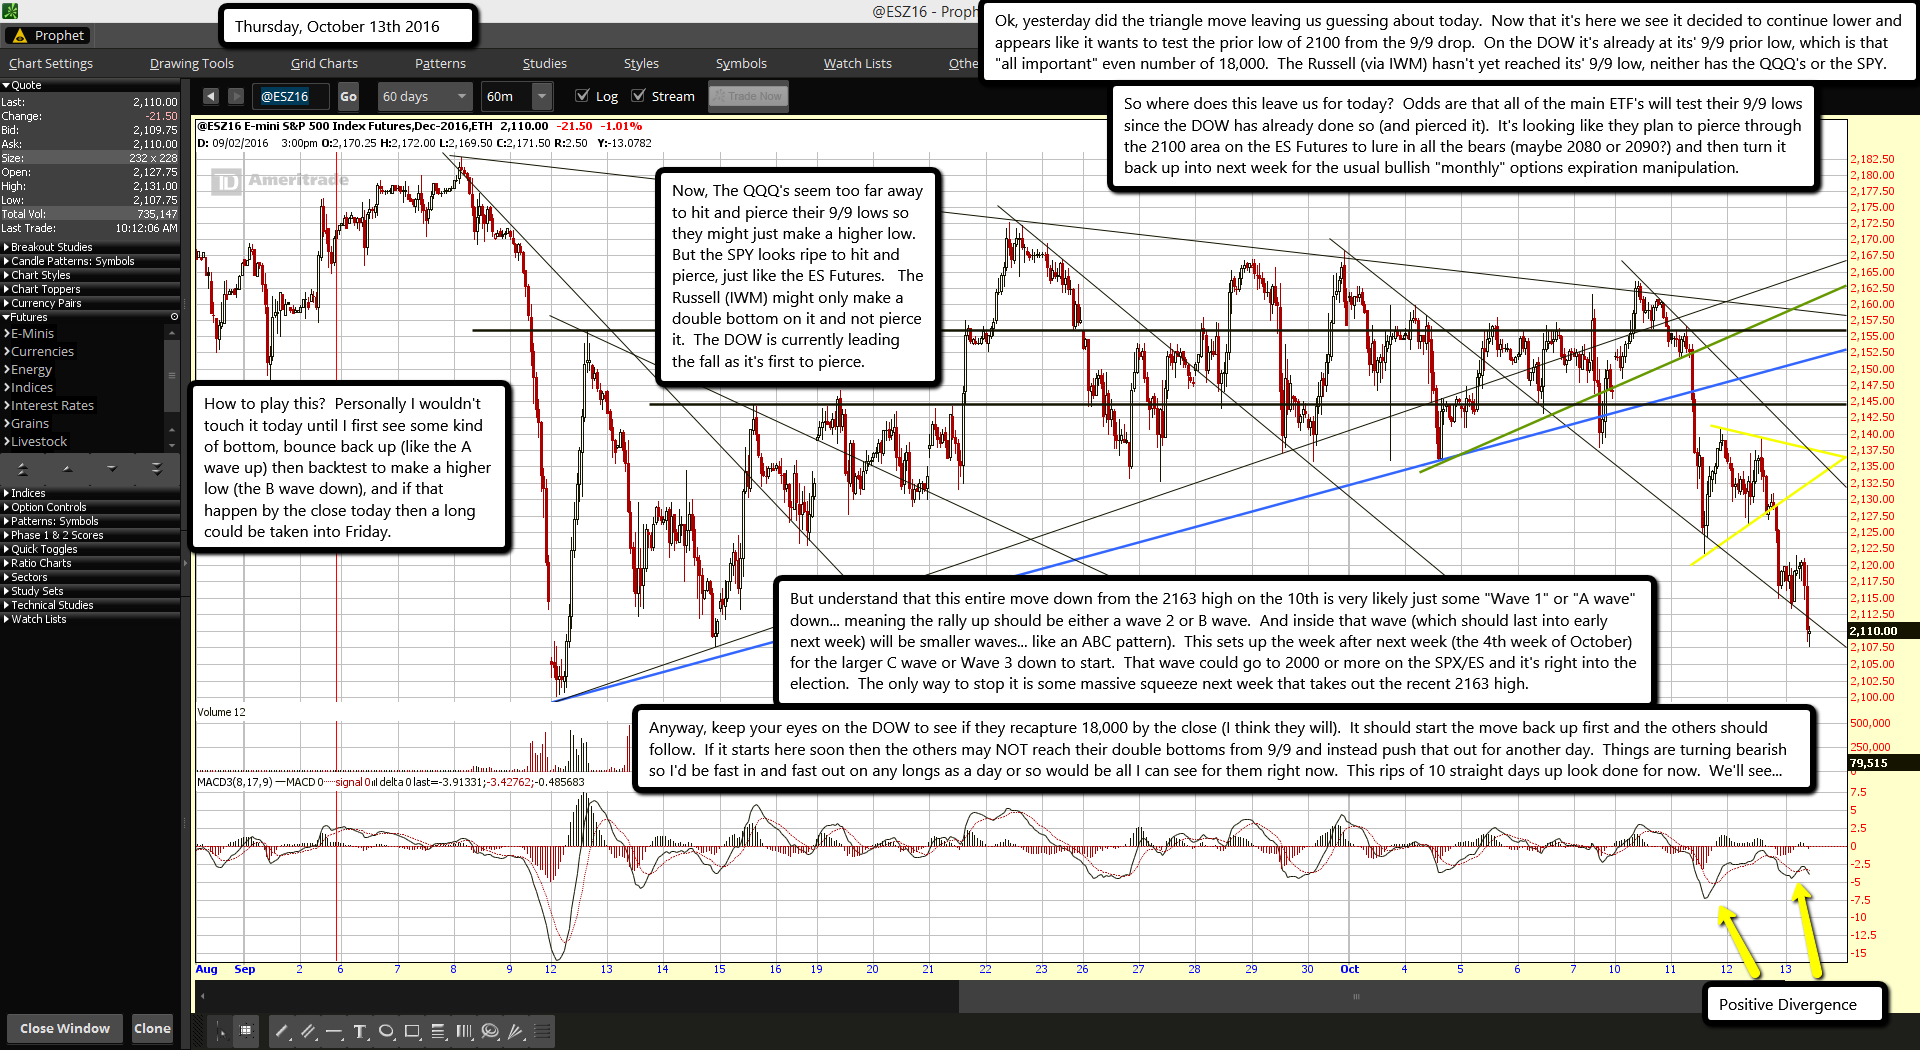
Ok, yesterday did the triangle move leaving us guessing about today. Now that it's here we see it decided to continue lower and appears like it wants to test the prior low of 2100 from the 9/9 drop. On the DOW it's already at its' 9/9 prior low, which is that "all important" even number of 18,000. The Russell (via IWM) hasn't yet reached its' 9/9 low, neither has the QQQ's or the SPY.
So where does this leave us for today? Odds are that all of the main ETF's will test their 9/9 lows since the DOW has already done so (and pierced it). It's looking like they plan to pierce through the 2100 area on the ES Futures to lure in all the bears (maybe 2080 or 2090?) and then turn it back up into next week for the usual bullish "monthly" options expiration manipulation.
Now, The QQQ's seem too far away to hit and pierce their 9/9 lows so they might just make a higher low. But the SPY looks ripe to hit and pierce, just like the ES Futures. The Russell (IWM) might only make a double bottom on it and not pierce it. The DOW is currently leading the fall as it's first to pierce.
How to play this? Personally I wouldn't touch it today until I first see some kind of bottom, bounce back up (like the A wave up) then backtest to make a higher low (the B wave down), and if that happen by the close today then a long could be taken into Friday.
But understand that this entire move down from the 2163 high on the 10th is very likely just some "Wave 1" or "A wave" down... meaning the rally up should be either a wave 2 or B wave. And inside that wave (which should last into early next week) will be smaller waves... like an ABC pattern). This sets up the week after next week (the 4th week of October) for the larger C wave or Wave 3 down to start. That wave could go to 2000 or more on the SPX/ES and it's right into the election. The only way to stop it is some massive squeeze next week that takes out the recent 2163 high.
Anyway, keep your eyes on the DOW to see if they recapture 18,000 by the close (I think they will). It should start the move back up first and the others should follow. If it starts here soon then the others may NOT reach their double bottoms from 9/9 and instead push that out for another day. Things are turning bearish so I'd be fast in and fast out on any longs as a day or so would be all I can see for them right now. This rips of 10 straight days up look done for now. We'll see...
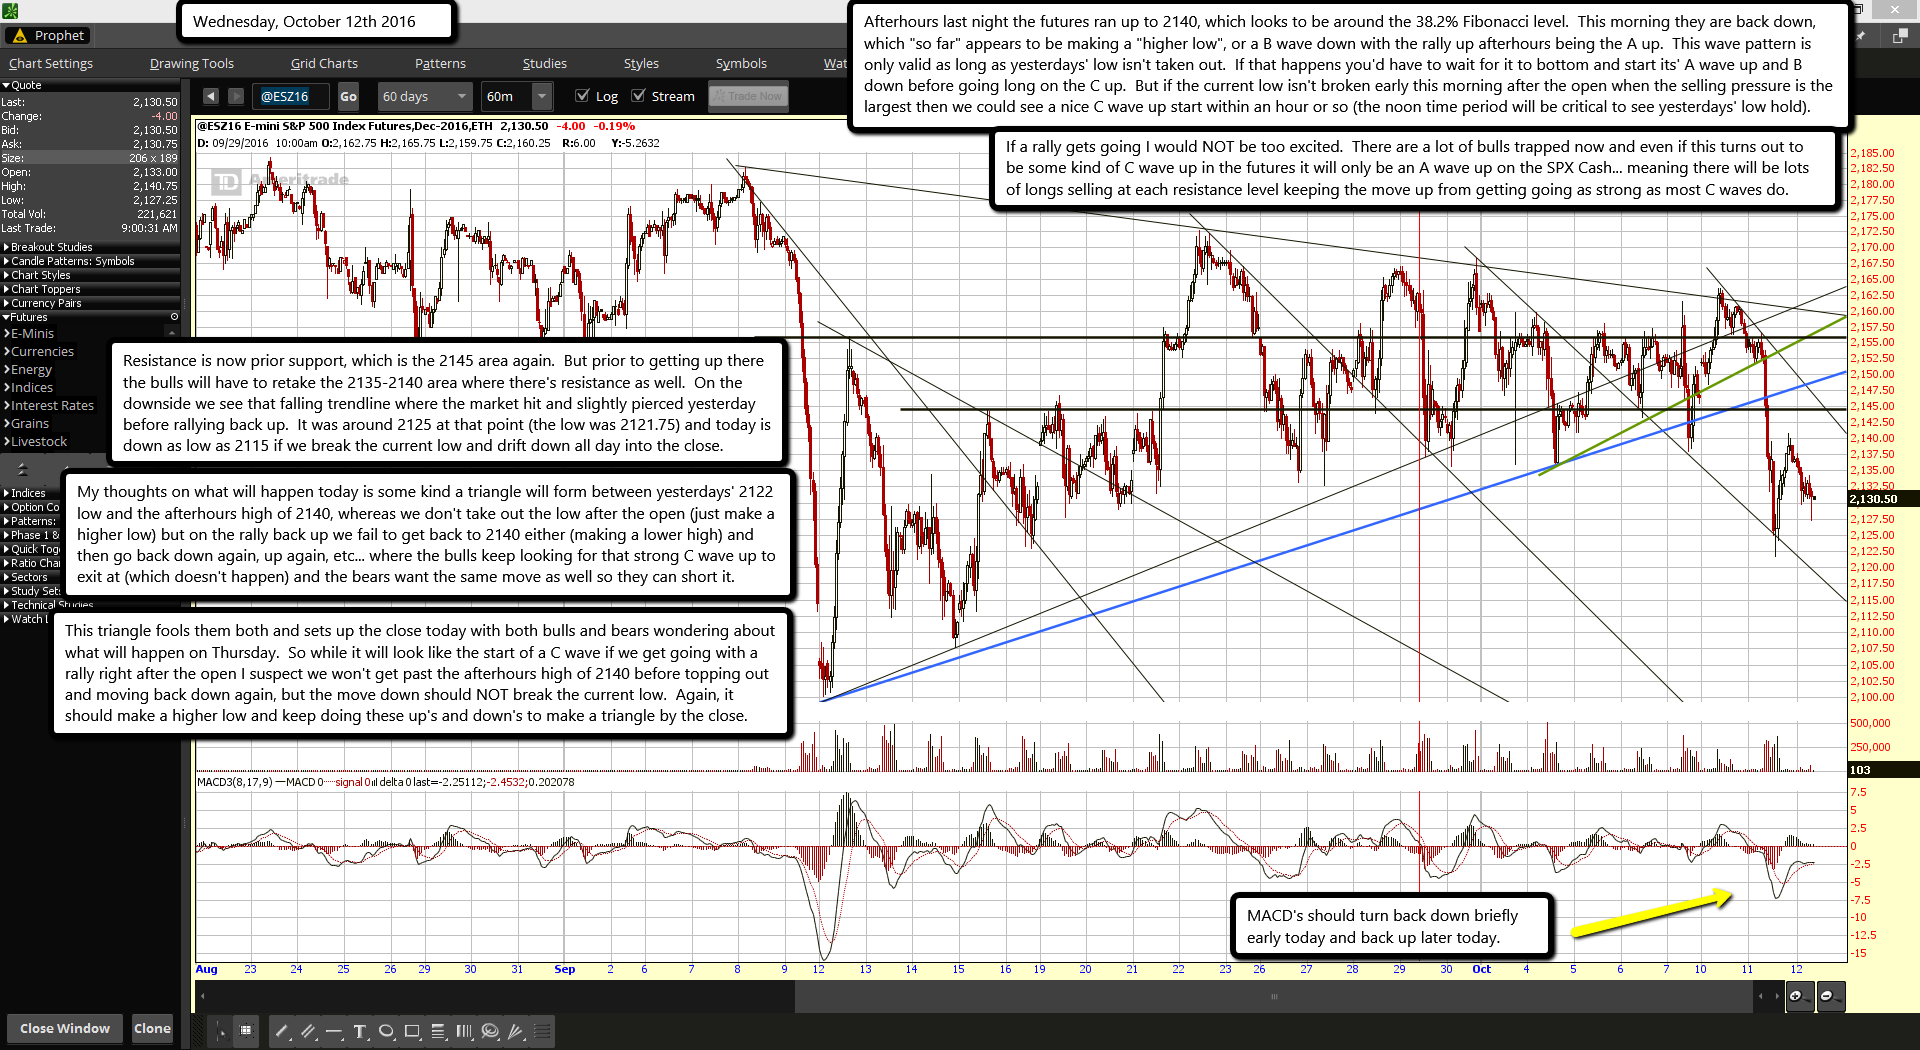
Afterhours last night the futures ran up to 2140, which looks to be around the 38.2% Fibonacci level. This morning they are back down, which "so far" appears to be making a "higher low", or a B wave down with the rally up afterhours being the A up. This wave pattern is only valid as long as yesterdays' low isn't taken out. If that happens you'd have to wait for it to bottom and start its' A wave up and B down before going long on the C up. But if the current low isn't broken early this morning after the open when the selling pressure is the largest then we could see a nice C wave up start within an hour or so (the noon time period will be critical to see yesterdays' low hold).
If a rally gets going I would NOT be too excited. There are a lot of bulls trapped now and even if this turns out to be some kind of C wave up in the futures it will only be an A wave up on the SPX Cash... meaning there will be lots of longs selling at each resistance level keeping the move up from getting going as strong as most C waves do.
Resistance is now prior support, which is the 2145 area again. But prior to getting up there the bulls will have to retake the 2135-2140 area where there's resistance as well. On the downside we see that falling trendline where the market hit and slightly pierced yesterday before rallying back up. It was around 2125 at that point (the low was 2121.75) and today is down as low as 2115 if we break the current low and drift down all day into the close.
My thoughts on what will happen today is some kind a triangle will form between yesterdays' 2122 low and the afterhours high of 2140, whereas we don't take out the low after the open (just make a higher low) but on the rally back up we fail to get back to 2140 either (making a lower high) and then go back down again, up again, etc... where the bulls keep looking for that strong C wave up to exit at (which doesn't happen) and the bears want the same move as well so they can short it.
This triangle fools them both and sets up the close today with both bulls and bears wondering about what will happen on Thursday. So while it will look like the start of a C wave if we get going with a rally right after the open I suspect we won't get past the afterhours high of 2140 before topping out and moving back down again, but the move down should NOT break the current low. Again, it should make a higher low and keep doing these up's and down's to make a triangle by the close.
Los Angeles Councilman Paul Koretz is introducing legislation that would require banks working with the second-largest U.S. city to adhere to responsible practices such as barring sales goals, which have been criticized for leading to the bogus account scandal at Wells Fargo & Co.
In the motion Tuesday, the city would add such consumer protections to its requirements when it solicits proposals from financial institutions for banking services.
The measure, which the council and mayor must approve, doesn’t go as far as other places, such as in Illinois and California, by suspending Wells Fargo from working with the city. But it characterizes the bank’s sales targets as harmful to the community as the firm seeks to repair its battered reputation.
"By incentivizing bank workers to sell more loans and credit cards regardless of the need or quality of those financial products, Wells Fargo’s business practices posed a risk to consumers across the entire financial sector," the motion said.
Settlement’s Fallout
Wells Fargo in September agreed to pay $185 million to resolve claims that employees opened accounts consumers didn’t know about to boost sales tallies. It has since eliminated the goals. Federal prosecutors in New York and San Francisco have opened criminal inquiries. Wells Fargo already faces a raft of lawsuits by fired or demoted workers, customers and investors.
Santa Cruz County Supervisors on Tuesday voted to bar the bank from new business with the California county for a year, according to the clerk’s office. California, Illinois and Chicago are severing business ties with the bank, while Seattle booted the firm from an upcoming bond issue.
The Los Angeles move would be the first to address the practice of sales goals, according to a statement from the Committee for Better Banks, an organization backed by labor groups that’s pushing for the change.
New York’s financial regulator on Tuesday warned state-chartered banks not to link incentives with metrics such as new accounts unless they manage the risks effectively.
Slumping crude prices and a dour start to Wall Street's corporate earnings season pulled down U.S. and European equities on Tuesday, while the dollar hit an eight-month high on increasing bets U.S. interest rates will rise in December.
Wall Street fell more than 1 percent as shares of aluminum producer Alcoa (AA.N) and diagnostics test maker Illumina (ILMN.O) plunged, with worries over the make-up of the U.S. Congress after November's election also weighing on stocks.
Alcoa shares tumbled 11.4 percent and Illumina plummeted 24.8 percent, casting a pall over the market. Wall Street's "fear gauge," the CBOE Market Volatility index .VIX, jumped almost 24 percent at one point and ended the day up 15 percent.
Investors were also jittery about earnings to be reported on Friday by Wells Fargo (WFC.N) and Citigroup (C.N), according to brokerage Seaport Global.
The UK benchmark FTSE 100 equity index .FTSE reversed course after it set a record intraday high that was helped by further sterling weakness.
The British pound has lost more than 4 percent of its value against the dollar over the past week as investors fret about a "hard exit" by Britain from the European Union.
In the United States, investors were looking to Wednesday's release of minutes from the Fed's policy-setting meeting in September for signs of a December interest rate hike.
The futures market perceives a roughly 70 percent chance that the Fed will lift rates in December, a view that pushed the benchmark 10-year U.S. Treasury yield US10YT=RR to a more than four-month high.
"Recent data on jobs, manufacturing and services growth have shown compelling strength that could greenlight a U.S. rate hike by the end of the year," said Joe Manimbo, senior market analyst at Western Union Business Solutions in Washington.
The dollar index, which measures the greenback against six major currencies, was up 0.74 percent at 97.651 .DXY after hitting 97.731, its highest since late July.
The euro fell to more than a two-month low against the dollar and was last down 0.72 percent at $1.1057 EUR=. Against the yen, the dollar was down 0.14 percent at 103.43 JPY=.
Crude prices retreated from one-year highs on concerns a proposed production cut by the world's largest oil exporters might not be enough to reduce a global glut.
The International Energy Agency said it was unclear how rapidly global oil supply could fall in line with demand even if Russia and OPEC agreed on a steep enough cut.
Brent crude oil LCOc1 settled down 73 cents at $52.41 a barrel and U.S. West Texas Intermediate crude CLc1 slipped 56 cents to settle at $50.79.
The Dow Jones industrial average .DJI closed down 200.38 points, or 1.09 percent, to 18,128.66. The S&P 500 .SPX fell 26.93 points, or 1.24 percent, to 2,136.73 and the Nasdaq Composite .IXIC lost 81.89 points, or 1.54 percent, to 5,246.79.
The market is in a corrective phase, with overvalued dividend stocks being sold, said Rahul Shah, chief executive of Ideal Asset Management.
"If we grind forward like this and you have overvalued sectors come down and undervalued sectors rise, you could set the base for a market that could have a strong rally in the future," Shah said.
In Europe, the pan-regional FTSEurofirst 300 index .FTEU3 fell 0.6 percent to close at 1,342.19. MSCI's all-country stock index .MIWD00000PUS fell 1.18 percent.
Weaker commodity stocks weighed in Europe. The STOXX Oil & Gas index .SXEP fell 1.5 percent, making it the region's second-biggest sector loser after the STOXX Basic Resources index .SXPP, which fell 2.1 percent as metal prices retreated.
The 10-year U.S. Treasury note fell 8/32 in price to yield 1.7638 percent.
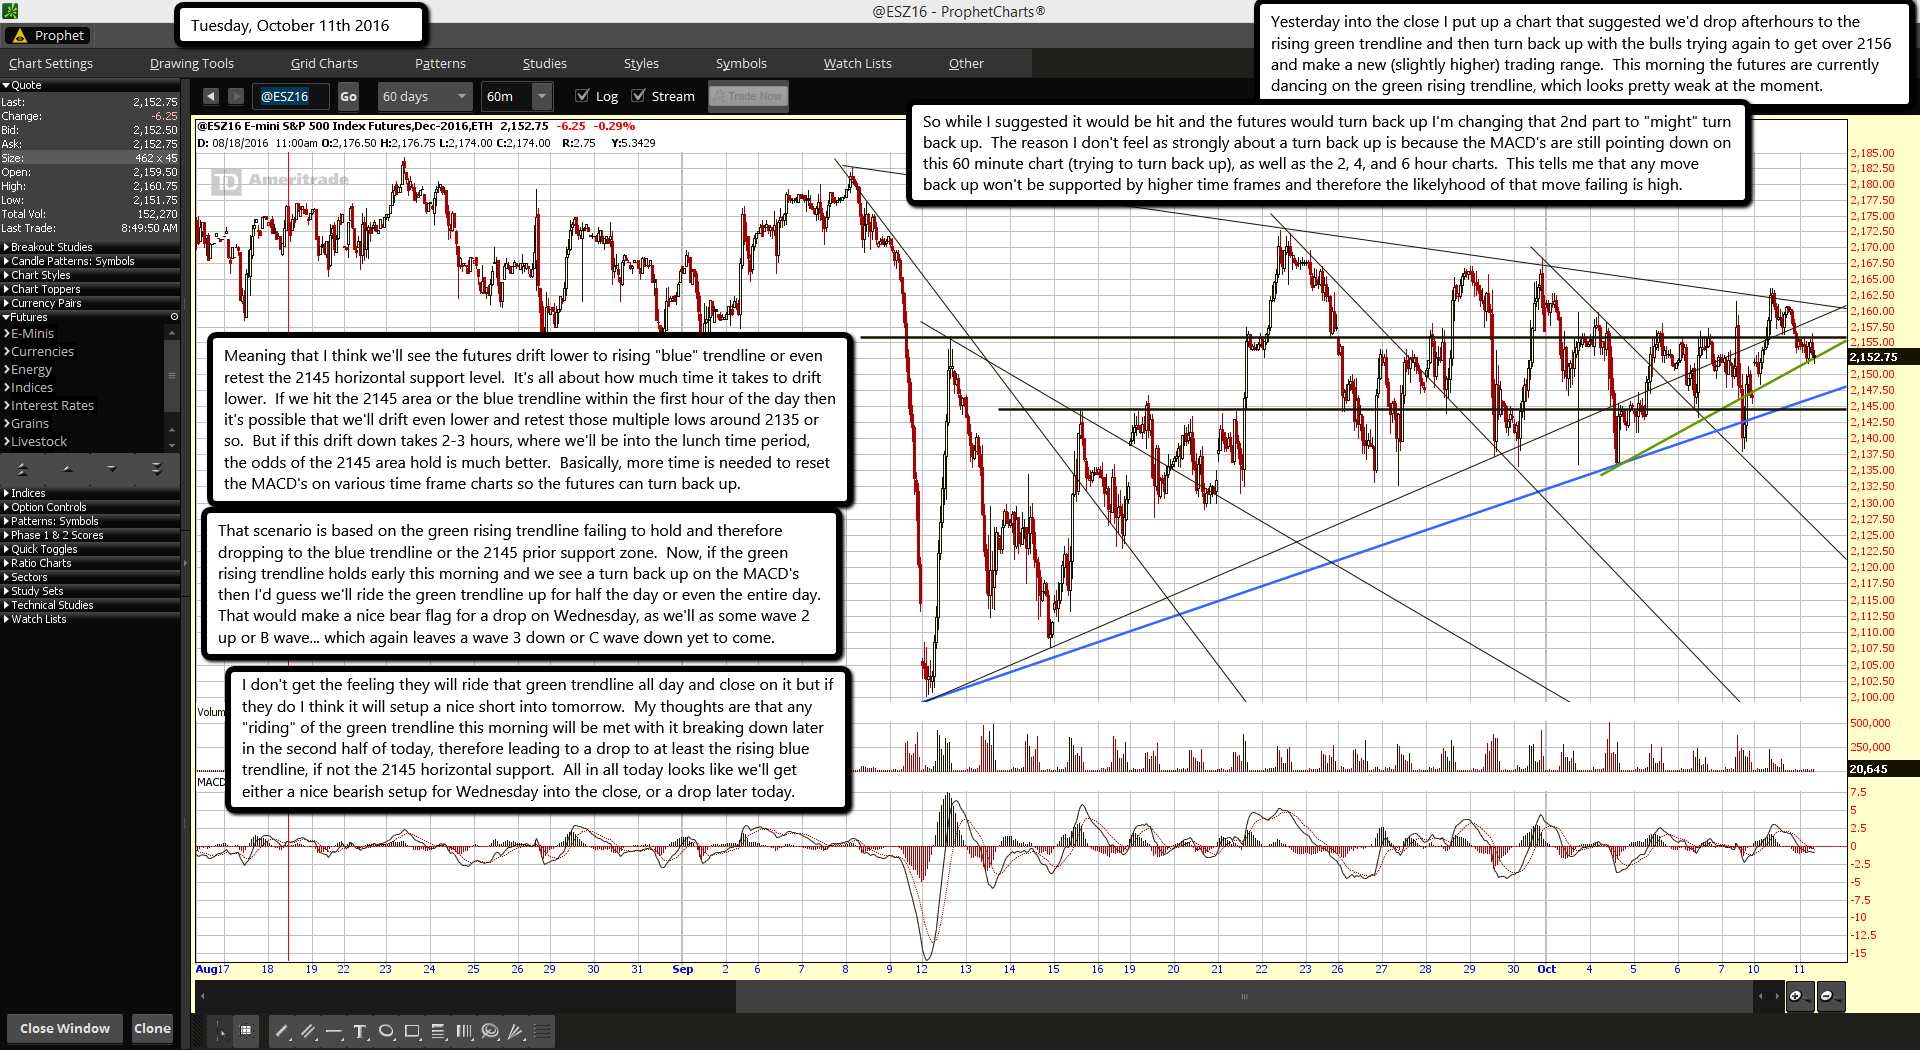
Yesterday into the close I put up a chart that suggested we'd drop afterhours to the rising green trendline and then turn back up with the bulls trying again to get over 2156 and make a new (slightly higher) trading range. This morning the futures are currently dancing on the green rising trendline, which looks pretty weak at the moment.
So while I suggested it would be hit and the futures would turn back up I'm changing that 2nd part to "might" turn back up. The reason I don't feel as strongly about a turn back up is because the MACD's are still pointing down on this 60 minute chart (trying to turn back up), as well as the 2, 4, and 6 hour charts. This tells me that any move back up won't be supported by higher time frames and therefore the likely-hood of that move failing is high.
Meaning that I think we'll see the futures drift lower to rising "blue" trendline or even retest the 2145 horizontal support level. It's all about how much time it takes to drift lower. If we hit the 2145 area or the blue trendline within the first hour of the day then it's possible that we'll drift even lower and retest those multiple lows around 2135 or so. But if this drift down takes 2-3 hours, where we'll be into the lunch time period, the odds of the 2145 area hold is much better. Basically, more time is needed to reset the MACD's on various time frame charts so the futures can turn back up.
That scenario is based on the green rising trendline failing to hold and therefore dropping to the blue trendline or the 2145 prior support zone. Now, if the green rising trendline holds early this morning and we see a turn back up on the MACD's then I'd guess we'll ride the green trendline up for half the day or even the entire day. That would make a nice bear flag for a drop on Wednesday, as we'll as some wave 2 up or B wave... which again leaves a wave 3 down or C wave down yet to come.
I don't get the feeling they will ride that green trendline all day and close on it but if they do I think it will setup a nice short into tomorrow. My thoughts are that any "riding" of the green trendline this morning will be met with it breaking down later in the second half of today, therefore leading to a drop to at least the rising blue trendline, if not the 2145 horizontal support. All in all today looks like we'll get either a nice bearish setup for Wednesday into the close, or a drop later today.
Worldwide public and private debt is at an all-time high, posing a substantial impediment to getting global economic growth back to normal, the International Monetary Fund has said.
The easy money policies of the world's top central banks has fed the problem, stoking a private-sector credit binge in China and rising public debt in some low-income countries, the IMF said in a new report.
Meanwhile, slow economic growth is making it hard for both companies and countries to cut their debt burdens - a process that can also drag on growth momentum because deleveraging companies slow spending and investment.
Without deleveraging, however, countries run the risk of fresh financial crises that can turn into deep recessions, the IMF's Fiscal Monitor report says.
"For a significant deleveraging to take place, restoring robust growth and returning to normal levels of inflation is necessary," the fund said.
Getting there requires governments to stimulate growth though investment, certain fiscal and business reforms, and targeted programs to help heavily indebted companies lower their debts.
"Global debt is at record highs and rising," the IMF's Fiscal Affairs Department chief Vitor Gaspar said.
Public and private debt -- excluding the financial sector's - at the end of last year hit $152 trillion, with around two-thirds owed by the private sector, the report said.
Measured against the size of the world economy, it rose from less than 200 percent of global GDP to 225 percent over the 15 years to 2015.
Debt at such levels while economic growth remains tepid heightens the risk of financial crises, Gaspar said.
"High debt levels are costly as they often end up in financial recessions that are deeper and longer than normal recessions," he said in comments accompanying the report.
Moreover, "excessive private debt is a major headwind against the global recovery and a risk to financial stability."
While central banks have had to cut interest rates to support the recovery from the 2008 financial crisis, that has encouraged the debt pileup, the report said.
Dealing with the problem requires governments to implement well-calibrated programs to reduce private debt -- by cleaning up poor balance sheets of European banks and non-financial companies in China.
"Generally, where the financial system is under severe stress," the report said, "resolving the underlying problem quickly is critical."
IMF singles out Australia as global debt levels hit $US152 trillion
The International Monetary Fund has singled out Australia as one of few countries where debt is increasing and bucking the global trend.
In its latest Fiscal Monitor, the IMF says after the global financial crisis, government debt in advanced economies rose rapidly, while private debt reached a turning point in 2012.
Australians are accumulating debt at a 'fast pace', the IMF has warned. Photo: Chris Hopkins
The largest reductions since were posted by those countries that entered the crisis with high debt levels.
"In some cases, however, private debt has continued to accumulate at a fast pace - notably, Australia, Canada and Singapore," it said in the report released in Washington on Wednesday."
Gross debt in the non-financial sector has more than doubled in nominal terms since the turn of the century, reaching $US152 trillion ($199 trillion) last year, and it's still rising, the International Monetary Fund said.
At a staggering 225 per cent of world GDP, non-financial sector global debt is at an all-time high.
The figure includes debt held by governments, non-financial firms and households.
Two-thirds, amounting to about $US100 trillion, consists of liabilities of the private sector which can carry great risks when they reach excessive levels, it warns.
At a staggering 225 per cent of world GDP, non-financial sector global debt is at an all-time high. Photo: Louise Kennerley
"Resolving the 'private debt overhang' is ... not easy in the current global environment of low nominal growth," the IMF admits.
Slow global growth is making it difficult to pay off the obligations, "setting the stage for a vicious feedback loop in which lower growth hampers deleveraging and the debt overhang exacerbates the slowdown," said the Washington-based fund.
"Excessive private debt is a major headwind against the global recovery and a risk to financial stability," IMF fiscal chief Vitor Gaspar said in prepared remarks. "History has taught us that it is very easy to underestimate the risks associated with private debt during the upswing."
Much of the borrowing dates back to the boom in private debt that preceded the 2008 financial crisis, according to the IMF. While households and companies in advanced economies started to retrench following the crisis, the deleveraging has been uneven and in some instances debts kept rising, Gaspar said. Bad debts have ended up on government balance sheets.
There's no consensus on what levels of debt-to-GDP should be the considered alarming, the IMF said. However, financial crises tend to be associated with excessive private debt in both advanced and emerging economies, the fund said. In addition, research has shown that high debt is linked with lower growth, even when a crisis is avoided.
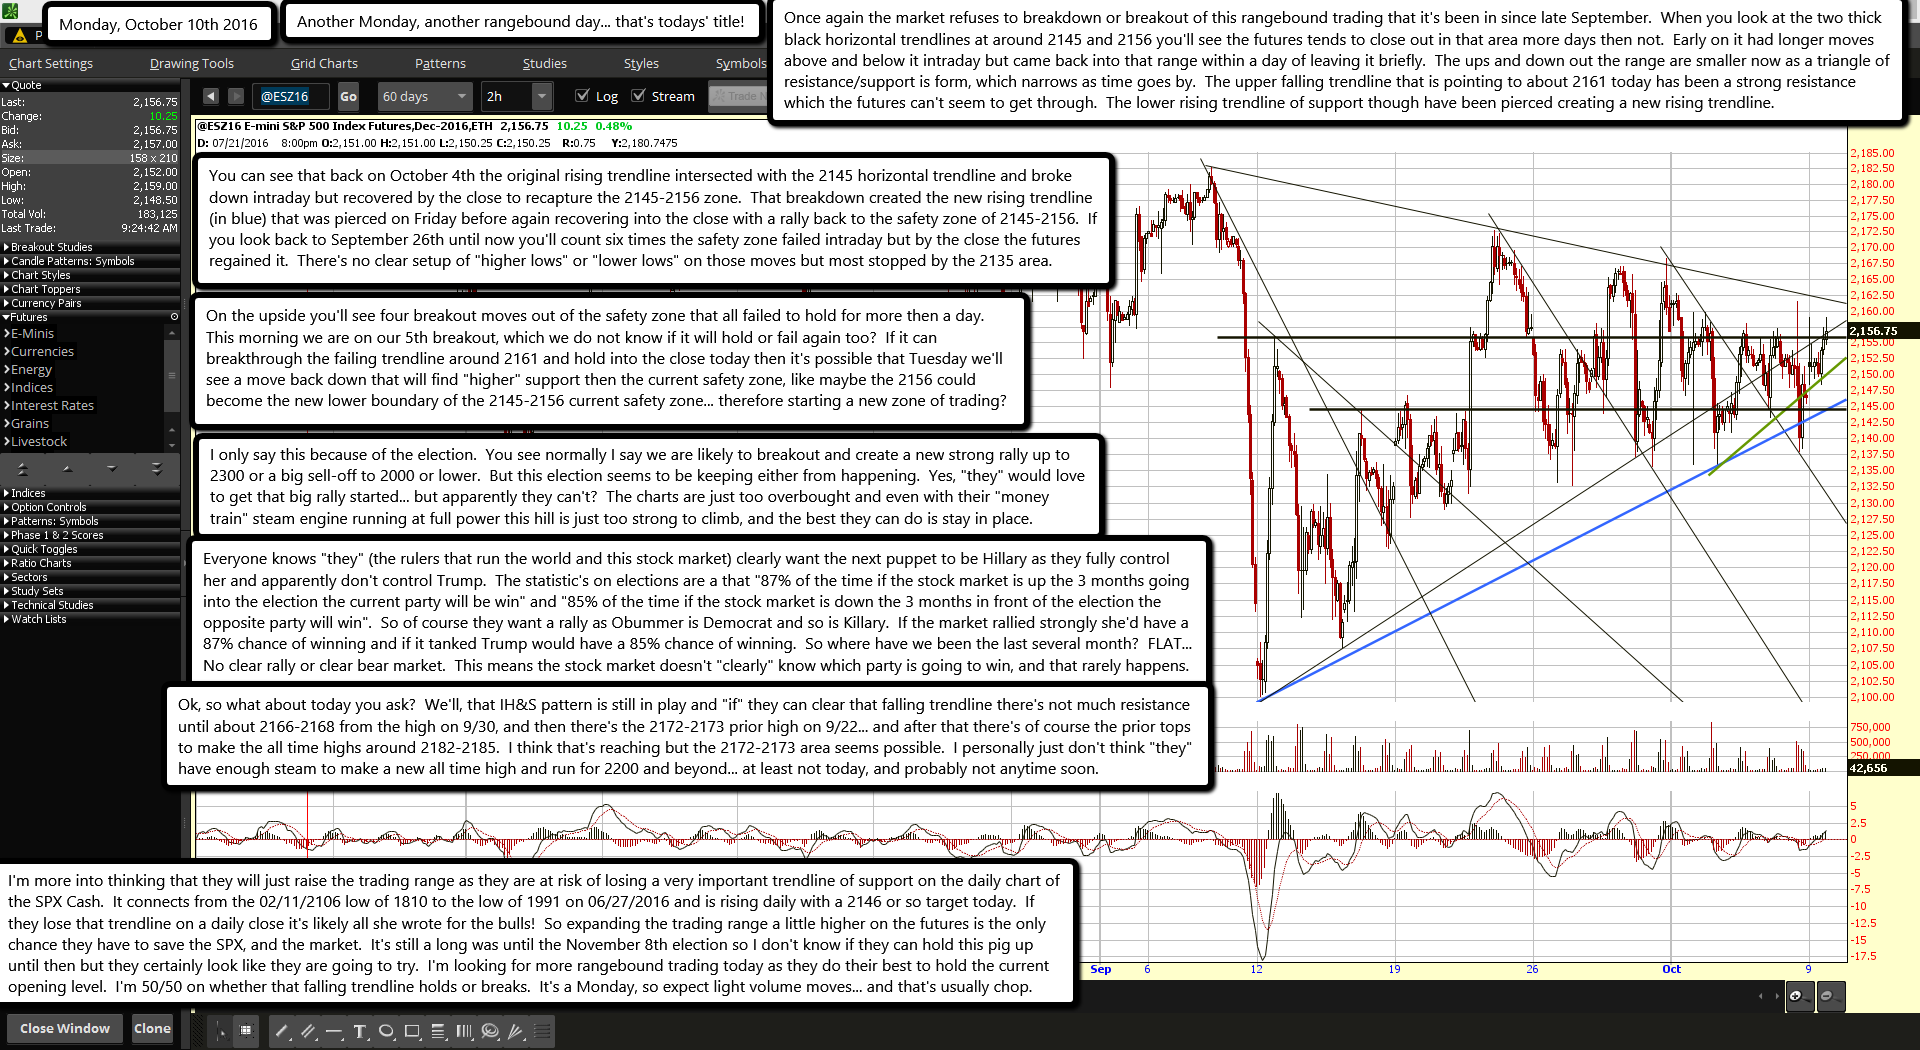
Another Monday, another rangebound day... that's todays' title!
Once again the market refuses to breakdown or breakout of this rangebound trading that it's been in since late September. When you look at the two thick black horizontal trendlines at around 2145 and 2156 you'll see the futures tends to close out in that area more days then not. Early on it had longer moves above and below it intraday but came back into that range within a day of leaving it briefly. The ups and down out the range are smaller now as a triangle of resistance/support is form, which narrows as time goes by. The upper falling trendline that is pointing to about 2161 today has been a strong resistance which the futures can't seem to get through. The lower rising trendline of support though have been pierced creating a new rising trendline.
You can see that back on October 4th the original rising trendline intersected with the 2145 horizontal trendline and broke down intraday but recovered by the close to recapture the 2145-2156 zone. That breakdown created the new rising trendline (in blue) that was pierced on Friday before again recovering into the close with a rally back to the safety zone of 2145-2156. If you look back to September 26th until now you'll count six times the safety zone failed intraday but by the close the futures regained it. There's no clear setup of "higher lows" or "lower lows" on those moves but most stopped by the 2135 area.
On the upside you'll see four breakout moves out of the safety zone that all failed to hold for more then a day. This morning we are on our 5th breakout, which we do not know if it will hold or fail again too? If it can breakthrough the failing trendline around 2161 and hold into the close today then it's possible that Tuesday we'll see a move back down that will find "higher" support then the current safety zone, like maybe the 2156 could become the new lower boundary of the 2145-2156 current safety zone... therefore starting a new zone of trading?
I only say this because of the election. You see normally I say we are likely to breakout and create a new strong rally up to 2300 or a big sell-off to 2000 or lower. But this election seems to be keeping either from happening. Yes, "they" would love to get that big rally started... but apparently they can't? The charts are just too overbought and even with their "money train" steam engine running at full power this hill is just too strong to climb, and the best they can do is stay in place.
Everyone knows "they" (the rulers that run the world and this stock market) clearly want the next puppet to be Hillary as they fully control her and apparently don't control Trump. The statistic's on elections are a that "87% of the time if the stock market is up the 3 months going into the election the current party will be win" and "85% of the time if the stock market is down the 3 months in front of the election the opposite party will win". So of course they want a rally as Obummer is Democrat and so is Killary. If the market rallied strongly she'd have a 87% chance of winning and if it tanked Trump would have a 85% chance of winning. So where have we been the last several month? FLAT... No clear rally or clear bear market. This means the stock market doesn't "clearly" know which party is going to win, and that rarely happens.
Ok, so what about today you ask? We'll, that IH&S pattern is still in play and "if" they can clear that falling trendline there's not much resistance until about 2166-2168 from the high on 9/30, and then there's the 2172-2173 prior high on 9/22... and after that there's of course the prior tops to make the all time highs around 2182-2185. I think that's reaching but the 2172-2173 area seems possible. I personally just don't think "they" have enough steam to make a new all time high and run for 2200 and beyond... at least not today, and probably not anytime soon.
I'm more into thinking that they will just raise the trading range as they are at risk of losing a very important trendline of support on the daily chart of the SPX Cash. It connects from the 02/11/2106 low of 1810 to the low of 1991 on 06/27/2016 and is rising daily with a 2146 or so target today. If they lose that trendline on a daily close it's likely all she wrote for the bulls! So expanding the trading range a little higher on the futures is the only chance they have to save the SPX, and the market. It's still a long was until the November 8th election so I don't know if they can hold this pig up until then but they certainly look like they are going to try. I'm looking for more rangebound trading today as they do their best to hold the current opening level. I'm 50/50 on whether that falling trendline holds or breaks. It's a Monday, so expect light volume moves... and that's usually chop.
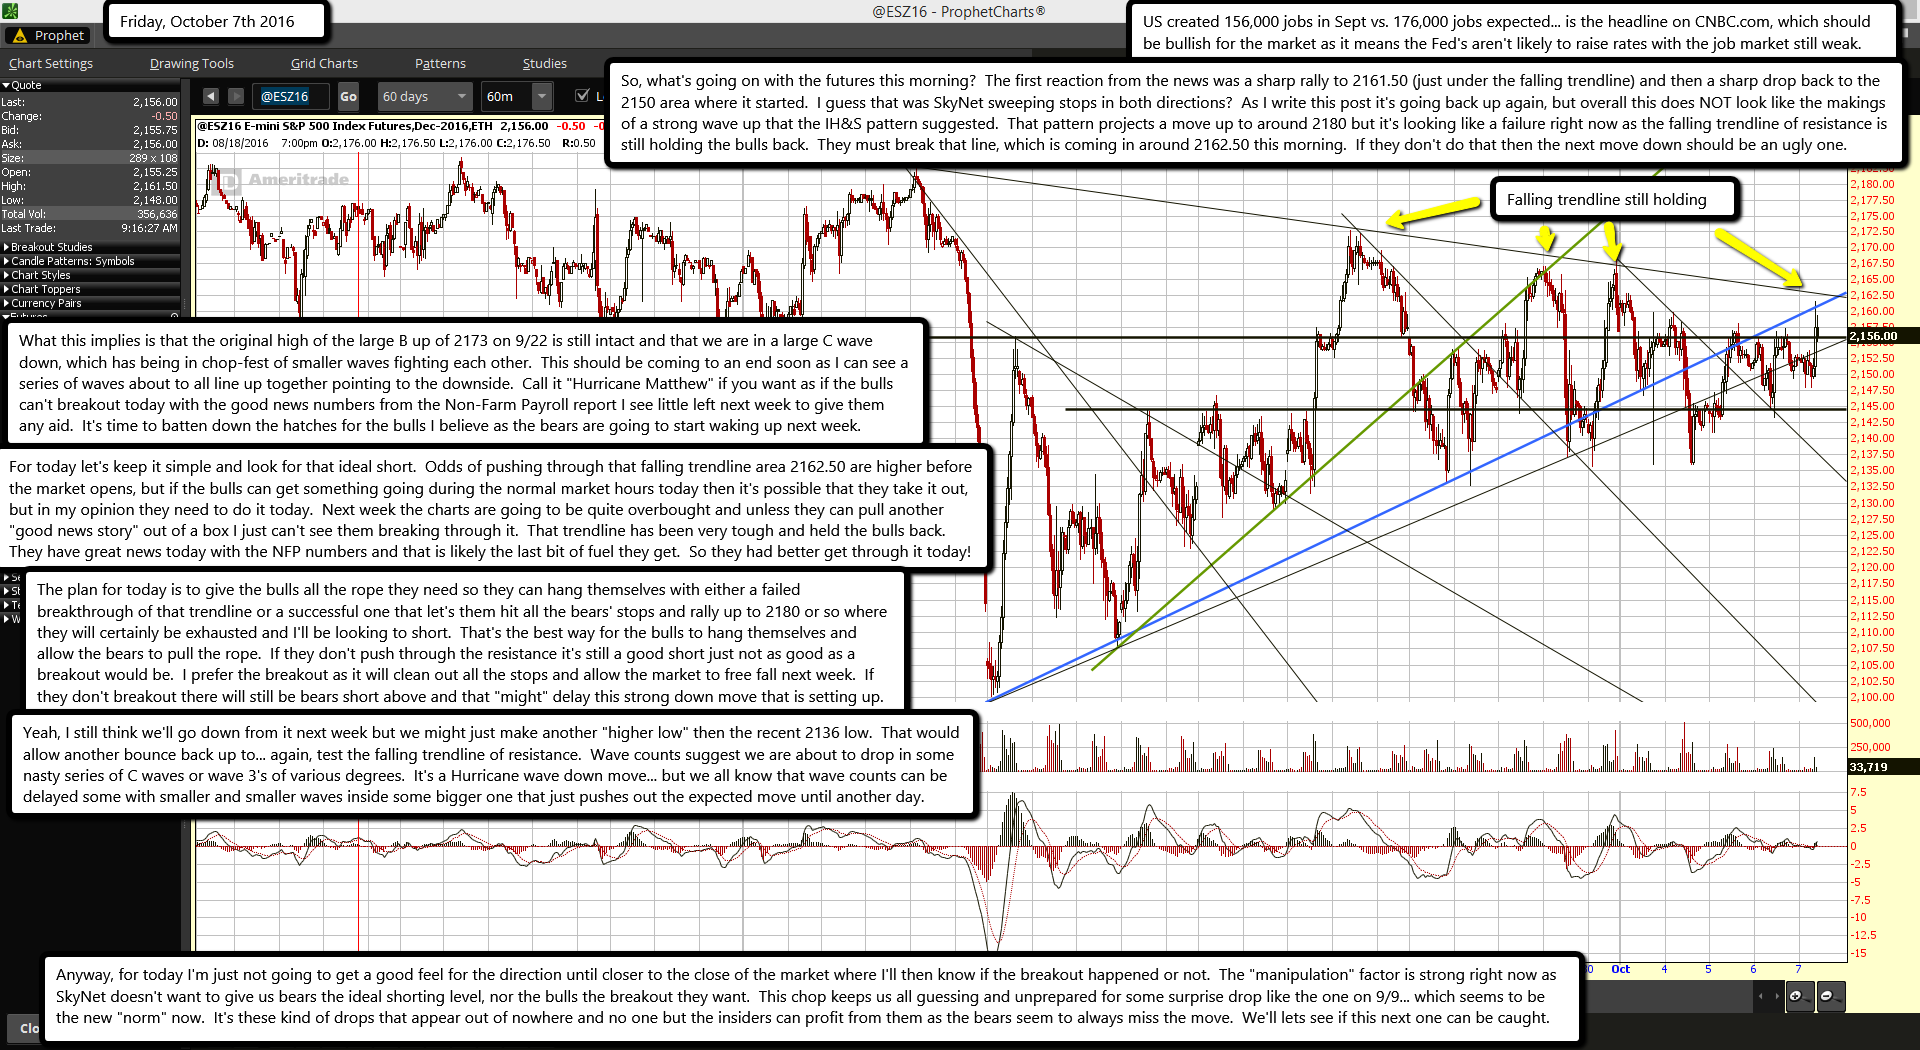
US created 156,000 jobs in Sept vs. 176,000 jobs expected... is the headline on CNBC.com, which should be bullish for the market as it means the Fed's aren't likely to raise rates with the job market still weak.
So, what's going on with the futures this morning? The first reaction from the news was a sharp rally to 2161.50 (just under the falling trendline) and then a sharp drop back to the 2150 area where it started. I guess that was SkyNet sweeping stops in both directions? As I write this post it's going back up again, but overall this does NOT look like the makings of a strong wave up that the IH&S pattern suggested. That pattern projects a move up to around 2180 but it's looking like a failure right now as the falling trendline of resistance is still holding the bulls back. They must break that line, which is coming in around 2162.50 this morning. If they don't do that then the next move down should be an ugly one.
What this implies is that the original high of the large B up of 2173 on 9/22 is still intact and that we are in a large C wave down, which has being in chop-fest of smaller waves fighting each other. This should be coming to an end soon as I can see a series of waves about to all line up together pointing to the downside. Call it "Hurricane Matthew" if you want as if the bulls can't breakout today with the good news numbers from the Non-Farm Payroll report I see little left next week to give them any aid. It's time to batten down the hatches for the bulls I believe as the bears are going to start waking up next week.
For today let's keep it simple and look for that ideal short. Odds of pushing through that falling trendline area 2162.50 are higher before the market opens, but if the bulls can get something going during the normal market hours today then it's possible that they take it out, but in my opinion they need to do it today. Next week the charts are going to be quite overbought and unless they can pull another "good news story" out of a box I just can't see them breaking through it. That trendline has been very tough and held the bulls back. They have great news today with the NFP numbers and that is likely the last bit of fuel they get. So they had better get through it today!
The plan for today is to give the bulls all the rope they need so they can hang themselves with either a failed breakthrough of that trendline or a successful one that let's them hit all the bears' stops and rally up to 2180 or so where they will certainly be exhausted and I'll be looking to short. That's the best way for the bulls to hang themselves and allow the bears to pull the rope. If they don't push through the resistance it's still a good short just not as good as a breakout would be. I prefer the breakout as it will clean out all the stops and allow the market to free fall next week. If they don't breakout there will still be bears short above and that "might" delay this strong down move that is setting up.
Yeah, I still think we'll go down from it next week but we might just make another "higher low" then the recent 2136 low. That would allow another bounce back up to... again, test the falling trendline of resistance. Wave counts suggest we are about to drop in some nasty series of C waves or wave 3's of various degrees. It's a Hurricane wave down move... but we all know that wave counts can be delayed some with smaller and smaller waves inside some bigger one that just pushes out the expected move until another day.
Anyway, for today I'm just not going to get a good feel for the direction until closer to the close of the market where I'll then know if the breakout happened or not. The "manipulation" factor is strong right now as SkyNet doesn't want to give us bears the ideal shorting level, nor the bulls the breakout they want. This chop keeps us all guessing and unprepared for some surprise drop like the one on 9/9... which seems to be the new "norm" now. It's these kind of drops that appear out of nowhere and no one but the insiders can profit from them as the bears seem to always miss the move. We'll lets see if this next one can be caught.
The Pentagon paid a UK PR firm half a billion dollars to create fake terrorist videos in Iraq in a secret propaganda campaign exposed by the Bureau of Investigative Journalism.
PR firm Bell Pottinger, known for its array of controversial clients including the Saudi government and Chilean dictator Augusto Pinochet’s foundation, worked with the US military to create the propaganda in a secretive operation.
The firm reported to the CIA, the National Security Council and the Pentagon on the project with a mandate to portray Al-Qaeda in a negative light and track suspected sympathizers.
Both the White House and General David Petraeus, the former general who shared classified information with his mistress, signed off on the content produced by the agency.
The Bell Pottinger operation started soon after the US invasion of Iraq and was tasked with promoting the “democratic elections” for the administration before moving on to more lucrative psychological and information operations.
Former employee Martin Wells told the Bureau how he found himself working in Iraq after being hired as a video editor by Bell Pottinger. Within 48 hours, he was landing in Baghdad to edit content for secret “psychological operations” at Camp Victory.
The firm created television ads showing Al-Qaeda in a negative light as well as creating content to look as though it had come from “Arabic TV”. Crews were sent out to film bombings with low quality video. The firm would then edit it to make it look like news footage.
They would craft scripts for Arabic soap operas where characters would reject terrorism with happy consequences. The firm also created fake Al-Qaeda propaganda videos, which were then planted by the military in homes they raided.
Employees were given specific instructions to create the videos. “We need to make this style of video and we’ve got to use Al-Qaeda's footage,” Wells was told. “We need it to be 10 minutes long, and it needs to be in this file format, and we need to encode it in this manner.”
The videos were created to play on Real Player which needs an internet connection to run. The CDs were embedded with a code linking to Google Analytics which allowed the military to track IP addresses that the videos were played on.
According to Wells, the videos were picked up in Iran, Syria and the US.
"If one, 48 hours or a week later shows up in another part of the world, then that’s the more interesting one,” Wells explained.“And that’s what they’re looking for more, because that gives you a trail.”
The Pentagon confirmed the PR firm did work for them under the Information Operations Task Force (IOTF) creating content they say was “truthful”. The firm also worked under the Joint Psychological Operations Task Force (JPOTF). The Pentagon said it could not comment on JPOTF operations.
US law prohibits the government from using propaganda on its population, hence the use of an outside firm to create the content.
Documents show the Pentagon paid $540 million to Bell Pottinger in contracts between 2007 and 2011, with another contract for $120 million in 2006. The firm ended its work with the Pentagon in 2011.
In 2009, it was reported that the Pentagon had hired controversial PR firm, The Rendon Group, to monitor the reporting of journalists embedded with the U.S. military, to assess whether they were giving "positive" coverage to its missions.
It was also revealed in 2005 that Washington based PR company the Lincoln Group had been placing articles in newspapers in Iraq which were secretly written by the US military. A Pentagon investigation cleared the group of any wrongdoing.