
Will There Be A False Flag On November 9th, 2014 To Crash The Stock Market? (updated 11/04/2014)
(to watch on youtube: www.youtube.com/watch?v=n17FTmLjcpQ)
Here’s the previous notes that I posted back in January…
- 2014 will be a magic year (meaning what? will you pull a rabbit out your hat? will you steal money from the sheep without them seeing you do it?)
- 100th anniversary of the first world war in 1914 (strangely when I researched what happened to the DOW back then it was closed down for several months due to the first world war starting. are we expecting the same here? REFERENCE: http://www.ritholtz.com/blog/2013/02/most-long-term-charts-of-djia-are-wrong, http://measuringworth.com/DJA, https://www.globalfinancialdata.com/gfdblog/?p=1426 )
- 70th anniversary of the Bretton Woods Conference that gave birth to the IMF. (The delegates deliberated during 1–22 July 1944, and signed the Agreement on its final day. REFERENCE: https://www.google.com/search?q=first+bretton+woods+conference+date&ie=utf-8&oe=utf-8&aq=t&rls=org.mozilla:en-US:official&client=firefox-a&channel=fflb Not sure what the hidden message was here?)
- 25th anniversary of the fall of the Berlin wall (Destruction date: November 9, 1989… but what is she hinting at here? Is the “buzz word” the “25th”or the “fall”? Does the 25th mean a certain future date or does the word “fall” indicate that the market will fall hard?)
- 7th anniversary of the financial market jitters. (again with the focus on the number 7… meaning what? are we looking for another move down similar to 2008?)
- The crisis still lingers… (clearly this means we are going down again)
- It will not happen randomly… (of course not, it’s always planned)
- “Global growth is still stuck in low gear” (Hmmm… just a fall guy to blame I guess? We tank and it’s the fault of slowing global growth)
- It will not be without downside risks, and significant ones (referring to inflation… or was it really meant to refer to the stock market?)
- We are seeing rising risks of deflation… (good for us sheep but bad for them)
- Global growth slowing down as the economy cycle turns… (the “buzz word” that stands out to me there is “cycle turns”)
- Risk of capital runs… (You really mean the gangsters are moving their money out the market before the collapse)
- Dry run back in May of 2013… (Ah yes, the old test where Bernanke hinted at pulling money out the market last year)
- There could still be some rough waters ahead of us… (another clear warning that they plan on taking the market down)
- Overall, the direction is positive (meaning after the downturn the market we’ll go back up again, which should be a final Primary Wave 5 up with this coming correction next month being a nasty Primary Wave 4 down)
- 95% of the income growth went to the top 1% (Duh… nothing new there as that was always the plan! Steal from the sheep and give to the wolves)
- Tapering will have too be very well timed… (again, she’s clearly staying that we are going to withdraw money from the market)
- Central banks will have to “undo” what they’ve done… (and again, more references to cutting back the stimulus?)
- Removing the threat of the debt ceiling… (meaning what? They won’t set one, or make it unlimited? I don’t know what she means with this sentence?)
- A stress test will be done in 2014… (Why? You already know the banks would all fail. I guess they have to blame the correction on something)
![]()
____________________________________________________
Or Just A Big 15-20% Correction?
(to watch on youtube: www.youtube.com/watch?v=Gi-mqG8gkQM)
I give the odds of a big correction at 95% and a full blown crash of about 50% for 2014...
In the past 3 years all we've seen are these small 4-6% corrections and many people think that's all we are going to have this time around too. They see the market at or near the 200dma and think it will bounce and go back up to new all time highs again. But will this time be different? I think so. Why you ask? One simple answer: "The weekly rising trendline of support final broke down last week and closed below it".
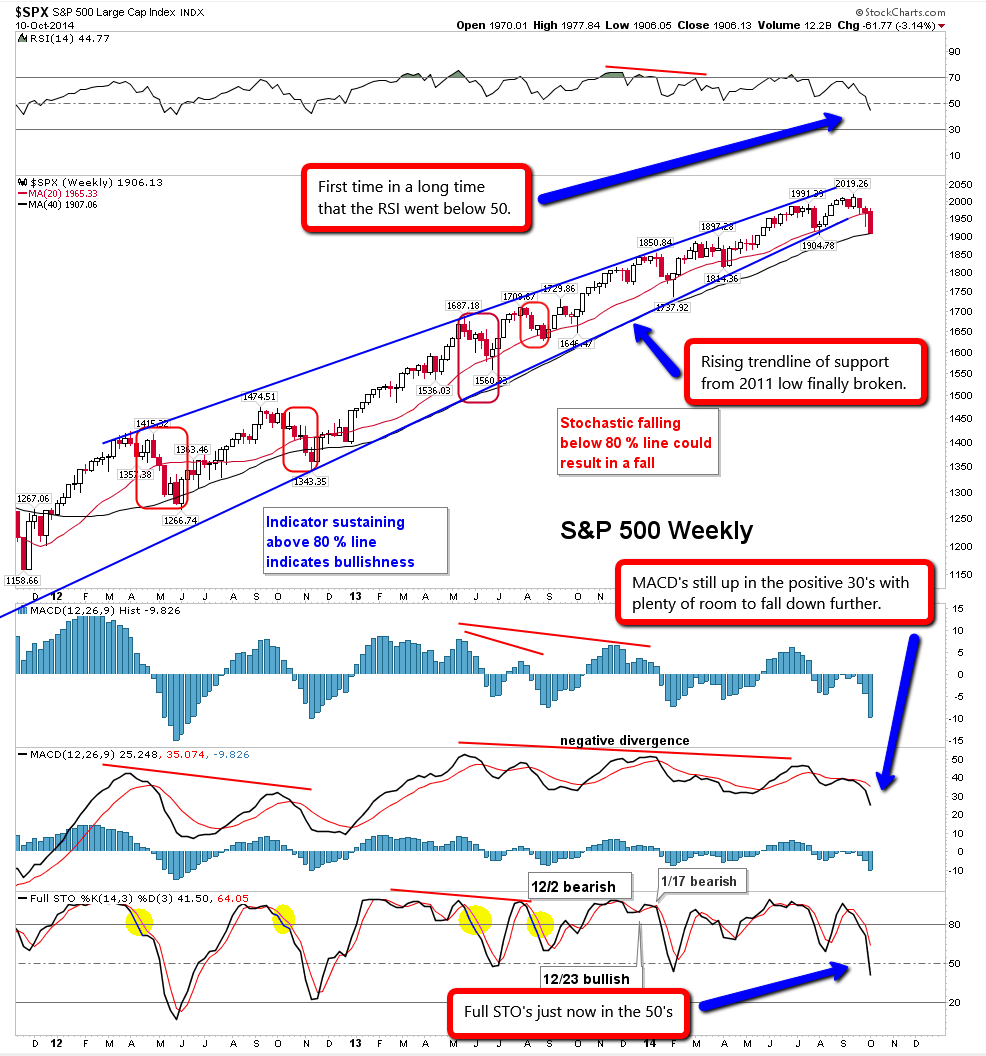
It's been having these small corrections since the 2011 low and bouncing off of that trendline every single time. It's been great support for the last 3 years but it's finally failed. This is the first signs of the end for the bull market since the 2009 low. While I'm sure there will be one more final rally to retest the current high, (which should start this December, 2014 and carry into early 2015) the current trend is down and we should not assume that this correction has ended yet.
My estimate is that we'll see the mid-1700's on SPX by the end of November before the Christmas rally begins. I suspect the Full Stochastic will be bottomed in the 20's on the chart above by that time and allow a relief rally. The MACD's should be close to the zero line as well, where other bottoms form and allow a bounce. Once that rally starts it should last all of December (of course) and carry into the early part of 2015.
It's hard too know how long the rally will last as it could be only 3-4 months or 3 years? It is called a Primary Wave 5 up in Elliottwave terms by others (Tony Caldaro) that do a lot better job of tracking wave then I do. It only has to have a higher high then the current high of 2019 SPX to be a successful Primary Wave 5 up. It could simply go to 2020 in 3-4 months or extend for 3 years to 3000 or more? There is no way to know what the government will do to try and extend the market but we can speculate based on the past.
What could cause an extend Primary Wave 5 up... QE4, QE5, and QE6?
I don't know the answer there but I'll say that "in my opinion" the QE programs have exhausted themselves and won't work to prop up the pig from here on forward. This pig of a stock market is much too heavy now with unsustainable debts world wide. It's like giving a dying patient a fourth, fifth and sixth round of chemo and radiation treatments with triple the morphine. It might have helped keep the pig alive in 2009 but this pig is dying and no amount of stimulus is likely to work this time around.
What does that leave for the government to do? I don't have a clue? You can see in the monthly chart below how we should have crashed in the last few years but were saved by QE Infinity (also known as QE3 [quantitative easing]}. Looking at the 2011 to 2013 period you'll see the market go from 1400 area to 1100 and stop, then rebound back up again creating the rising channel we see now. Now look at the ROC (rate of change) during that same period. It's hovering on the zero line for almost 2 years trying not to fall below.
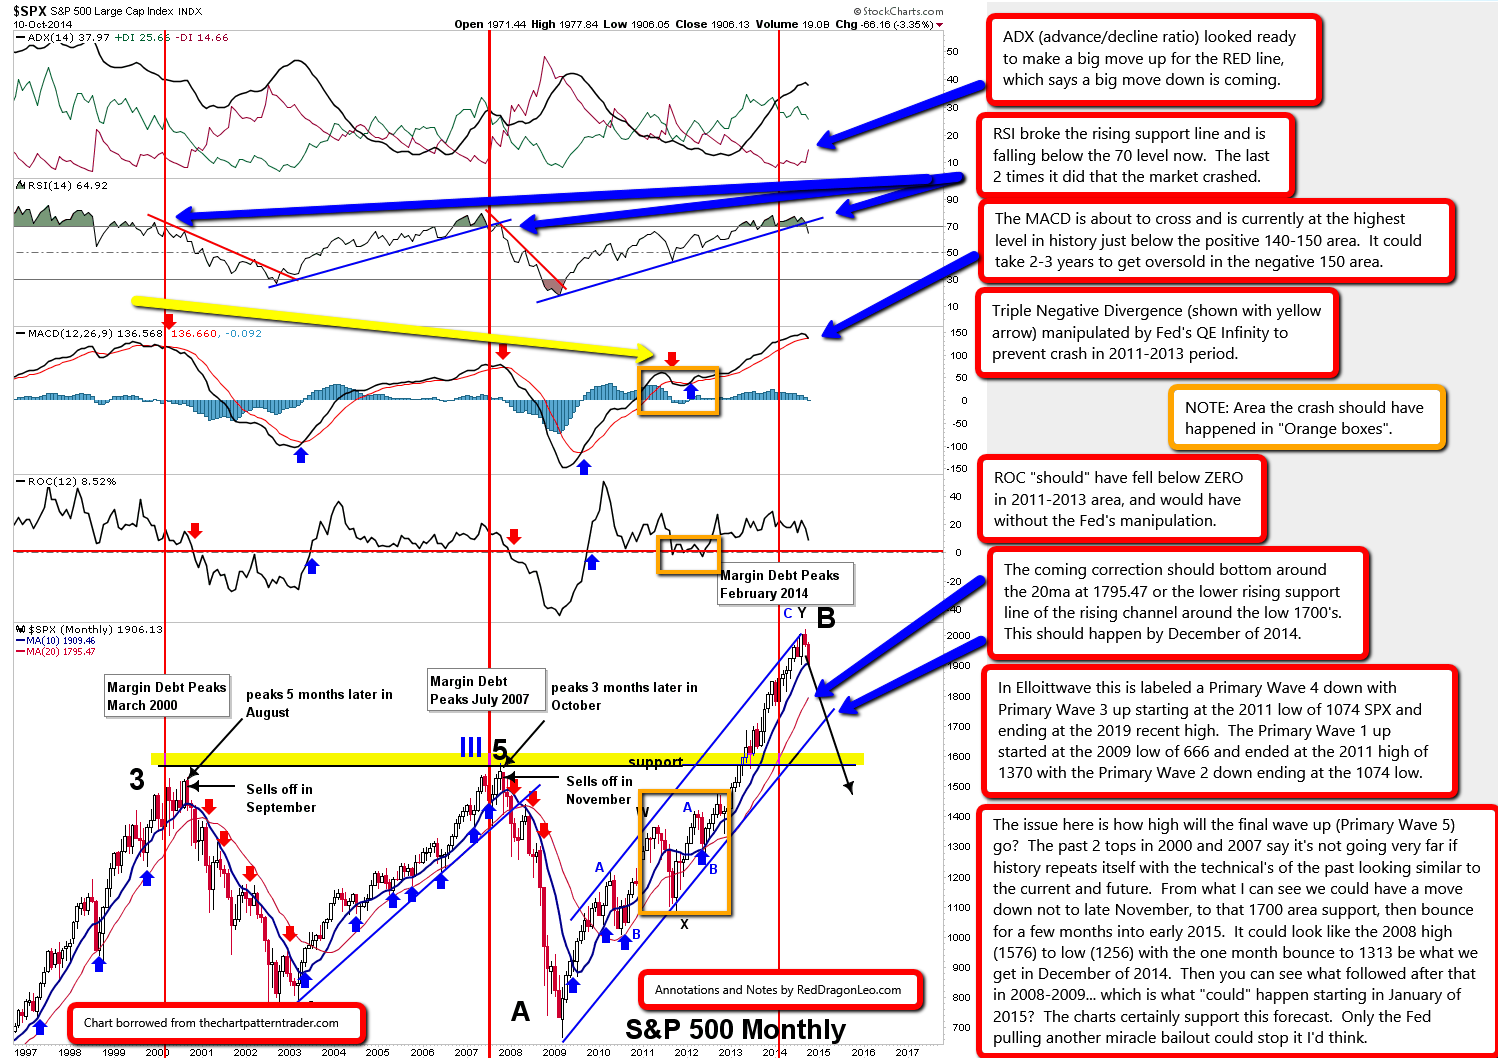
When you compare it to the level the MACD's were at during that period, and then look back to the 2007 top to see the comparisons you would have thought the market would have crashed but the government intervened with the largest QE program ever... "to infinity and beyond as Buzz Bernanke would say"! It looked perfect for another HUGE "wipeout" crash at that time from a technical point of view.
You have the 2000 high with MACD's up in the 120-130's, then a lower MACD high in 2007 in the 60-70's, with the 2011-2013 zone peaking in the 50's creating a triple negative divergence on the Monthly chart. Clearly the market "should" have crashed then, but the Fed's intervened with QE Infinity. Now they have successfully manipulated the stock market up to historically levels. The MACD has never been higher in history (from what I read someone else).
What's all this mean you ask?
To me it says the likelihood of a "Full Blown Stock Market Crash" like 1929 is VERY likely to happen between 2015 and 2017. The biggest drop will likely happen in 2015 I think as I really doubt if we'll make some extended Primary Wave 5 up that last for 3 years or so with upside targets of 3000 or more. I'm more inclined to seeing a December 2014 rally that will look similar to rally May, 2008 that simply made a lower high and then crashed the rest of the year. This suggests that we'll top out in January, 2015 and then drop all year.
If the market goes down to the 1700's area where the lower trendline of support is on the monthly chart then that's the scenario I see happening... just a one month Christmas Santa Claus rally to make a lower high in January and then a crash. If however the market only goes down to the 20ma around 1795.47 on the monthly chart then there's a possibility that we'll rally back up to make a "slightly" higher high in early January to hit a "possible" FP (fake print) I spotted on the SPY back on September 19th, 2014 showing 202.45 as an intraday high. Since we never went that high that day it's "possible" that it's a FP signal to the insiders that know how to read it, which "could" indicate the final top in early January, 2015 after this correction is over with and the P5 (primary wave 5) rally starts.
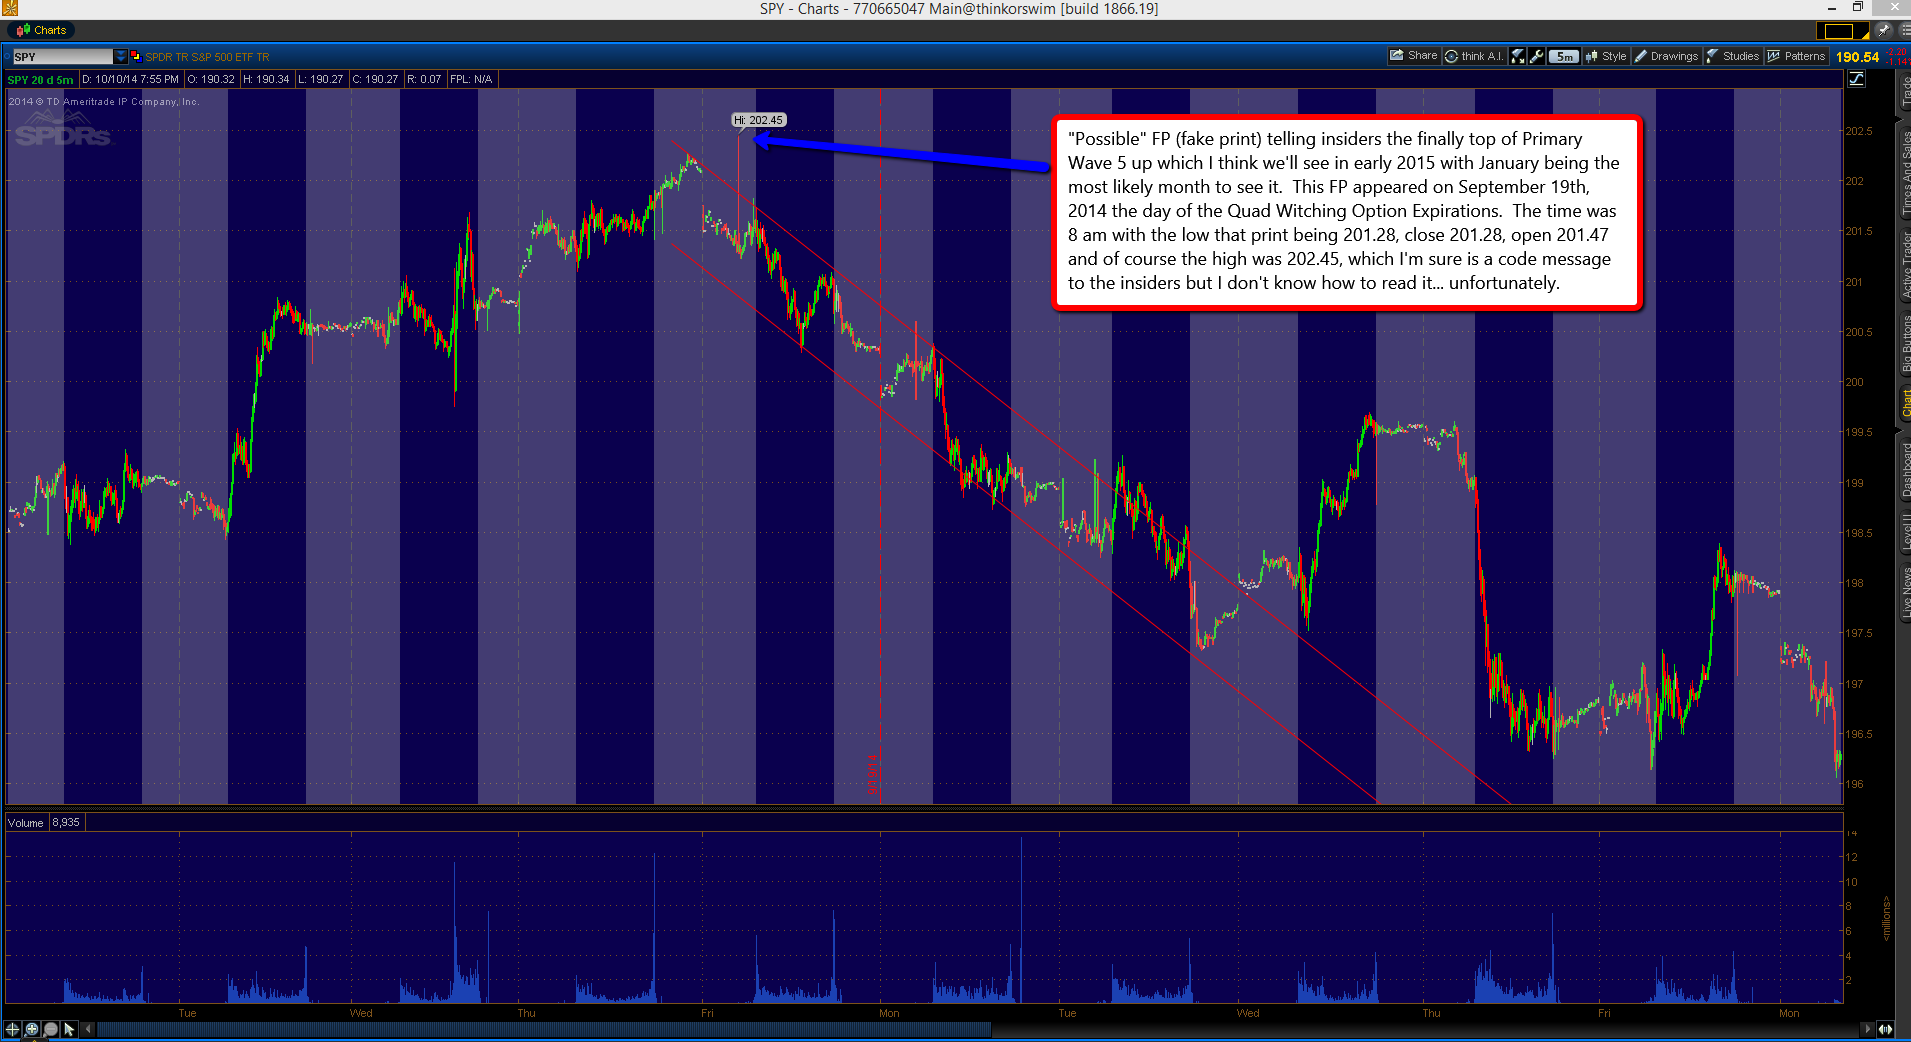
It could be nothing of course... or a "real" FP telling insiders the final high for P5?
Let's talk about the rituals for minute now...
Yes, it's that time of year again when all the elite satan worshiping gangsters meet in secret (but right in front of you... if you are looking?). Of course I'm talking about Legatus, where we find every snake of importance in the world going to so they can find out the latest information on how the super elite gangsters (the true Reptilians) play to screw the sheep (that's you and me).

Their October meeting is going on now as it started on October 8th and ends this coming Friday October 17th, 2014. I've done many posts in the past about the importance of these meetings and how the gangsters like to "turn" the stock market before, during, or just after one of these meetings end (http://reddragonleo.com/2013/02/03/the-law-of-equilibrium-and-past-history-with-legatus-and-turns-in-the-stock-market). I called a very important top on May 22nd, 2013 primarily based on a Legatus meeting during that period, along with technical analysis and numerology. That date added up to a 33 when adding all the numbers in it leaving 22 as a whole since it's a master number.
Point being is that the gangsters commonly have "turns" in the market around these meetings and they use numerology to pick dates. Having this meeting going on right now and ending this coming Friday tells me it's likely to be some type of bounce back up wave to retrace possibly 50% of the entire down move from 2019 to whatever the low is... which I suspect will happen Monday around the 1900 area (+/- 10 points). So "if" we bottom at say 1890 SPX this week we could "should" retrace back up about 50% of the move down.
Speculating here but if we dropped from 2019 to 1890 then we about 129 points and half of that is about 65 points. So we should bounce to about 1955 area before we have the really big drop start. I think we'll hit that level by this coming Friday but it could go up a little more the following Monday to some other Fibonacci level like 61.8%, or 79 points from the 1890 low... meaning 1969 is possible. First of course we have to find the low to calculate from... which should happen early this week. Then we can guess on the upside target...
Usually high levels of open interest in the Puts for October 17th expiration...
Since I like to trade options I'm commonly looking at the various strike prices, open interest, levels, days to expire, etc... and one of the things I mentioned a few weeks back in a comment and tweet was the very high level of puts in the 190 and 195 strike prices. On could imply that it's insiders buying them up as they know the market is going to fall below that level. But that's not usually the case. Most of the time it's just speculators that may or may not have seen the down move coming and loaded up short. However, from my experience the "market makers" will manipulate the market back up above the highest open interest levels to make those puts expire worthless.
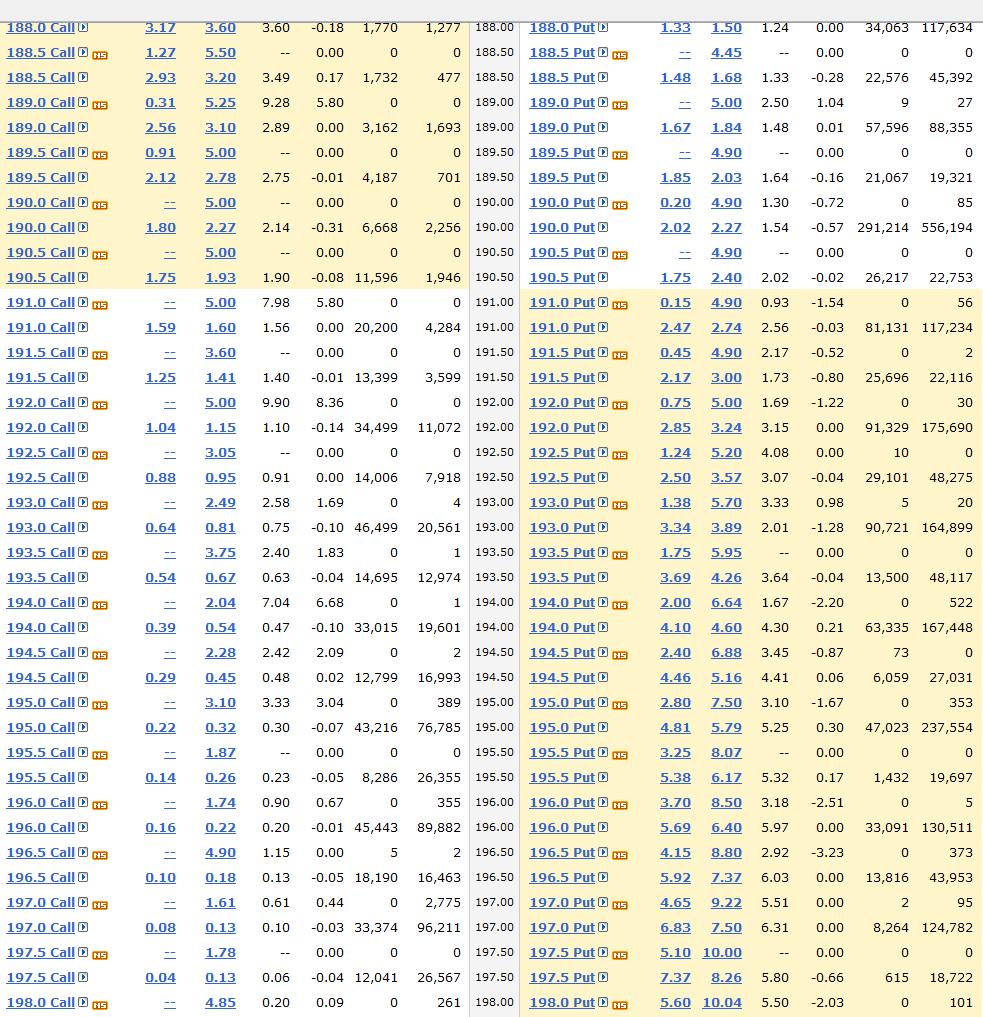
So will this time be different? Maybe? I just don't know? Normally I'd expect to see 50,000 to 100,000 contracts on any given even number strike price and less then that on the odd prices with the .5's on the end but having 556,194 contracts at the 190 strike price is at least 5 times the normal amount I'm used too seeing. Then the 195's have 237,554 on them, which tells me the market makers will have to do a whole of digging in their pockets to pay out those put holders if they allow it close below 195 SPY (about 1950 SPX) this coming Friday the 17th. I can tell you that these guys are similar to card dealers in Vegas and will lose their job if too many people win at their table. So you tell me what you think they will do? I think they will rally the market up to make them expire worthless. In Vegas some manager would come out and have the dealer move to another table to break up the winning streak.
Of course there's no way to know for sure if the "insiders" are actually the one's that are short and know that the market is going down below there by Friday the 17th but certainly we'd expect to see a lot of wild swing "shakeouts" for the retail sheep holding puts. Then after the market makers sure up their positions they "could" let the market collapse late Friday after most of those puts holders have giving up and sold out at a lose. Anyway, I'm looking for some kind of rally this week as everything tells me we are oversold short term and due a nice rally.
But after the rally we should expect another HUGE drop the following weeks into the end of November. I'm looking for that rising trendline of support to be the low are before a bounce, which appears to be around the low 1,700's. If it's only a shallow sell off then the 20ma on the monthly chart "could" stop the fall, which is just under 1800 SPX. I'm unsure which will happen but leaning toward the lower target just based on the charts and how many weeks we have left before the end of November when I'm expecting a bottom to happen.
After that we get a Santa Rally I guess...
Red
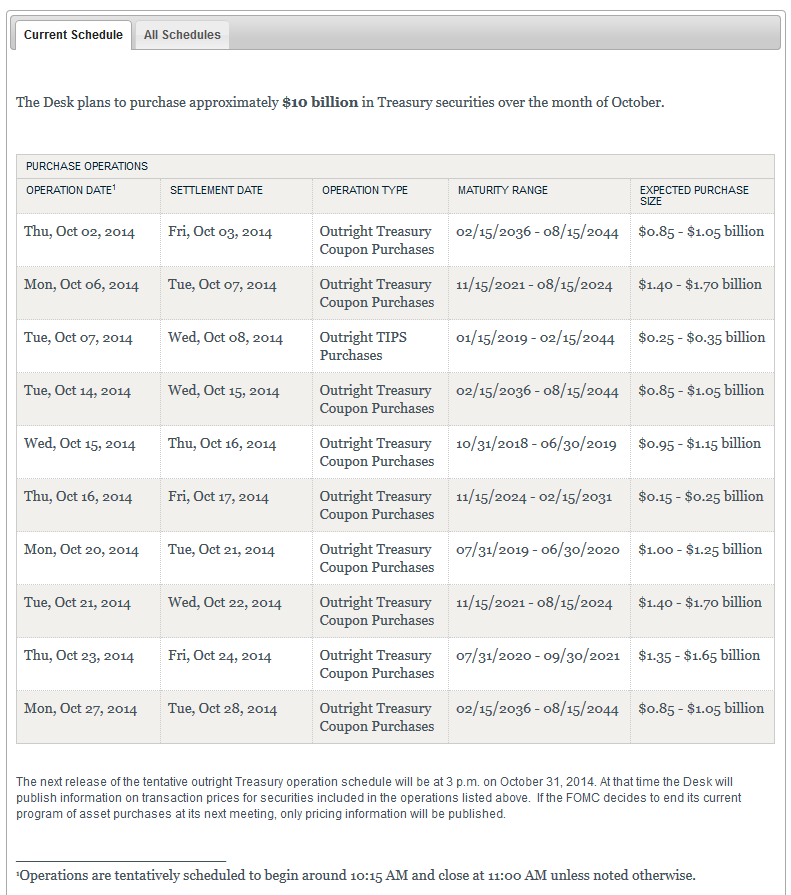
P.S. Let's keep an eye on the Fed's Outright Treasury Coupon Purchases too as they can add to the extreme volitalite as they try to save the market from collapse on these days.


SPX Update for Tuesday October 14th, 2014: http://screencast.com/t/COGLwtdJCR
We got the move back to the 50% retracement zone at 1875. It would be even better would for a 61% retracement back to about 1850.That would give us the kind of extreme conditions that could spawn a final blow on phase over the next 3-6 months.
From “where” to “where” are you talking about Scott? What’s your starting point and ending point for your call?
Fear index at extreme yet market still doesn’t want to bounce: http://money.cnn.com/data/fear-and-greed/
Should bounce from the lower blue trendline in this chart I’d think: http://stockcharts.com/public/1092905/chartbook/335493930;
TVIX Update: http://screencast.com/t/1BUFkwjUOVw
Sorry about the video being locked on the new post guys. I accidentally set it to private when it should have been set to public so everyone could see it. I fixed it now. Try it again (http://reddragonleo.com/2014/10/12/will-there-be-a-stock-market-crash-in-2014)
SPX Death Cross coming up soon: http://screencast.com/t/FAoztZn0IAO
TVIX Update (suggest the market will go down more first before a real bounce happens): http://screencast.com/t/kAaqeKbS
Gold Weekly support zone: http://niftychartsandpatterns.blogspot.in/2014/10/gold-weekly-support-zone-and-trend.html
Looks like a “capitulation” day! I suspect the bottom is for awhile and we’ll start a rally for a few days to weeks.
Not likely a strong rally this week from the looks of things (small rally maybe?). I guess all those “put” options bought in the 190 and 195 strike prices back 3 weeks ago really was insiders after all.
When I spotted it I was very suspicious of it being insiders but I’ve been so programmed to expect the market makers to manipulate the market to make them expire worthless that I ignored the writing on the wall. It very clear now that insiders bought those puts.
so bounce tomorrow or look out below for a couple more days. The million dollar question!
Possibly one more lower low tomorrow I think and then a rally. My estimated top is 202.45 SPY (about 2024.50 SPX)… which of course is against any B wave up theory. But SkyNet WILL NOT make it easy to pick the next important top.
By “B wave up” I mean that most Elliottwave people see this entire move down as one large wave A and then your typical B wave up is usually some Fib. Level like 50% or so. But SkyNet knows that too, and therefore won’t likely take it there and then really collapse into a massive “crash” C wave down.
Either we go up very shallow to possibly 23.6% (which should take several weeks of chop) or double top it and then tank. I don’t know which but I’m thinking that way too many people are “extremely” bearish now and will remain so for several weeks from now. So SkyNet will keep hitting “buy stops” as it rallies up with more and more bears trying to pick the next top just like the bulls are getting their “sell stops” hit trying to pick a bottom.
Well, when I saw that NFLX was actually up late in the day, I resisted my urge to get out of short term positions. I haven’t looked at after-hours futures but I cant say things look promising tomorrow with NFLX down 25% after-hours.
Today’s lows were going to be tested at a minimum anyway. New lows hit 600 today on NYSE. I am looking for 900-1000 for tomorrow. Then maybe a final low Friday? I don’t really know since the indices are below their weekly BBs except the Nasdaq. We’ll have to watch on a day by day basis. A certain little indicator is trucking on down through the crash zone but it is not at an extreme level yet nor is it’s component which actually rose today (albeit minimally).
I see one more move down tomorrow and then I think we’ll bottom and rally for awhile. The market opened on January 2nd of this year at 1845 SPX and we hit and pierced that today. Then we rallied from it. It should be some kind of support zone I think.
Also, the XIV double bottomed today from February’s low this year. It’s the opposite of the VIX. That is also a signal of a short term bottom I think. Again, possibly one more low tomorrow and then a rally. How high is anyone’s guess but with that FP on the SPY of 202.45 lurking out there I do think it’s possible that they hit it at some point.
Will it be in the next few weeks or next year… I don’t know? But if it’s hit I’d really become very, very bearish again… especially if it’s hit very fast, like 2-3 weeks! Remember, SkyNet reads ALL internet post, tweet’s, comments, etc… and learns how to lead the bulls and bears down the wrong path.
you make a valid point here. The overall sentiment is a little too bearish right now for my liking
Wow, amazing. AAII bulls at 42% bears 33%. Very little fear for what has been transpiring. Or excessive over-optimism.
Market Update (SPY): http://screencast.com/t/6osEaYFd1ks
SPY 60 minute chart with volume marked indicates another lower low coming soon: http://screencast.com/t/GgxveOChduZ5
SPY Triangle updated: http://screencast.com/t/9Mor4JiX
They should have washed things out today on the NFLX’s news. Instead they put in a very bullish candle. To fool the sheeple? The markets did test yesterday’s lows without exceeding them for the most part but the ensuing bounces mostly just tested resistance at the close of 2 days ago. Meanwhile, small caps have been rallying for three days already.
Yellen speaks pre-market tomorrow just in time to save the day but they did the Fed-speak rescue today with Bullard’s remarks on possibly continuing QE. So how does Yellen top that tomorrow. Or does she disappoint the markets? It is Friday 10-17. Forgot to mention the big 707 year anniversary on Monday. But a certain little component of a certain little indicator did rally up to the 0 line today so it has room for a multi-day decline although the overall indicator is in oversold enough of territory from which bottoms are formed.
Even if this is a first wave down, it should bottom with around 900 new 52 week lows for the NYSE. Instead today saw new lows drop down into the 200s.
But the biggest concern I have is with the astro-trader/trolls who have been arguing for the market to rally into the solar eclipse like Larry Pesavento. As expected, the opposite has been occurring. They plunged into the solar eclipse in double ninen.
I’m thinking around the same as what’s in this chart: http://www.amateur-investor.net/AII_Daily_Report_Oct_16_2014.htm
IWM Update says we go up next week: http://screencast.com/t/WZXaQGDf
The “one more wave down” I was looking for yesterday is likely out of the question now. I’m now looking for that gap up on Monday too. The projected target on the IWM is the previous “double top” zone around 115.50 for it and for the SPX it’s that 1970 area.
Also, a possible double top area could happen? My thinking is that the bears will short this all the way up and SkyNet (again, that’s just what I call the super computer running the market) will just keep going up hitting the bears’ “buy stops” on every move higher.
I believe the FP I have of 202.45 SPY is real and will be hit. That’s about 2024.50 SPX and would be a “slightly” higher high. I don’t know what the wave count then but I do know that this rally up will be very tricky, fooling all the shorts.
It has to fool the shorts in my opinion if you are going to have another huge wave down to 1500-1600 area. Look at the May-August 2011 chart for clues. I think we are on about June 27th, 2011 today, but I don’t think we’ll see a slightly lower high as happened on July 7th back then but a slightly higher high (main reason for that thinking is the FP on the SPY).
So possibly some kind of A wave up to end Monday or Tuesday morning. Then down for some B wave and up for the final C wave into the 28th/29th? Guessing on all that but as we know they love to take the market to extremes on both the bullish side and the bearish side.
Red, We are going higher into the mid election. This is the only thing the democrats can show for. So your FB 2025 is within 3 week IMO.
If, and that’s a big “if” the FP on the SPY is hit within 1-2 weeks I do STRONGLY believe that’s all she wrote for the BULLS and a Stock Market CRASH will follow. I’m still about 50/50 on the crash right now but I’ll raise or lower that figure within the next 1-2 weeks when I see certain things happen or not.
ES Futures/SPX Cash Quick 5 minute video: http://screencast.com/t/ncIV0SiwZfa
Market should be getting close to a short term top here as Jim Cramer says it’s safe to buy now.
I am looking for a bounce to around SP 1960 or the 50 day moving average or slightly above it around the time of the Fed meeting next week but it’s already practically shot up to that target. We have three large white candles in a row with today being the biggest of them all which is sometimes a reversal pattern in bear phases but breadth momentum appears to be too strong for a sudden reversal. Maybe see a few days of up and down chop.
Fomer stalmarts KO, IBM, and CMG got whacked today despite the huge move upward. The upcoming solar eclipse is the only unusual astro activity that I see in this period. There is a cluster of activity later. Now all we need to see is the CNBC commentators blather endlessly about the upcoming strong NOV-March seasonal period like they did back in 2000 which saw a top also in September. It looks like the market took the route of the lesser grand ritual with a bottom 19 trading days out although the form into the bottom and the subsequent bounce are taking the form of double ninen. We have reached 27, now on to 85…
Legatus just ended the 9 day meeting from October 8th-17th… so I guess was a bottom this time? At least a short term bottom.
lol yesterday you said it was a short term top
The meeting was 9 days long so it appeared that since the 15th was a bottom and today or tomorrow is a top that you can call it either way. If you think we are going a lot higher then the 15th was a bottom and it was near the end of the Legatus meeting.
If you think that it was a top (like today) then you can say that it happened 3 trading days after the meeting ended. The meetings produce turns in the market about 70% of the time I’ve noticed. And while it usually happens on one of the day inside the meeting occasionally I’ve seen it happen shortly after one.
Regardless, I see one more move up… tomorrow morning hopefully? The jobless claims should be used to move the market up or down at the open tomorrow. If it’s up then it’s an easy short. If it’s down then the rest of the day should rally back up and make a lower high or higher high, which I’d then short into Friday. A short is coming either way…
I think they’ll use the jobless claims numbers to get one more spike higher and then we drop. This TVIX chart shows it breaking out of a falling wedge. It’s common to see a backtest of the trendline before the real move up. So a gap up in the SPX allows a backtest of this chart, which should be at a lower level then today’s low in it.
http://screencast.com/t/eHPcBYP627Eb
Getting really close to a short I think: http://screencast.com/t/w3hig9XttzQm
I think they want a little more on the upside. Possibly 1963 SPX Friday morning? If they do I’d look to short into next week. I suspect we are going to make an “inverted head and shoulder” and the drop next week should make the right shoulder of it.
The move down should go to 1920-1930 area to make that right shoulder but I wouldn’t rule out a lower area like 1900 or so simply by the fact that they will want to scare out the bulls and lure in the bears before they make another move back higher later next week.
Depopulation forecast! https://www.youtube.com/watch?v=MnhTt8O3arg
Depopulation from Ebola?… released of course on purpose by our government.
This outbreak may have come from US CDC bioweapons lab(s) in West Africa.
“He’s convinced, in fact, that this Ebola epidemic in Africa started with the release from a U.S. bioweapons lab in West Africa. One of the reasons for his conviction that the outbreak started with the release from a bioweapon lab is that this Ebola strain seems to be much worse than those previously seen in the wild.”
http://www.zerohedge.com/news/2014-10-23/exclusive-was-ebola-accidentally-released-bioweapons-lab-west-africa
http://www.washingtonsblog.com/2014/10/top-ebola-expert-strain-much-worse-ever-weve-seen.html
(although some prefer to believe it was an accident).
“More than 200 incidents of loss or release of bioweapons agents from U.S.
laboratories are reported each year. This works out to more than four
per week,”
http://vimeo.com/6484188
200 “losses”… and we are to believe it’s all by accident. Pleasssssse
will be testing $SPX 1910 – 1890 this week.
I think so too Scott. The Fed’s aren’t going to announce another QE program at this Wednesdays’ FOMC meeting as they just ended one. The question will be is after the sell off to make that right shoulder of an “inverter head and shoulder” is will they make a new breakout from it or will it fail? If it fails we are going down hard in a massive C wave.
Looks like we re not going to break down?
Just doing the usual “scare the shit out of the bears” move and make them think we are going up forever. There’s be a move down but it’s not likely to start until after the FOMC meeting is over with this Wednesday.
So I’d look for Thursday to start the selling. It should continue into next week of course and we should be go down about 50% of the move up. My target area is 1890-1910 SPX zone. After that I’d expect a turn back up.
The turn back up though will be the tricky move. I don’t know yet if it’s going to go up and make a new high or just make a lower low then today or tomorrow’s high? If it breaks tomorrow’s high then we’re going to a FP I have on the SPY of 202.45 (about 2024.50 SPX).
If it fails then of course we are going down hard and should break the current 1820 area low and head down toward the low to mid 1700’s before bottoming and then rallying for Santa. Hard too know which will play out but shorting after the FOMC day is over with and then going long after the target zone is hit makes the most sense to me right now.
Thanks, Red!
EURUSD Trend update: http://niftychartsandpatterns.blogspot.in/2014/10/eurusd-trend-update.html
ES Chart analysis: http://niftychartsandpatterns.blogspot.in/2014/10/s-500-futures-chart-analysis.html
CRUDE Oil trend update: http://niftychartsandpatterns.blogspot.in/2014/10/crude-oil-trend-update.html
Best spot to short: http://screencast.com/t/DgGYujkS
Almost there: http://screencast.com/t/LqsNqF9Jrs
Past stat’s say that Wednesday’s rarely put in a high or low for the week… therefore we should have a slightly higher high Thursday before rolling over and heading south toward that 1900 area. This could take another week if they take the stairs down (as opposed to taking the rocket ship up).
As expected, the indices basically put in a hanging man on this special 85 year anniversary. Yellen speaks early tomorrow morning which is usually uber bullish but the analogs indicated otherwise. 60 min RSI were a bit overbought and extended this morning though so another divergence is needed? Next step is to see a drop below the 20 day emas.
Now let’s see if KC can win the World Series 29 years (1985) after their last playoff appearance (a 7 game World Series victory over the STL). The team playing at home (KC) in the 7 th game of the WS is 7-0 the last 7 occurrences…..Wow an involuntary 777 numey reference…..Of course, the 77 reference was made on the 4 letter earlier today. Something going on with the Show Me state as well.
We are getting close to a pullback I think but it seems they want to hold the market up until after the elections next Tuesday so I wouldn’t take any big shorts yet. Just might dip my toe in short but not much. This chart shows we are in the “sell zone” but that doesn’t mean we can’t hang out there for awhile. http://stockcharts.com/h-sc/ui?s=!GT20SPX&p=D&b=3&g=1&id=p18930922334&a=349546011
They juiced the Dow today but nothing else was really strong. Transports, $hgx (housing), and jnk were all down today. Toronto Stock Exchange as well. Apple 100 and the Nasdaq both putting in a topping form similar to the secondary top in double ninen. Oh Apple down as well today. SBUX getting hammered in after hours, one of the stocks I watch like a hawk.
New lows skyrocketed today as well on this momentous up day. Definitely put in another HO, but there have already been a gazillion triggered since September but this is the first one seen on this rebound rally; there was a close/ possible one 2 days ago but today is a no-doubter.
GOLD Month and Weekly chart update: http://niftychartsandpatterns.blogspot.in/2014/10/gold-month-and-weekly-chart-update.html
Amazing… totally straight up! I guess we’ll hit the SPY FP of 202.45 next Monday or Tuesday. By then there won’t be a bear left alive. That should be about 2024.50 SPX, but it’s common to go a little past any FP level from what I’ve noticed in the past. So at least the 202.45 is to be expected and possibly as much as a point higher?
I put the range in as 2024-2030 SPX. It should simply be based on how many bears’ stops are setting above the current 2019 high that need to be hit before SkyNet turns back down the other directions and goes after the bulls’ stops. While any FP isn’t always a “turning point” but is at least a target that will be hit this FP area should be both.
Why? Because everyone will become bulls then and without the bears to squeeze the market won’t have any choice but to fall back some. Whether it’s some powerful crash wave to the mid 1700’s or not is unknown? But a nice pullback after the elections is very likely in my opinion.
Here’s the FP of the SPY where the insiders were told the market was going to
I never thought we’d see it so soon though. I was expecting a move down to the mid 1700’s first and then a ramp up to this print in 2015 sometime. Is this the end of the bull market? Does this make a Primary Wave 5 up or is it just an extension of Primary Wave 3 up and P4 down is yet to come?
We’ll find out soon..but obviously markets can and do just take off and run again and again for years to multiple new ATH’s..confusing the majority that just don’t believe in it. It’s how and why markets climb walls of worry for so long with so few on board. But,and it’s a big ‘BUT’… if today is truly the last “trick or treat” on the bears..then we’re going to need to sell off hard next week and not come back up here to the Dow 17,000’s or north of SPX 2000 for a long,long time.
I don’t believe much in time and chart correlation comparisons of now vs the past…but for those that do like that sort of thing…the situation going on right now…with a new and 2nd ATH..high just a bit higher than the previous high 2 months ago at SPX 2011.36…similar action was happening pretty much the same way in Oct of 2007..right before the market really started getting serious about heading lower into Mar 2009.A big peak in the 1575 area…a big drop to 1425..and then one final big rally peak just a little higher in Oct of 2007.
Interesting to look at the late 2007 /early 2008 chart I’ll post and compare the action in Oct of 2007 and this Oct of 2014.
http://d.stockcharts.com/img/articles/2011/07/6a0105370026df970c014e89d53b0c970d-800wi
That link is bad…
Will..it comes up for me..on “your” site. I just did it. Let me try posting it again on THIS post. If it still doesn’t come up for you..go back and look at the market action between about Aug 2007 and Mar 2008..and you’ll see what I’m talking about.
http://d.stockcharts.com/img/articles/2011/07/6a0105370026df970c014e89d53b0c970d-800wi
You must be logged into to stockcharts as a member as it’s all just a bunch of random letters, numbers, and symbols on my end.
Ok. I’ll check on that..but I posted it a couple of other places earlier and it came up for other commenters. But..when you have a chance..look for a chart of that time period I mentioned(Aug 07//Mar 08).. look at it…and see if you can post a chart of it here.
If..and I stress “if” we’re were to drop hard next week..the comparison to Oct 2007,and the previous 2 months..and our Oct now,and the previous 2 months..would match pretty well.
That kind of “comparison”thinking “doesn’t work always ..but then again..sometimes it does..or “seems” too.
New lows shot up again on Friday per stock charts to over 100 but the WSJ data does not corroborate. They had 58. Still quite an elevated number this late into a kickoff and even on a big upday. The liftoff in October 2011 never saw new lows rise above 20 ish.
A component of a certain little indicator did reach a level seen at the B Wave top double7 years ago which is pretty much as overbought as it can get. It can get a little higher which is usually seen at initiation thrusts of new bull legs.
The $ndx/ Apple 100 did jump to new highs but it did so as well at the aforementioned B Wave High spending one candle in new high territory.
RSI levels on 60 min and lower time frames did put in lower RSI levels at the end of the day.
I noticed how big the moon was a few days ago and checked out that the moon goes perigree Sunday night/ Monday morning or right about now near full moon status.
The FP on the SPY from September 19th showing 202.45 has now been hit and is currently the high of the day. While I’ve noticed in the past that FP’s are usually pierced by a little bit before a turn in the other direction this one has not done that… yet.
If it ends up being the high for today then we could start our pullback Tuesday. It’s certainly strange to see an “exact” hit of the FP and would be strange if that was the high but you it could be as simple as that?

Possible “False Flag” on November 9th, 2014. Again, I’m just speculating in this new video as I don’t know “the code” that Christine Lagarde is saying: https://www.youtube.com/watch?v=n17FTmLjcpQ (refresh page on blog)
SPX Update: http://screencast.com/t/J7c65zejjUc
Cup and Handle pattern on SPX not supported by MACD’s and Histogram bars: http://screencast.com/t/qTMOj8Ssy
Dow up .5% with Nasdaq slightly negative. Quite the opposite of what occurred at a certain B-Wave high double 7 years ago. Full moon tomorrow on the sixth day of the month similar to a certain set up from the fabled events of that aforementioned time.
Stock charts had new lows rising today to 120+ from the 100+ reading yesterday and didn’t revise yesterday’s reading. WSJ had 70+ new lows for yesterday’s action which would qualify as an HO event/ observation.
IBB or the $BTK were down over 1% after putting in a negative monster shooting star on Monday. Biotechs being the strongest index now starting to lead to the downside. JNK also starting a small little move to the downside, definitely producing a TD bear flip over the last few days.
Some of the hotel stocks I follow, HOT and WYN also starting new downtrends off their recent B wave highs while the strongest stock of the group MAR is mimicking biotech action. LVS is crumbling to new 52 week lows as it follows its 2008 pattern in 2014 after topping out late last year. Beginning the accelerated downmove portion of its 2008 pattern. Apparently, they aren’t gambling in Macau these days.
My stongest set-up now in a DeMarkian-like pattern analysis is to call for an imminent reversal in the Japanese yen. It’s blowing off to the downside and spent the last few days outside its lower BB. Even though it bounced pretty hard during the early October stock market dislocation, I had a sense that one more plummet to new lows was likely following its long sustained decline into September.
Sort of the opposite(directionally–stylistically the same) of what the euro experienced earlier in the year but not as extreme.
I have a 100 year history lesson coming in the near future. Just don’t have time to compose it. The operators commemorating a 100 year anniversary just as they did so back then in one of the least heralded market events. Or one of their best kept secrets.
I didn’t really get the meaning of last year’s NCAA championship game other than Florida State was the #2 team/ runner up to 1987 champ MIAMI. The previous year’s championship matchup BAMA (Roll Tide) vs. Notre Dame (ND) set in MIAMI seemed more occultic but I did overlook the fact that FSU did face Auburn (or overlooked the fact) in 1987 or November 7th to be exact. 11-7 did produce a turn 2 years ago following the election and 11-6 did mark a high in 2000 (following an election although I didn’t really look to see what day of the week it was).
So let’s look for the week to put in a buying climax. I know my predictions usually predict the opposite will happen and some of the trolls have been purposefully wrong and bearish lately but they have disappeared the last few days. Anyway, things need to start reversing soon or I might have to look out to the exact Pluto-Uranus square later which would be a 100 year anniversary date.
SLXP down 36% in after hours after the CFO resigns. I wonder how IBB and the biotech indices will hold up in the face of that. SLXP did have a 10+ billion market cap.
I see that LNKD was hammered a bit yesterday apparently from announcing they will be offering convertible bonds. Tech companies issuing conv. bonds are another topping signal. Saw that in 2000. At the market bottom(as in 2002/3), they buy back the convertible bonds for pennies on the dollar.
There was a minor change reading yesterday and today.
Very good “first” call by http://charleshughsmith.blogspot.com/2014/11/about-that-s-500-will-be-2150-by.html I wonder if the next call will be accurate too?
Gold update: http://niftychartsandpatterns.blogspot.in/2014/11/gold-support-and-resistance-levels.html
4 minor change readings in a row for a certain little component of a certain little indicator until today when it dropped a little. As I recall some heavy astro activity starts up tomorrow with Mars getting in the mix of things.
So now we once again have to wonder if we’re building up to a pull back, or if they’re just going to be willing to let “time” work off the overbought situation. The jury is out?? I could see a quick drop to test 1950 or continue to chaneel between 2040-2050.
Wish I knew the answer? I took the last week off as it’s took risky to go long up here and too scary to short it.
I will say that it’s possible that we continue upward until the FP on the NYA is hit (around 11,330)
LOL… the “PitBull” from Mr.TopStep talks about the RIGGED Market: https://www.youtube.com/watch?v=CAC0p-OjOAc&index=2&list=UUzmFVUlXa-bd6m6QhAflEsA
Monday, November 17th will be the 100 year anniversary of the opening of the Federal Reserve Banks or 100 years 1 day later. So maybe numerology/ anniversary will trump astrology since there was some heavy hitting astro activity this week. Wednesday saw Mars join the Pluto Uranus square as it conjuncted with Pluto and then transited to a square with Uranus over the next two days with a Sun Jupiter and Venus Jupiter square thrown in earlier in the week.
Stanley Kubrick did a lot of research on the Federal Reserve for his grand ritual classic The Shining and the final shot of the July 4 1921 ball photo with Jack Nicholson was originally a photo of some sort of Federal Reserve function/ New Year’s Ball??? Let’s see Nov 17-14 will be 93 years 4 months 13 days later from the 1921 date. Nothing really there but a day later it will be 4months 14days later which conforms to one of there favorite numbers 144….ie 11-14…..141 years 1 month+ from a certain little event in 1873, an event that really doesn’t have a wiki page or much information about anyway.
The astrotroll was providing headwinds for the bearish cause the last few weeks as he was bearish. Now he has abruptly switched to bullish. Otherwise worrisome misdirecting trolls have disappeared as well.
Looking out to the future movie release schedule, next week will see the release of the Hunger Games flick (no Wedsnesday. pre Thanksgiving release date?) on Friday 11-21 and after that I really don’t see any heavy occultic fare being released until Christmas day which will see the release of Into the Woods based on a musical that saw its Broadway debut in 1987. It looks to be a slate of weak offerings until then with all of the big releases and prestige films already having been distributed.
The heavily occultic NCAA championship game from 2 years ago in MIAMI played between BAMA and ND was a rematch of a 1987 joust played on November 14 of that year. One week after the Florida State Auburn game in 1987. (11-7) The 11-1 runner up FSU Seminoles lost to the 1987 champ MIAMI earlier in the season. They ie defending champs FSU and Miami play their annual matchup today/ possibly right now in MIAMI with the U of M just a slight underdog. Time for a little ritualistic upset? BAMA faces #1 Mississippi State at home in another interesting matchup.
I guess I have to go into detail in last Sunday’s Arizona-STL NFL game later, possibly Monday. They were flashing #11s althroughout the stadium as their once star WR #11 has sort of come back to life. I almost thought it was a tribute day for him but I saw no mention of it when I searched for news earlier in the week. They have the best record in the NFL which probably won’t last as they lost their starting QB #3 for the year. (at an interesting time.) Need to review some game tape for the interesting numerological formations in it as well.
It’s the 11th season for #11 and tomorrow will be week 11 on the season. And new QB #5 will be throwing to him.