
Up, down, up, down, up, down... kinda makes me dizzy! It's funny how the market can go straight up for days on end but can't go straight down in the same manner. If the Fed's didn't constantly manipulate it by never letting it drop too far, too fast this market would be half the value it is now. It makes it very hard to trade as patterns, technical analysis, etc... don't work as well on the downside as they do on the upside. For example, the inverted head and shoulders pattern that should have produced a strong rally failed, and that normally would produce a flush out to the downside that would take out previous lows... like the 3/27 and 4/17 low. But it gets manipulated with and prevented from happening. It like this is a football game and the bulls are one team and the bears the other. The bulls had a perfect setup with the IH&S patterns and fumbled the ball to the bears. The bears should have be able to run the ball deep down the field but the crooked referees called holding or something against the bears and only gave them 10 or 20 yards instead of a touchdown.
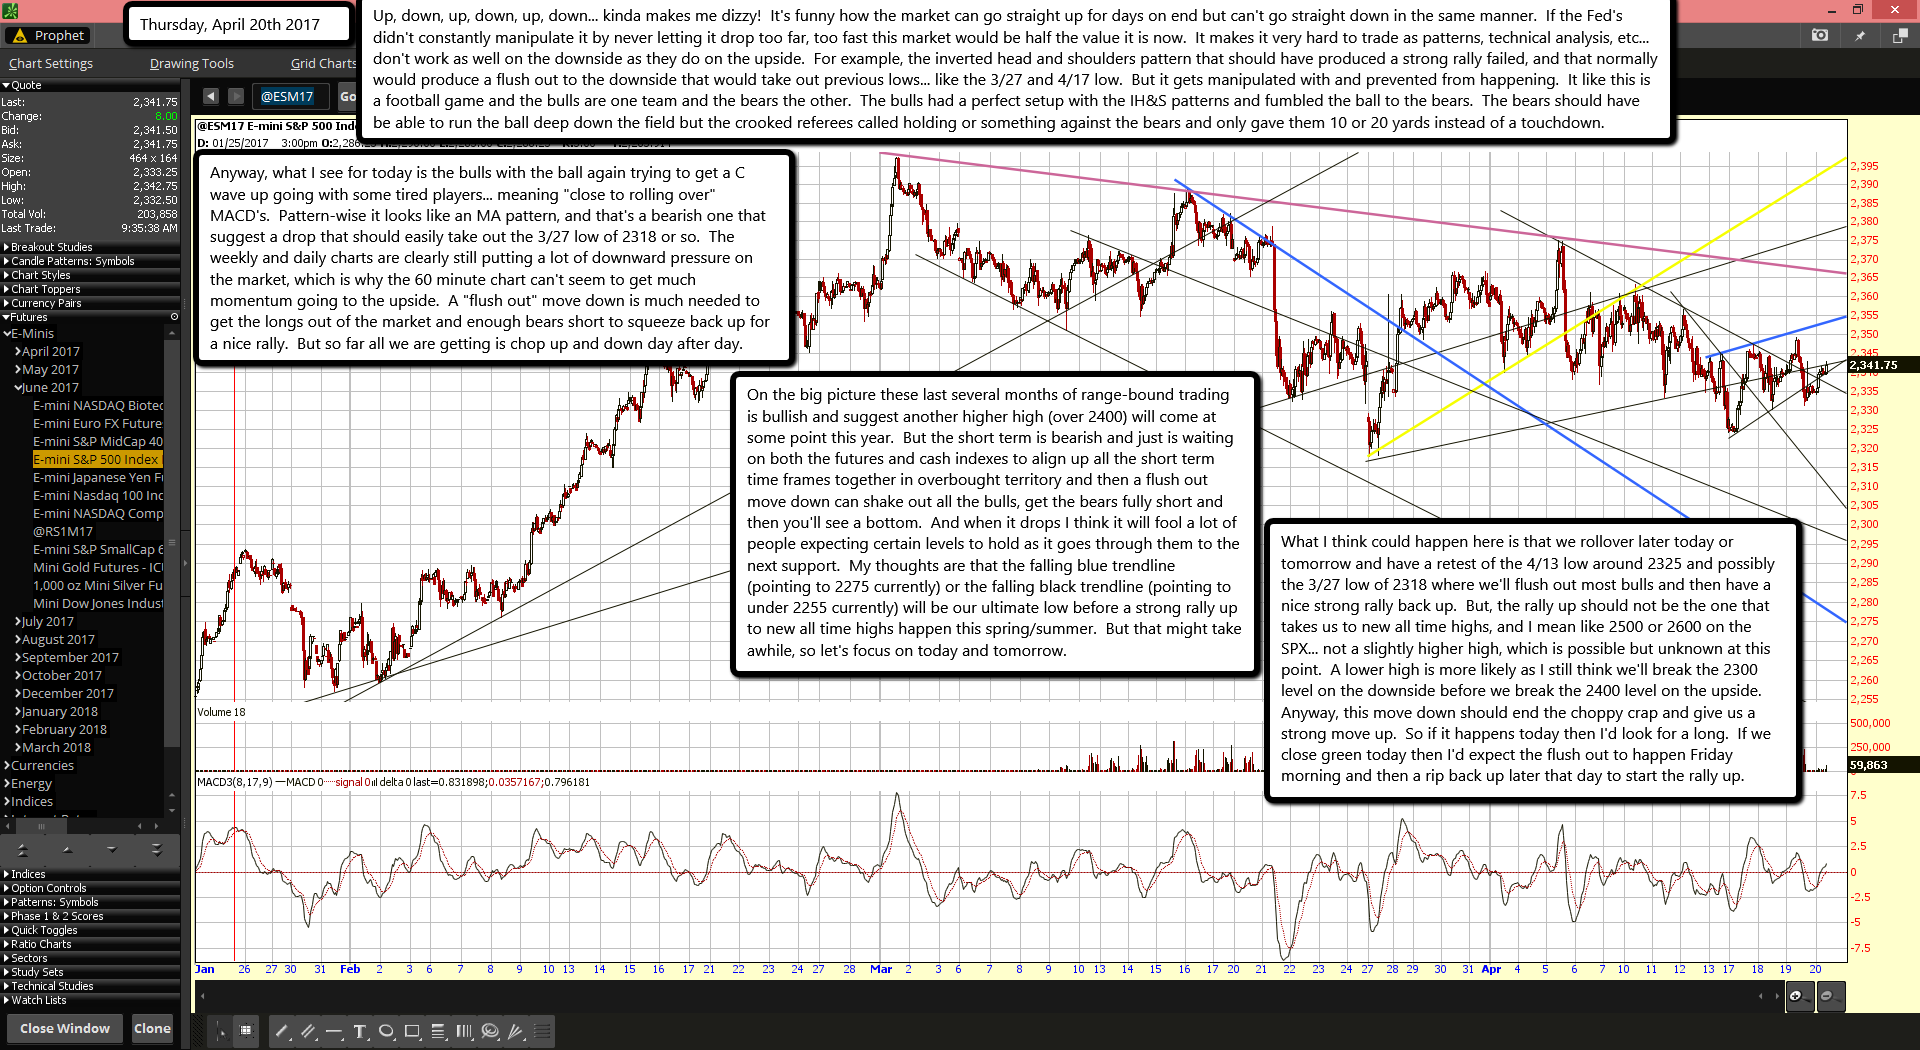
Anyway, what I see for today is the bulls with the ball again trying to get a C wave up going with some tired players... meaning "close to rolling over" MACD's. Pattern-wise it looks like an MA pattern, and that's a bearish one that suggest a drop that should easily take out the 3/27 low of 2318 or so. The weekly and daily charts are clearly still putting a lot of downward pressure on the market, which is why the 60 minute chart can't seem to get much momentum going to the upside. A "flush out" move down is much needed to get the longs out of the market and enough bears short to squeeze back up for a nice rally. But so far all we are getting is chop up and down day after day.
On the big picture these last several months of range-bound trading is bullish and suggest another higher high (over 2400) will come at some point this year. But the short term is bearish and just is waiting on both the futures and cash indexes to align up all the short term time frames together in overbought territory and then a flush out move down can shake out all the bulls, get the bears fully short and then you'll see a bottom. And when it drops I think it will fool a lot of people expecting certain levels to hold as it goes through them to the next support. My thoughts are that the falling blue trendline (pointing to 2275 currently) or the falling black trendline (pointing to under 2255 currently) will be our ultimate low before a strong rally up to new all time highs happen this spring/summer. But that might take awhile, so let's focus on today and tomorrow.
What I think could happen here is that we rollover later today or tomorrow and have a retest of the 4/13 low around 2325 and possibly the 3/27 low of 2318 where we'll flush out most bulls and then have a nice strong rally back up. But, the rally up should not be the one that takes us to new all time highs, and I mean like 2500 or 2600 on the SPX... not a slightly higher high, which is possible but unknown at this point. A lower high is more likely as I still think we'll break the 2300 level on the downside before we break the 2400 level on the upside. Anyway, this move down should end the choppy crap and give us a strong move up. So if it happens today then I'd look for a long. If we close green today then I'd expect the flush out to happen Friday morning and then a rip back up later that day to start the rally up.

