
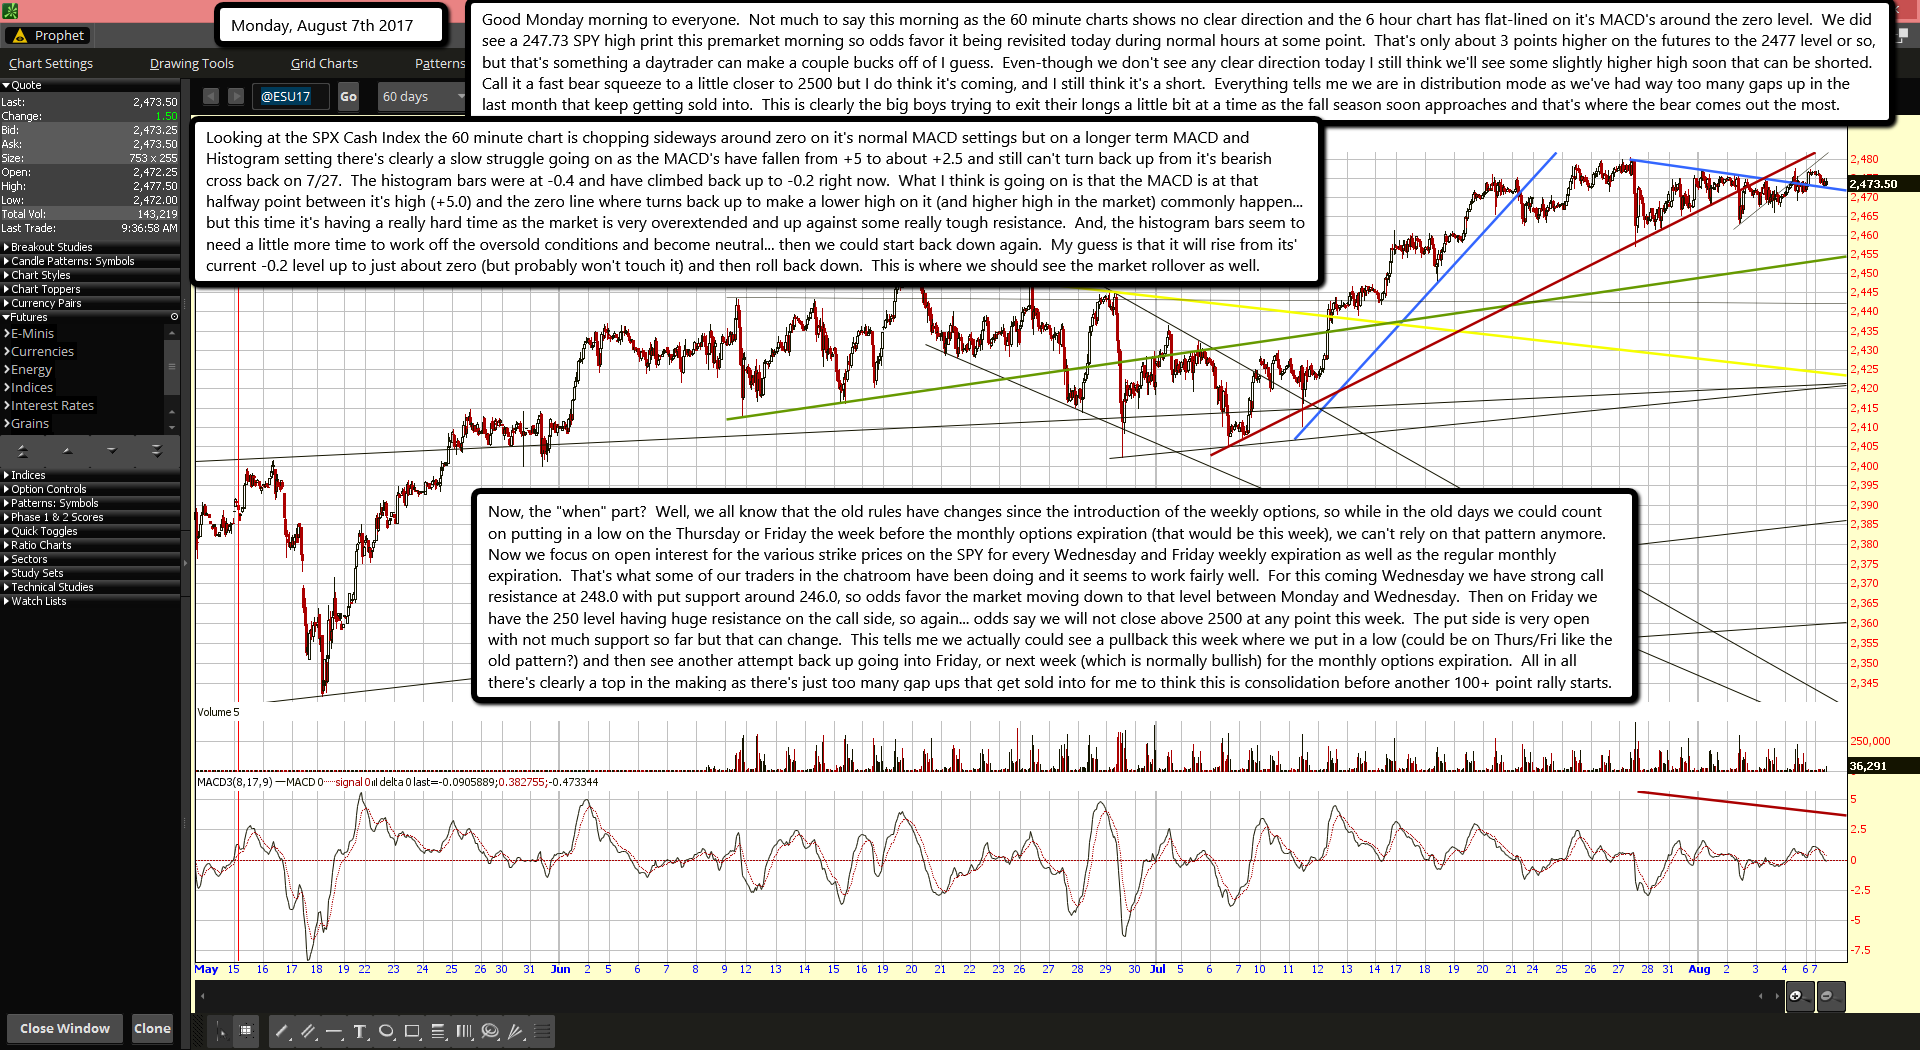
Good Monday morning to everyone. Not much to say this morning as the 60 minute charts shows no clear direction and the 6 hour chart has flat-lined on it's MACD's around the zero level. We did see a 247.73 SPY high print this premarket morning so odds favor it being revisited today during normal hours at some point. That's only about 3 points higher on the futures to the 2477 level or so, but that's something a daytrader can make a couple bucks off of I guess. Even-though we don't see any clear direction today I still think we'll see some slightly higher high soon that can be shorted. Call it a fast bear squeeze to a little closer to 2500 but I do think it's coming, and I still think it's a short. Everything tells me we are in distribution mode as we've had way too many gaps up in the last month that keep getting sold into. This is clearly the big boys trying to exit their longs a little bit at a time as the fall season soon approaches and that's where the bear comes out the most.
Looking at the SPX Cash Index the 60 minute chart is chopping sideways around zero on it's normal MACD settings but on a longer term MACD and Histogram setting there's clearly a slow struggle going on as the MACD's have fallen from +5 to about +2.5 and still can't turn back up from it's bearish cross back on 7/27. The histogram bars were at -0.4 and have climbed back up to -0.2 right now. What I think is going on is that the MACD is at that halfway point between it's high (+5.0) and the zero line where turns back up to make a lower high on it (and higher high in the market) commonly happen... but this time it's having a really hard time as the market is very overextended and up against some really tough resistance. And, the histogram bars seem to need a little more time to work off the oversold conditions and become neutral... then we could start back down again. My guess is that it will rise from its' current -0.2 level up to just about zero (but probably won't touch it) and then roll back down. This is where we should see the market rollover as well.
Now, the "when" part? Well, we all know that the old rules have changes since the introduction of the weekly options, so while in the old days we could count on putting in a low on the Thursday or Friday the week before the monthly options expiration (that would be this week), we can't rely on that pattern anymore. Now we focus on open interest for the various strike prices on the SPY for every Wednesday and Friday weekly expiration as well as the regular monthly expiration. That's what some of our traders in the chatroom have been doing and it seems to work fairly well. For this coming Wednesday we have strong call resistance at 248.0 with put support around 246.0, so odds favor the market moving down to that level between Monday and Wednesday. Then on Friday we have the 250 level having huge resistance on the call side, so again... odds say we will not close above 2500 at any point this week. The put side is very open with not much support so far but that can change. This tells me we actually could see a pullback this week where we put in a low (could be on Thurs/Fri like the old pattern?) and then see another attempt back up going into Friday, or next week (which is normally bullish) for the monthly options expiration. All in all there's clearly a top in the making as there's just too many gap ups that get sold into for me to think this is consolidation before another 100+ point rally starts.

