
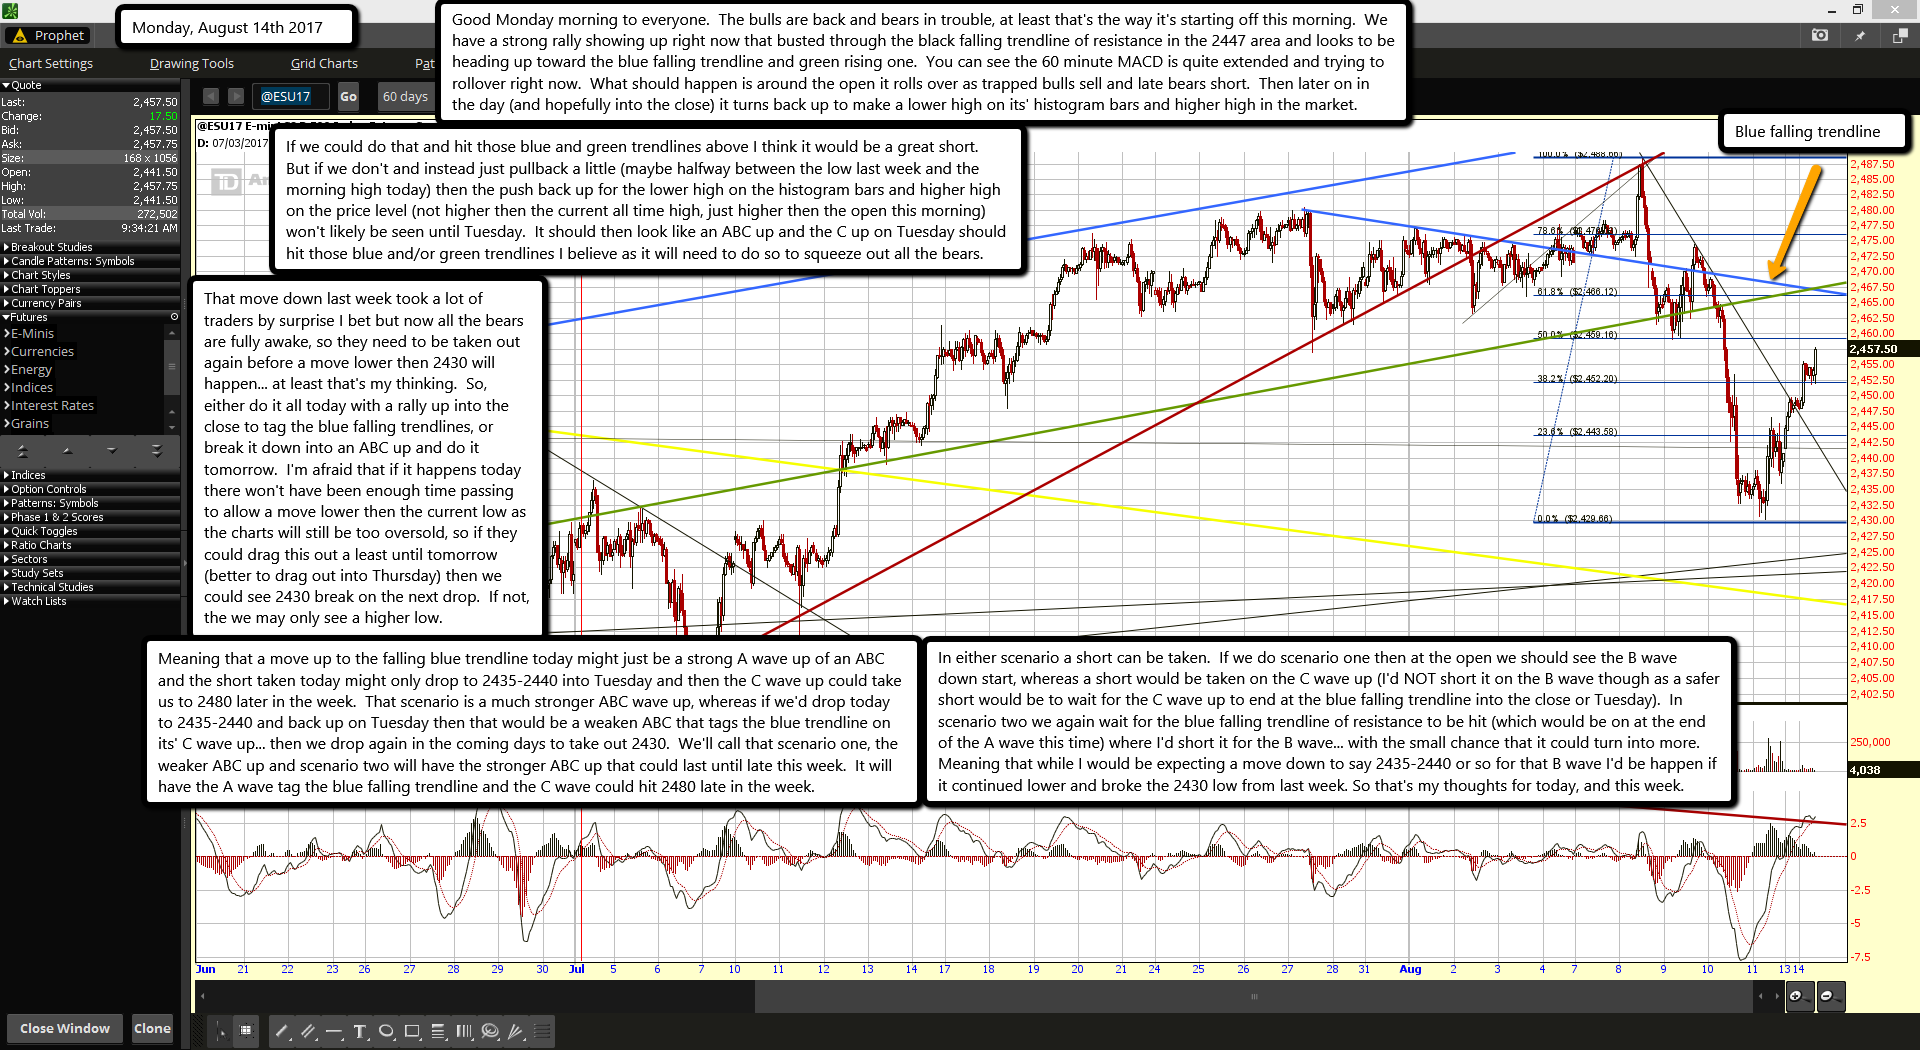
Good Monday morning to everyone. The bulls are back and bears in trouble, at least that's the way it's starting off this morning. We have a strong rally showing up right now that busted through the black falling trendline of resistance in the 2447 area and looks to be heading up toward the blue falling trendline and green rising one. You can see the 60 minute MACD is quite extended and trying to rollover right now. What should happen is around the open it rolls over as trapped bulls sell and late bears short. Then later on in the day (and hopefully into the close) it turns back up to make a lower high on its' histogram bars and higher high in the market.
If we could do that and hit those blue and green trendlines above I think it would be a great short. But if we don't and instead just pullback a little (maybe halfway between the low last week and the morning high today) then the push back up for the lower high on the histogram bars and higher high on the price level (not higher then the current all time high, just higher then the open this morning) won't likely be seen until Tuesday. It should then look like an ABC up and the C up on Tuesday should hit those blue and/or green trendlines I believe as it will need to do so to squeeze out all the bears.
That move down last week took a lot of traders by surprise I bet but now all the bears are fully awake, so they need to be taken out again before a move lower then 2430 will happen... at least that's my thinking. So, either do it all today with a rally up into the close to tag the blue falling trendlines, or break it down into an ABC up and do it tomorrow. I'm afraid that if it happens today there won't have been enough time passing to allow a move lower then the current low as the charts will still be too oversold, so if they could drag this out a least until tomorrow (better to drag out into Thursday) then we could see 2430 break on the next drop. If not, the we may only see a higher low.
Meaning that a move up to the falling blue trendline today might just be a strong A wave up of an ABC and the short taken today might only drop to 2435-2440 into Tuesday and then the C wave up could take us to 2480 later in the week. That scenario is a much stronger ABC wave up, whereas if we'd drop today to 2435-2440 and back up on Tuesday then that would be a weaken ABC that tags the blue trendline on its' C wave up... then we drop again in the coming days to take out 2430. We'll call that scenario one, the weaker ABC up and scenario two will have the stronger ABC up that could last until late this week. It will have the A wave tag the blue falling trendline and the C wave could hit 2480 late in the week.
In either scenario a short can be taken. If we do scenario one then at the open we should see the B wave down start, whereas a short would be taken on the C wave up (I'd NOT short it on the B wave though as a safer short would be to wait for the C wave up to end at the blue falling trendline into the close or Tuesday). In scenario two we again wait for the blue falling trendline of resistance to be hit (which would be on at the end of the A wave this time) where I'd short it for the B wave... with the small chance that it could turn into more. Meaning that while I would be expecting a move down to say 2435-2440 or so for that B wave I'd be happen if it continued lower and broke the 2430 low from last week. So that's my thoughts for today, and this week.

