
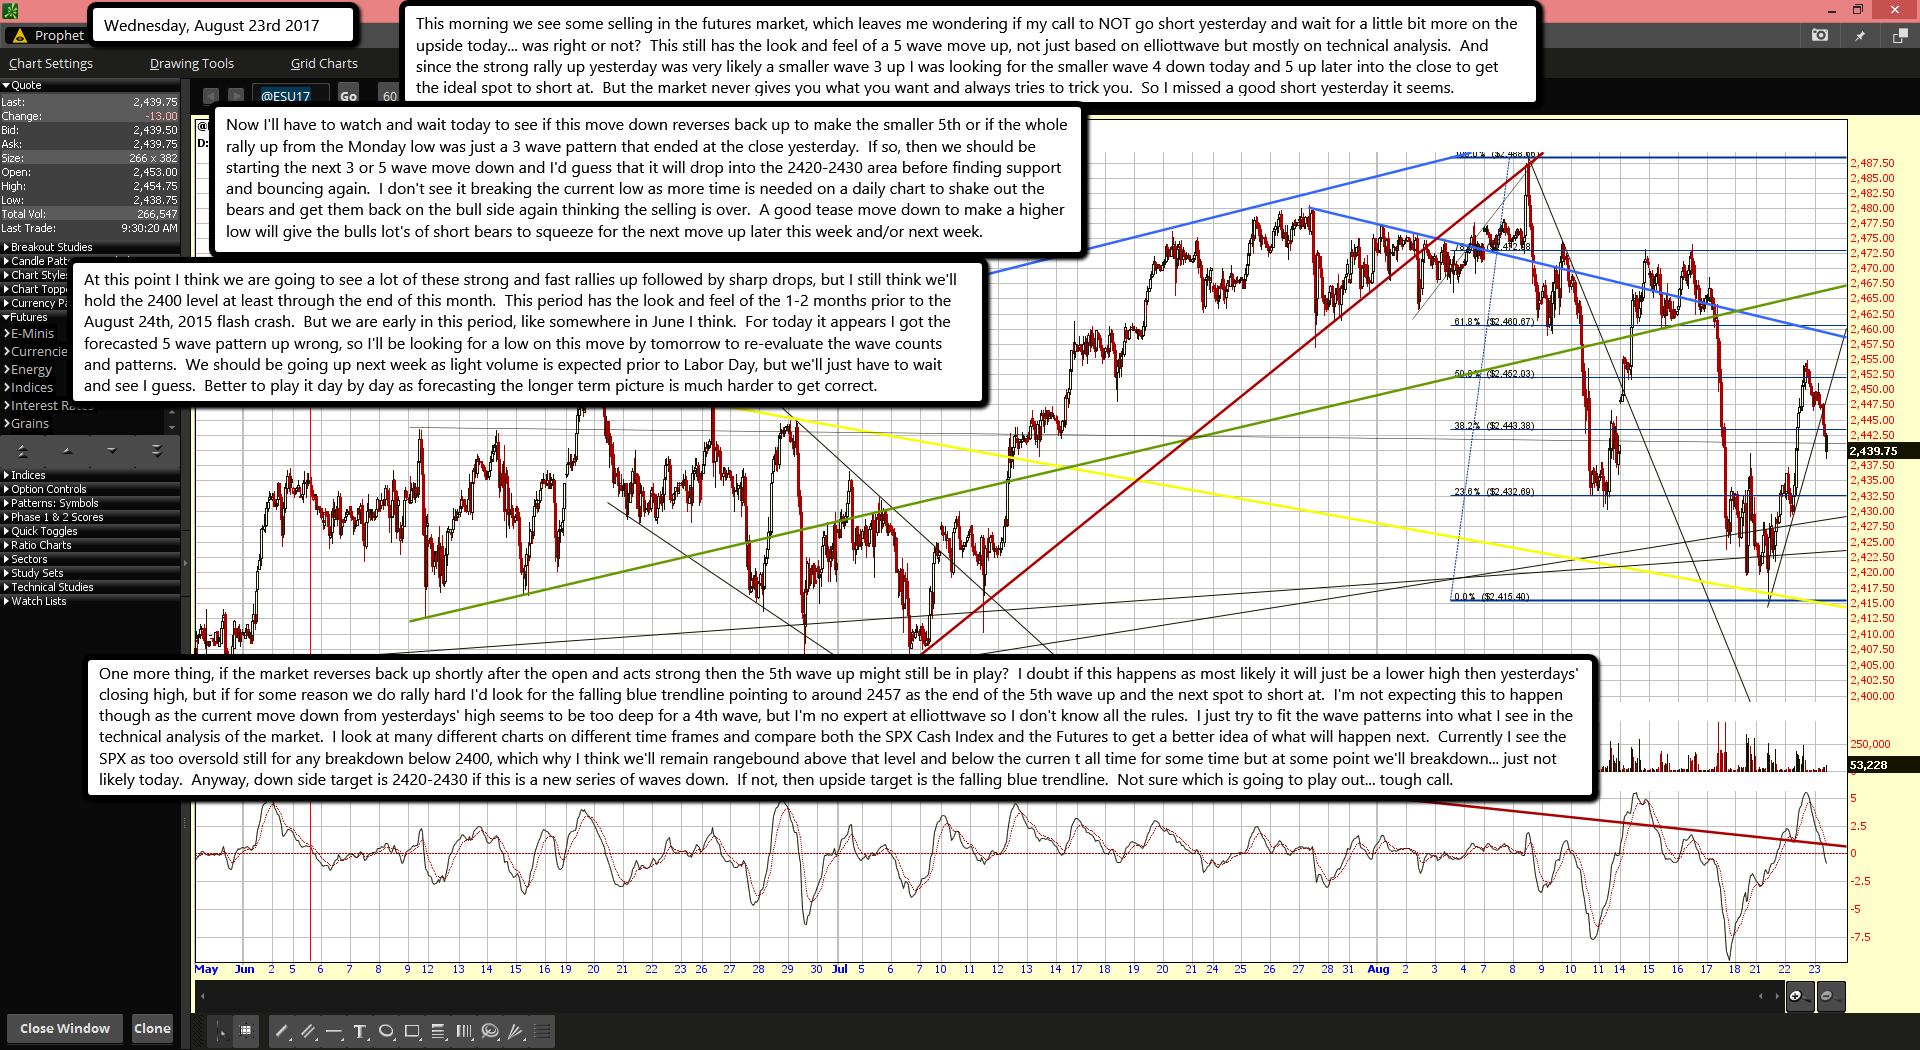
This morning we see some selling in the futures market, which leaves me wondering if my call to NOT go short yesterday and wait for a little bit more on the upside today... was right or not? This still has the look and feel of a 5 wave move up, not just based on elliottwave but mostly on technical analysis. And since the strong rally up yesterday was very likely a smaller wave 3 up I was looking for the smaller wave 4 down today and 5 up later into the close to get the ideal spot to short at. But the market never gives you what you want and always tries to trick you. So I missed a good short yesterday it seems.
Now I'll have to watch and wait today to see if this move down reverses back up to make the smaller 5th or if the whole rally up from the Monday low was just a 3 wave pattern that ended at the close yesterday. If so, then we should be starting the next 3 or 5 wave move down and I'd guess that it will drop into the 2420-2430 area before finding support and bouncing again. I don't see it breaking the current low as more time is needed on a daily chart to shake out the bears and get them back on the bull side again thinking the selling is over. A good tease move down to make a higher low will give the bulls lot's of short bears to squeeze for the next move up later this week and/or next week.
At this point I think we are going to see a lot of these strong and fast rallies up followed by sharp drops, but I still think we'll hold the 2400 level at least through the end of this month. This period has the look and feel of the 1-2 months prior to the August 24th, 2015 flash crash. But we are early in this period, like somewhere in June I think. For today it appears I got the forecasted 5 wave pattern up wrong, so I'll be looking for a low on this move by tomorrow to re-evaluate the wave counts and patterns. We should be going up next week as light volume is expected prior to Labor Day, but we'll just have to wait and see I guess. Better to play it day by day as forecasting the longer term picture is much harder to get correct.
One more thing, if the market reverses back up shortly after the open and acts strong then the 5th wave up might still be in play? I doubt if this happens as most likely it will just be a lower high then yesterdays' closing high, but if for some reason we do rally hard I'd look for the falling blue trendline pointing to around 2457 as the end of the 5th wave up and the next spot to short at. I'm not expecting this to happen though as the current move down from yesterdays' high seems to be too deep for a 4th wave, but I'm no expert at elliottwave so I don't know all the rules. I just try to fit the wave patterns into what I see in the technical analysis of the market. I look at many different charts on different time frames and compare both the SPX Cash Index and the Futures to get a better idea of what will happen next. Currently I see the SPX as too oversold still for any breakdown below 2400, which why I think we'll remain rangebound above that level and below the curren t all time for some time but at some point we'll breakdown... just not likely today. Anyway, down side target is 2420-2430 if this is a new series of waves down. If not, then upside target is the falling blue trendline. Not sure which is going to play out... tough call.

