
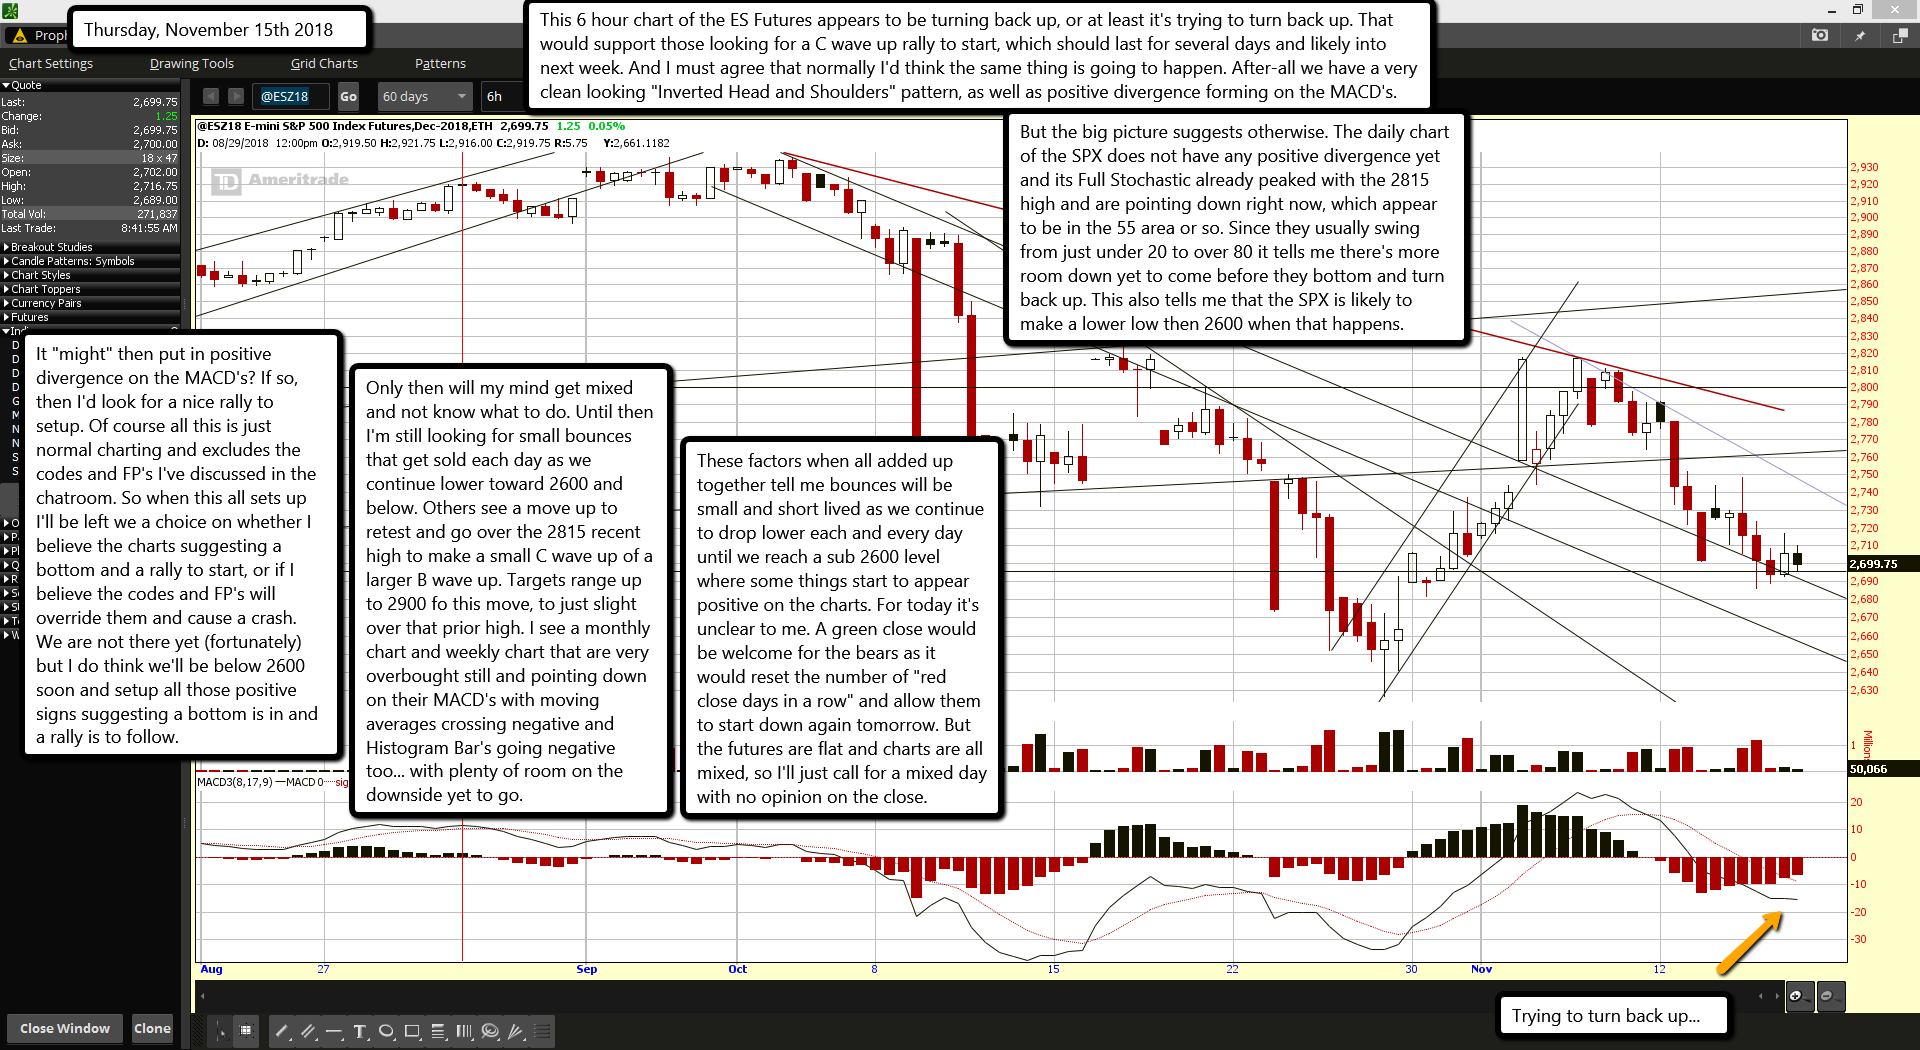
This 6 hour chart of the ES Futures appears to be turning back up, or at least it's trying to turn back up. That would support those looking for a C wave up rally to start, which should last for several days and likely into next week. And I must agree that normally I'd think the same thing is going to happen. After-all we have a very clean looking "Inverted Head and Shoulders" pattern, as well as positive divergence forming on the MACD's.
But the big picture suggests otherwise. The daily chart of the SPX does not have any positive divergence yet and its Full Stochastic already peaked with the 2815 high and are pointing down right now, which appear to be in the 55 area or so. Since they usually swing from just under 20 to over 80 it tells me there's more room down yet to come before they bottom and turn back up. This also tells me that the SPX is likely to make a lower low then 2600 when that happens.
It "might" then put in positive divergence on the MACD's? If so, then I'd look for a nice rally to setup. Of course all this is just normal charting and excludes the codes and FP's I've discussed in the chatroom. So when this all sets up I'll be left we a choice on whether I believe the charts suggesting a bottom and a rally to start, or if I believe the codes and FP's will override them and cause a crash. We are not there yet (fortunately) but I do think we'll be below 2600 soon and setup all those positive signs suggesting a bottom is in and a rally is to follow.
Only then will my mind get mixed and not know what to do. Until then I'm still looking for small bounces that get sold each day as we continue lower toward 2600 and below. Others see a move up to retest and go over the 2815 recent high to make a small C wave up of a larger B wave up. Targets range up to 2900 fo this move, to just slight over that prior high. I see a monthly chart and weekly chart that are very overbought still and pointing down on their MACD's with moving averages crossing negative and Histogram Bar's going negative too... with plenty of room on the downside yet to go.
These factors when all added up together tell me bounces will be small and short lived as we continue to drop lower each and every day until we reach a sub 2600 level where some things start to appear positive on the charts. For today it's unclear to me. A green close would be welcome for the bears as it would reset the number of "red close days in a row" and allow them to start down again tomorrow. But the futures are flat and charts are all mixed, so I'll just call for a mixed day with no opinion on the close.

