
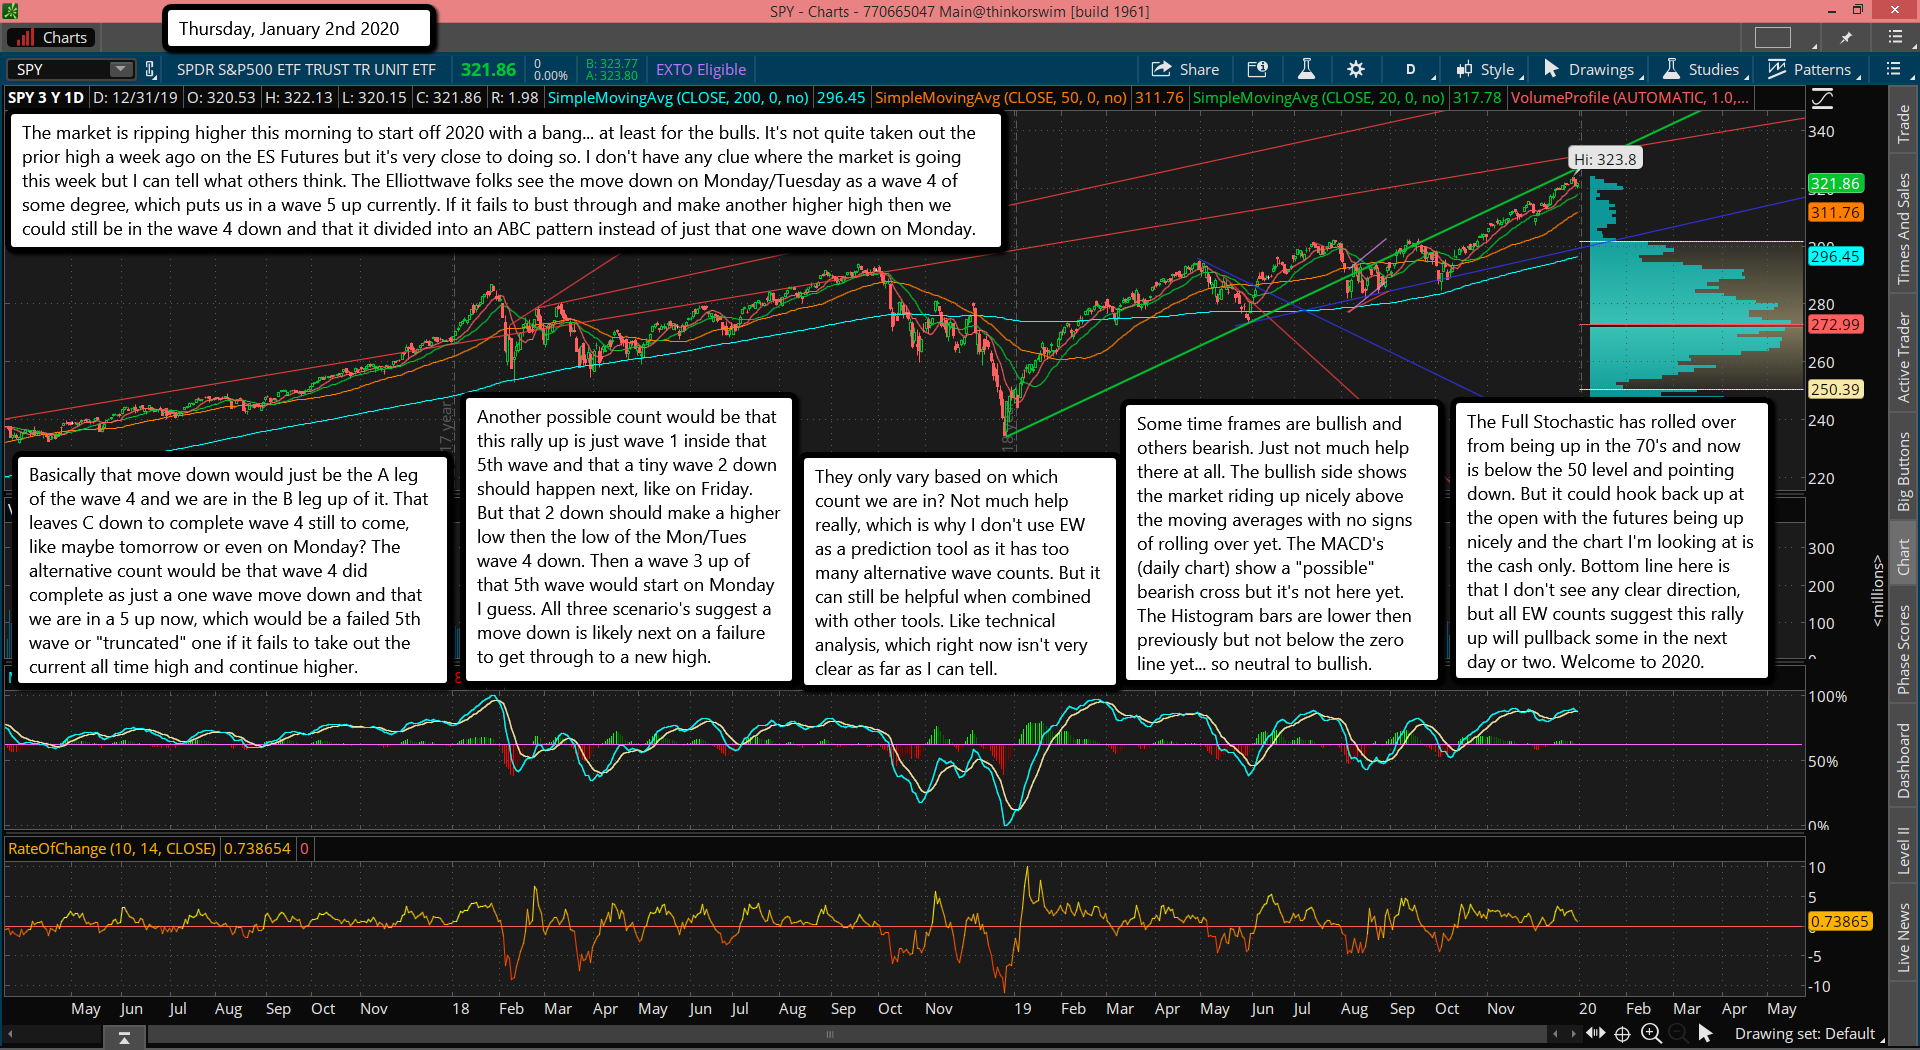
The market is ripping higher this morning to start off 2020 with a bang... at least for the bulls. It's not quite taken out the prior high a week ago on the ES Futures but it's very close to doing so. I don't have any clue where the market is going this week but I can tell what others think. The Elliottwave folks see the move down on Monday/Tuesday as a wave 4 of some degree, which puts us in a wave 5 up currently. If it fails to bust through and make another higher high then we could still be in the wave 4 down and that it divided into an ABC pattern instead of just that one wave down on Monday.
Basically that move down would just be the A leg of the wave 4 and we are in the B leg up of it. That leaves C down to complete wave 4 still to come, like maybe tomorrow or even on Monday? The alternative count would be that wave 4 did complete as just a one wave move down and that we are in a 5 up now, which would be a failed 5th wave or "truncated" one if it fails to take out the current all time high and continue higher.
Another possible count would be that this rally up is just wave 1 inside that 5th wave and that a tiny wave 2 down should happen next, like on Friday. But that 2 down should make a higher low then the low of the Mon/Tues wave 4 down. Then a wave 3 up of that 5th wave would start on Monday I guess. All three scenario's suggest a move down is likely next on a failure to get through to a new high.
They only vary based on which count we are in? Not much help really, which is why I don't use EW as a prediction tool as it has too many alternative wave counts. But it can still be helpful when combined with other tools. Like technical analysis, which right now isn't very clear as far as I can tell.
Some time frames are bullish and others bearish. Just not much help there at all. The bullish side shows the market riding up nicely above the moving averages with no signs of rolling over yet. The MACD's (daily chart) show a "possible" bearish cross but it's not here yet. The Histogram bars are lower then previously but not below the zero line yet... so neutral to bullish.
The Full Stochastic has rolled over from being up in the 70's and now is below the 50 level and pointing down. But it could hook back up at the open with the futures being up nicely and the chart I'm looking at is the cash only. Bottom line here is that I don't see any clear direction, but all EW counts suggest this rally up will pullback some in the next day or two. Welcome to 2020.

