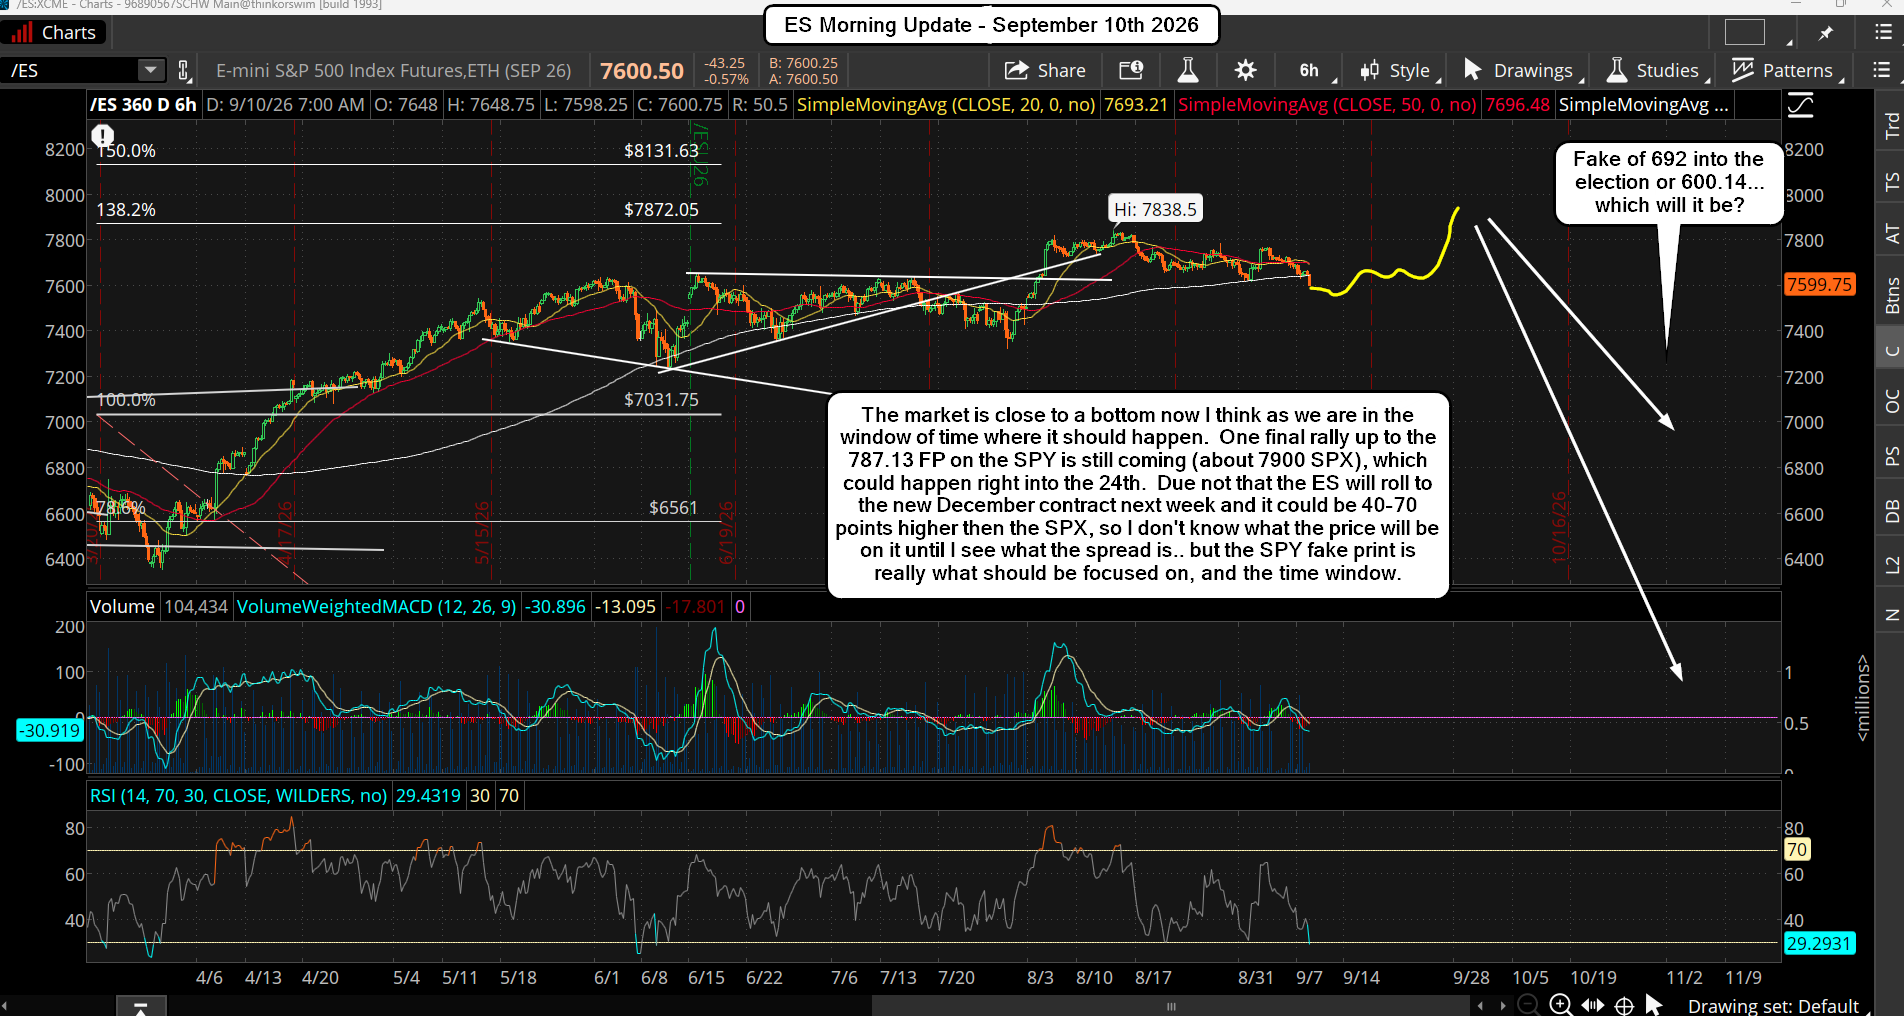
The market is getting close now to a bottom, but it's not known if it's going to the 7500 zone or if it just double bottoms (higher low) with the recent low last week. It's not important as it's not something that can be traded with any hope of making a profit. The best move of the year is still a few weeks away, and is the short for the 10=12% correction.
The range for the upside "Fake Print" of 787.13 to get hit (and pierced) is still around September 22nd to October 3rd. It's a wide window but it's reminding me a lot of the 2018 FP that appeared on February 27th of that year, which was for 293.90 on the SPY, and then hit on September 20th, 2018... which was pierced by only 4 cents (293.94). The market pulled back very small (more chop basically) and went back up to retest that high (slightly lower high at 293.21) on October 3rd, 2018.
After that it fell apart and bottomed into October 29th with an ABC pattern down. It rallied half the drop and did another ABC down into a Christmas Eve final low, but I'm not expecting that part to repeat. If we see the 692 FP hit into the coming November election I think that will be "the low" and we won't see the 600.14 FP until some other time in the future. I suspect everyone will pick up the 2018 pattern when the 692 FP is hit and will short the rally up after it expecting to see it repeat into another Christmas low, but I don't think that will happen.
I am open to the idea that the 600.14 FP is the low into the election, and that the first drop down to the 692 low happens into October 9th-11th (in 2018 the first drop for the A wave end on the 11th). If we see this happen then we could see a similar move up like 2018 where we top for the B wave around the 17th and the C wave drops to the 600.14 FP into the election. That chart is below...
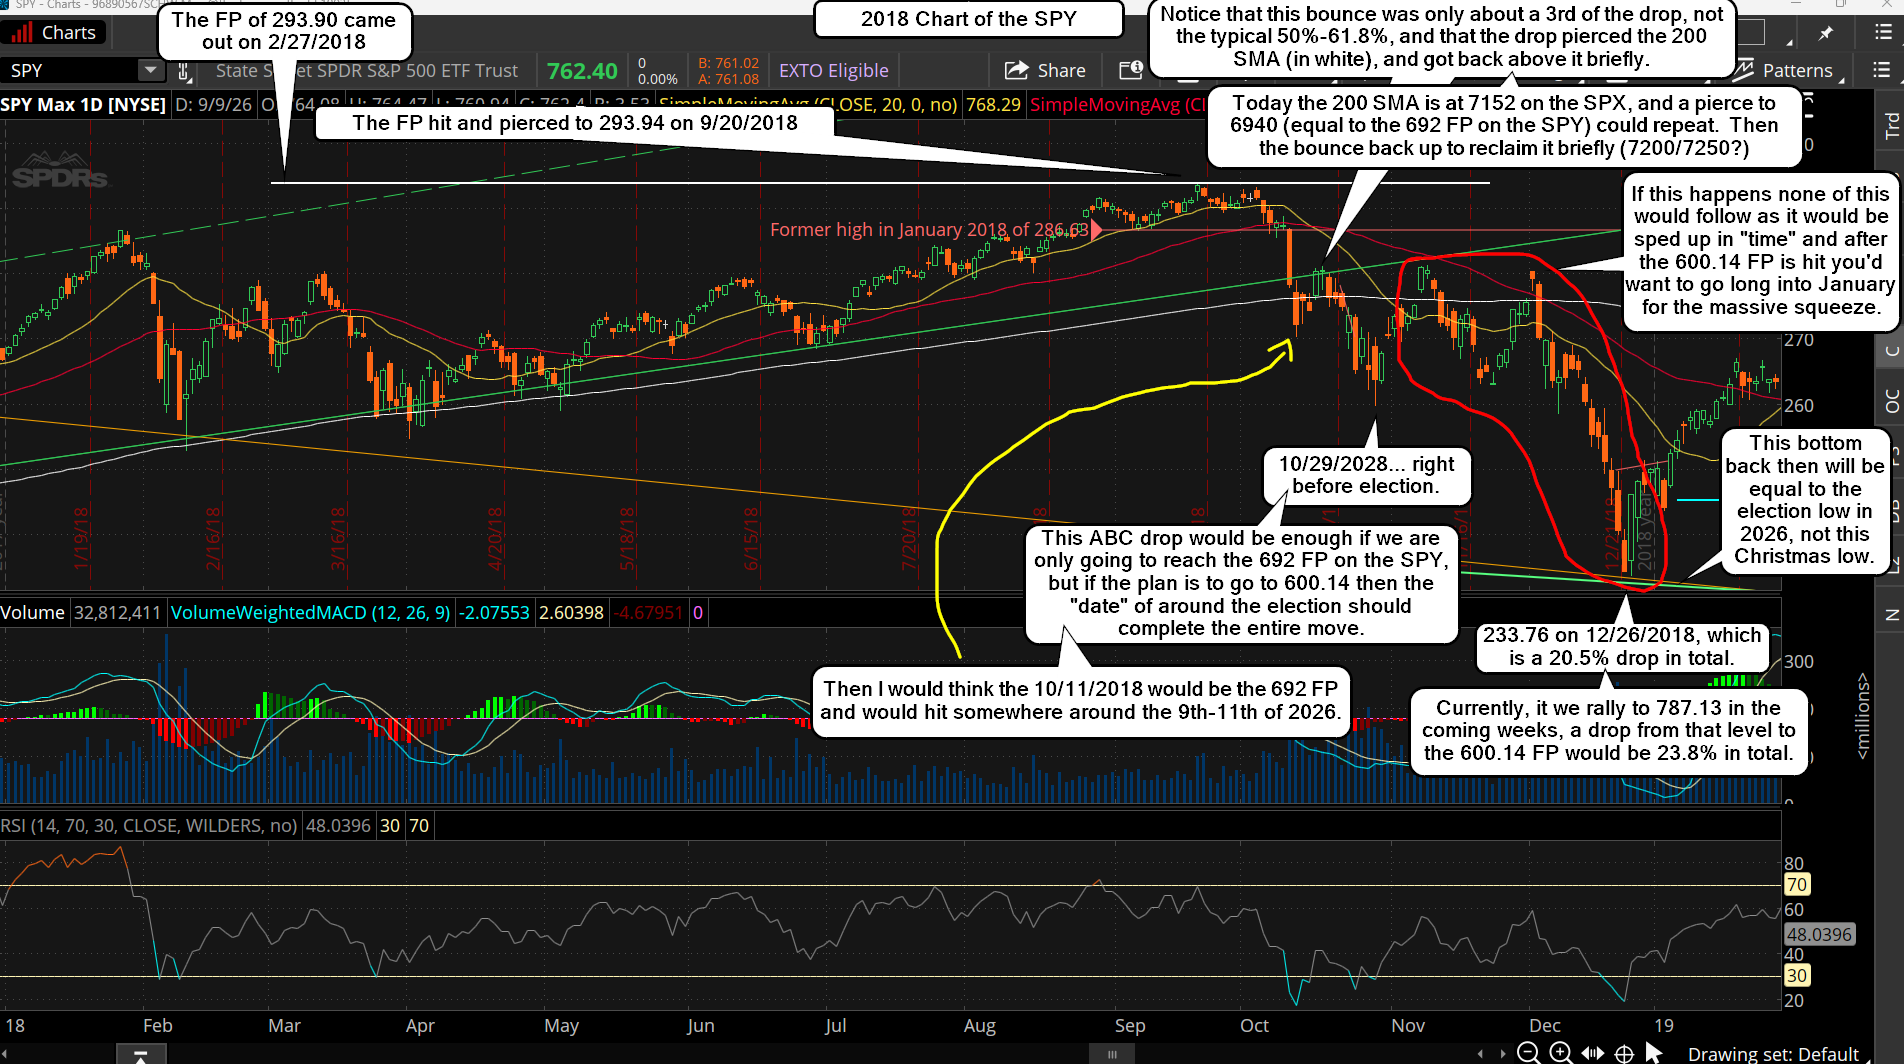
This is Path Number 2 that I mentioned last week, which is possible. I don't know what is coming in the near future but I feel like it will take some kind of "event" to cause the drop to happen to the 600.14 FP as that's very deep. It would end up being similar to 2018 in percentage for the entire correction as that one was 20.5% in total and from 787.13 to 600.14 is 23.8%... so that's "close" to the same. What kind of event could cause such a drop you ask? I don't know but I found the video below very interesting at the 32 minute mark.
If something bad happened to Trump the market would fall off a cliff for sure. I certainly don't want anything like this to happen but he is up there in age and very overworked with tons of stress on him, so he's susceptible to having health issues. I pray nothing happens, but the FP's are real targets that will be hit at some point... when is always the "unknown". Maybe it will be some other unknown event that happens to cause the drop to the 600.14 FP into the election? If that's the plan then let's hope it's something else.
Something BIG is coming according the Bo Polny, and while you can't always assume that anything he predicts will affect the stock market I have the FP's, the seasonal's, and the cycles to back up his prediction. Below is his latest video, and around the 1 hour mark is when he talks about the stock market. Do note that his super important date of September 24th is right in the middle of the 9/22 to 10/3 window that the cycles say a high should happen at. Possibly we hit the 787.13 FP on the 24th, or the day before?
For the short term there's nothing to add as the market continues to chop in a tight range that is not tradable in my opinion. I'm waiting patiently for the upside FP of 787.13 to get hit (and pierced) sometime in the next 2-4 weeks.
Have a great weekend.