Saturday, July 25, 2026
Home Blog Page 53

ES Morning Update December 29th 2017

0

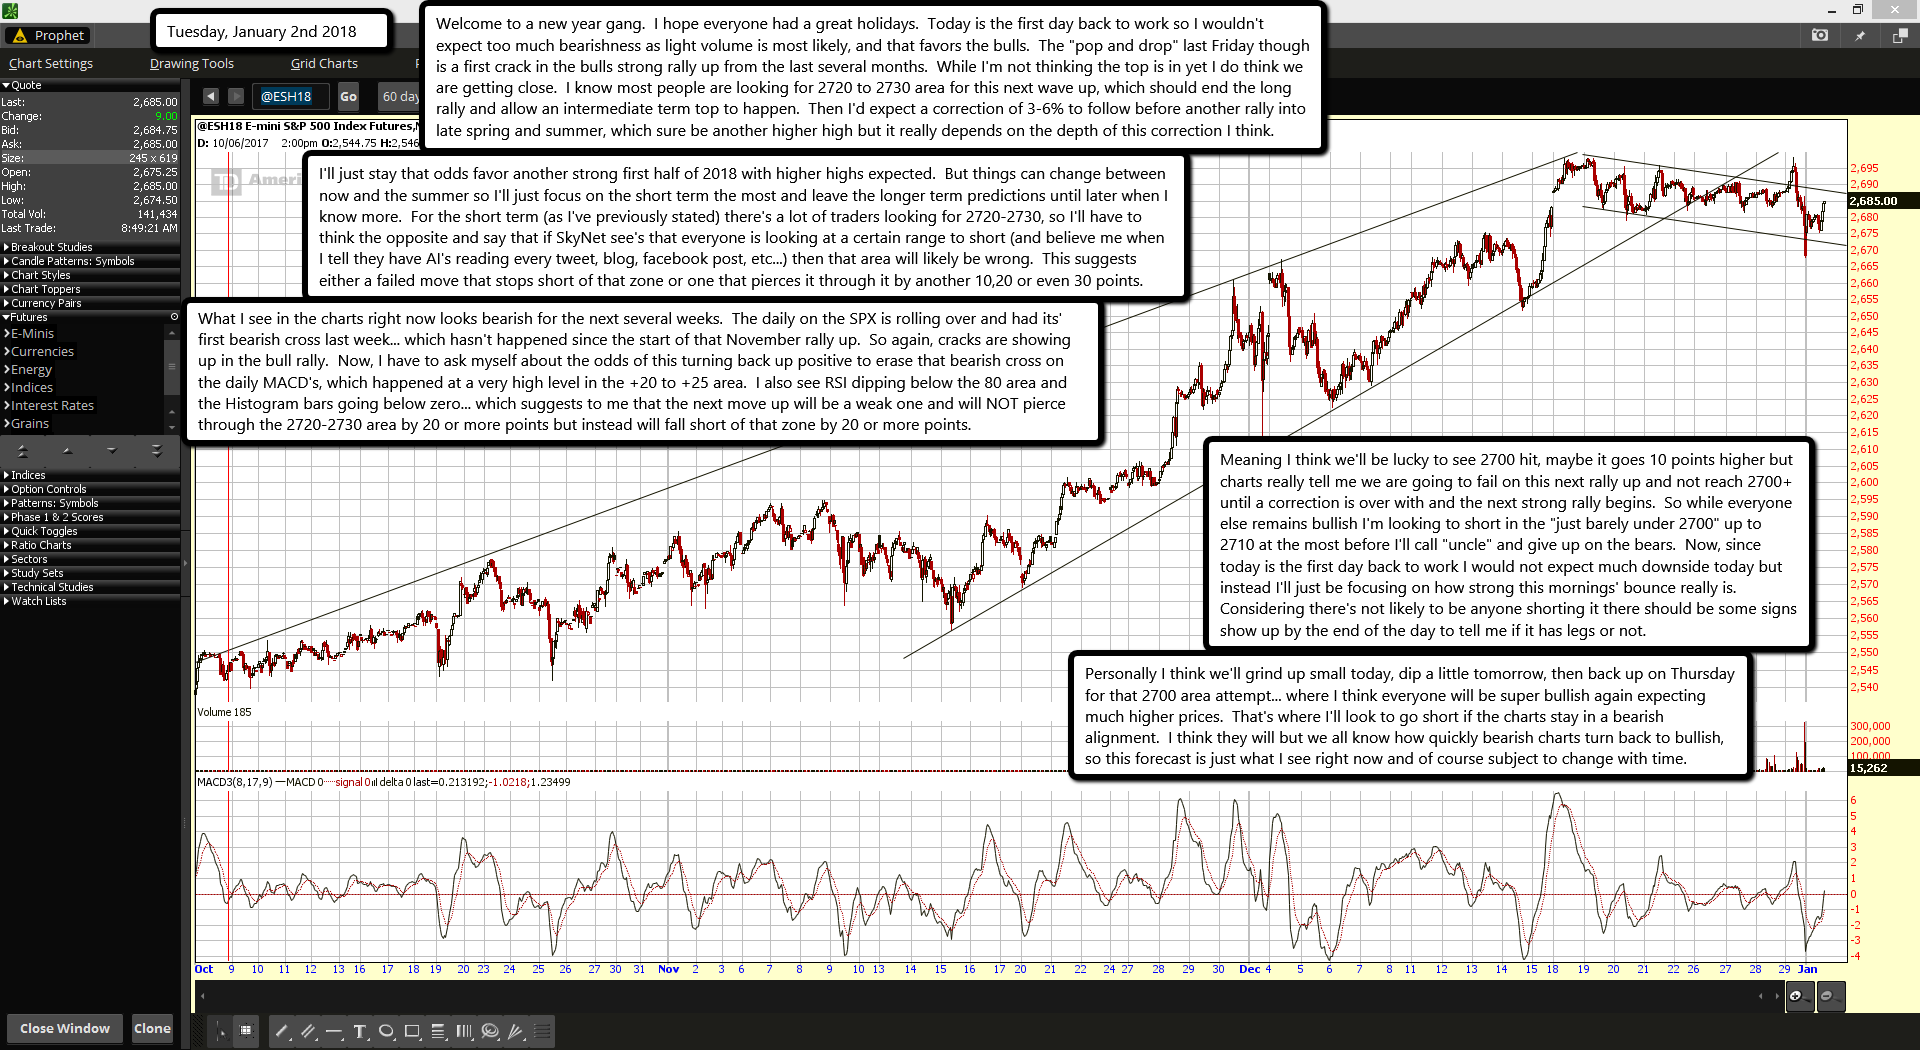
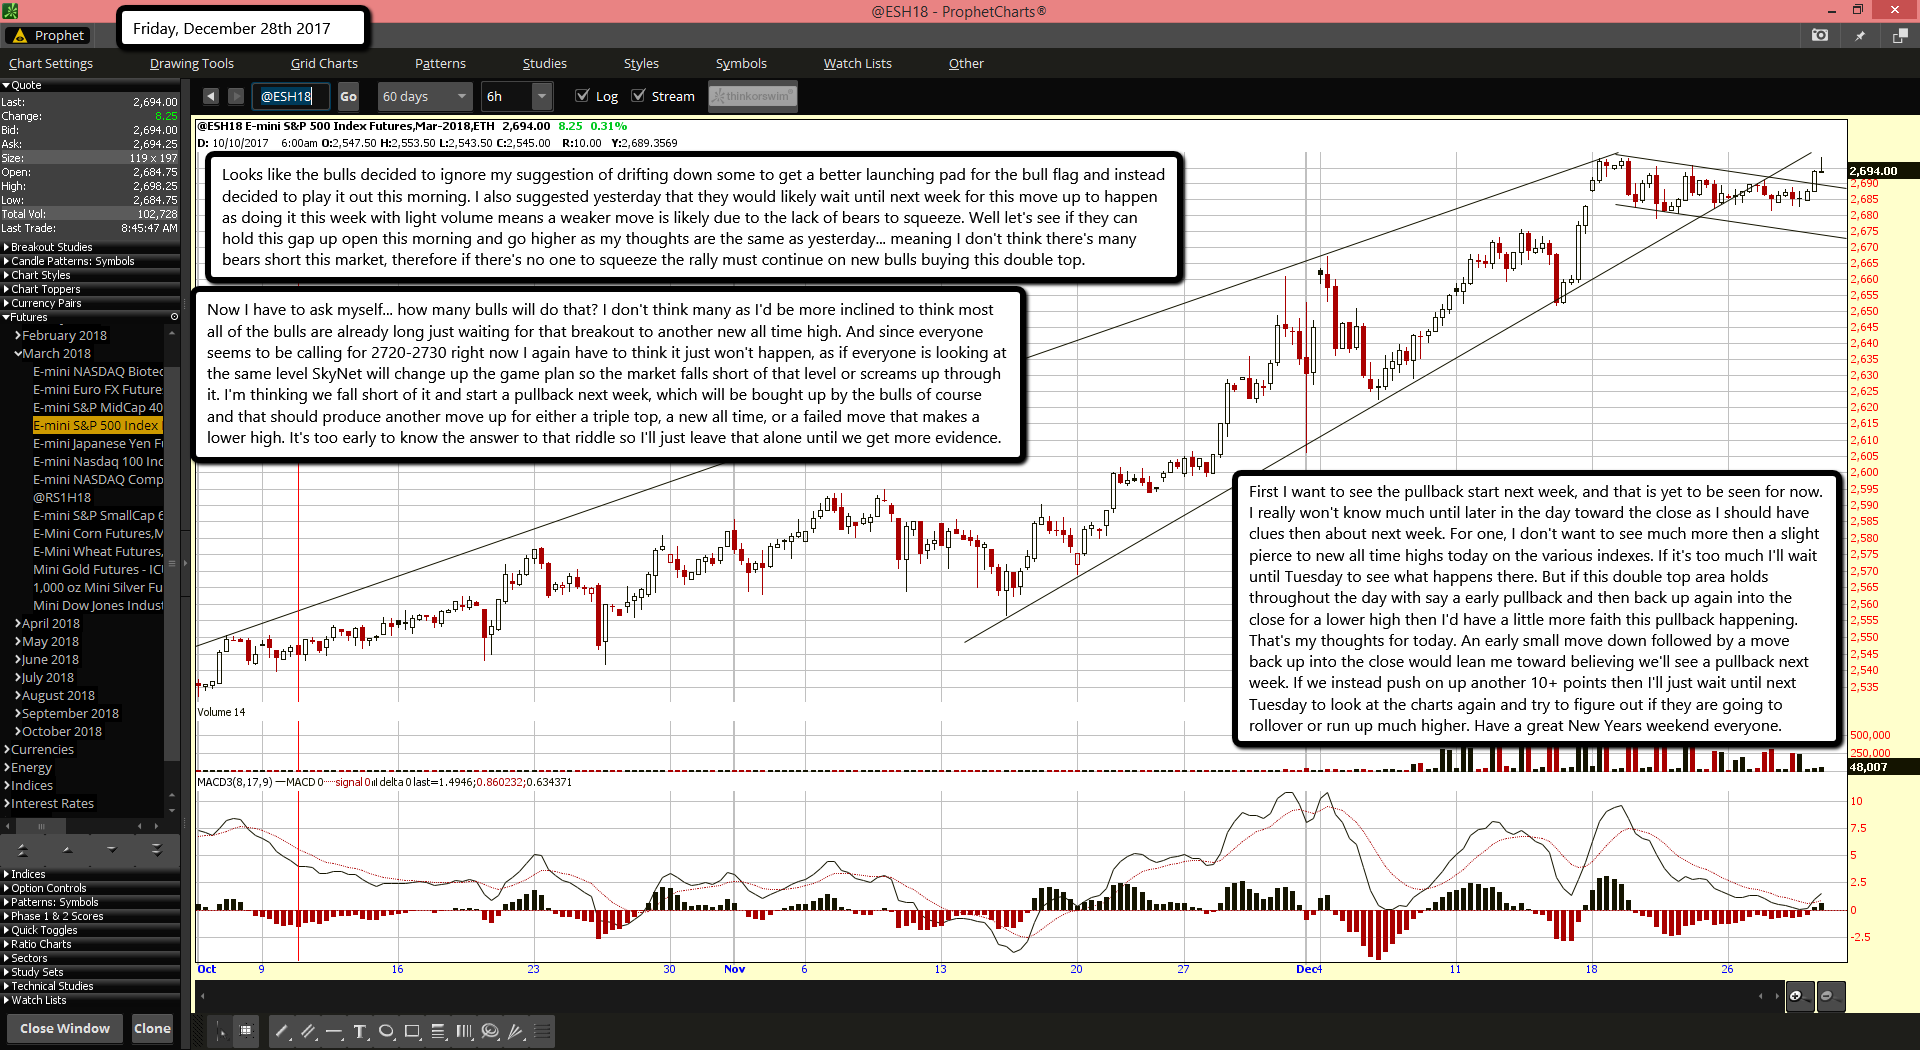
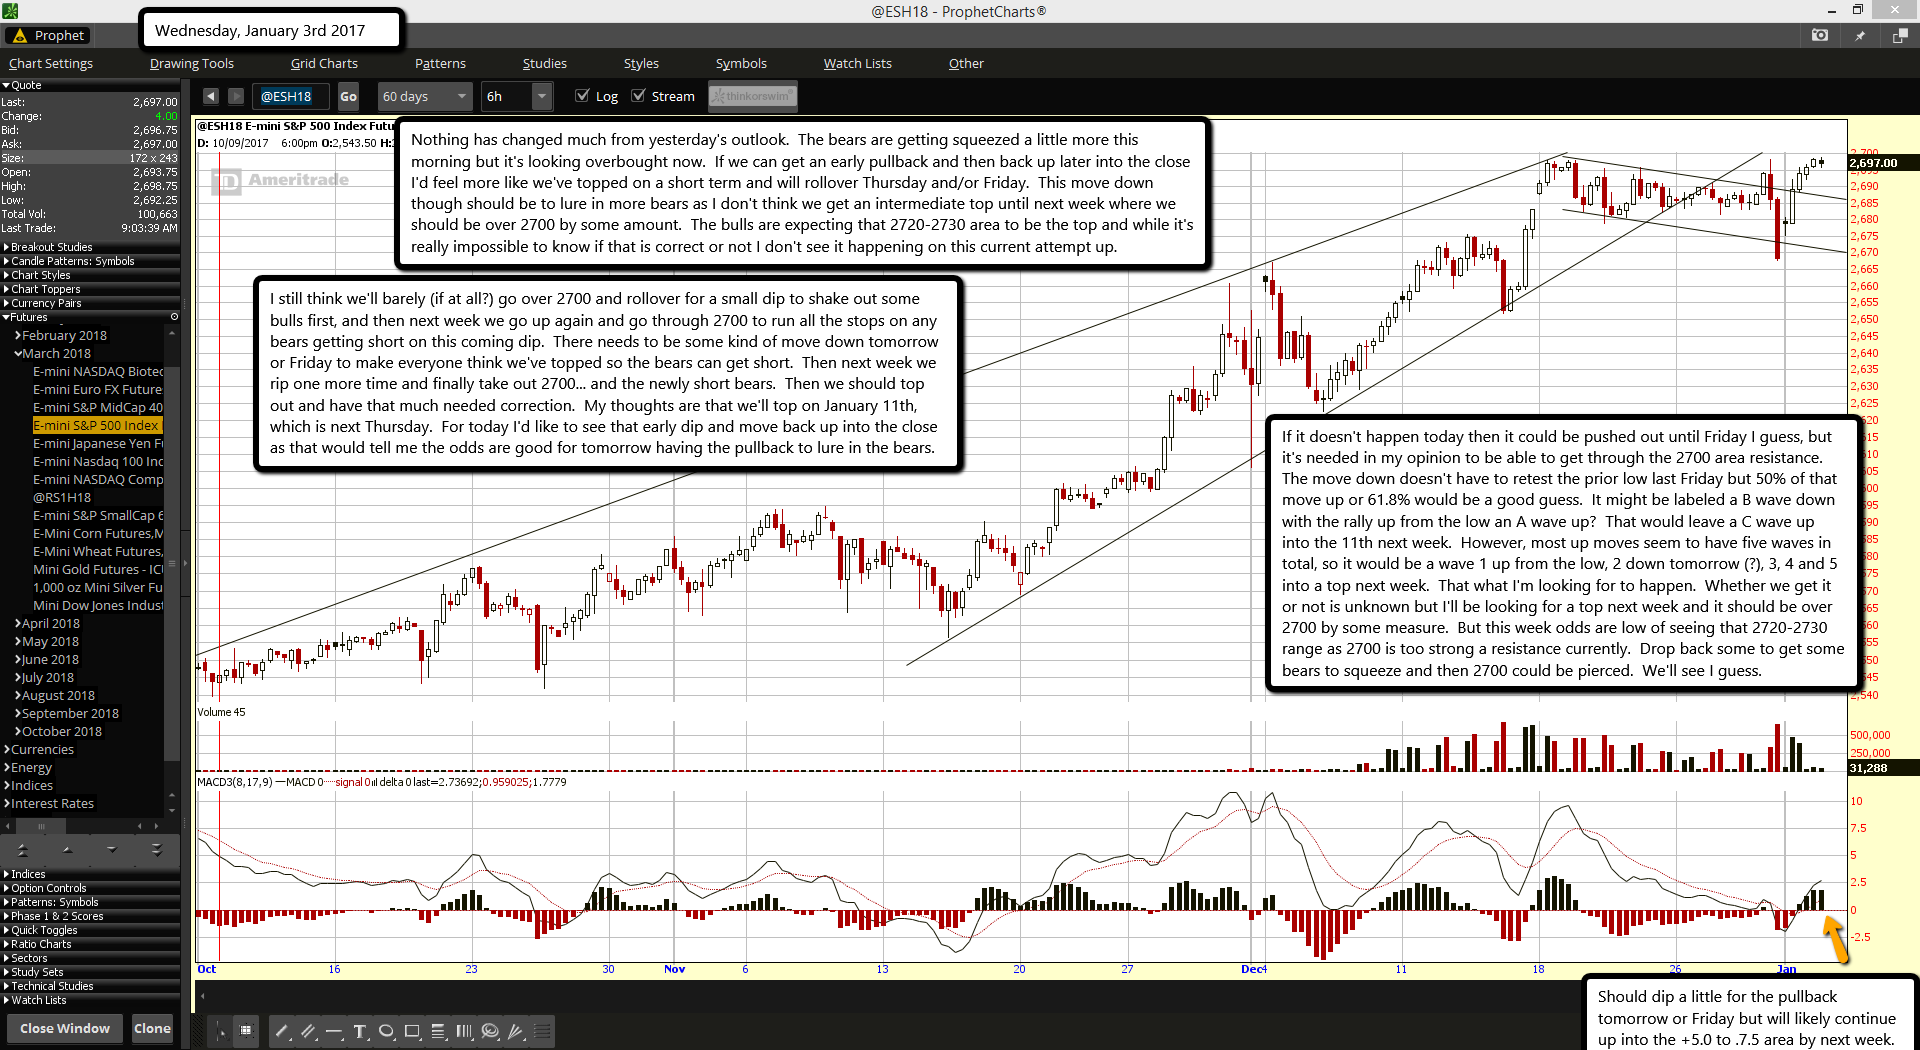
Looks like the bulls decided to ignore my suggestion of drifting down some to get a better launching pad for the bull flag and instead decided to play it out this morning. I also suggested yesterday that they would likely wait until next week for this move up to happen as doing it this week with light volume means a weaker move is likely due to the lack of bears to squeeze. Well let's see if they can hold this gap up open this morning and go higher as my thoughts are the same as yesterday... meaning I don't think there's many bears short this market, therefore if there's no one to squeeze the rally must continue on new bulls buying this double top.

Now I have to ask myself... how many bulls will do that? I don't think many as I'd be more inclined to think most all of the bulls are already long just waiting for that breakout to another new all time high. And since everyone seems to be calling for 2720-2730 right now I again have to think it just won't happen, as if everyone is looking at the same level SkyNet will change up the game plan so the market falls short of that level or screams up through it. I'm thinking we fall short of it and start a pullback next week, which will be bought up by the bulls of course and that should produce another move up for either a triple top, a new all time, or a failed move that makes a lower high. It's too early to know the answer to that riddle so I'll just leave that alone until we get more evidence.

First I want to see the pullback start next week, and that is yet to be seen for now. I really won't know much until later in the day toward the close as I should have clues then about next week. For one, I don't want to see much more then a slight pierce to new all time highs today on the various indexes. If it's too much I'll wait until Tuesday to see what happens there. But if this double top area holds throughout the day with say a early pullback and then back up again into the close for a lower high then I'd have a little more faith this pullback happening. That's my thoughts for today. An early small move down followed by a move back up into the close would lean me toward believing we'll see a pullback next week. If we instead push on up another 10+ points then I'll just wait until next Tuesday to look at the charts again and try to figure out if they are going to rollover or run up much higher. Have a great New Years weekend everyone.

ES Morning Update December 28th 2017

0

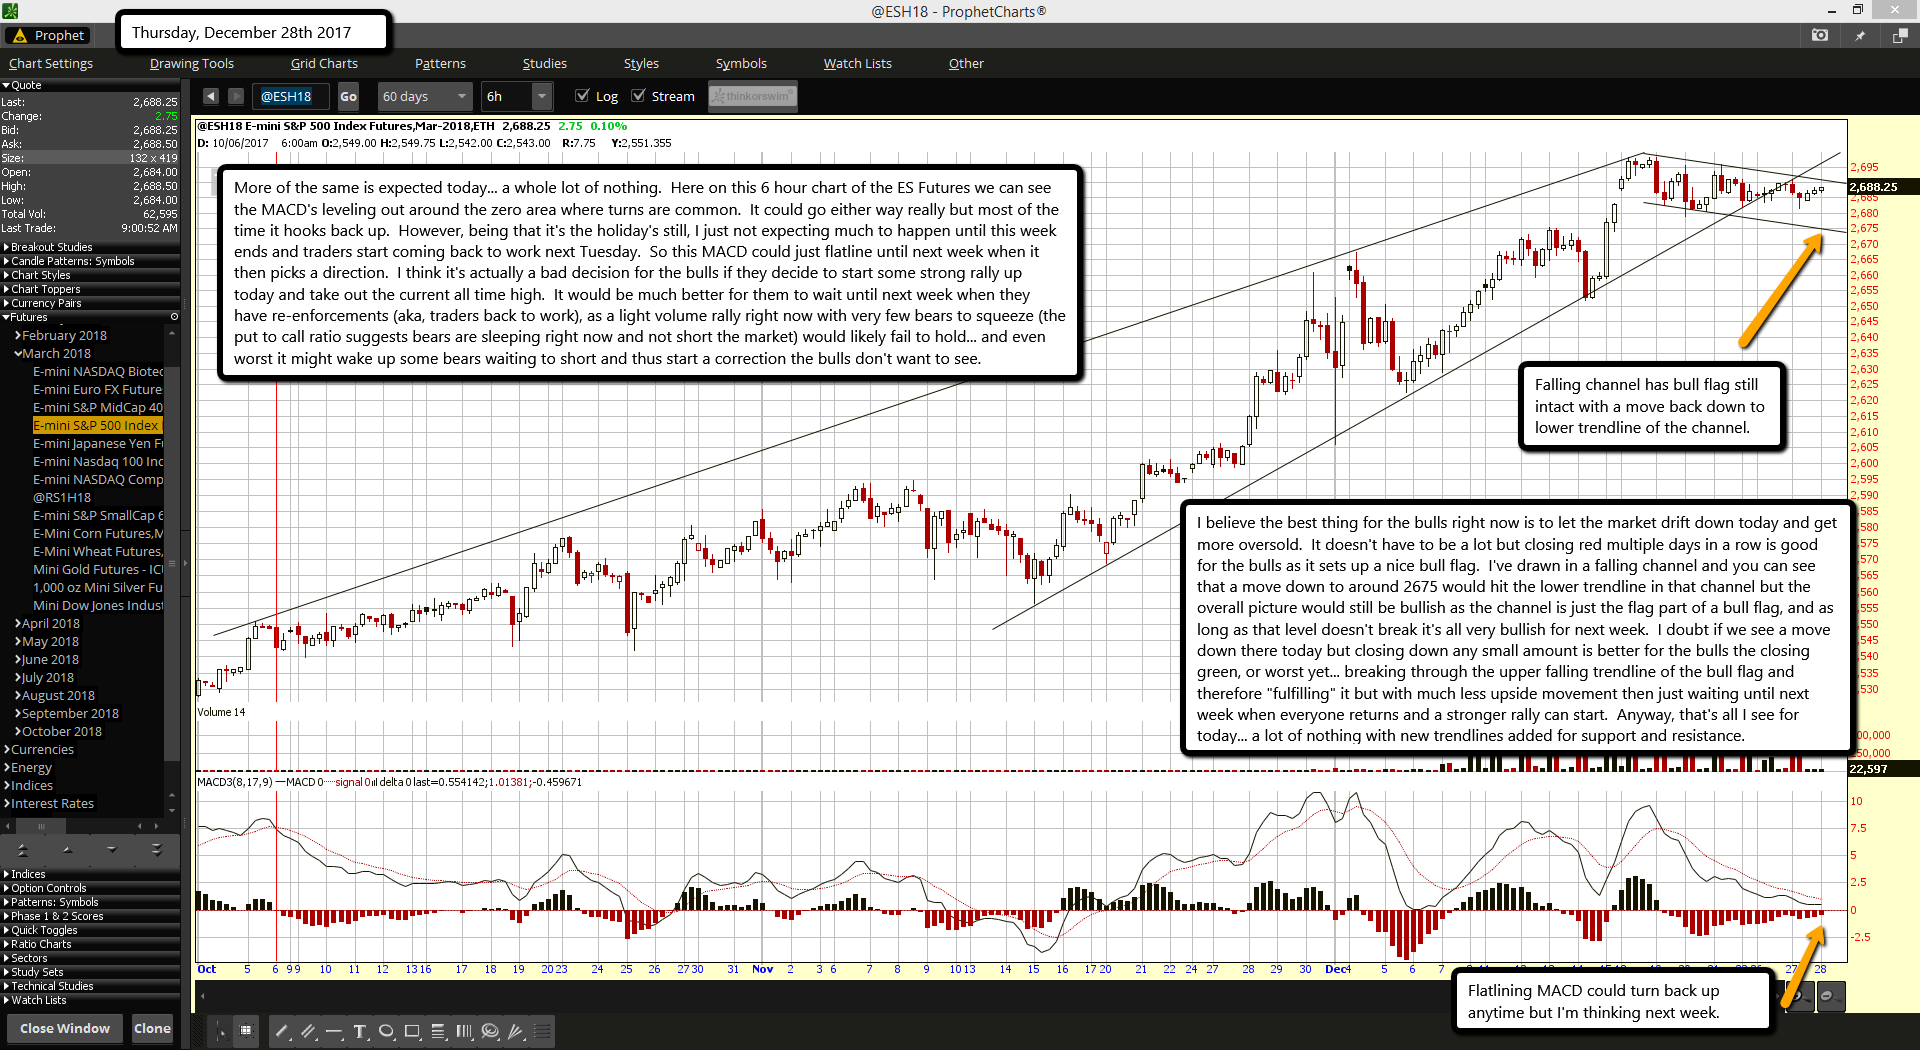
More of the same is expected today... a whole lot of nothing.  Here on this 6 hour chart of the ES Futures we can see the MACD's leveling out around the zero area where turns are common.  It could go either way really but most of the time it hooks back up.  However, being that it's the holiday's still, I just not expecting much to happen until this week ends and traders start coming back to work next Tuesday.  So this MACD could just flatline until next week when it then picks a direction.  I think it's actually a bad decision for the bulls if they decide to start some strong rally up today and take out the current all time high.  It would be much better for them to wait until next week when they have re-enforcements (aka, traders back to work), as a light volume rally right now with very few bears to squeeze (the put to call ratio suggests bears are sleeping right now and not short the market) would likely fail to hold... and even worst it might wake up some bears waiting to short and thus start a correction the bulls don't want to see.

I believe the best thing for the bulls right now is to let the market drift down today and get more oversold.  It doesn't have to be a lot but closing red multiple days in a row is good for the bulls as it sets up a nice bull flag.  I've drawn in a falling channel and you can see that a move down to around 2675 would hit the lower trendline in that channel but the overall picture would still be bullish as the channel is just the flag part of a bull flag, and as long as that level doesn't break it's all very bullish for next week.  I doubt if we see a move down there today but closing down any small amount is better for the bulls the closing green, or worst yet... breaking through the upper falling trendline of the bull flag and therefore "fulfilling" it but with much less upside movement then just waiting until next week when everyone returns and a stronger rally can start.  Anyway, that's all I see for today... a lot of nothing with new trendlines added for support and resistance.

ES Morning Update December 27th 2017

0

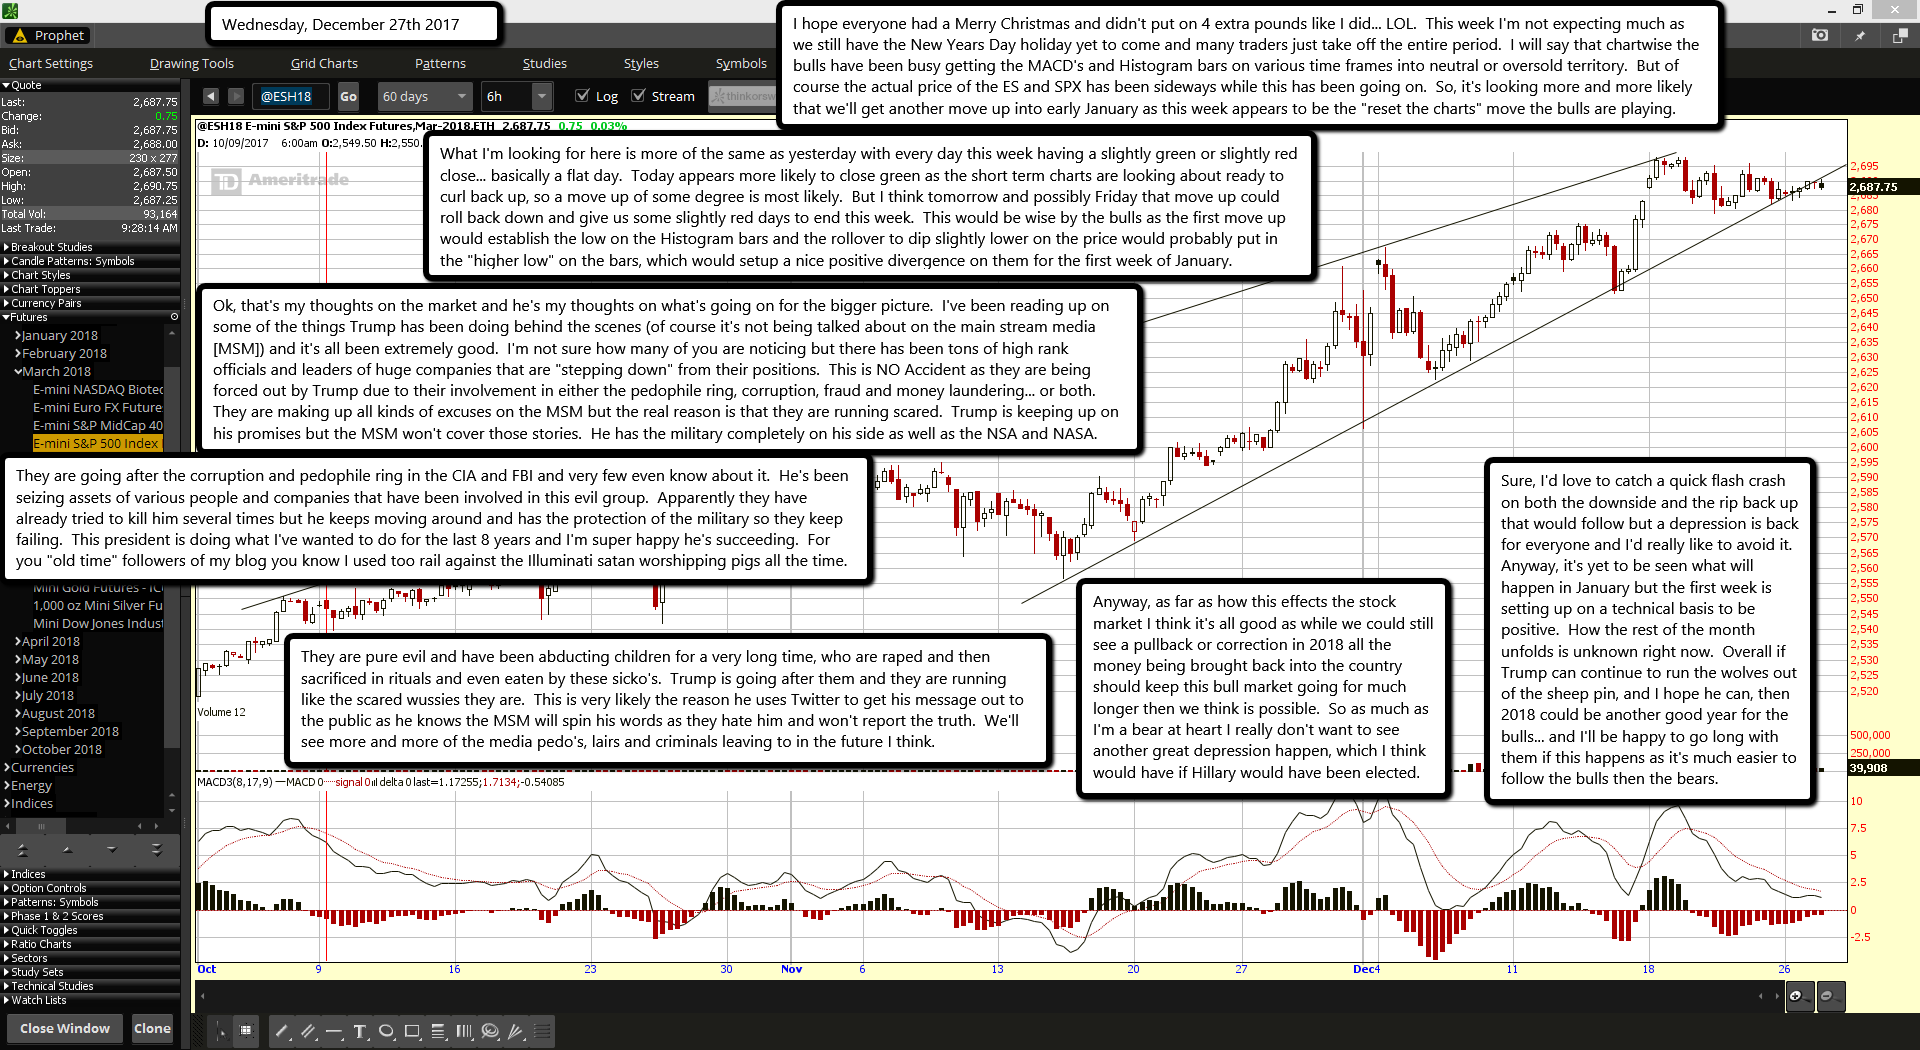
I hope everyone had a Merry Christmas and didn't put on 4 extra pounds like I did... LOL.  This week I'm not expecting much as we still have the New Years Day holiday yet to come and many traders just take off the entire period.  I will say that chartwise the bulls have been busy getting the MACD's and Histogram bars on various time frames into neutral or oversold territory.  But of course the actual price of the ES and SPX has been sideways while this has been going on.  So, it's looking more and more likely that we'll get another move up into early January as this week appears to be the "reset the charts" move the bulls are playing.

What I'm looking for here is more of the same as yesterday with every day this week having a slightly green or slightly red close... basically a flat day.  Today appears more likely to close green as the short term charts are looking about ready to curl back up, so a move up of some degree is most likely.  But I think tomorrow and possibly Friday that move up could roll back down and give us some slightly red days to end this week.  This would be wise by the bulls as the first move up would establish the low on the Histogram bars and the rollover to dip slightly lower on the price would probably put in the "higher low" on the bars, which would setup a nice positive divergence on them for the first week of January.

Ok, that's my thoughts on the market and he's my thoughts on what's going on for the bigger picture.  I've been reading up on some of the things Trump has been doing behind the scenes (of course it's not being talked about on the main stream media [MSM]) and it's all been extremely good.  I'm not sure how many of you are noticing but there has been tons of high rank officials and leaders of huge companies that are "stepping down" from their positions.  This is NO Accident as they are being forced out by Trump due to their involvement in either the pedophile ring, corruption, fraud and money laundering... or both.  They are making up all kinds of excuses on the MSM but the real reason is that they are running scared.  Trump is keeping up on his promises but the MSM won't cover those stories.  He has the military completely on his side as well as the NSA and NASA.

They are going after the corruption and pedophile ring in the CIA and FBI and very few even know about it.  He's been seizing assets of various people and companies that have been involved in this evil group.  Apparently they have already tried to kill him several times but he keeps moving around and has the protection of the military so they keep failing.  This president is doing what I've wanted to do for the last 8 years and I'm super happy he's succeeding.  For you "old time" followers of my blog you know I used too rail against the Illuminati satan worshipping pigs all the time.

They are pure evil and have been abducting children for a very long time, who are raped and then sacrificed in rituals and even eaten by these sicko's.  Trump is going after them and they are running like the scared wussies they are.  This is very likely the reason he uses Twitter to get his message out to the public as he knows the MSM will spin his words as they hate him and won't report the truth.  We'll see more and more of the media pedo's, lairs and criminals leaving to in the future I think.

Anyway, as far as how this effects the stock market I think it's all good as while we could still see a pullback or correction in 2018 all the money being brought back into the country should keep this bull market going for much longer then we think is possible.  So as much as I'm a bear at heart I really don't want to see another great depression happen, which I think would have if Hillary would have been elected.

Sure, I'd love to catch a quick flash crash on both the downside and the rip back up that would follow but a depression is back for everyone and I'd really like to avoid it.  Anyway, it's yet to be seen what will happen in January but the first week is setting up on a technical basis to be positive.  How the rest of the month unfolds is unknown right now.  Overall if Trump can continue to run the wolves out of the sheep pin, and I hope he can, then 2018 could be another good year for the bulls... and I'll be happy to go long with them if this happens as it's much easier to follow the bulls then the bears.

Happy Holidays

0

Have a great holiday everyone... see you all back next Tuesday after Christmas.

Red

ES Morning Update December 21st 2017

0

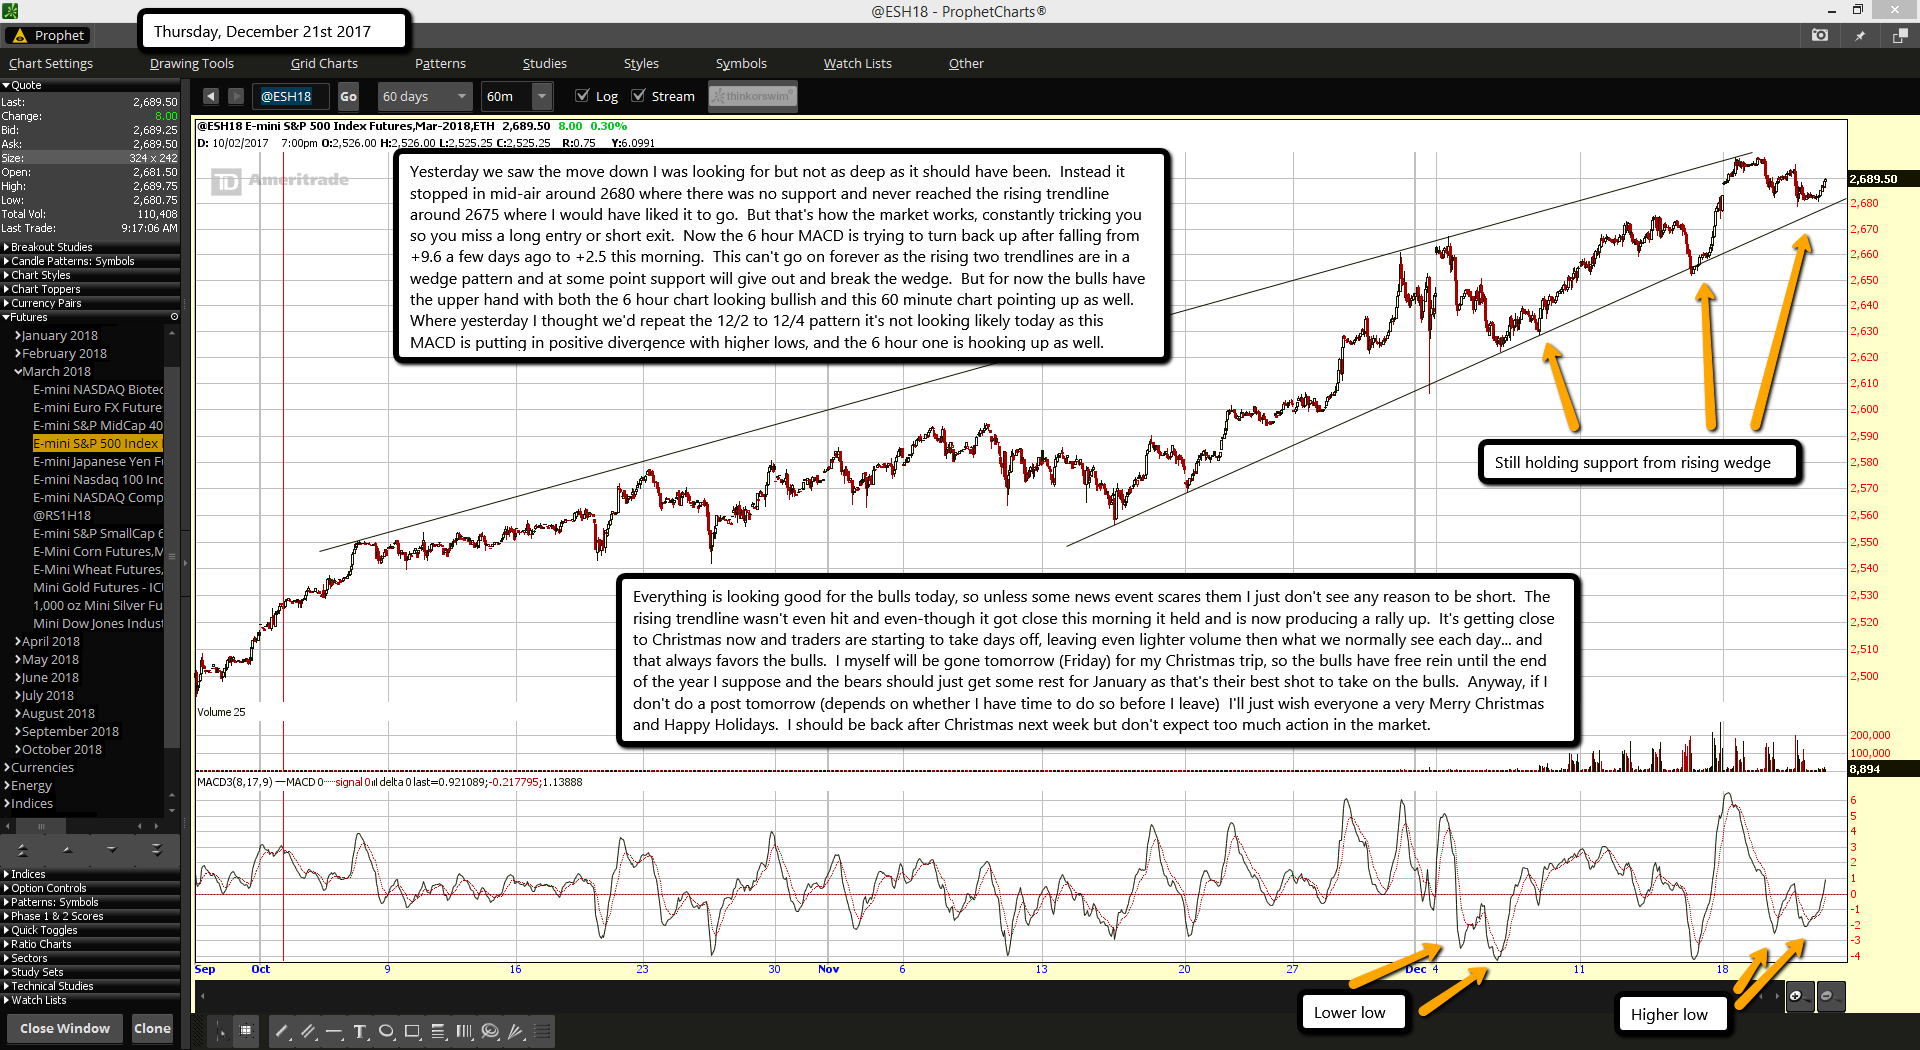
Yesterday we saw the move down I was looking for but not as deep as it should have been.  Instead it stopped in mid-air around 2680 where there was no support and never reached the rising trendline around 2675 where I would have liked it to go.  But that's how the market works, constantly tricking you so you miss a long entry or short exit.  Now the 6 hour MACD is trying to turn back up after falling from +9.6 a few days ago to +2.5 this morning.  This can't go on forever as the rising two trendlines are in a wedge pattern and at some point support will give out and break the wedge.  But for now the bulls have the upper hand with both the 6 hour chart looking bullish and this 60 minute chart pointing up as well.  Where yesterday I thought we'd repeat the 12/2 to 12/4 pattern it's not looking likely today as this MACD is putting in positive divergence with higher lows, and the 6 hour one is hooking up as well.

Everything is looking good for the bulls today, so unless some news event scares them I just don't see any reason to be short.  The rising trendline wasn't even hit and even-though it got close this morning it held and is now producing a rally up.  It's getting close to Christmas now and traders are starting to take days off, leaving even lighter volume then what we normally see each day... and that always favors the bulls.  I myself will be gone tomorrow (Friday) for my Christmas trip, so the bulls have free rein until the end of the year I suppose and the bears should just get some rest for January as that's their best shot to take on the bulls.  Anyway, if I don't do a post tomorrow (depends on whether I have time to do so before I leave)  I'll just wish everyone a very Merry Christmas and Happy Holidays.  I should be back after Christmas next week but don't expect too much action in the market.

ES Morning Update December 20th 2017

0

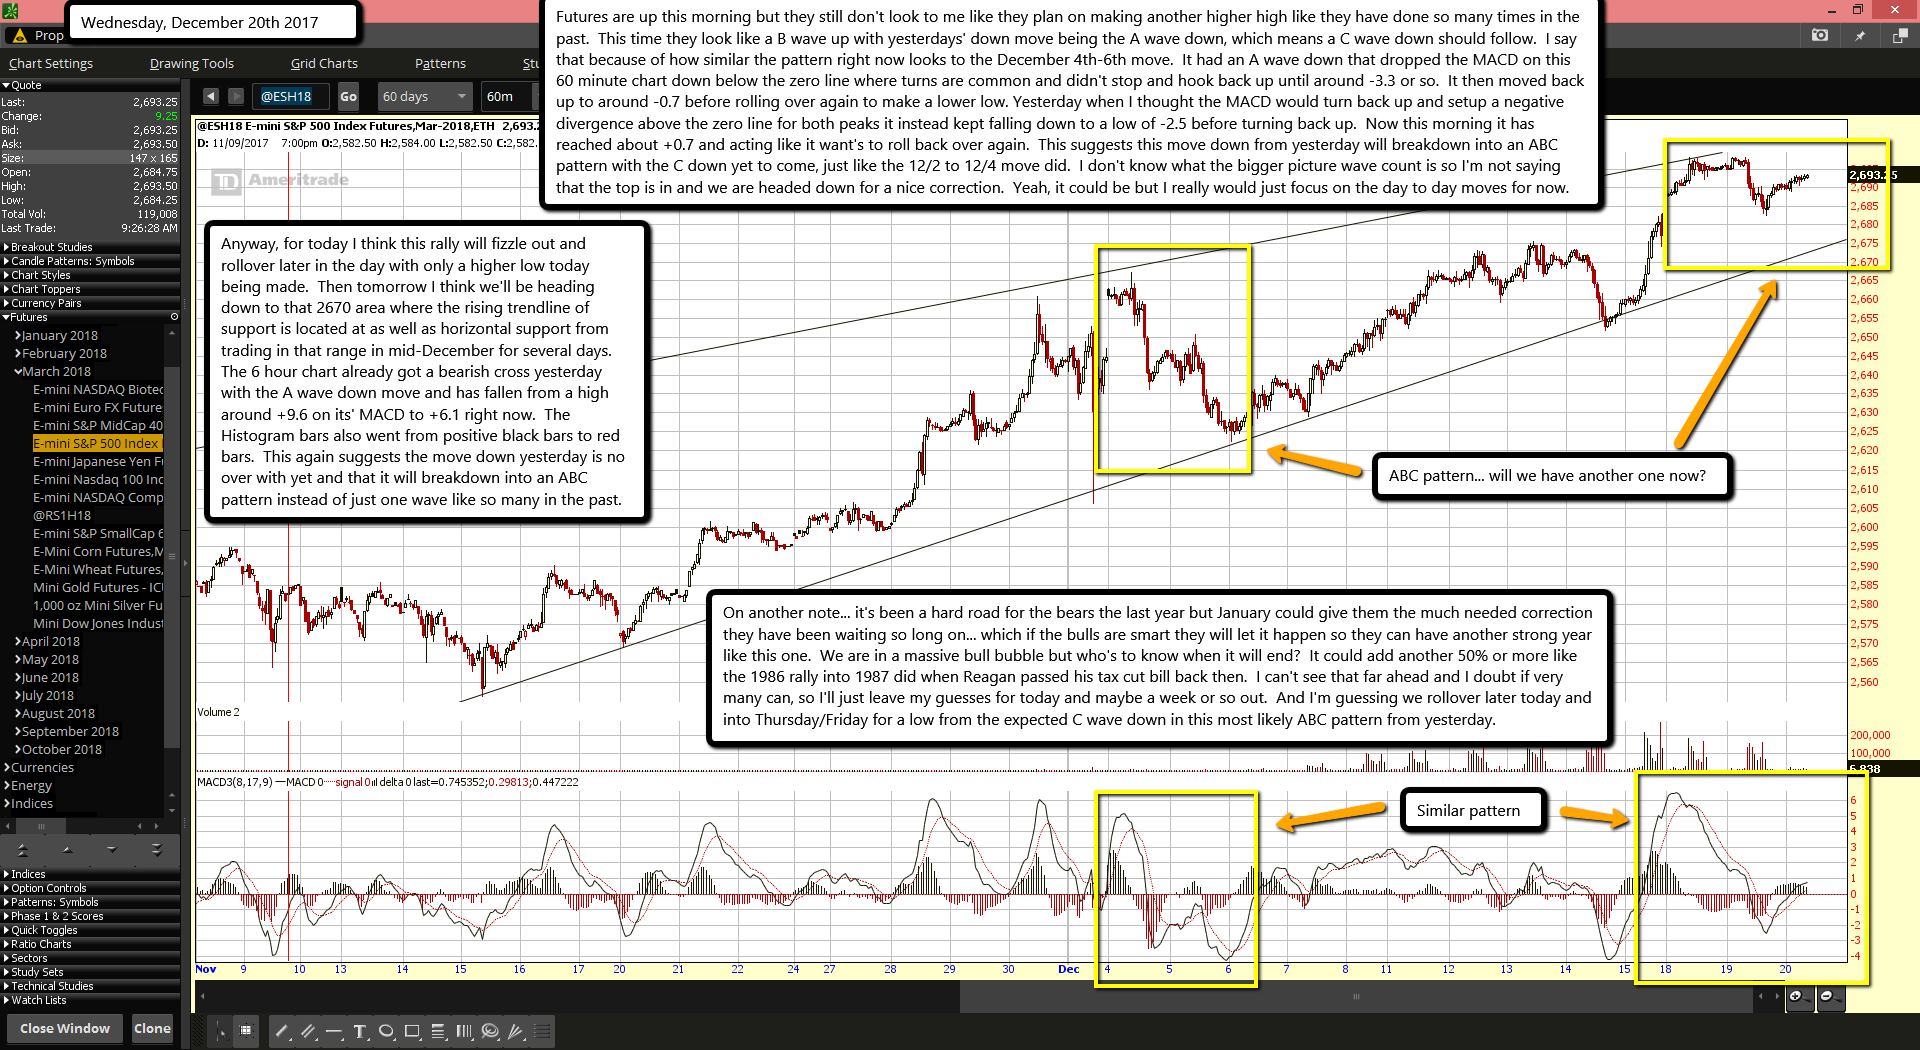
Futures are up this morning but they still don't look to me like they plan on making another higher high like they have done so many times in the past.  This time they look like a B wave up with yesterdays' down move being the A wave down, which means a C wave down should follow.  I say that because of how similar the pattern right now looks to the December 4th-6th move.  It had an A wave down that dropped the MACD on this 60 minute chart down below the zero line where turns are common and didn't stop and hook back up until around -3.3 or so.  It then moved back up to around -0.7 before rolling over again to make a lower low. Yesterday when I thought the MACD would turn back up and setup a negative divergence above the zero line for both peaks it instead kept falling down to a low of -2.5 before turning back up.  Now this morning it has reached about +0.7 and acting like it want's to roll back over again.  This suggests this move down from yesterday will breakdown into an ABC pattern with the C down yet to come, just like the 12/2 to 12/4 move did.  I don't know what the bigger picture wave count is so I'm not saying that the top is in and we are headed down for a nice correction.  Yeah, it could be but I really would just focus on the day to day moves for now.

Anyway, for today I think this rally will fizzle out and rollover later in the day with only a higher low today being made.  Then tomorrow I think we'll be heading down to that 2670 area where the rising trendline of support is located at as well as horizontal support from trading in that range in mid-December for several days.  The 6 hour chart already got a bearish cross yesterday with the A wave down move and has fallen from a high around +9.6 on its' MACD to +6.1 right now.  The Histogram bars also went from positive black bars to red bars.  This again suggests the move down yesterday is no over with yet and that it will breakdown into an ABC pattern instead of just one wave like so many in the past.

On another note... it's been a hard road for the bears the last year but January could give them the much needed correction they have been waiting so long on... which if the bulls are smart they will let it happen so they can have another strong year like this one.  We are in a massive bull bubble but who's to know when it will end?  It could add another 50% or more like the 1986 rally into 1987 did when Reagan passed his tax cut bill back then.  I can't see that far ahead and I doubt if very many can, so I'll just leave my guesses for today and maybe a week or so out.  And I'm guessing we rollover later today and into Thursday/Friday for a low from the expected C wave down in this most likely ABC pattern from yesterday.

ES Morning Update December 19th 2017

0

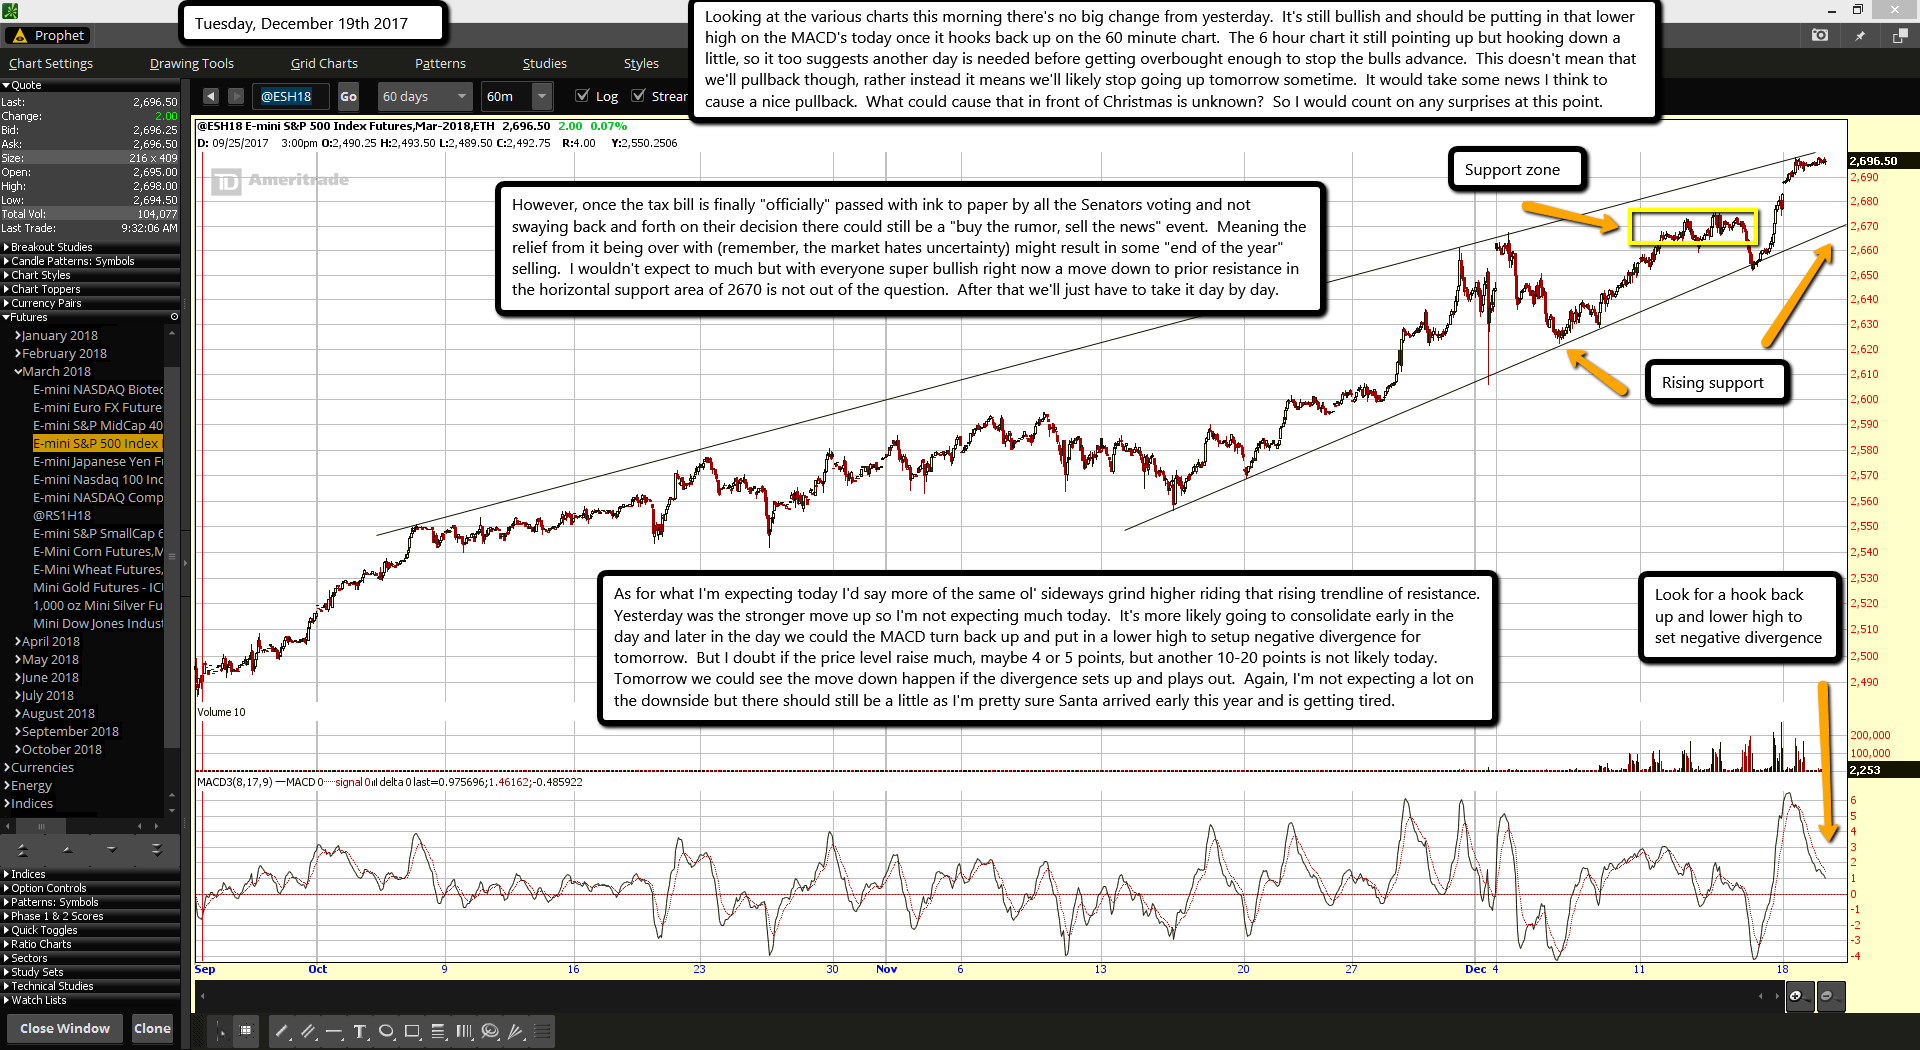
Looking at the various charts this morning there's no big change from yesterday.  It's still bullish and should be putting in that lower high on the MACD's today once it hooks back up on the 60 minute chart.  The 6 hour chart it still pointing up but hooking down a little, so it too suggests another day is needed before getting overbought enough to stop the bulls advance.  This doesn't mean that we'll pullback though, rather instead it means we'll likely stop going up tomorrow sometime.  It would take some news I think to cause a nice pullback.  What could cause that in front of Christmas is unknown?  So I would count on any surprises at this point.

However, once the tax bill is finally "officially" passed with ink to paper by all the Senators voting and not swaying back and forth on their decision there could still be a "buy the rumor, sell the news" event.  Meaning the relief from it being over with (remember, the market hates uncertainty) might result in some "end of the year" selling.  I wouldn't expect to much but with everyone super bullish right now a move down to prior resistance in the horizontal support area of 2670 is not out of the question.  After that we'll just have to take it day by day.

As for what I'm expecting today I'd say more of the same ol' sideways grind higher riding that rising trendline of resistance.  Yesterday was the stronger move up so I'm not expecting much today.  It's more likely going to consolidate early in the day and later in the day we could the MACD turn back up and put in a lower high to setup negative divergence for tomorrow.  But I doubt if the price level raise much, maybe 4 or 5 points, but another 10-20 points is not likely today.  Tomorrow we could see the move down happen if the divergence sets up and plays out.  Again, I'm not expecting a lot on the downside but there should still be a little as I'm pretty sure Santa arrived early this year and is getting tired.

ES Morning Update December 18th 2017

0

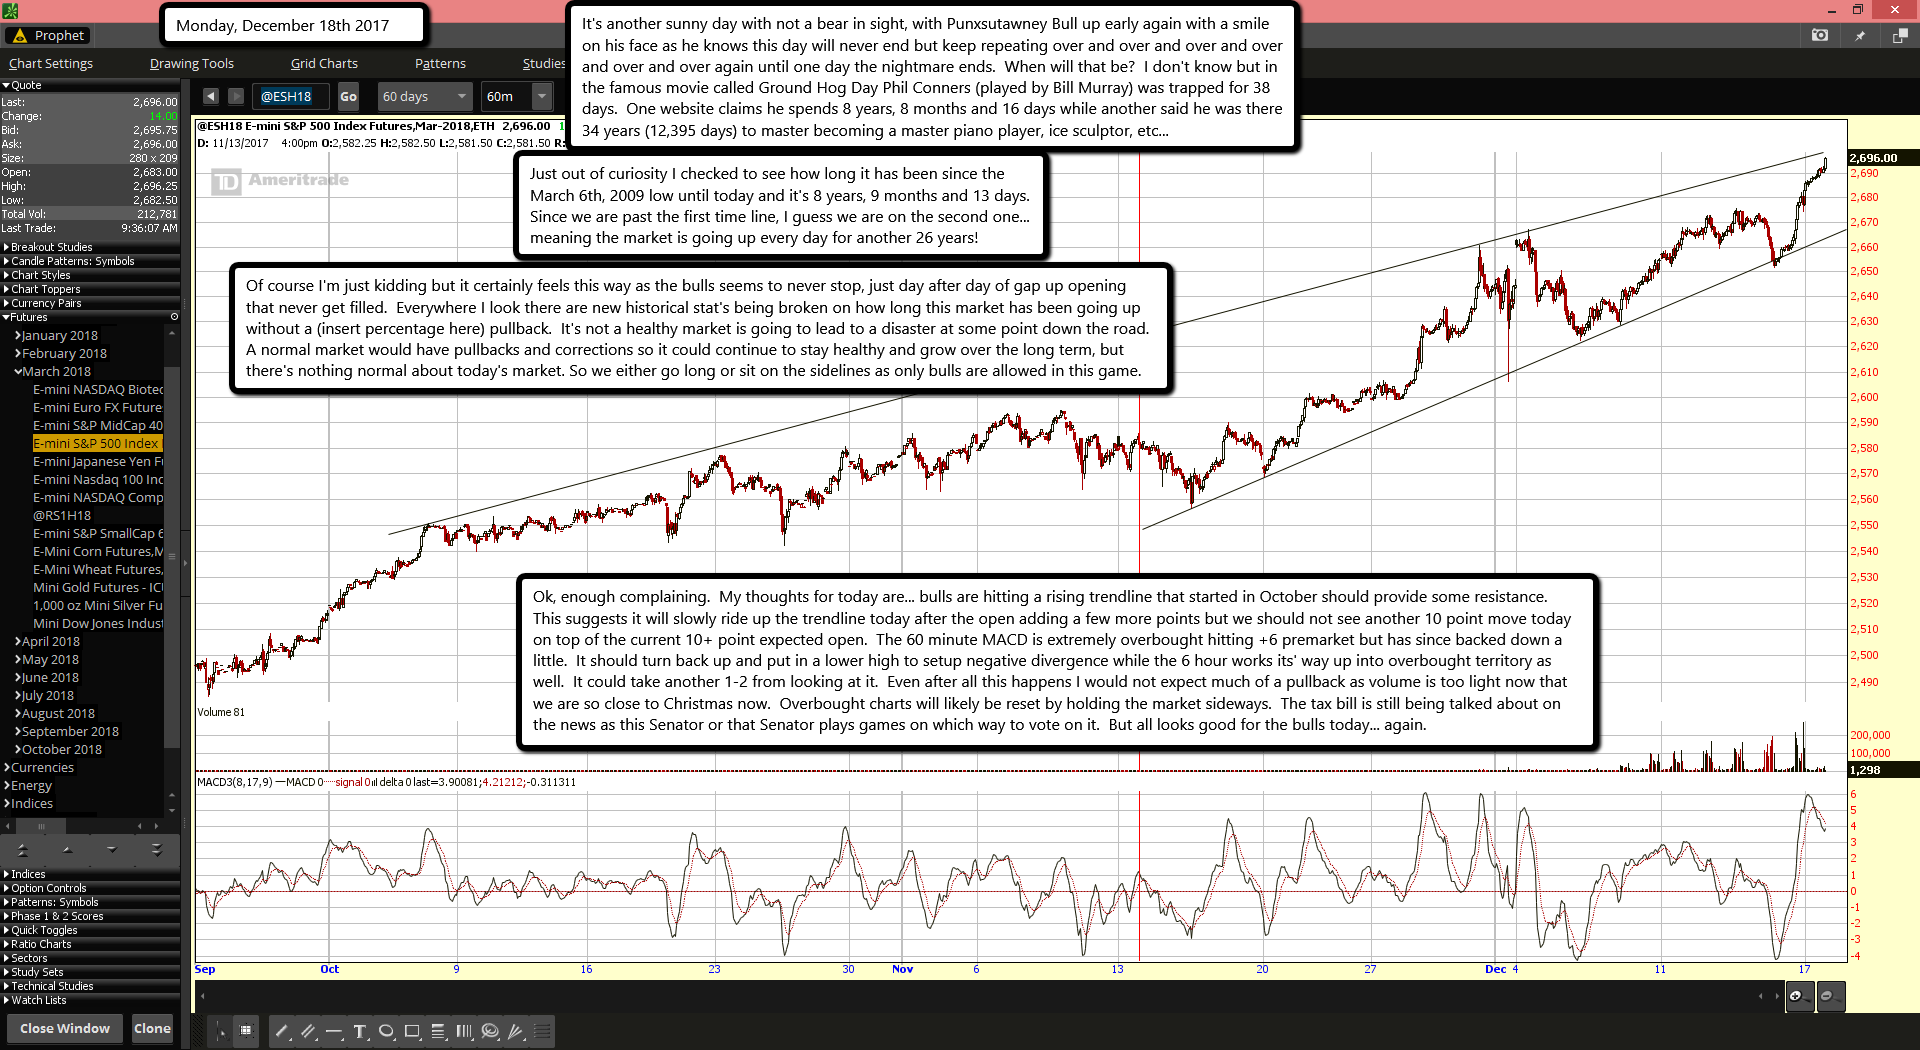
It's another sunny day with not a bear in sight, with Punxsutawney Bull up early again with a smile on his face as he knows this day will never end but keep repeating over and over and over and over and over and over again until one day the nightmare ends.  When will that be?  I don't know but in the famous movie called Ground Hog Day Phil Conners (played by Bill Murray) was trapped for 38 days.  One website claims he spends 8 years, 8 months and 16 days while another said he was there 34 years (12,395 days) to master becoming a master piano player, ice sculptor, etc...

Just out of curiosity I checked to see how long it has been since the March 6th, 2009 low until today and it's 8 years, 9 months and 13 days.  Since we are past the first time line, I guess we are on the second one... meaning the market is going up every day for another 26 years!

Of course I'm just kidding but it certainly feels this way as the bulls seems to never stop, just day after day of gap up opening that never get filled.  Everywhere I look there are new historical stat's being broken on how long this market has been going up without a (insert percentage here) pullback.  It's not a healthy market is going to lead to a disaster at some point down the road.  A normal market would have pullbacks and corrections so it could continue to stay healthy and grow over the long term, but there's nothing normal about today's market. So we either go long or sit on the sidelines as only bulls are allowed in this game.

Ok, enough complaining.  My thoughts for today are... bulls are hitting a rising trendline that started in October should provide some resistance.  This suggests it will slowly ride up the trendline today after the open adding a few more points but we should not see another 10 point move today on top of the current 10+ point expected open.  The 60 minute MACD is extremely overbought hitting +6 premarket but has since backed down a little.  It should turn back up and put in a lower high to setup negative divergence while the 6 hour works its' way up into overbought territory as well.  It could take another 1-2 from looking at it.  Even after all this happens I would not expect much of a pullback as volume is too light now that we are so close to Christmas now.  Overbought charts will likely be reset by holding the market sideways.  The tax bill is still being talked about on the news as this Senator or that Senator plays games on which way to vote on it.  But all looks good for the bulls today... again.

ES Morning Update December 15th 2017

0

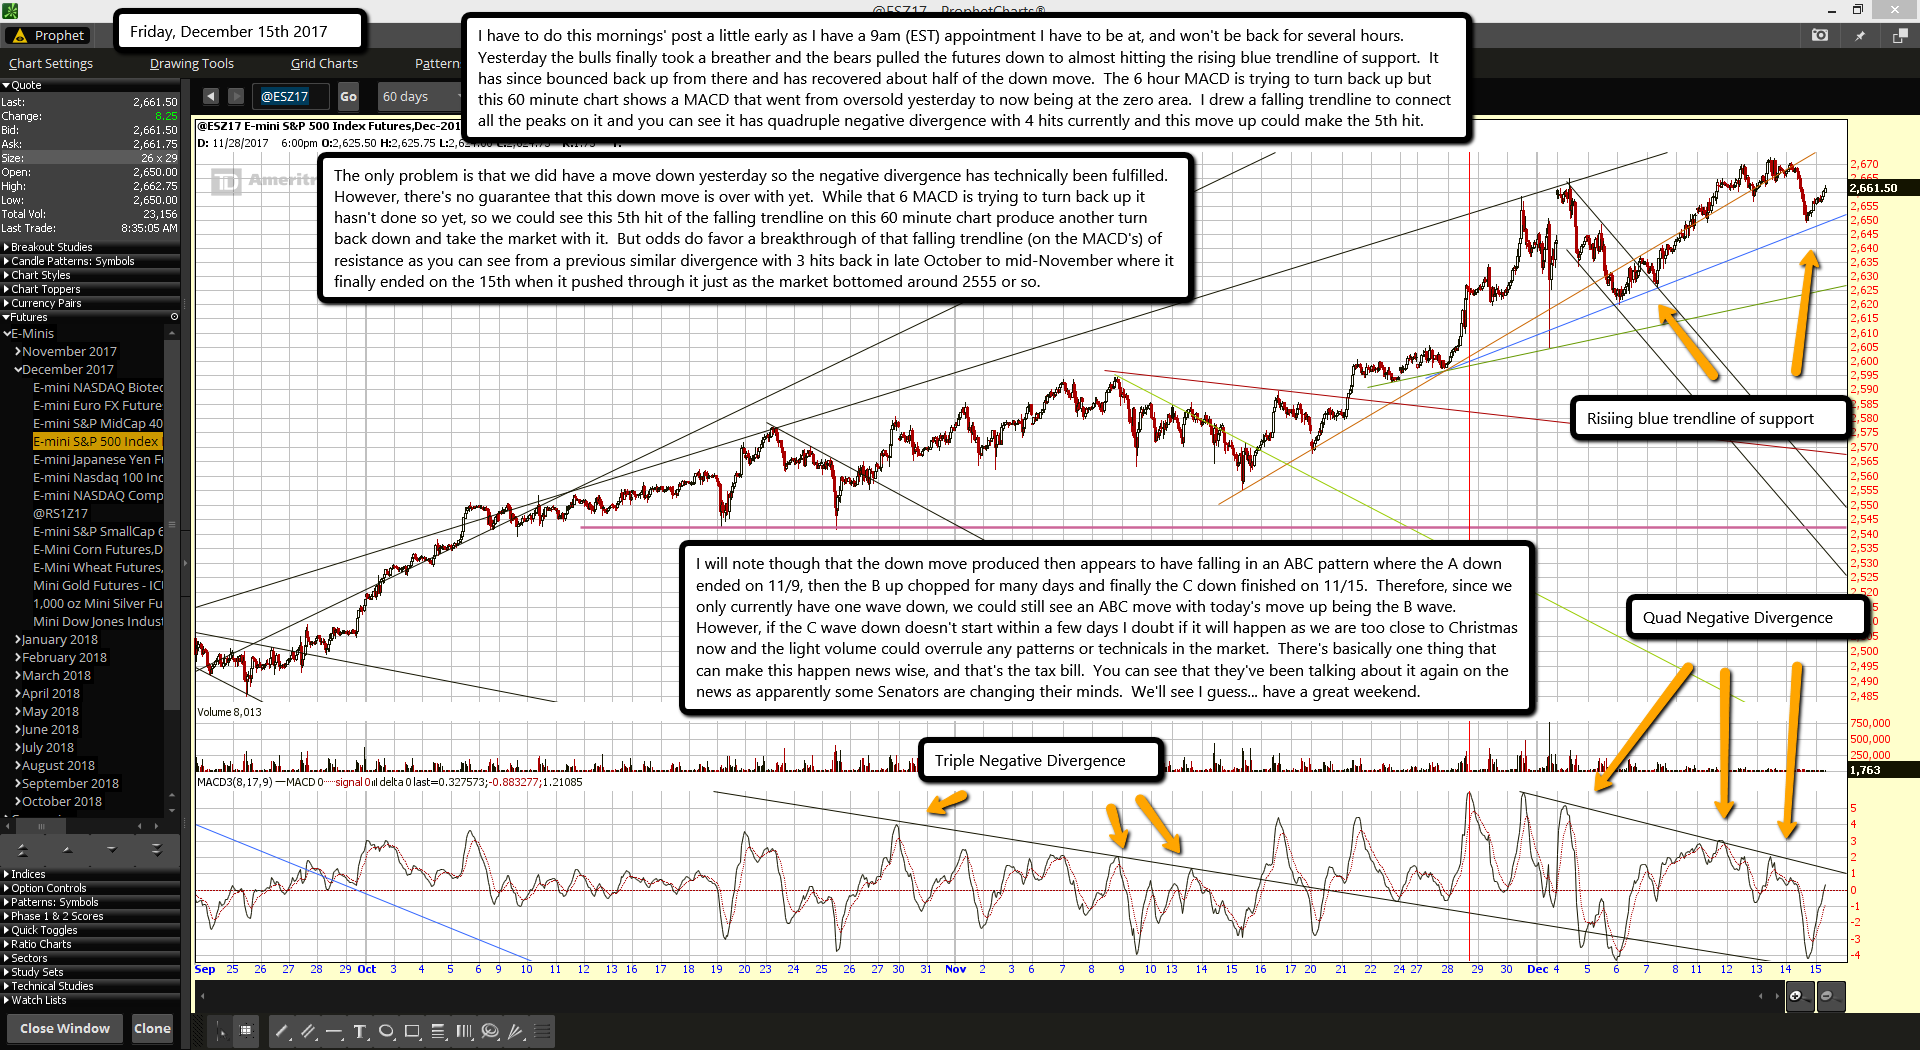
I have to do this mornings' post a little early as I have a 9am (EST) appointment I have to be at, and won't be back for several hours.  Yesterday the bulls finally took a breather and the bears pulled the futures down to almost hitting the rising blue trendline of support.  It has since bounced back up from there and has recovered about half of the down move.  The 6 hour MACD is trying to turn back up but this 60 minute chart shows a MACD that went from oversold yesterday to now being at the zero area.  I drew a falling trendline to connect all the peaks on it and you can see it has quadruple negative divergence with 4 hits currently and this move up could make the 5th hit.

The only problem is that we did have a move down yesterday so the negative divergence has technically been fulfilled.  However, there's no guarantee that this down move is over with yet.  While that 6 MACD is trying to turn back up it hasn't done so yet, so we could see this 5th hit of the falling trendline on this 60 minute chart produce another turn back down and take the market with it.  But odds do favor a breakthrough of that falling trendline (on the MACD's) of resistance as you can see from a previous similar divergence with 3 hits back in late October to mid-November where it finally ended on the 15th when it pushed through it just as the market bottomed around 2555 or so.

I will note though that the down move produced then appears to have falling in an ABC pattern where the A down ended on 11/9, then the B up chopped for many days and finally the C down finished on 11/15.  Therefore, since we only currently have one wave down, we could still see an ABC move with today's move up being the B wave.  However, if the C wave down doesn't start within a few days I doubt if it will happen as we are too close to Christmas now and the light volume could overrule any patterns or technicals in the market.  There's basically one thing that can make this happen news wise, and that's the tax bill.  You can see that they've been talking about it again on the news as apparently some Senators are changing their minds.  We'll see I guess... have a great weekend.

ES Morning Update December 14th 2017

0

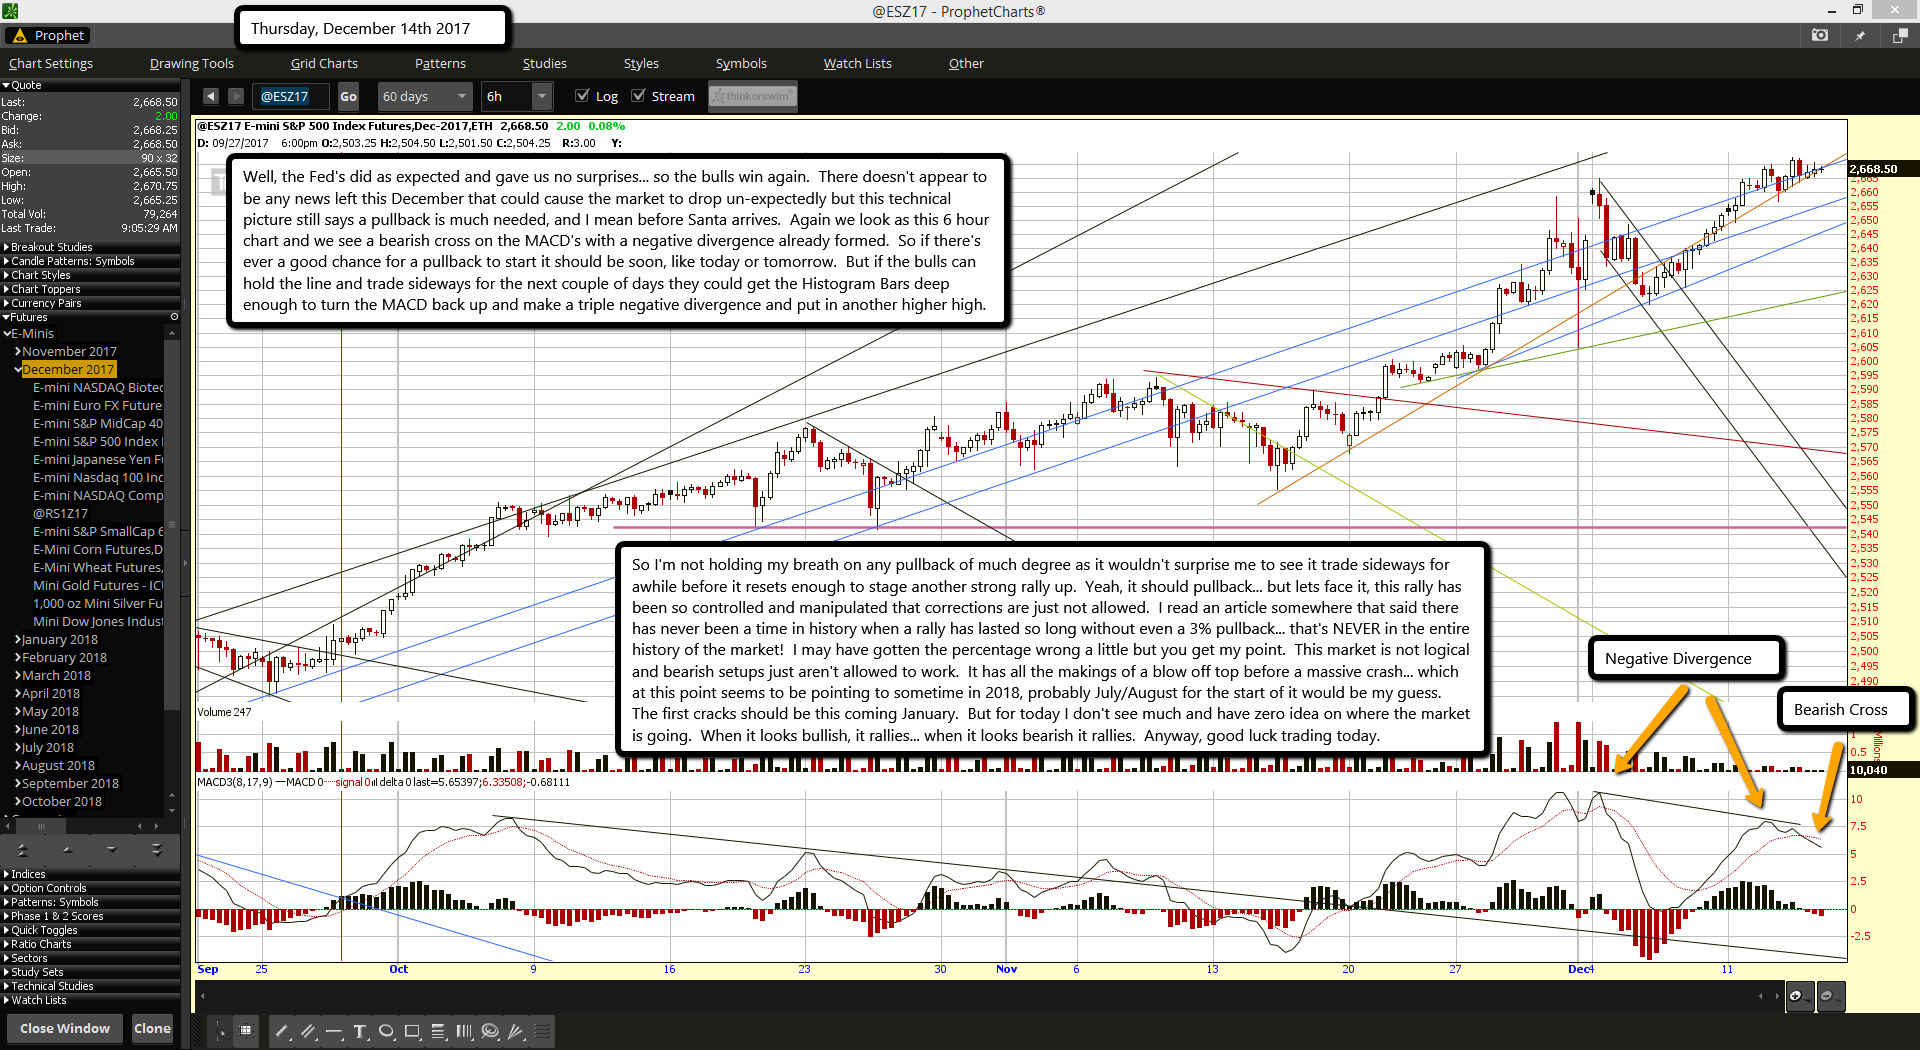
Well, the Fed's did as expected and gave us no surprises... so the bulls win again.  There doesn't appear to be any news left this December that could cause the market to drop un-expectedly but this technical picture still says a pullback is much needed, and I mean before Santa arrives.  Again we look as this 6 hour chart and we see a bearish cross on the MACD's with a negative divergence already formed.  So if there's ever a good chance for a pullback to start it should be soon, like today or tomorrow.  But if the bulls can hold the line and trade sideways for the next couple of days they could get the Histogram Bars deep enough to turn the MACD back up and make a triple negative divergence and put in another higher high.

So I'm not holding my breath on any pullback of much degree as it wouldn't surprise me to see it trade sideways for awhile before it resets enough to stage another strong rally up.  Yeah, it should pullback... but lets face it, this rally has been so controlled and manipulated that corrections are just not allowed.  I read an article somewhere that said there has never been a time in history when a rally has lasted so long without even a 3% pullback... that's NEVER in the entire history of the market!  I may have gotten the percentage wrong a little but you get my point.  This market is not logical and bearish setups just aren't allowed to work.  It has all the makings of a blow off top before a massive crash... which at this point seems to be pointing to sometime in 2018, probably July/August for the start of it would be my guess.  The first cracks should be this coming January.  But for today I don't see much and have zero idea on where the market is going.  When it looks bullish, it rallies... when it looks bearish it rallies.  Anyway, good luck trading today.

ES Morning Update December 13th 2017

0

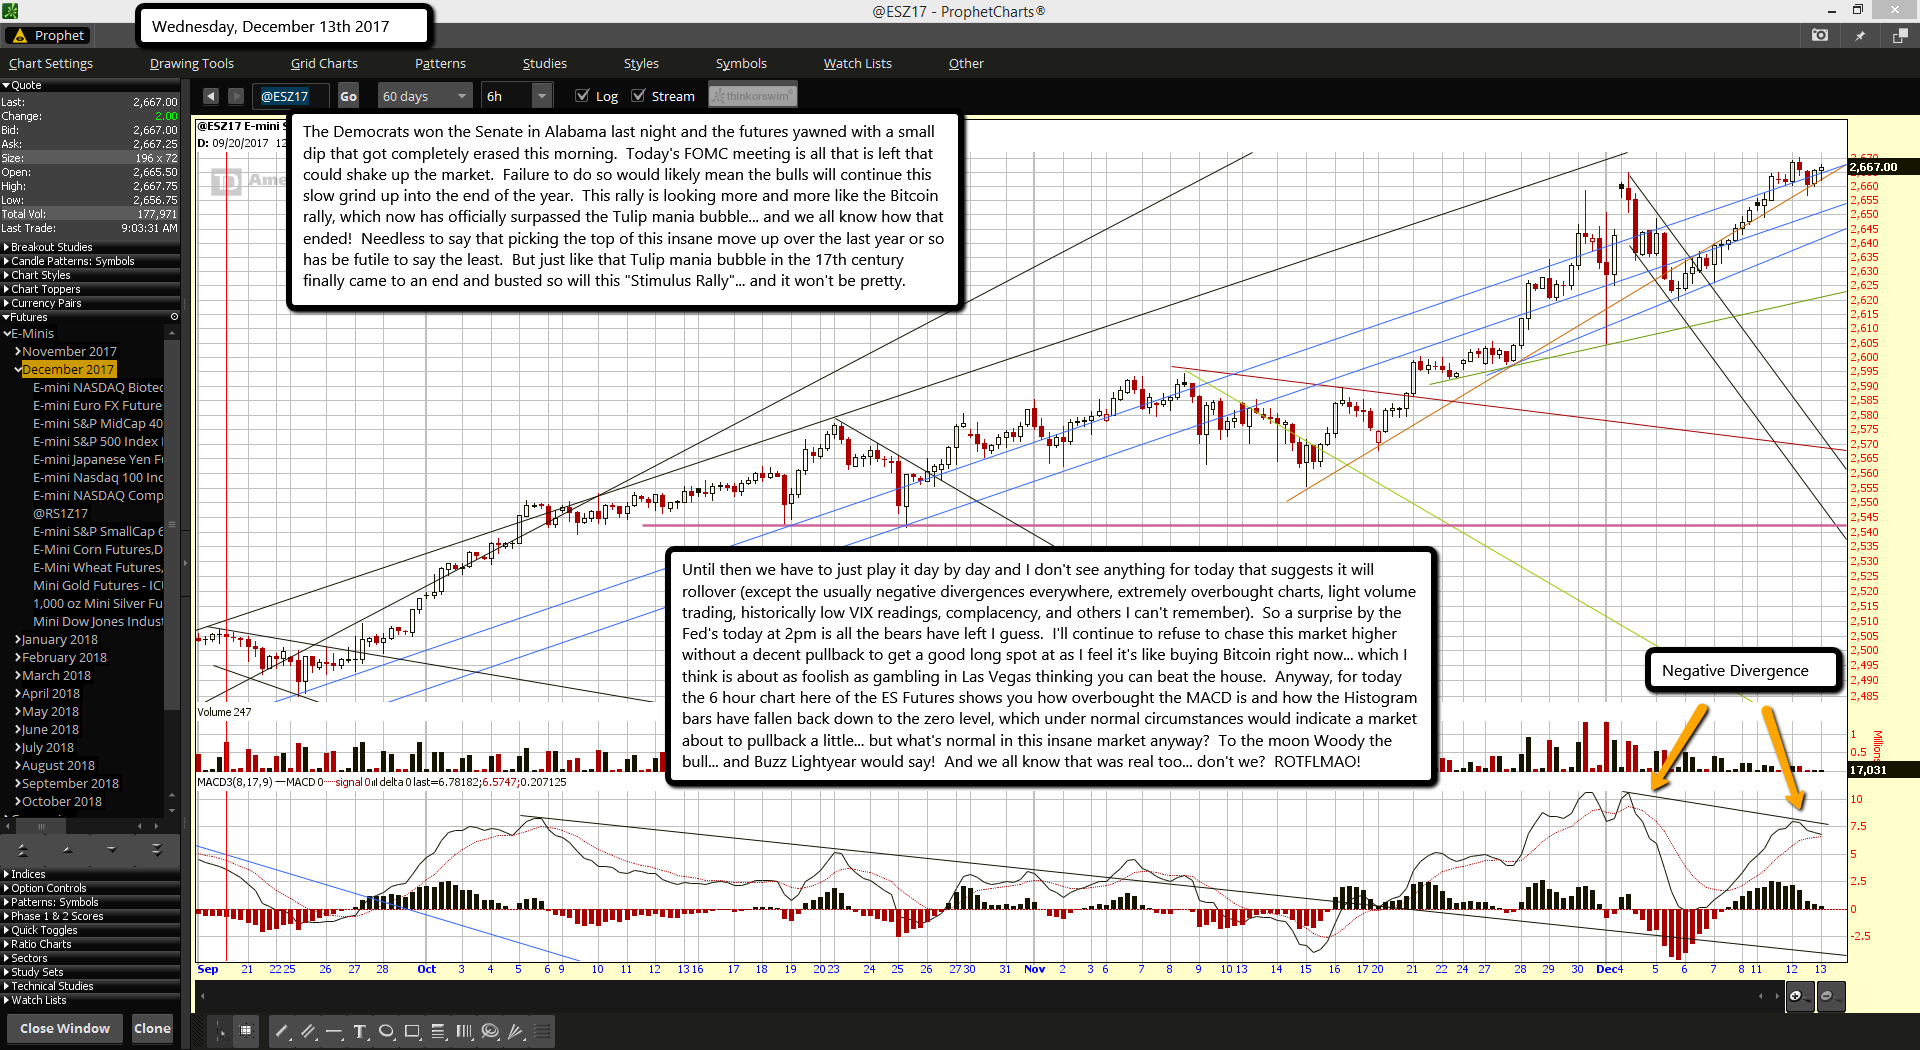
The Democrats won the Senate in Alabama last night and the futures yawned with a small dip that got completely erased this morning.  Today's FOMC meeting is all that is left that could shake up the market.  Failure to do so would likely mean the bulls will continue this slow grind up into the end of the year.  This rally is looking more and more like the Bitcoin rally, which now has officially surpassed the Tulip mania bubble... and we all know how that ended!  Needless to say that picking the top of this insane move up over the last year or so has be futile to say the least.  But just like that Tulip mania bubble in the 17th century finally came to an end and busted so will this "Stimulus Rally"... and it won't be pretty.

Until then we have to just play it day by day and I don't see anything for today that suggests it will rollover (except the usually negative divergences everywhere, extremely overbought charts, light volume trading, historically low VIX readings, complacency, and others I can't remember).  So a surprise by the Fed's today at 2pm is all the bears have left I guess.  I'll continue to refuse to chase this market higher without a decent pullback to get a good long spot at as I feel it's like buying Bitcoin right now... which I think is about as foolish as gambling in Las Vegas thinking you can beat the house.  Anyway, for today the 6 hour chart here of the ES Futures shows you how overbought the MACD is and how the Histogram bars have fallen back down to the zero level, which under normal circumstances would indicate a market about to pullback a little... but what's normal in this insane market anyway?  To the moon Woody the bull... and Buzz Lightyear would say!  And we all know that was real too... don't we?  ROTFLMAO!

ES Morning Update December 12th 2017

0

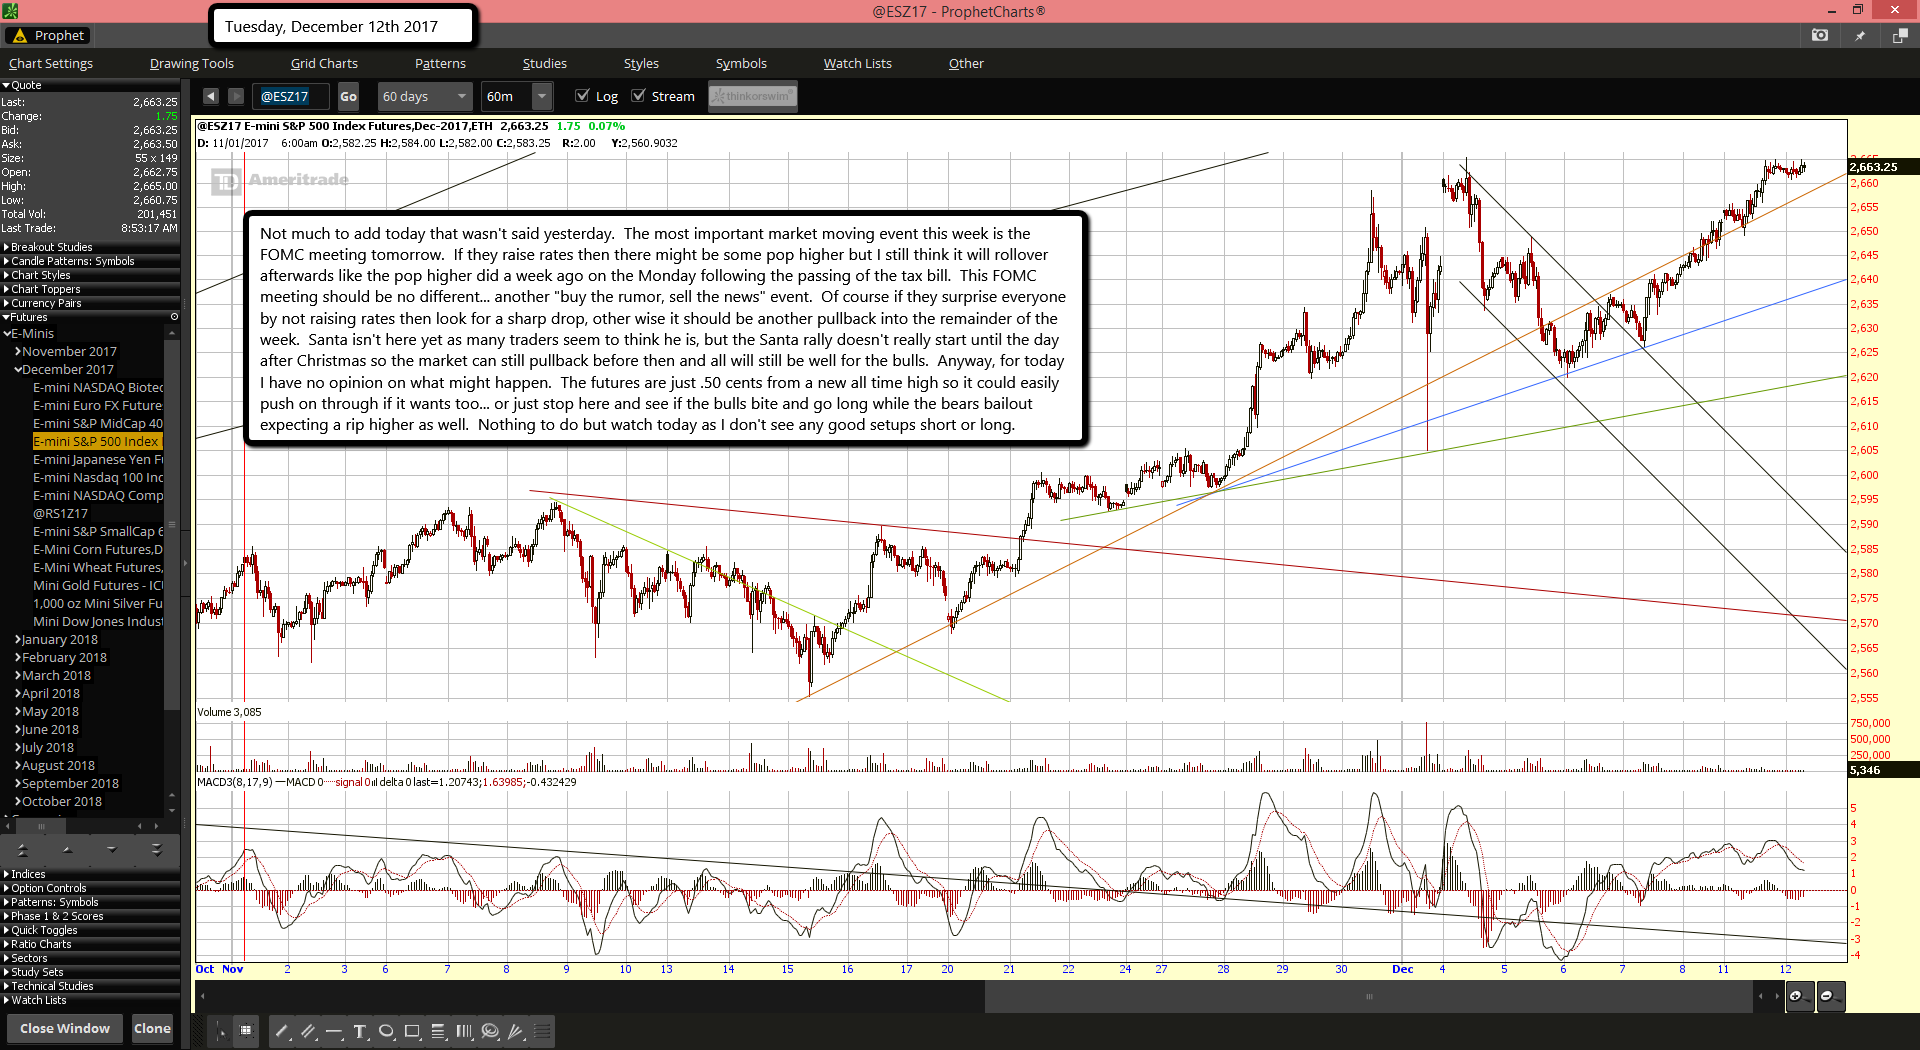
Not much to add today that wasn't said yesterday.  The most important market moving event this week is the FOMC meeting tomorrow.  If they raise rates then there might be some pop higher but I still think it will rollover afterwards like the pop higher did a week ago on the Monday following the passing of the tax bill.  This FOMC meeting should be no different... another "buy the rumor, sell the news" event.  Of course if they surprise everyone by not raising rates then look for a sharp drop, other wise it should be another pullback into the remainder of the week.  Santa isn't here yet as many traders seem to think he is, but the Santa rally doesn't really start until the day after Christmas so the market can still pullback before then and all will still be well for the bulls.  Anyway, for today I have no opinion on what might happen.  The futures are just .50 cents from a new all time high so it could easily push on through if it wants too... or just stop here and see if the bulls bite and go long while the bears bailout expecting a rip higher as well.  Nothing to do but watch today as I don't see any good setups short or long.

ES Morning Update December 11th 2017

0

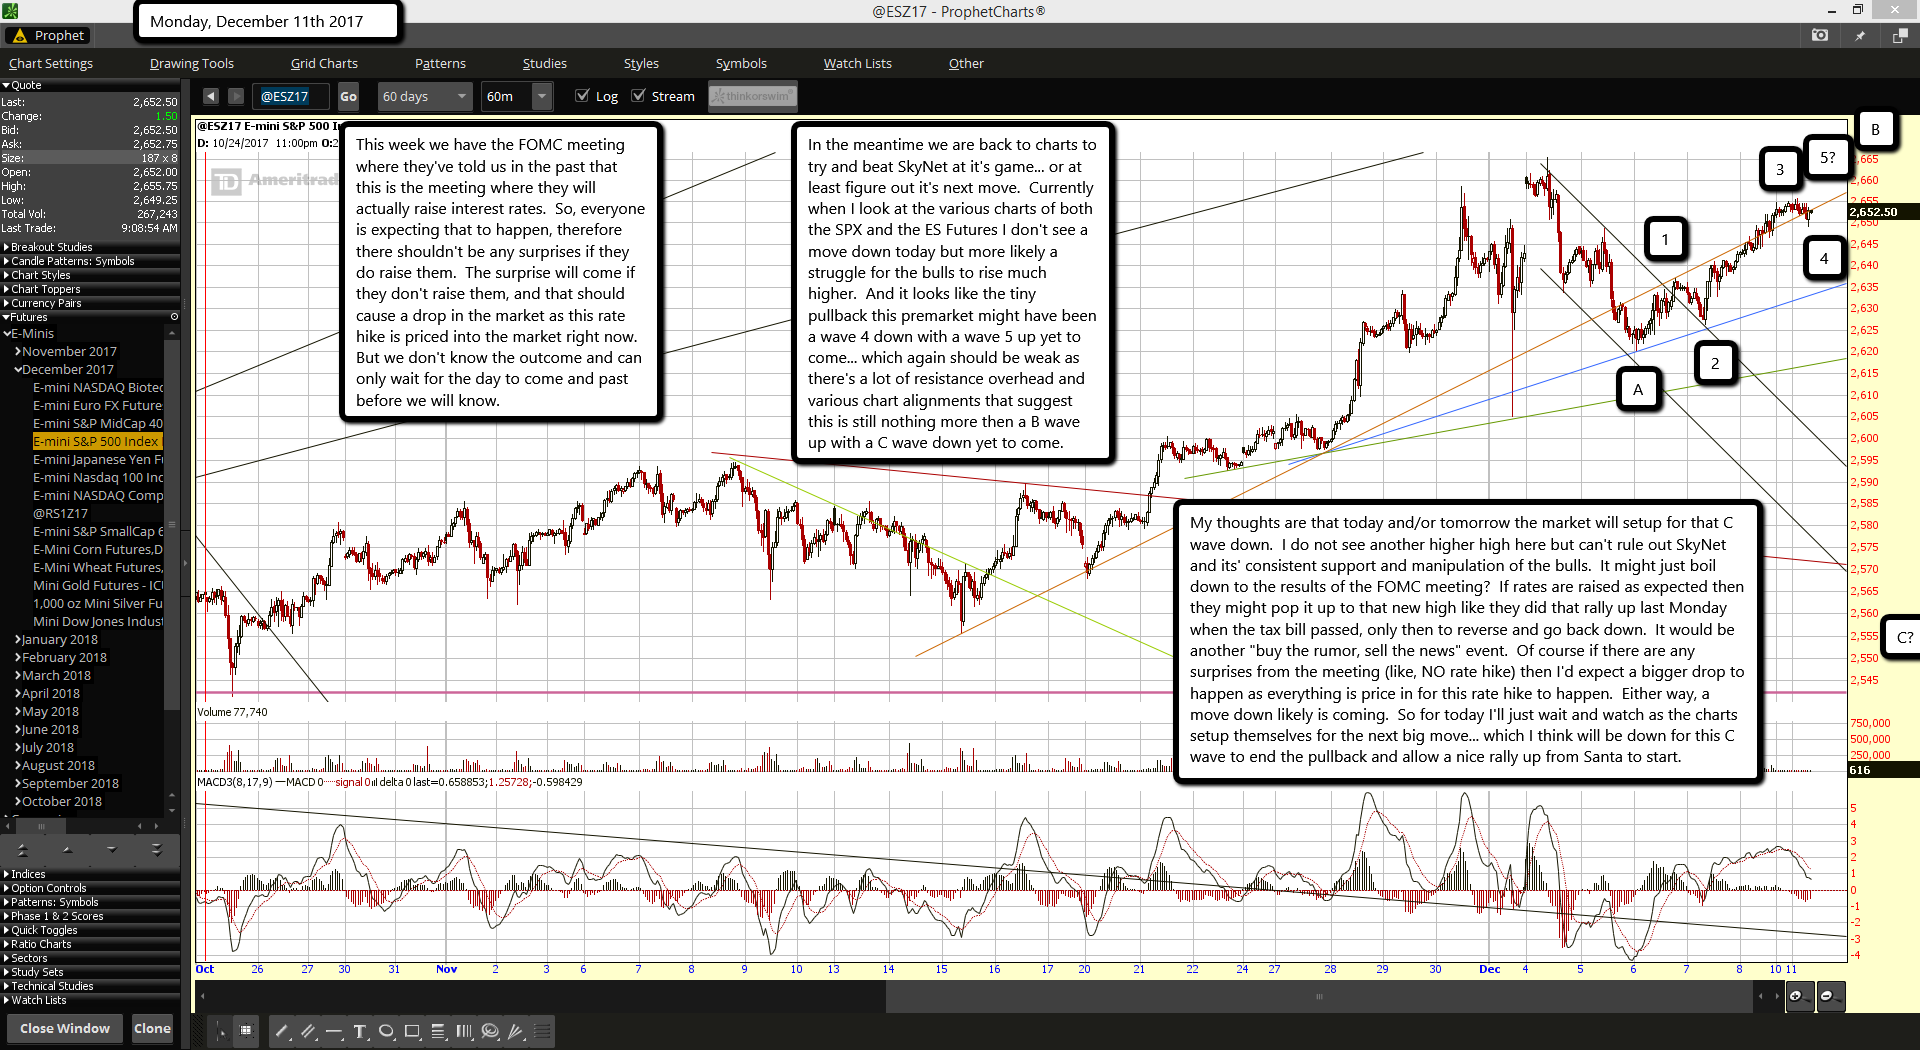
This week we have the FOMC meeting where they've told us in the past that this is the meeting where they will actually raise interest rates.  So, everyone is expecting that to happen, therefore there shouldn't be any surprises if they do raise them.  The surprise will come if they don't raise them, and that should cause a drop in the market as this rate hike is priced into the market right now.  But we don't know the outcome and can only wait for the day to come and past before we will know.

In the meantime we are back to charts to try and beat SkyNet at it's game... or at least figure out it's next move.  Currently when I look at the various charts of both the SPX and the ES Futures I don't see a move down today but more likely a struggle for the bulls to rise much higher.  And it looks like the tiny pullback this premarket might have been a wave 4 down with a wave 5 up yet to come... which again should be weak as there's a lot of resistance overhead and various chart alignments that suggest this is still nothing more then a B wave up with a C wave down yet to come.

My thoughts are that today and/or tomorrow the market will setup for that C wave down.  I do not see another higher high here but can't rule out SkyNet and its' consistent support and manipulation of the bulls.  It might just boil down to the results of the FOMC meeting?  If rates are raised as expected then they might pop it up to that new high like they did that rally up last Monday when the tax bill passed, only then to reverse and go back down.  It would be another "buy the rumor, sell the news" event.  Of course if there are any surprises from the meeting (like, NO rate hike) then I'd expect a bigger drop to happen as everything is price in for this rate hike to happen.  Either way, a move down likely is coming.  So for today I'll just wait and watch as the charts setup themselves for the next big move... which I think will be down for this C wave to end the pullback and allow a nice rally up from Santa to start.

ES Morning Update December 8th 2017

0

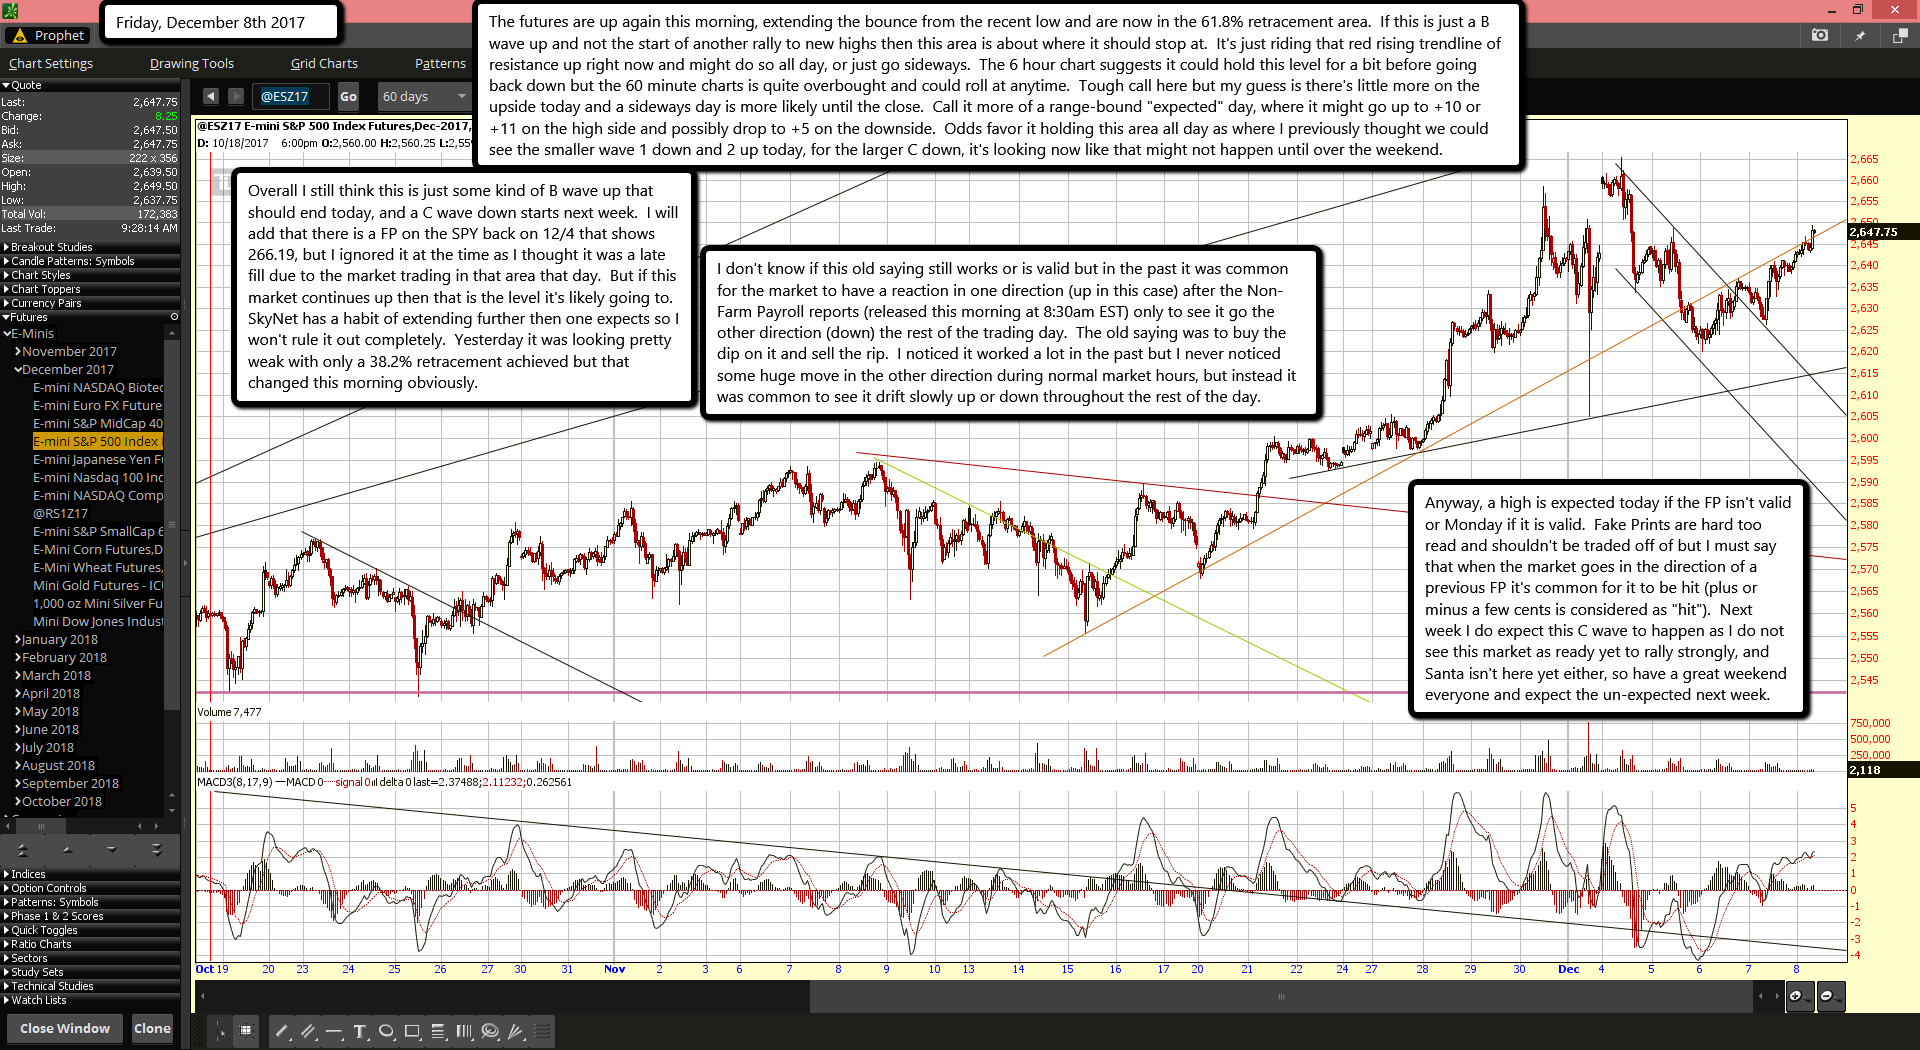
The futures are up again this morning, extending the bounce from the recent low and are now in the 61.8% retracement area.  If this is just a B wave up and not the start of another rally to new highs then this area is about where it should stop at.  It's just riding that red rising trendline of resistance up right now and might do so all day, or just go sideways.  The 6 hour chart suggests it could hold this level for a bit before going back down but the 60 minute charts is quite overbought and could roll at anytime.  Tough call here but my guess is there's little more on the upside today and a sideways day is more likely until the close.  Call it more of a range-bound "expected" day, where it might go up to +10 or +11 on the high side and possibly drop to +5 on the downside.  Odds favor it holding this area all day as where I previously thought we could see the smaller wave 1 down and 2 up today, for the larger C down, it's looking now like that might not happen until over the weekend.

Overall I still think this is just some kind of B wave up that should end today, and a C wave down starts next week.  I will add that there is a FP on the SPY back on 12/4 that shows 266.19, but I ignored it at the time as I thought it was a late fill due to the market trading in that area that day.  But if this market continues up then that is the level it's likely going to.  SkyNet has a habit of extending further then one expects so I won't rule it out completely.  Yesterday it was looking pretty weak with only a 38.2% retracement achieved but that changed this morning obviously.

I don't know if this old saying still works or is valid but in the past it was common for the market to have a reaction in one direction (up in this case) after the Non-Farm Payroll reports (released this morning at 8:30am EST) only to see it go the other direction (down) the rest of the trading day.  The old saying was to buy the dip on it and sell the rip.  I noticed it worked a lot in the past but I never noticed some huge move in the other direction during normal market hours, but instead it was common to see it drift slowly up or down throughout the rest of the day.

Anyway, a high is expected today if the FP isn't valid or Monday if it is valid.  Fake Prints are hard too read and shouldn't be traded off of but I must say that when the market goes in the direction of a previous FP it's common for it to be hit (plus or minus a few cents is considered as "hit").  Next week I do expect this C wave to happen as I do not see this market as ready yet to rally strongly, and Santa isn't here yet either, so have a great weekend everyone and expect the un-expected next week.

ES Morning Update December 7th 2017

0

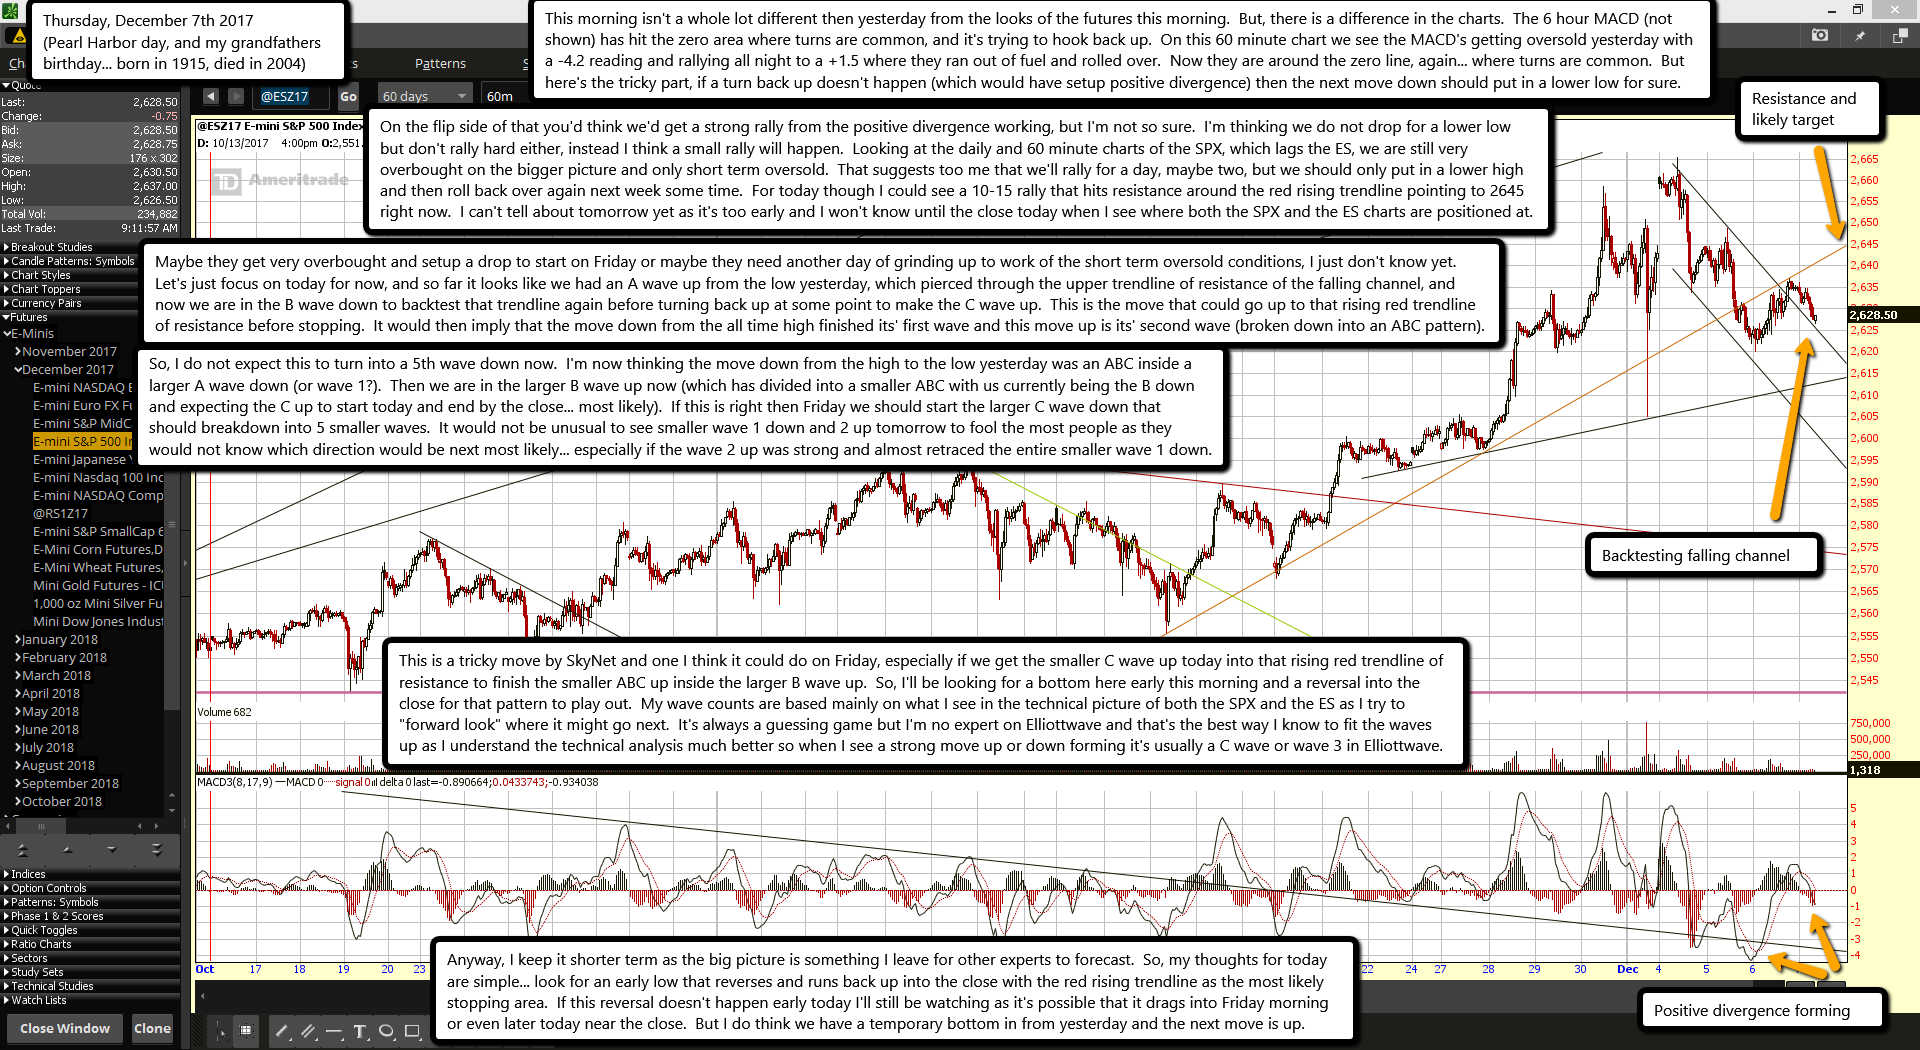
This morning isn't a whole lot different then yesterday from the looks of the futures this morning.  But, there is a difference in the charts.  The 6 hour MACD (not shown) has hit the zero area where turns are common, and it's trying to hook back up.  On this 60 minute chart we see the MACD's getting oversold yesterday with a -4.2 reading and rallying all night to a +1.5 where they ran out of fuel and rolled over.  Now they are around the zero line, again... where turns are common.  But here's the tricky part, if a turn back up doesn't happen (which would have setup positive divergence) then the next move down should put in a lower low for sure.

On the flip side of that you'd think we'd get a strong rally from the positive divergence working, but I'm not so sure.  I'm thinking we do not drop for a lower low but don't rally hard either, instead I think a small rally will happen.  Looking at the daily and 60 minute charts of the SPX, which lags the ES, we are still very overbought on the bigger picture and only short term oversold.  That suggests too me that we'll rally for a day, maybe two, but we should only put in a lower high and then roll back over again next week some time.  For today though I could see a 10-15 rally that hits resistance around the red rising trendline pointing to 2645 right now.  I can't tell about tomorrow yet as it's too early and I won't know until the close today when I see where both the SPX and the ES charts are positioned at.

Maybe they get very overbought and setup a drop to start on Friday or maybe they need another day of grinding up to work of the short term oversold conditions, I just don't know yet.  Let's just focus on today for now, and so far it looks like we had an A wave up from the low yesterday, which pierced through the upper trendline of resistance of the falling channel, and now we are in the B wave down to backtest that trendline again before turning back up at some point to make the C wave up.  This is the move that could go up to that rising red trendline of resistance before stopping.  It would then imply that the move down from the all time high finished its' first wave and this move up is its' second wave (broken down into an ABC pattern).

So, I do not expect this to turn into a 5th wave down now.  I'm now thinking the move down from the high to the low yesterday was an ABC inside a larger A wave down (or wave 1?).  Then we are in the larger B wave up now (which has divided into a smaller ABC with us currently being the B down and expecting the C up to start today and end by the close... most likely).  If this is right then Friday we should start the larger C wave down that should breakdown into 5 smaller waves.  It would not be unusual to see smaller wave 1 down and 2 up tomorrow to fool the most people as they would not know which direction would be next most likely... especially if the wave 2 up was strong and almost retraced the entire smaller wave 1 down.

This is a tricky move by SkyNet and one I think it could do on Friday, especially if we get the smaller C wave up today into that rising red trendline of resistance to finish the smaller ABC up inside the larger B wave up.  So, I'll be looking for a bottom here early this morning and a reversal into the close for that pattern to play out.  My wave counts are based mainly on what I see in the technical picture of both the SPX and the ES as I try to "forward look" where it might go next.  It's always a guessing game but I'm no expert on Elliottwave and that's the best way I know to fit the waves up as I understand the technical analysis much better so when I see a strong move up or down forming it's usually a C wave or wave 3 in Elliottwave.

Anyway, I keep it shorter term as the big picture is something I leave for other experts to forecast.  So, my thoughts for today are simple... look for an early low that reverses and runs back up into the close with the red rising trendline as the most likely stopping area.  If this reversal doesn't happen early today I'll still be watching as it's possible that it drags into Friday morning or even later today near the close.  But I do think we have a temporary bottom in from yesterday and the next move is up.

ES Morning Update December 6th 2017

0

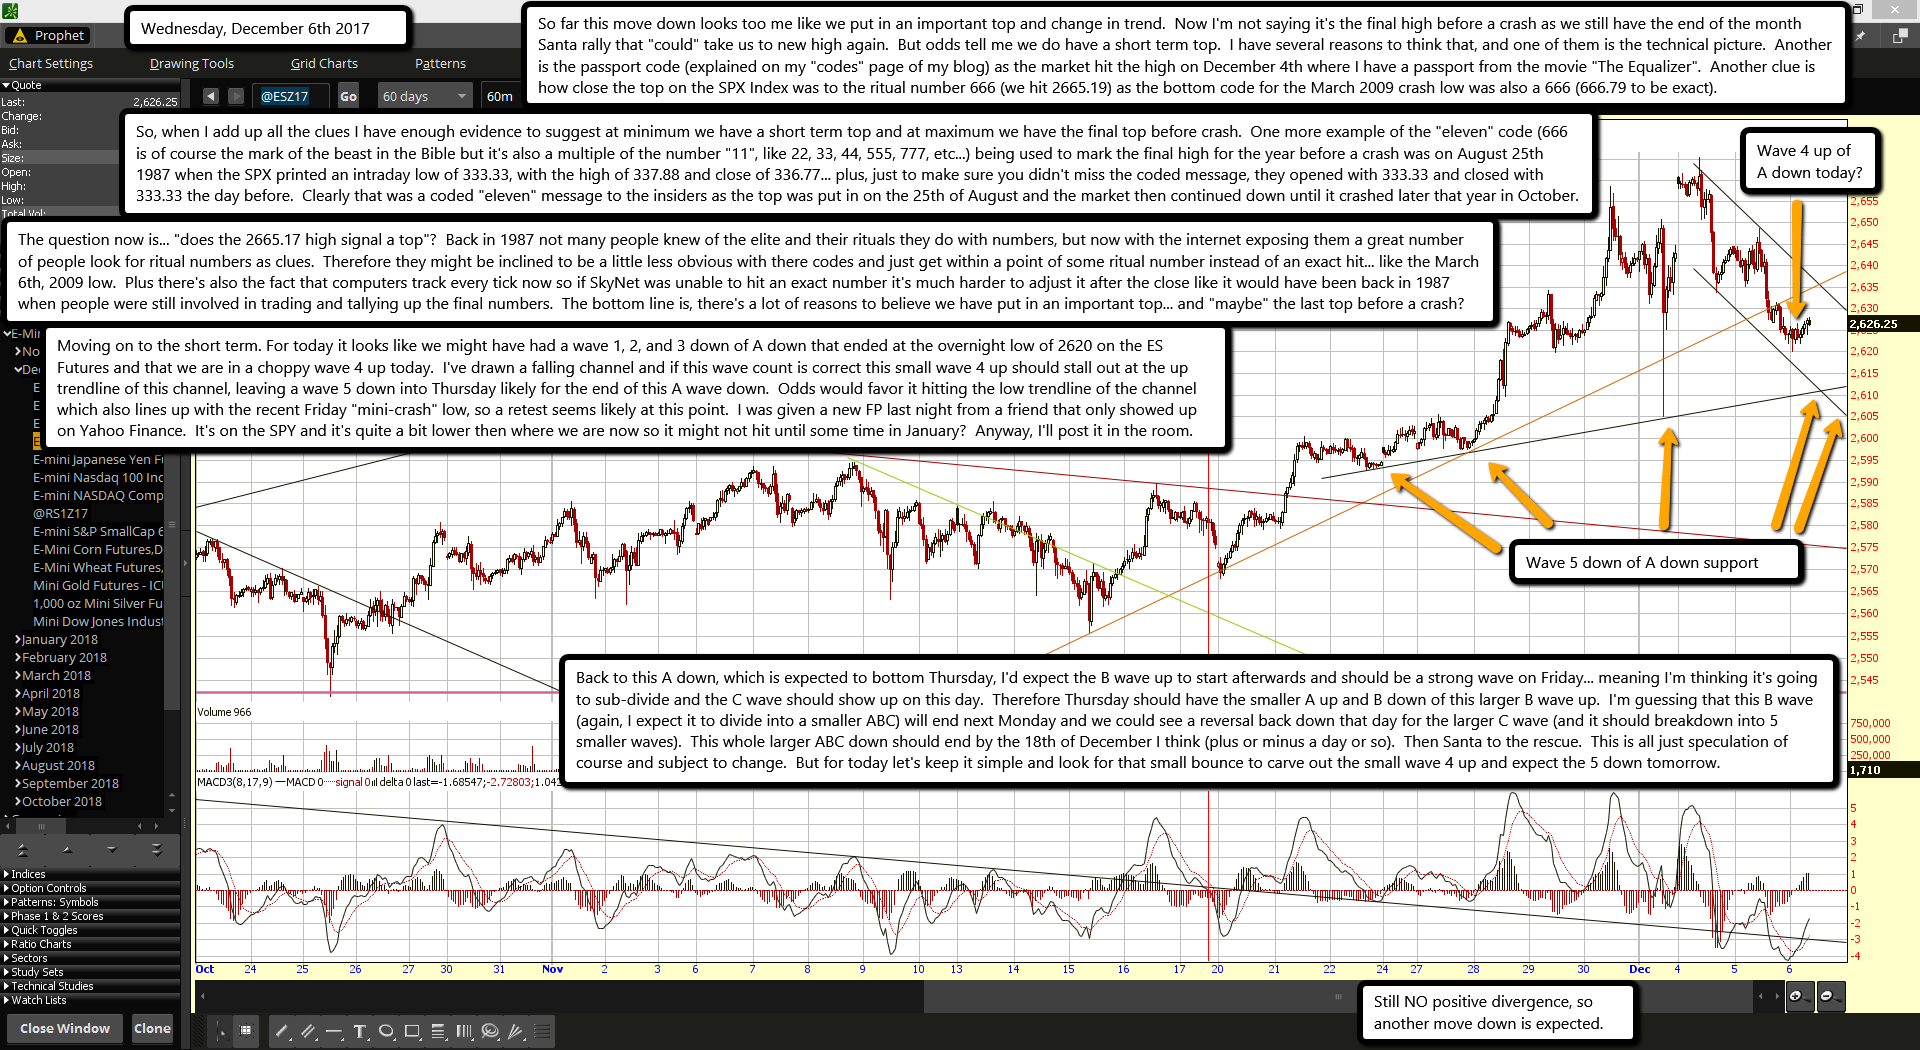
So far this move down looks too me like we put in an important top and change in trend.  Now I'm not saying it's the final high before a crash as we still have the end of the month Santa rally that "could" take us to new high again.  But odds tell me we do have a short term top.  I have several reasons to think that, and one of them is the technical picture.  Another is the passport code (explained on my "codes" page of my blog) as the market hit the high on December 4th where I have a passport from the movie "The Equalizer".  Another clue is how close the top on the SPX Index was to the ritual number 666 (we hit 2665.19) as the bottom code for the March 2009 crash low was also a 666 (666.79 to be exact).

So, when I add up all the clues I have enough evidence to suggest at minimum we have a short term top and at maximum we have the final top before crash.  One more example of the "eleven" code (666 is of course the mark of the beast in the Bible but it's also a multiple of the number "11", like 22, 33, 44, 555, 777, etc...) being used to mark the final high for the year before a crash was on August 25th 1987 when the SPX printed an intraday low of 333.33, with the high of 337.88 and close of 336.77... plus, just to make sure you didn't miss the coded message, they opened with 333.33 and closed with 333.33 the day before.  Clearly that was a coded "eleven" message to the insiders as the top was put in on the 25th of August and the market then continued down until it crashed later that year in October.

The question now is... "does the 2665.17 high signal a top"?  Back in 1987 not many people knew of the elite and their rituals they do with numbers, but now with the internet exposing them a great number of people look for ritual numbers as clues.  Therefore they might be inclined to be a little less obvious with there codes and just get within a point of some ritual number instead of an exact hit... like the March 6th, 2009 low.  Plus there's also the fact that computers track every tick now so if SkyNet was unable to hit an exact number it's much harder to adjust it after the close like it would have been back in 1987 when people were still involved in trading and tallying up the final numbers.  The bottom line is, there's a lot of reasons to believe we have put in an important top... and "maybe" the last top before a crash?

Moving on to the short term. For today it looks like we might have had a wave 1, 2, and 3 down of A down that ended at the overnight low of 2620 on the ES Futures and that we are in a choppy wave 4 up today.  I've drawn a falling channel and if this wave count is correct this small wave 4 up should stall out at the up trendline of this channel, leaving a wave 5 down into Thursday likely for the end of this A wave down.  Odds would favor it hitting the low trendline of the channel which also lines up with the recent Friday "mini-crash" low, so a retest seems likely at this point.  I was given a new FP last night from a friend that only showed up on Yahoo Finance.  It's on the SPY and it's quite a bit lower then where we are now so it might not hit until some time in January?  Anyway, I'll post it in the room.

Back to this A down, which is expected to bottom Thursday, I'd expect the B wave up to start afterwards and should be a strong wave on Friday... meaning I'm thinking it's going to sub-divide and the C wave should show up on this day.  Therefore Thursday should have the smaller A up and B down of this larger B wave up.  I'm guessing that this B wave (again, I expect it to divide into a smaller ABC) will end next Monday and we could see a reversal back down that day for the larger C wave (and it should breakdown into 5 smaller waves).  This whole larger ABC down should end by the 18th of December I think (plus or minus a day or so).  Then Santa to the rescue.  This is all just speculation of course and subject to change.  But for today let's keep it simple and look for that small bounce to carve out the small wave 4 up and expect the 5 down tomorrow.

ES Morning Update December 5th 2017

0

Well, looks like I got yesterday wrong as the bulls failed to hold the line all day and instead dropped into the close to fill the gap up open.  Maybe they should have thrown two men out of the balloon basket instead of one... LOL!  It's back to the "buy the rumor, sell the news" event, which worked this time but fooled me with the last move up to new all time highs yesterday before "selling the news".  It a hard market to predict as SkyNet throws you curve balls right when you mastered its' fast ball.

Anyway, at this point it's looking more and more likely that the high was put in yesterday and a several week pullback is happening.  Odds favor a retest of last Fridays' low at this point versus another higher high.  But the short term chart got oversold quite a bit yesterday so we could do that sideways "pause' day today I guess... meaning yesterdays' drop was some kind of A wave down and we should see a B wave up today.  Whether it is a strong B wave up or slightly up (mostly sideways) is hard too say.  With the Nasdaq selling off the fastest yesterday it's a sign to me that insiders are dumping hard as they know a pullback or correction coming.

That also suggests that we might not see the usual strong B wave up that is common in a trending up market, as if the trend has changed to down then bounces should be weaker.  Do I think the trend has changed?  Yes, I think we are in a down trend for awhile and even when Santa comes later this month I still think the big picture will be a down trend and that the end of the year rally will just make a lower high, sitting up January as a down month for what I see as a big ABC move which should end in early 2018... maybe January, but could be February or March at the latest.  Anyway, for today this again looks like the B wave bounce.  How high is goes is anyone's guess.  I think it will be weak, like a lower Fibonacci level of 23.6% or 38.2%, not much higher.  I remain bearish for now looking for Friday's low to be retested within a day or so.

ES Morning Update December 4th 2017

0

Man... those bulls are tricky!  Last Friday I was looking for a high to be put in like what we are seeing today and then the Friday mini-flash crash to happen Monday, but it happened midday on Friday when I wasn't expecting it too.  It took out a lot of bulls on that fast move down as it hit their stops.  Then it reversed hard into the close to regain over half the move down.  I'm sure a lot of bears went short then and are now going to be feeling some pain at this mornings open.  And even worst is that the mini-flash crash on Friday wipe-out out a lot of "short term" bearishness... meaning there's no real reason today to get short as it's more then likely going to do a lot more "shaking and baking" up here at these new highs before it's going to pull another mini-flash crash move again.

The bulls pulling a stunt like last Friday was kinda like them being on a hot air balloon with 5 men in the basket.  It has a leak in it (still does) and was losing altitude slowly over the past several weeks (super light trading volume), but managed to stay up in the air by hitting pockets of updrafts to keep it rising back up and not hitting the ground (those updrafts were positive news stories, earnings reports, etc...).  Last Friday the men were running out of tricks to keep them up in the air and the balloon was over ocean waters where they would surely drown.

So they decided to pull the worst kind of stunt possible... sacrifice one of their own men! Yep... that mini-flash crash was the 5 men reduced the load in the basket by tossing out someone to reduce the count to only 4 men.  It now will buy them more time (probably until end of this year) floating up in the air but eventually they will have to do another sacrifice, which should be bigger as with time passing more and more air is leaking out of the balloon.

At this point the men will likely get past the light winds of early December (the first half of it is commonly bearish) where the balloon stays just slightly above the cold ocean water, and they will then make it to the heavier winds area the second half of the month to lift back up to higher altitudes where they feel safer (the Santa rally).  So while the men knew they were in for a "touchdown" into the shark infested waters this mid-December they will likely avoid it now as they choose to sacrifice on of their own to save the others.  The sharks below (the bears) will have to wait for another time to feast it seems... most likely in January of 2018.

My thoughts for today... probably choppy, just a sideways day to hold the new ground they reached.  Upside seems limited now as the euphoria of the tax plan being passed is likely already built into this gap open this morning.  So while I wouldn't short it today (and glad I decided not to short at the close on Friday), I also wouldn't go long as it will likely stall out and not make much more headway up this morning.  As for the possibility of a move down, I think we could still see one but it doesn't look good for today.  And the most bearish period is the first couple of weeks of December.

So even if it starts down later this week or next week it should be a small move down, not some big correction of 7-10% like what "would" have been possible with a "NO Vote" on the tax bill.  Maybe they retest the low on Friday over the next two weeks?  But I really don't see them give up right now after they worked so hard to reach this level.  Anyway, I see no clear direction for today or possible trade setup on the long or short side.  Maybe tomorrow I can get more clues to the next big directional move?  Or later in the day their might be something show up in the charts (like negative divergence), but there's no trades for me at the open.  Anything new that changes my mind will of course be posted in the chatroom.  For now though I doubt if I will be taking any position today and will just be watching for the next setup... bullish or bearish.

Another 9/11 may be the black swan event that triggers global stock market meltdown

0

Major financial institutions like Bank of America see the end of the bull market next year. They predict stocks pushing higher in the first half followed by all sorts of potential trouble after that.

Some experts say the new crisis could happen because of economic factors like an inflation hike or tight monetary policy by the US Federal Reserve. However, the crisis is much more likely, if an external shock hits the world, warn analysts.

“In general, this can be any significant event, for example, military actions. The effect will be stronger if negative events happen one after another. In such a situation, there can be a plunge in stock prices and deleveraging would start. All risky assets will begin to get cheaper in a spiral. This is the standard development of the crisis,”financial analyst Timur Nigmatullin told RIA Novosti.

According to the analyst, geopolitical risks are difficult to predict and can happen without notice. At the time of terror attacks like 9/11 or military actions, hyperinflated assets are most vulnerable.

The S&P 500, the American stock market index based on the market capitalizations of the 500 largest companies listed on the NYSE or NASDAQ, has grown almost 40 percent in a year and a half. The index has been increasing steadily since the financial crisis started a decade ago, when it slipped 38.49 percent, its worst yearly percentage loss.

The other probable risks for the global economy include the crisis in the Italian banking sector and likely difficulties facing the Chinese leadership handling ongoing economic growth.

“In the near future, Chinese society must adapt to its higher income and deepen integration into the global economy. When this transformation begins, there may be a capital outflow from China: investors will be afraid of possible problems in this direction," Nigmatullin said.

The black swan theory was developed by author Nassim Nicholas Taleb to explain an event that comes as a surprise, has a significant effect, and is often inappropriately rationalized after the fact with the benefit of hindsight. The term is based on an ancient saying which presumed black swans did not exist, but the saying was rewritten after black swans were discovered in the wild.

ES Morning Update December 1st 2017

0

Man... this market is crazy!  I'd love to have been long the last few days but I wasn't unfortunately.  But who knew it was going to explode straight up for 3 days in a row?  Not many I'd say, as most traders are in as much shock as I am seeing this bull run as hard as he has.  It has all the makings of a blow off top, but where does it end?  It's all about getting the tax bill passed as everyone is front running the vote that they all assume will be passed.  I'm not a fortune teller so I don't know if it's going to pass or not but it sure reminds me a lot of the BREXIT vote, where no one was expecting them to leave the EU... and you know what happened back then!  If this tax bill gets voted down this market is going to tank super hard next week.

There's still no final vote just yet but it should be completed today or this weekend from the looks of things.  Like I've said several times lately, even a YES vote should cause a pullback of some degree as I firmly believe this is another "Buy the rumor, Sell the News" event.  And if it's a NO vote... you'd better not be long going into Monday, that's all I got to say.  But assuming it's a YES vote there might be some carry over move up into Monday but it should end fast and a pullback start.  There should be at minimum a retest of 2600, but really it should find support at the prior lows around 2542 into mid-December and then rally back up to erase it all with the Santa rally.  It's hard too believe that right now up at these sky-high levels but it's really a small pullback for a YES vote.  If it's a NO vote then I'd expect a fast drop of 7-10% into mid-December. Yeah, that's a crazy call to, but it's can happen.

But for now we don't know what the vote is but everyone thinks it's a YES vote so assuming it happens I'll be positioned short by the close and expect the small pullback into mid-December.  Either way the vote goes I'll be short by the close.  I still little upside left and will ride out any follow-through excitement on Monday from a YES vote as it should still rollover shortly afterwards in my view.  My thoughts for today... flip a coin?  Could chop around or have another screaming rally... I just don't know?  Considering the depth of the pullback after-hours and now the bounce back up I'd expect more of a choppy day as that's the first time we'll seen a decent move down happen in the last 3 days.  That signals to me the bulls are getting tired... finally!  So have a great weekend everyone and prepare for the "unexpected", as next week should be even more interesting then this one.

s2Member®