Monday, April 28, 2025
Home Blog Page 118

Weekend Update…

429

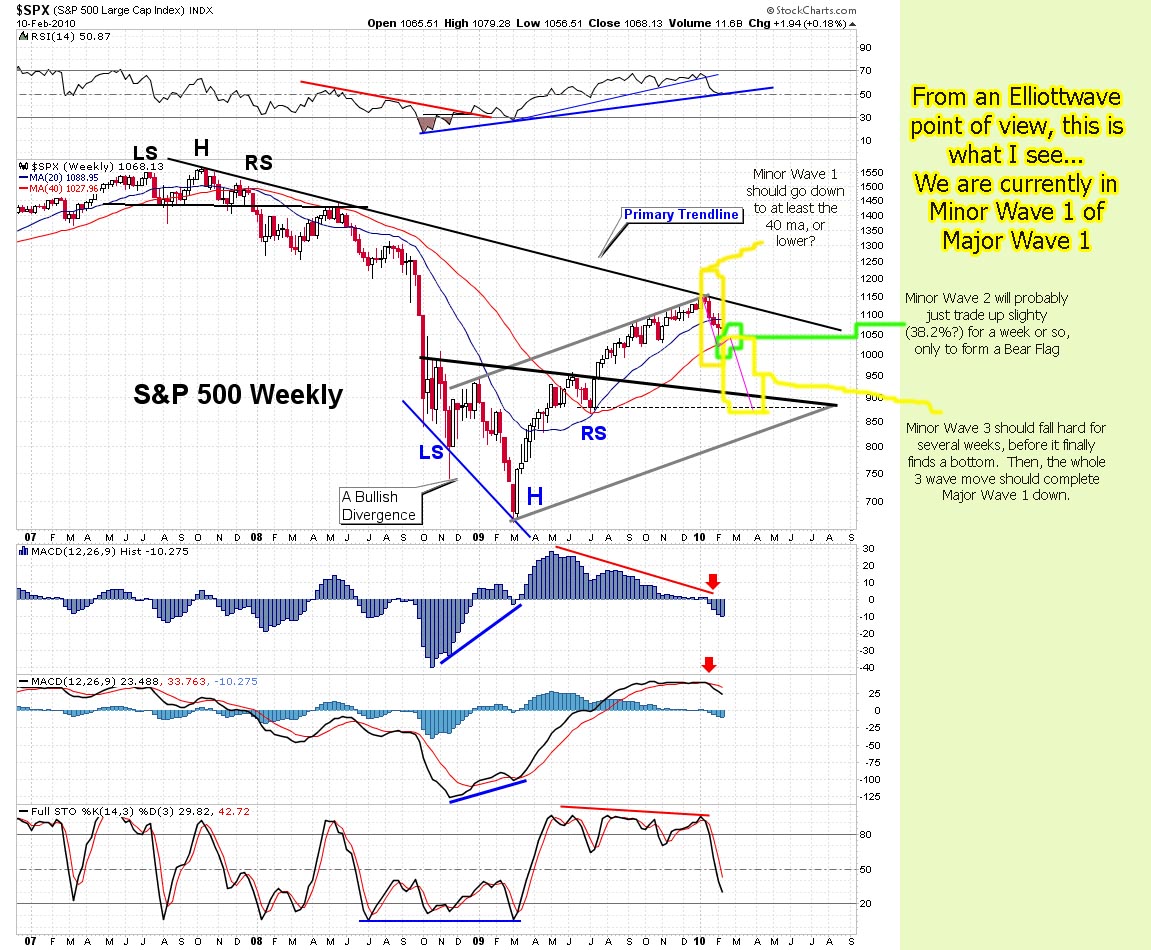
I see no point in trying to forecast intraday, or even daily moves in this extremely manipulated stock market.  So, I'm going to focus on the weekly instead.  Let's look at the weekly chart below...

The-Chart-Pattern-Trader-spy-weekly-chart-02-28-2010

We are clearly forming a nice bear flag on it, as we have now completed 3 weeks of a down move, and 3 weeks of an up to sideways move.  Notice that last week was basically flat (down a little), putting in a bearish hammer candle.  If this bear flag plays out, then we should head down to the 104 spy double bottom area by the end of next week.

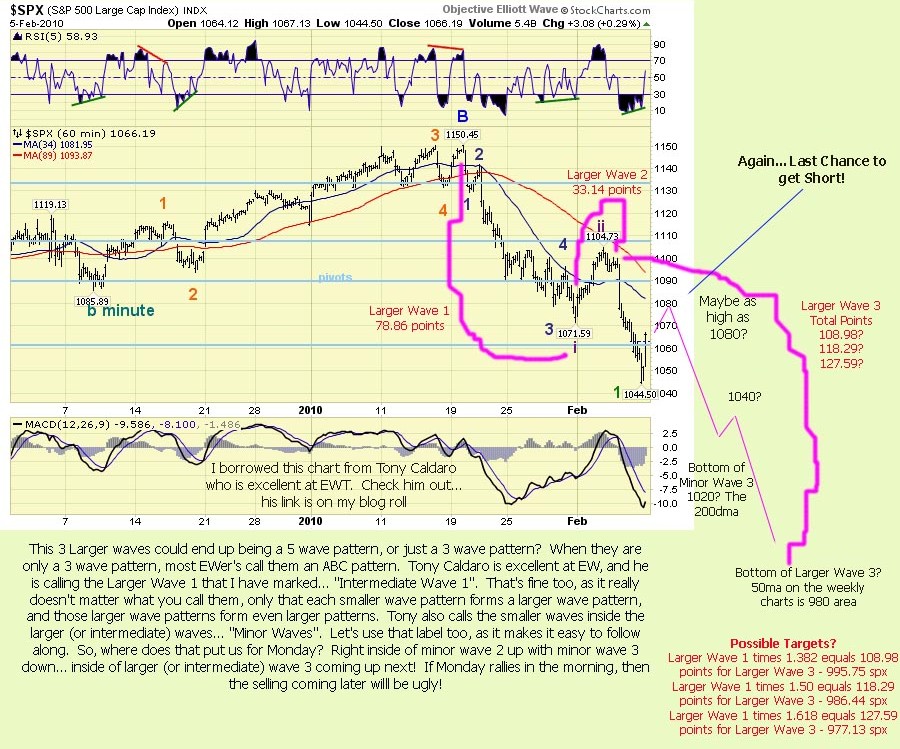
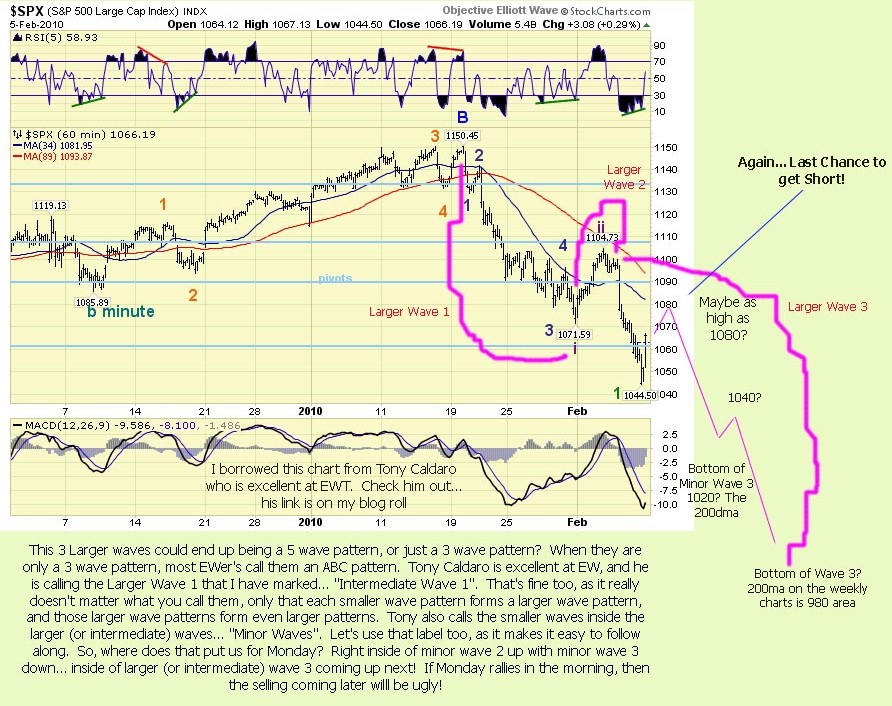
I suspect that the jobs numbers will be really bad this week, and will be blamed for the sell off coming.  But that doesn't come until later in the week.  So just remember, most Monday's are bullish, and I've rarely seen a big down day on Monday.  That doesn't mean it won't happen, only that it's not likely.  If Monday does push up a little more, then I think the target will be the 112.00-112.50 area, as it's provided great resistance in the past, and should continue to do so.

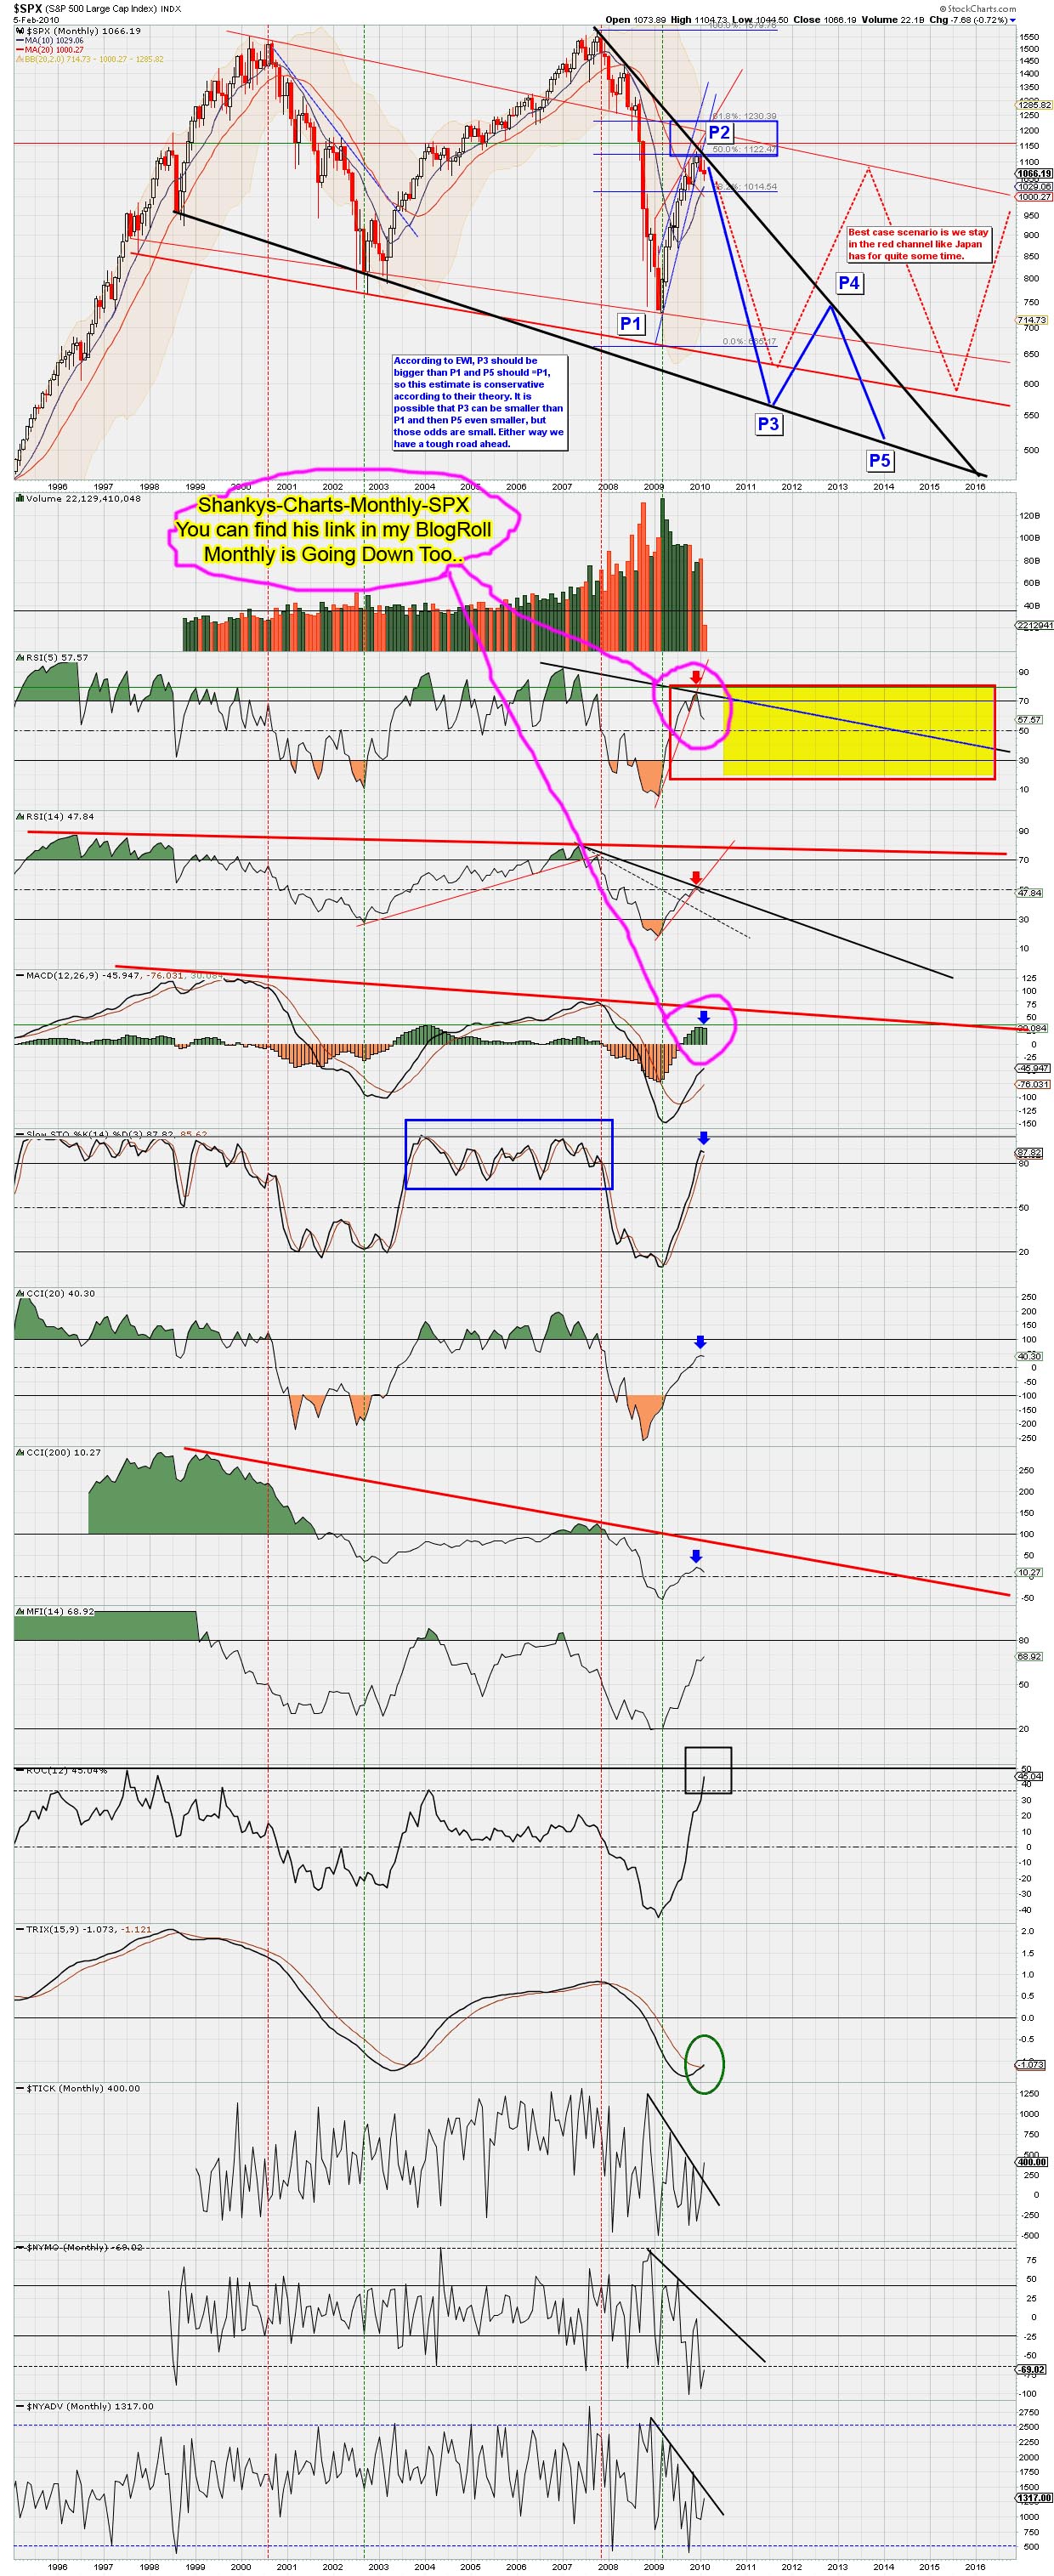
If that gets broken, then we are heading for a double top at 1115 spx.  I really don't see that happening with all the news out next week.  The bulls seem to be just about done now, as it's going to be extremely hard to push up very much further.  From the Monthly to Weekly charts putting huge downward pressure on the market, to the seasonality of March, and multiple turn dates coming up... it's not looking good for the bulls.

lloyd-blankfein-testifing-god's-work

But... and this is a big butt, the bulls still have GOD on there side!  Yes, Goldman Sachs (aka God... at least in their sick minds) still has your money, and your children's money, and your children's children's money too use to buy up the worthless stocks in this doomed market.  (Personally, I thought God was a giving and caring person... not a THIEF!  That tells me they are doing the Devil's work... not God's).

Anyway, that simply means that NO about of Technical Analysis I do is going to be accurate with all the free money still manipulating the system.  If you have unlimited funds to keep the market up, then no about of selling will ever stick.  Anna seems to think that we won't get any significant downside until Obama pushes his worthless Heathcare system through.  That very well could be right?

Remember this... from the creation of the stock market, until the present, there has always been manipulation in the system.  However, the control that they have had, was limited by the amount of cash they had to work with.  When the PPT (Plunge Protection Team, created by Ronald Regan after the 1987 crash... which was originally designed to simply prevent further crashes, not manipulate the market) was created, the crooks seen that as an opportunity to have free funds from the government, instead of using just their own.

In the beginning, the amount of funding to the PPT was not nearly enough to fully control the market with the normal volume that occurs throughout the year.  But with light volume during holiday's and certain times of the year, the PPT soon discovered that they could fully control the market and push it in whichever direction they wanted.

Then along came March 6th, 2009... which forced Obama to turn the money flow on full blast, giving unlimited funds to the PPT (aka Goldman Sachs).  Their humble leader Lloyd Blankfein (aka GOD), does just what any good crook would do... buy up his own stock, almost tripling it in value over the next year.  Then, pay himself and other bankster pals huge bonuses with all the money that he had stolen from the unsuspecting American public.

What does all this mean?  Simple really... it means that you can't really use TA's anymore to forecast the possible direction with any kind of real accuracy.  I do believe that technical analysis still works on most individual stocks and some commodities... but not the overall market right now.

If it sounds like I'm bitching and complaining again... you're right, I am!  What good does it do to study charts, learn Elliottwave, Technical Analysis, Fibonacci Retracement levels, Astrology, Gann or Bradley turn dates, and any other forecasting method, if none of them work anymore.

I've always known that trading was very difficult, and not very easy to become successful at.  I've been through the "school of hard knocks", and I've put in my time in studying and learning the techniques that are available t0o be learned.  Obviously, the "real techniques" and secrets are buried inside Goldman Sachs, as I can't find anyone else who can figure out where this market is going next... can you?

Red

Bear Shake…

40

NO POST FRIDAY... NOTHING CHANGED!

NEXT POST SUNDAY NIGHT.

This is How I feel... Clueless!

yellow_guy_smiling_really_big_hg_wht

bears-in-a-tree

More bears were shook out the tree today as buy programs come to the bulls rescue once again.  Yes folks, we should have tanked again today, but the crooks at Goldman and the Government stopped the sell off with their computer program algorithm machines.

It's just another way of shaking more shorts out of their positions.  You sell off one day, get the bears to go short at the low, rally back up the rest of the day to squeeze them out.  Then sell off again the next day, get a second round of bears to go short at the low, and rally back up again... squeezing once again.  Is tomorrow is the third time?  Or, will it sell off for real this time?  I doubt it.  If it sells off tomorrow, I'd expect at least one more rally back up to shake the last bear out the tree.

Then, release some bad news over the weekend and gap down on Monday with no bears in the market.  Wouldn't that be UN-expected?  When is the last time you seen a negative Monday?  It's been too long to remember, so I'm certainly not going to predict that "this time will be different", and Monday will be a big down day.  I don't have a clue as to what will happen on Monday.

I can say that by all Technical Analysis, we should sell off again... but you know that's not going to happen as long as Goldman runs the country.  On an even funnier note... Goldman is now to be investigated over the Greece issue.  And guess who they want to investigate them?  You guessed it... Ben Bernanke!  Yes folks, it's time to appoint Al Capone as lead investigator into Mob Crime.  (ROFLMAO).

What a fraking joke?  Just line them all up and give me a high powered rifle.  I'll put an end to it... once and for all!  That's about the stupidest thing I've read today.  When will Americans wake up and go hang these crooks?  Let's get a lynch gang, find the tallest tree, tie some electric cable too it, and hang and fry 'em at the same time!

Anyway...

I've been around a lot lately, as I haven't been working for the last few weeks.  As most of you know, I try... and the key word there is "try", to swing trade, not day trade.  But, that's been almost impossible lately with all the huge intraday moves back and forth.  Luckily, I've been around to save my bad trades (some of them at least).  But, next week, I'm back to work, and will be dropping in less as I get too busy to chat all day.  (But, feel free to continue chatting without me, as I post everyday on this blog for you guys and gals... and also as an outlet to "air out" my frustrations).

Now, as for tomorrow... well, most Friday's are flat to up, with light volume as the traders leave early for the weekend.  That means we could drift up a little all day and end up closing flat.  Of course I posted yesterday that I thought today would be flat to up... and was dead wrong, so don't expect Friday's forecast too be any more accurate.  I guess I was right on the fact that we ended about flat for the day, but the way off on the intraday swings.

If I do start getting every call accurate, then you can assume that I just got a new job at Goldman Sachs... as they are the only ones' that know where this market is going tomorrow.  Don't worry though, I've bad mouthed them enough that they would never hire me anyway.

From a technical point of view (not that technicals actually work anymore), I'll refer you to this chart by Cobra.  As you can see, today we had what is normally called a Hollow Reversal Candle.  In this case, it would be called a Bullish Reversal Candle... but, as Cobra points out, we are too close to the top, to reverse back up.  That means it could go either direction.

cobra's-daily-spy-chart

Hollow Reversal Candles work pretty well when they are at a top, or bottom... but not in the middle of a trend move.  You will also notice in the chart that we are still below the 50 dma, which is currently still holding the bulls back.  Unfortunately, the 20 dma also stopped the bears on today's move down.

So, that leaves us with no clue about tomorrow... except the fake print at the close today, that showed the 109.20 spy area as a possible target for any sell off tomorrow.  But, it doesn't have too go there tomorrow... it could be Monday, or never?  They have been quite accurate lately, but you never know when they will decide to stop it.

Anyway, I did take a small short position around 110.40, with a 109/104 put spread.  If we go down to that 109 area again tomorrow, I will close them out, as I'm not holding over the weekend into Bullish Monday (and that will of course be the day they gap down huge on, as that's just my luck).

Red

Still In Rising Channel…

705

Some wild swings in the morning, and then some sideways chop until the close...  but we're still in the rising channel on the 60 minute chart below.  I didn't think the move down yesterday was going to stick, as the volume was just too light.  The 1092 level that held yesterday, will move up tomorrow to about 1097 on the lower trend line on the rising channel.  Will it hold again tomorrow?  As long as the volume stays low, then the answer is most likely YES.

The-Chart-Pattern-Trader-spy-60-minute

Today's volume was only about 175 million on the SPY.  That's just too light for any sell off to happen.  The markets are still being held up for now.  My feeling on tomorrow is that they already know that the Initial Claims and Continuing Claims numbers are worst then expected.  So, how do you keep the market from selling off huge on the numbers?  You release other bad news like the Consumer Confidence numbers, and New Home Sales 2 days ahead of that.

The expectations will be lowered in the minds of the traders, so when the numbers are released, it won't have as big an impact.  Smart crooks, these Fed's are...  You have to give them credit for that.

Next, what I would do is to rally the dollar over night, then sell it hard at 8:30 am when the Claims numbers are released.  That should keep the market from selling off too hard.  Crooked isn't it?  Of course it is... but a year ago only 1 out 20 people asked would say that the market is manipulated.  Now, I'd bet 1 out 2 would say it is...

Clearly, without the stimulus money, the market would probably be below the March 6th, 2009 low by now.  All this manipulating is really going to hurt the economy long term.  It's like they are slowly pulling the bandaid off from the big cut or sore on your body... pulling one hair at a time.  It would be a whole lot less painful to just jerk it off quickly and be done with it.  Sheesh... every parent knows that.

But, I guess we don't have adults running the government... we have children.  They cry when things don't go their way, throw temper tantrums, and fight among each other.  Yep... sounds like to children too me!

Move on...

Looking at the chart above again, I'd say we could chop a little higher until the end of the week, as the MACD is rising up into positive territory, and the ADX line is still pointing down.  The ADX could bottom on Friday or Monday, and then start to curl back up, giving strength and momentum to whichever DI line is on top.  My thoughts are that the negative DI line will start to rise at that time, and nice little sell off would occur.

This will line up nicely with the weekly chart putting in a nice bear flag too.  Just keep in mind that during light volume periods, the market rarely sells off.  It usually goes up, or sideways.  So, I'm looking for the ADX to find a bottom and start to turn back up while the spy is also hitting major resistance level.

Those levels are 111.50 spy (about 1110-1112 spx), and the best level is 112.00-112.50 spy (about 1115-1120 spx).  I would love to see 112.00-112.50 by the close on Friday, as that would be an ideal place to go short over the weekend with a put spread.  It may not happen though, as that target might not be hit until the usually bullish Monday next week... but, what if Monday starts a nice sell off?  Would that catch the bears by surprise?

Hmmm, bear flag on the weekly charts, major resistance at 112.00 area, February closes out positive, new month to start next week, and maybe some bad news released over the weekend?  That sounds like the perfect setup to fool a lot of bears... and bulls too!  Will it happen?  Who knows?  I'm just throwing it out there for you to decide.

Red

Strange Sell Off Today…

59

The market sold off today on a worst then expected consumer confidence number.  Duh!  I could have told you that!  Well, I guess they have to have something to blame the sell off on.  It's not like they are going to go on TV and say how extremely overbought the market is, and that's why it fell.  Of course all traders knew we were due for a pullback, and the news is just the reason to make it happen.

Looking at the chart below you see that we broke out the rising wedge yesterday, and fell down to the lower trend line on the rising channel today.  This did put the 60 minute chart in an oversold position, which means we should trade sideways to slightly up tomorrow, before starting a nice move down on Thursday or Friday, as I mentioned on my weekend post.

The-Chart-Pattern-Trader-spy-60-minute

One thing that makes me think that we will pause tomorrow, before heading down more on Thursday or Friday, is the light volume of only 207 million shares, that traded on the SPY today.  All of the other large down days were 300 million plus.  That tells me that the big institutions weren't selling too heavy today.   It was still a nice sell off though.

And, this is clearly a signal of what's coming soon, as I think the market was really surprised by the consumer confidence number today.  Otherwise, they would have backed the market down a little slower, and in a more controlled fashion.  If that 109.80 level broke, the market would have really started falling.  Notice how they rallied it up to close right above that master support level.  They made it by one penny, at 109.81 on the spy.

Let's see if they can keep it a float again tomorrow.  I can't answer that of course, but if I had to guess... I'd say they would, at least for Wednesday and maybe Thursday too?  As for Friday, I think we will start the next leg down by then... which will continue into next week.  Remember, they are trying to close this month out positive, and Friday is the last day of the month.

So, after the month of February is done, March is free to sell off.  Now whether on not that is P3... who knows?  I'd just be happy for a nice big sell off at this point.  I can't see that far into the future, as my crystal ball is too cloudy right now.  Must be all that snow still stirring around from earlier this month?

Red

P.S.  One more thing... let's not forget that fake print last week at 107.38, should we start selling again tomorrow, as that would be a likely target for a bounce.

Light Volume Equals A Boring Market…

330

With only 132 million shares traded on the SPY, the market basically went nowhere.  Nothing has changed since the March low from 2009, as light volume still rules the market.  Ever since the cap was removed for the PPT, they have easily been able to keep the market flat to up on every light volume day the market has.  Of course the market has always been controlled to some degree, but when you now have an unlimited supply of free money, the control they have now is the highest it's ever been.

As much as I'd like to see a nice sell off, it's not coming until the big institutions decide to sell... it's really that simple.  The technicals didn't really change much today, as we are still over bought short term, but we can still go higher medium term.  However, I'm still looking for a small pull back later this week, but I'm not expecting too much.

Don't take this wrong, as I'm not bullish by any means... but I'm not bearish right now either.  The market is being propped up, and I'm not going to fight it... as I'll lose.  Here's an interesting video by my favorite president (I wish)...

For this week, it will be important for the master resistance at 112.00-112.50 to hold the bulls back.  If successful, then a pullback could start as early as Friday.  What I'm looking for, is for the adx line to bottom out, and start to re-cycle back up, with the negative di line leading the way.

Now if the 112.00-112.50 level fails to hold back the bulls, then we should see a move to 115.00 area for a double top next week.  I know that's not what you're looking to hear, but we are in a sideways market right now, that could break either way.  I'm going to remain neutral for now, and hope that 112.00-112.50 holds for the entire week.  I believe that if the level does indeed hold... for the entire week, then next week will be down.  Can the bears hold back bulls?  Only time will tell, as the market is just trying to put the bears to sleep right now.  Once they are all hibernating... the market will sell off.  Isn't that just the way it works?

Red

Weekend Update…

61

Bullish Monday again?  Yes, it's possible...  I know us bears can't seem to believe that the market could go higher, but it can.  When you look at the technicals, the ADX (advance/decline line) clearly shows that the bulls are still in control.  The adx line is now rolling over and starting to point down, just as the positive line is rising up, and crossing over the negative line.  What does that mean?

Simple... it means that the advancing move is losing momentum, but at the same time the positive di line is giving a bullishly cross over the negative di line.  This indicates that although the market itself is losing steam, the bears are too.  The di line (directional indicator) that is negative is the bears line.  When it rises the bears are starting to gaining power, but they also need the the adx line advance upwards too... showing that the momentum is also gaining power.

The-Chart-Pattern-Trader-spy-daily-02-21-2010

If you have one of the positive (green line) or negative (red line) di lines pointing up, then that line is in control.  So, if the positive line is above the negative line, then the market is in a bullish mode.  In the reverse, if the negative line is above the positive line, then the market is in a bearish mode.

Ok, now that seems simple enough, but where does the adx line come in?  The adx line simply shows the strength of whichever line is on top.  Any time the adx line starts to go down, then the market is losing power for the current trend.  Right now, we are seeing the adx line (black line) starting to point down, while the positive di line just crossed the negative di line.

So, even though the di lines had a bullish cross, that bullish move can't go too much further without the adx line rising up with it... giving the positive di line the strength it needs to rally up some more.  That leaves us in a sideways market until the adx line starts moving back up again, giving strength to whichever di line is point up at that time.

Hopefully that makes sense to you?  This means that the up move doesn't have much further to go next week, and that the down move can't happen until the adx line gains strength again by pointing up, at the same time the negative di line must also go up and crossover the positive line.

Just looking at the other indicators you would see how much the market is overbought.  But, it can remain overbought for much longer then you can believe it could.  It's the same thing on being oversold, as it could remain oversold longer then you might expect too.

It's all about how much strength (measured by the adx line) the market still has.  Once it loses strength, it doesn't have much further to go in that direction.  That why I'm expecting the market to be in a sideways mode next week, until the adx line cycles back down to the bottom and then gets ready for another momentum move... up or down?

This means I'm not expecting a big sell off on Monday, because there isn't as much momentum left (adx line) behind the move... in either direction.  Monday could pullback a little, or go up a little?  However, if adx line continues to roll back down, then I'd expect some profit taking by the middle of the week, but no big pullback.

A move down to the 1080-1085 level should be a good support level on any profit taking that should occur sometime this week.  This market will pullback, but it's not ready for the larger move down yet.  It appears that may not happen until the first week of March.  I still believe it's coming, because the monthly charts are clearly pointing down now.  They don't turn on a dime!  And, the weekly charts still putting in a bear flag.

The new larger trend is now down, but in the short term, we could chop around all next week, and really not go anywhere.  Here's a breakdown of where we are on each time frame...

  • Monthly Charts - Down Trend
  • Weekly Charts - Up Trend, but forming a Bear Flag
  • Daily Charts - Up Trend, but almost topped out.  Very Over Extended
  • 60 Minute Charts - Up Trend, but again... very over extended.
  • 15 Minute Charts - Sideways Trend, and extremely over extended.

With each chart in different trends, you can now see why I think we will chop around next week.  What we are waiting for is for all the trends to line back up in the same direction, along with the adx line bottoming... and ready to rise upward, giving fresh momentum to the trend in control.

Clearly, the monthly chart has the most power, and it's pointing down.  We need to wait for the weekly chart to line back up and start pointing down too.  Then the daily, 60 minute, and 15 minute chart would be the last to all line up.  If you can be patient enough for this too happen, then you can ride a really nice long trend down.

In the meantime, we will just have to take it one day at a time.  Let's see what Monday brings first, and go from there.  If we start to pullback at any time during this week, we should remember that fake print of 107.38 spy that occurred last week.  It could be the place that the market will bounce from?  We'll just try to remember that for when some profit taking does finally happens.

On a side note... the market seems a little strange here lately, almost like it's fight between the good and bad forces that control the market.  Maybe Obama is really trying to be the good guy here, and keep the crooked banksters from dumping their shares and crashing the market?  It's hard too tell about him, as he's clearly been a puppet for the banksters since they put him in office last year.

Is he finally taking a stand and supporting the America people instead of the crooked banksters?  I doubt it... it's probably just a political move since he and the Democratic party is losing popularity every day now (and election time is coming up later this year too).  Sorry, I still don't trust him or support him.  He's just as worthless as Bush was.  Just a puppet on a string, that's pulled by the Rockefellers, Rothschilds, Vanderbilts, and all the other familys in the Illuminati that run this world.

What most people don't understand is that the United States of America isn't broke... it's the Federal Reserve that's broke!  And they are a PRIVATE entity (bank) that owns a Private Corporation called "The United States of America Corporation".  The Federal Reserve is run by crooked banksters that want to keep all of the profit that they've stolen from American's and push off all the debts and liabilities onto the country of Americia (aka... the taxpapers).  Does that sound fair too you?

benjamin-fulford

If you like to listen to an audio by an insider named Benjamin Fulford by downloading this file (right click and save as).  If you would like to go to website, the link is here.  Scroll down the page to see Benjamin Fulford's link.  He also did some video's and they can be found here.

Many of this things haven't happened yet, which tells me that there is a fight between the good patriots of America and the crooked banksters.  Last weeks' weird action shows that something big is going to happen soon.  When is the big question?

Red

A Non-Event Day…

15

man-resting-in-a-hammock

It seems that the Fed's out-smarted the bears again, as the rate increase yesterday didn't affect the market at all today.  You could have just slept in, and you wouldn't have missed a thing.  It's funny how well they plan out every move they make, with such precision.  So what's the next move you ask?  The opposite of what you expect of course.

I'll try to piece this together for my weekend post, but I don't think the market is ready to rollover yet.  I'm looking for more of the same old grind sideways to up next week too.  Yes, I think we will rollover and take a breather first.  But after that, we are probably going to go a little higher.

Now keep in mind, I'm a bear by nature, but I'll trade both ways if required.  However, I'm really more interested in waiting for the next leg down to occur.  I really don't like to trade this choppy market as I just get beat up too much.  I'm a swing trader, not a day trader, and although some days I'm able to chat here frequently on the blog...other days I'm just too busy.  So if don't response immediately, it means I'm too busy that day, but I will get to your question when I can.

Not much else to add... it was a boring option expiration day pretty much.  Enjoy your weekend folks.  I certainly need too, as I've be slapped around all week by this big ugly bull.  Time for a nice rest now.  Come back late Sunday for more thoughts, predictions, and crystal ball rubbing.

Red

Fed’s Increase Rates…

80

bernanke-raises-rates

After hours the Fed released that they are increasing rates from .50 to .75, which caused a sell off to start and will most likely continue into tomorrow morning.  But, trading tomorrow will be risky if you are thinking that we will tank into the close.  That may not happen, as they aren't in the habit of giving you your money... they like to take it instead.

I fully expect the market makers to close it around 109-110 by the end of the day, as they don't want to lose money by paying out money to the option holders that have puts.  I'm expecting early morning selling, and then a grind back up to 110 by the end of the day.  The key time frame is 9:30 am to 11:00 am, and that should mark the low of the day tomorrow.

On another note, I was able to see a fake print of 107.38 spy on the 10 minute charts, which I added to yesterday's post.  This might be the place that they are planning to take the market to soon.  When, I don't know?  I don't think that will happen tomorrow, as we have too much support right now.  But, you should keep that target on your mind for when we do finally sell off.

So, tomorrow the key will be to watch for the selling volume to die off early in the morning, and get out of your shorts.  If we sell off to 107.38 tomorrow, I'd be shocked.  The market isn't ready to rollover yet folks.  We still need another week of choppy trading to set up a big bear flag on the weekly chart of the spy.  I do think we will put in the high for the market next week, before the large wave 3 down occurs.

As most of you know I make a really bad trade about a week ago and took a beating with some 106 puts I bought that will expire worthless tomorrow.  That's one of the reasons I try to think a little clearer this time.  So, knowing how manipulated this market is I fully expect the sell off tomorrow to be bought back up.  The news out tomorrow is the PPI and CPI... which you can guarantee will be positive.  That's the perfect way to raise rates (which the market won't like, and will be negative), is to add good news in with the bad news.

Timing is everything here folks, and they ain't stupid.  When they are really ready to tank this market, they will release nothing but bad news.  Right now they are still trying to hold the market up, so they will mix them together to have everyone's head spinning.

So, for the bears... you have a chance to save yourself tomorrow.  If we hit 107.38 (not likely), you had better bailout of all shorts!  The daily charts are still pointing up and won't rollover until next week.  I really think they want too go tag that 1127.38 gap (spx) that Sundancer pointed out.  I have the 112.00-112.50 spy area as major resistance, which is just a hair below the 1127.38 spx level.  I would estimate that to be about 113.00 on the spy, as it trades a little higher then the spx.  If anyone knows how to convert those two, please let me know.

Remember, nothing ever goes exactly as planned.  I'm getting better at this, but I make mistakes too.  Sundancer has again been of great help in informing us of the key levels that the market wants to go to.  There is also someone else I want to shout out a big Thank You too, and that's...

Anna over at Hot Option Babe (her free blog) and Options Black Board (her subscription service).  I have learned so much from her about the market, and how to trade options, that I wouldn't have made it this far without her.  She is a personal friend to me, as well as a mentor.  Yes folks, I do subscribe to some paid services, and her service is the best.  The banner I have on the right side of this page isn't a Google Ad... it's put there by me, because I highly recommend her service.

So, if you can't day trade, but would like to learn how to swing trade options... go sign up, as it's well worth your money.  Just take the trades that she does, and you will be happy that you did.  She is one of the best traders I know... seriously folks, no kidding aside.

Of course I can't post her trades here, as that information is for the subscriber only... I can tell you that she gets a large percentage of them correct.  I'm not going to claim a percentage on her behalf, but from my point of view, I'd estimate she's 75-85% correct on her calls.  Remember, that's what I see... and not what she's claiming.  On the one's she gets wrong, she more then makes up for those loss with profits from the others.

Moving on...

I'm torn on what to expect next week, as I see both bullish and bearish sides to the argument.  I think we should start to head down soon though, so I'll just try to piece that together on my weekend post.  Let's just get through tomorrow first... OK?

So, timing is everything tomorrow.  The support levels on the way down are at 110.35 (but we are already below that after hours), 109.60-109.70, then 109.00 for gap fill from 02/04.  After that is the 108.00-108.40 area, which is the gap from 02/16, and finally the 107.38 level.

I really don't think they will take it all the way down to 107.38 tomorrow, but it is possible.  If they do... again, get out of all shorts.  This market isn't ready to roll over yet.  Next week is a different story though.  The current pain is still at 109 tonight, and I will update you with that information should it change tomorrow morning.  I do believe they will close this market where it makes them the most profit.  Whether or not this current pain number is accurate or not, I don't know.  I suspect that the 110 level is the real number... not 109, but regardless of where it is, I'm not expecting a huge crash tomorrow.

Let's all try to stay in this game until we see what next week bring us.  I suspect they would like to close the month out good, and hit their key levels first... before tanking it.  Next week will bring a lot of whipsaw action as the bulls and bears fight it out.  I'm going to try and stay out of their way, what about you?

Red

The Bull Took A Breather Today…

1,757

resting-bull

This rally has been very powerful from the low at 104 last week.  Today the Bull took a breather before running higher again.  I don't think this rally is over yet as the daily charts are pointing up, and will probably remain so through all of next week, as they slowly top out and roll over into early March.  I do think we are due for a little pullback first... and then another move up.  How far?  I don't think it will be too far, or too easy next week.  In fact, I think it will be a chop fest, as they swing back and forth the whole week.

I don't know if they will get through the huge resistance area at 110.35-110.50, and the 200dma just a hair above that.  The next area of major resistance is 112.00-112.50, which I would love to see hit by next Friday, as that would be the absolute best place to go short for the expected fall into early March.  I'm not telling anyone to go long next week, expecting that level to be hit.  It's should be pretty wild next week, and the indexes aren't going to be safe for a swing trade.  Stick to stocks or something, if you must trade.

But for this week, since 108 is the current pain on the SPY, I suspect they will close it around that level by Friday.  That means I'm looking for a pullback tomorrow.  There is support at the 109 level, and it could hold until Friday, and that might be the close?   But, most Monday's are bullish, and that doesn't seem like it would be enough of a pullback before going higher.  That means they might take it on down to fill that gap around 108... which is the current pain level too.

The current pain level isn't always accurate on the indexes, but sometimes it is.  I find it more accurate on individual stocks, as they can push the price of stocks a lot easier then an index.  Pinning a stock at a certain level on opx is very common, as the market maker always want to maximize profits by paying out the least amount of money as possible.

The indexes are a little tougher to move and pin at a certain level.  That's why I wouldn't be surprised if it only pulls back to the 109 area tomorrow, and possibly Friday too.  However, the light volume makes it easy to move the market where you want it to stop.  If I had too guess, I'd say about 108.50 on the close Friday. 

The only thing that concerns me is the bull flag that formed today on the 60 minute chart (kinda looks like a bull flag?).  They could push it up (in the pre-market) through the resistance level of 110.35-110.50 and then send it back down taking out all the stop above key levels.  As I said above, I don't see a lot of downside between now and this Friday, because of the fact that the options expire this week.

So, I'm looking for about 108.50 by Friday, (and a choppy market next week).  Any lower would really surprise me.  The Bulls own this tape right now, and the ball is in their hands.  But next week will be a battle between the two, as they try to squeeze out both sides before they tank it the following week.

With this week, and next week's close of around the same area, we will then have a nice bear flag on the week chart, which sets us up for a nice fall the first week of March.  Nothing is for sure of course, as my bearish stance last week (and early this week) put a hurting on my account, and pride.  But, I'm still in the game... for today at least. 

🙂

Red

AFTERHOURS UPDATE:

Saved By Fed's...

Quick update here gang.  In case you haven't heard, the Fed raise rates from .50 to .75 points (http://www.marketwatch.com/story/fed-hikes-discount-rate-says-not-tightening-2010-02-18).  I'm expecting a lot selling tomorrow, so you bears might be saved.  Below is a screen shot of a fake print.  The target area is 107.38 spy.  I don't know if that's tomorrow, or if it happens over the next few days?  After that, we should bounce.  More later on my nightly post.

Here's the print, not showing the actual number in the upper left of the screen...

spy-fake-print

Here's the print with my mouse over the line, showing the close of the print in the upper left side of the screen.

spy-fake-print-with-low-target-shown

Bull Fever…

282

bull-market

Looks like the Bulls blew past the Bears like they were standing still today!  A bomb was set off outside of a JP Morgan office in Greece.  No one was hurt, but I'm sure some important records about anything to do with Greece, were burnt up in the explosion.  After all, how else can you cover up all the illegal deals you did with Greece?  It's the America way of course.  I guess the market seen the news as positive, so the rally continued.

Unless some major news event happens, I'd expect tomorrow to be a pause day before moving higher to the 110.34 spy level.  The 108.00 level is the current pain for this Friday, so it could slowly drift on back down to that level by then.  That's the best way too screw the bulls and bears both, so that would be my best guess as to what should happen the rest of the week.

I have too admit, this has been a big disappoint for me, as I totally missed this move up, and got caught short as well.  The daily charts are looking bullish now, and the 60 minute chart is a little overbought, but it still could run a little higher.  The bulls are back in control of the tape now, as the light volume clearly dictates that.

During the large down move, volume was well over 200 million, and even over 400 million on day.  Today was only about 150 million, which is the same as it's always been during this bear market rally from the March 2009 low.  Light volume usually means an up market, as the big institutions are waiting for higher levels to start selling again.  Where, and when is the question I can't answer.

Not much else to add.

Red

Weekend Update…

623

greece-is-the-wild-card

This has been a really tough week for me, as the expected next leg down didn't happen.  I'm now underwater pretty bad in my put spread that I purchased back on Friday the 5th.  I completely forgot a post I did a month ago, showing a fake print of 1047 on the spx, or I would have known we weren't going any lower yet.  Isn't it's funny how we pierced that level (1044) a little, and immediately bounced back up.  If that doesn't show you that the market is controlled and manipulated... I don't know what will.

Sundancer also caught that fake print and seems to agree with me that this is clearly the way wall street informs their buddies as to where they plan on taking the market to.  By the way, thanks a lot for all the great comments you post Sundancer.  I'm sure everyone will agree that you are very knowledgeable about the market, and have helped myself and many others that read this blog.  So, keep up the good work...

As for next week... it could go either way?  I really just don't know at this point.  I do agree with Sundancer that a gap up Tuesday is very likely... but where we go after that will probably depend on if they can hold that gap or not.  How many shorts are left in the market to squeeze?  I don't know?  If there is enough of them left, then it's very possible that they run the market to 110.34 spy before selling off again.

The news on Tuesday about the Greece bailout problem could be the reason to push it up or sell it?  It's seems that there aren't any bears willing to go short right now, for fear of being squeezed, and there also isn't any bulls willing to go heavily long either.  In fact, I suspect that most bulls are waiting for 110.34 to sell their long positions.  We are truly stuck in this rising wedge or channel, and no one is taking on any large risk right now.

That's why everyone is day trading, which produced the wild intraday swings that we had last week.  Neither side knows which direction this tape is going to go in.  It's great for day traders, but murder for swing traders.  I'm not going to post any charts this time as not much as changed from Thursday post, so you can look at those for reference.  I will tell you that The Chart Pattern Trader has 2 video's up, and should be watched to understand where we are, and what could happen next week.

Cobra's Blog is also excellent, and has some interesting statistics on his weekend post.  I'm certainly not too proud or self centered to try and keep you here on my blog only, and not tell you about other great chartists and blog writers.  I want everyone to succeed, and if I can't provide you with that information, I'll do my best to guide you to sites that I think are important to read.  I didn't create this blog to get a huge following, or generate traffic.  I only put it up to help others and for me to keep a record of my success, and failures.

I would be doing everyone a disservice by not informing you of others that I respect, and I won't do that too you as I wouldn't want it done too me.  I was clearly wrong on my call last week for the sell off, as it didn't happen.  Will it happen this week, and make my calls just too early?  Possible?  I don't know?  I do know that the news coming out about Greece this Tuesday will make a big impact on whether we continue higher to 110.34, or sell off one more time before a nice relief rally occurs.

I will definitely be on the lookout for another fake print as to see where they want to take the market next.  (Sundancer, please keep your eye's glued to your monitor too... just in case I miss it).  I do see us going down more in March, as I believe we will go down to that 900 area.  But, that's too far out now to worry about, as there will be many bounces along the way.

So, for Tuesday I'm expecting a gap up.  After that, it's up to the Greece news to determine the next move.  If it's not what wall street wants to hear, we could see some big selling.  Remember, that would put us in a wave 3 of wave 3 down, and it could fall pretty fast.  This is assuming that the wave count I posted on Thursday is accurate.  If it's not, then any move down would just be a wave 2, with and expected wave 3 back up to occur.

By the way, the current pain on the SPY is at 108.00, but that doesn't mean that's where they will close the tape on Friday (OPX).  It's been wrong many times in the past, so I don't hold to much weight to it anymore.

Best of luck to all of us, and keep up the great comments gang...

Red

Bear Squeeze…

131

NO Post for Friday, I'll have my weekend post up by Sunday night...


Man that hurt today!  I am so ready to bail on my position... that is now largely underwater, but just when I do... this market will tank!  So, I really had to bite my tongue and hold my fingers away from the panic button today, as I was very close to bailing out.  But, this stopped me...

 The-Chart-Pattern-Trader-spy-weekly-chart-02-11-2010

As you can see, the moving averages have rolled over and are still pointing down.  This is totally different then the last 10 months or so, as they were pointing up then.  This is the real deal!  This market has HUGE overhead resistance pointing down on top of it.  It's simply can't run up too much further.  The question is... will it sell off before this option expiration?  I believe it will.  How far down?  At this point, I think 1044 is definitely likely.  The next level at 1020 will be hard to break before opx.  It could happen, but I just don't know right now.  That means that the 980 level has a low chance of hitting.  It's possible, but odds are against it now.  Panic would have to set in probably, so I won't rule it out.  Remember, the market falls a lot faster going down then up.

I have now changed the Elloittwave count, as to the market still being in Mini Wave 2 up, of larger Intermediate Wave 3 down, inside larger Minor Wave 1 down.  This is one of the things I don't like about EW, as you always have to change your count.  Just when you think you have it figured out... Bam, it expands out to a longer wave, or changes direction.

That's why I look at the Technical Analysis first, and then try to forecast the waves that we are in.  I think EW is pretty good on a larger scale, but the smaller one's are hard too determine.  Ignoring EW on this chart, and just focusing in on the TA's, I see a Bear Flag from the sharp sell off on last Thursday to the 5 days of sideways to up consolidation that is currently underway.

You can also see that the UP Volume today was only 221.4 Million.  Where are the Big Institutions?  They didn't do any buying today... did they?  It looks like they did do a Lot of Selling last Thursday... look at that DOWN Volume... HUGE!   Notice that every time we had a big down day, there was also big volume.  Now I know that the entire rally up from the March, 2009 low was on light volume.... but, the Monthly and Weekly charts were supporting the move, as they were both point UP!  Where are they pointing now?  You guessed it... DOWN!

cobra's-daily-spy-chart

That's the BIGGEST reason that I didn't bailout on my short positions today.  Yes, I'm underwater badly on them, but the chart still tell me that a big sell off is coming... and before OPX!  Notice the downward trend line that Cobra drew on his chart.  As you can see, the Bulls could break through it.  By the way, Cobra's link is on my blogroll, and you should visit his site, as he is excellent with his TA work.

Next up is the 60 minute chart from the chart pattern trader.  Of course I've added my notes on it, (his link is also on my blogroll).  You can see that the MACD still hasn't rolled over.  It almost did yesterday, but it turned back up and is still going up.  The Full STO is above the 80 level and looking like it wants to turn down.  These indicators can sometimes remain in overbought or oversold territory for longer then you want them too... eating away at your options.

The-Chart-Pattern-Trader-spy-60-minute-02-11-2010

The downward channels line were broken today and that is also of big concern.  Will they fall back into the channel, or is this a real breakout?  I have to focus on the volume behind it, and I don't see it going up too much further.  There just isn't any good news left to move it up.  Low volume up moves worked well when the Monthly and Weekly charts were supporting the move, but they are now pointing down.

It's like the monthly chart is your Dad, and the weekly chart is your older brother.  You are the young boy at school, and you can get away with running you mouth a little, as you have your older brother and your Dad backing you up.  What happens when your Dad and older Brother are gone?  Or worst, they are against you...

That's my primary reason for hanging on in this Bear Squeeze.  Good ol' Dad and the older brother aren't around anymore.  My only fear right now is the Daily chart below.  It looks like the MACD is rolling back up.  Now again... it's just like the 60 minute chart, as it too... could turn back down just like the 60 turned back up.  Remember, it looked like it was going to rollover, but hooked back up today.  The same thing can happen to the Daily chart.  It could turn back down just as easy.

The-Chart-Pattern-Trader-spy-daily-02-11-2010

The good news is that it hit the lower channel trendline and couldn't get through it.  That's called a backtest, and as you can see, this is the second attempt at trendline... with it failing both times.  I'll admit that the market could continue a slow grind up... walking the trendline, and not go down until after opx.  But, I really think it's running out of time, and energy.  Too many resistance levels overhead, and too many trendlines from different sloping channels.  This market is dying, and it just hasn't proven to me that it can stay up here very much long.

I'm not just being stubborn here folks, the charts just don't support the up move.  If they did, I'd be bullish, and go long.  Now yes... I'm a bear at heart, but I will trade the long side if the charts support it.  They don't... at least what I'm see doesn't.  The daily chart is the only chart that is still neutral, and looking bullish.  But, until those MACD lines cross, I'm unconvinced.  The larger weekly and monthly charts tell me that the MACD line will roll back down and allow the chart to put in 3-4 lower histogram hills, with each hill getting smaller until they crossover into positive territory.

Best of luck to all of us...

Red

The Power Of Wave 3’s…

1,151

311333

The market is certainly not giving up easily... but neither am I!  It's "do or die" time now, as every chart I can find, on all the different time frames, is now set up for a Wave 3 Down.  From the smaller time frames to the larger time frames... we have a whole lot of wave 3's coming up next.  That's what I see in Elliottwave term, but I also see the same charts forming Bear Flags from a Technical Analysis standpoint.  Let's go over the Technical Analysis first...

Technical Analysis point of view... first up, the Monthly Chart

Shankys-Charts-Monthly-SPX

Technical Analysis point of view... second up, the Weekly Chart

The-Chart-Pattern-Trader-spy-weekly-chart-TA-02-10-2010

Technical Analysis point of view... third up, the Daily Chart

The-Chart-Pattern-Trader-spy-daily-TA-02-10-2010

Technical Analysis point of view... fourth up, the 60 Minute Chart

The-Chart-Pattern-Trader-spy-60-minute-TA-02-10-2010

Technical Analysis point of view... last up, the 15 Minute Chart

The-Chart-Pattern-Trader-spy-15-minute-TA-02-10-2010

Now, let's tie all the Technical Analysis charts into Elliottwave, and try to figure out the next move, as well as what wave we are now in?

Elliottwave point of view

The Monthly Chart has us in Primary Wave 3

Daneric-Charts-Big-Picture-SPX

Elliottwave point of view

The First Weekly Chart has us in Major Wave 1

The-Chart-Pattern-Trader-spy-weekly-chart-02-10-2010

Elliottwave point of view

The Second Weekly Chart has us in Minor Wave 1

Shankys-Charts-Weekly-SPX-Short-02-10-2010

Elliottwave point of view

The Daily Chart has us in Intermediate Wave 3

The-Chart-Pattern-Trader-spy-daily-02-10-2010

Elliottwave point of view

The 60 Minute Chart has us in Mini Wave 3

The-Chart-Pattern-Trader-spy-60-minute-02-10-2010

Elliottwave point of view

 The 15 Minute Chart has us in Micro Wave 3

 The-Chart-Pattern-Trader-spy-15-minute-02-10-2010

So, that means we now are starting down into (from the larger wave to the smaller wave) Wave 3,1,1,3,3,3... Whew!  That's a lot of 3's!  If you don't know how powerful wave 3's are, go do some research on it and you'll get the big picture.   I'll really be excited when they all turn into Wave 3's!  That should start this late September, and will truly be a "Once in a Lifetime" experience.

So what's up for tomorrow you ask, and why am I still holding my put spread?  Because I'm expecting a move down to at least 1020 to start as early as tomorrow.  I must admit that this has been a learning experience for me, as I'm only now starting to see how all this all ties together.  I didn't see that last week, and missed several important pieces to the puzzle.

That doesn't mean I'm going to get every call right... of course I can't do that.  But, as I learn more and more about how TA's, EW's, and news events... all tie together, I'll start getting much better entry points.  I wasn't able to see that last week, and missed out on all these smaller wave patterns developing.  I could have waited until today to go short, and would have been in a lot better position.

Now, my current position is underwater due to the time decay, and the small move up.  I purchased a 106/101 vertical put spread on Friday when the market was around 106 (spy), and now we've moved up a point, and lost 4 days of time.  I would have caved in and sold them for a lost a month ago, when I didn't understand the charts as well as I do today.  But not now, as the more I learn, the more patience I become.

Since I'm learning how to read these charts much better, I hope to get a whole lot better entry point in a couple of weeks, when Minor Wave 3 starts down.  Timing in this game is everything.  The TA's tell me which direction, and then I try to match the EW patterns up to match with that.  I believe it's easier now, as we have started a new trend down.  During the sideways market time periods, you had might as well throw EW out the window, and use only TA's.  But, for now, they are both lining up perfectly.

It's up to you to make your own decision as to "how to trade" this market of course, and I'm only showing you what I see.  I was wrong on calling Monday a big down day, and wrong again on Tuesday and Today.  This isn't easy you know... if it was, everyone would be rich.  I putting more and more pieces of the puzzle together, which should allow me to narrow down the exact time to get in short... at least for the next time I hope.

I do appreciate all you who visit, and I'm glad you have patience with me while I learn.  Study the charts above and come to your own conclusion.  Let me know what you see... as I see a big down move coming, starting tomorrow most likely.

If I didn't believe in what the charts tell me, I'd have already bailed on my position now.  In fact, a week ago I would have!  Why?  Because I've been studying my ass every day now for the last week, and I've learned a lot more about the market in that short time period then I learned in the last 6 months.  Whether I'm right or not, I don't know?  But, I feel like I'm able to assemble this puzzle much better today, as everything was scattered out in pieces months ago.

Anyway, I'm just rambling now.  Best of luck to all of us tomorrow... and a big thanks goes out from me to all the great chartists that I read regularly (and borrow their charts from them... hope they don't mind?)

Red

Got Fooled On That One…

235

I was really looking for the market to roll over hard today, and it looked like it was going too... until some news rumor was released that said they were going to bailout Greece.  That news was all the excuse the market needed to rally up to that 1080 level that I thought it could go too, but was highly unlikely.  The news said that Germany was going to bail them out, and then it was later reported as false.  Coincidence?  Maybe?  Or, maybe it was designed to shake out all the bears?

I really didn't think it had the energy left to rally up that high, but the market will fool you when you least expect it too.  This doesn't change my belief that we are going down... it only delays it for another day.  Looking at the chart below, you can see that we tagged the upper trendline around 1080, and we are now getting ready to start minor wave 3 down, inside larger/intermediate wave 3 down.

Tony-Caldaro-60-minute-SPY-chart-02-09-2010

Once it starts, it should fall quite fast, and not allow any bears to get short.  That's probably why they ran the tape up today too... to squeeze out all the bears, and suck in some more bulls.  I didn't see this move coming, or I would have waited for it.  Of course if I had seen it, they wouldn't have done it.  Just the way they like it... trick everyone.

From looking at the charts, it appears that they must start minor wave 3 down, (inside larger/intermediate wave 3) tomorrow, as they've hit their upper target zone now, and must either bust threw it, or fall hard.  There is no doubt that we are at a crossroads here, and either fall hard or rally hard.  I have too trust the charts, and they still point down.

That's why I remained short today, even though that ramp up put my positions underwater a little.  These wave 2 up's are always violent and are designed to shake out the bears.  I remain short, and un-shaken.  I still see this week as down, with a fore-casted low of 1020.  No one said trading was easy, and no one is always right.  I was wrong on Monday being a huge down day, and wrong again on today selling off.

Could I just be off a day or two?  I believe so, and hope so... Even though "hope" is a useless emotion, and shouldn't be brought into trading... I'm crossing my fingers on this one.  The thing that keeps me confident is the Technical Analysis.  It still is extremely bearish on many, many charts.

The fact that the market couldn't break through 1080 was huge, as that resistance held firm.  There are 3 different trend lines intersecting at that level.  It's going to have too gap above it to break through it.  That means some commitment on the bulls, and I just don't see it.  The volume going up was so low, it wasn't hardly reading on my charts, yet the sell off volume was huge.

That tells me that retail traders bought the Greece rumor and drove up the market, and big intitutions sold it.  I'm not buying into this rally.  It may seem like I'm being stubborn, but I'm not.  I'm just sticking to my belief in what I see in the charts... which is bearish still.

As you may know, I use a lot of different ways to see where the market is going.  I use Technical Analysis, Elliottwave, Support and Resistance Levels, and tie all those together with news events.  They all still tell me we are going down.  Right or wrong, I stick with my forecast.  I remain short.

Red

Could War In Yeman Crash The Stock Market?

1,725

On Friday I overlooked the 60 minute chart, which threw the Black Monday off by a day (that's assuming it falls hard tomorrow, as I'm expecting it too?).  Yes, it did go down today, but the larger down day should be tomorrow.  It took most of the morning for the 60 minute chart to rise back up and then start to roll back over to the down side.

This formed our minor wave 2 up, inside larger/intermediate wave 3 down.  For tomorrow we have the Monthly, Weekly, Daily, 60 Minute, and 15 Minute charts ALL Point Down!  If this market doesn't sell off at least 200 points on the Dow... I'd be shocked!  I'm really expecting a 300-400 point sell off... a Black Tuesday instead!  I should have seen that on Friday, but I review so much material that I just missed it.  Arrrggh!

So, I got in a little early, but I'll still profit handsomely as the next move down occurs.   Here's a chart of where we are now, and what I'm expecting...

Tony-Caldaro-60-minute-SPY-chart-02-08-2010

It looks like we just completed minor wave 2 up, inside larger/intermediate wave 3, and are ready to start going down hard tomorrow.  While it is possible that minor wave 2 up isn't done yet, as it could make an ABC move up to 1080 or so, I don't believe it will.

The only thing that could delay the move down is that the market could be waiting for the job's number on Thursday.  But, I really doubt that they are going to rally up into Thursday number's.  Instead, they fear bad numbers, so they would sell off before hand.

The charts are saying that we have a 300-400 point drop tomorrow, but I don't like to call out number's... only that the odds of a big down day is quite high.  Doing the charts, and looking at the wave count, it goes like this...

  • We are most likely in Primary Wave 3 down with 1150 being the final high from the March, 2009 low of 666.
  • We are also in Major Wave 1 down from the 1150 high, and it should end at the fore-casted low around 980 this week.  (This assumes that Major Wave 1 will only have 3 intermediate wave in it, not 5 waves... which it could have?).
  • We are still in intermediate wave 3 that started at 1105 and should again complete around 980 (that's a forecast-ed projection level, and it could be wrong?)
  • Finally, we just completed Minor Wave 2 up, inside intermediate wave 3 down... or we are still in Minor Wave 2 up, and it's going to make an ABC move up to 1080.  NOT Likely, but possible.  If so, then we will have to defy gravity and roll the 60 minute, and 15 minutes charts back up quickly tomorrow morning.  I don't see it happening.

So, from looking at the charts, counting EW's, finding support and resistance levels, and tracking the MACD's on all the charts... they all point to a large down day tomorrow!  Could it be "Black Tuesday", instead of Monday?  Possible I guess?

Let's look for news that can cause the event to happen.  MobyDoc just posted this link on my weekend post.  It's talks of another terrorist attack on the 11th, or something bad?  When the market reads this news, are they going to rally until Thursday to see if it happens, or sell like a bat outta hell before they get caught long?  I think you know the answer to that...

http://www.foxnews.com/story/0,2933,585143,00.html?test=latestnews

http://english.aljazeera.net/news/middleeast/2010/02/20102905431956447.html

I've spoken about the "False Flag" events on my weekend post.... in the comment sections.  I'm going to post a video here for you to watch.  It's a long video, but well worth your time.... as we don't have a lot left.  I know that some of you might find it hard to believe in Aliens and stuff... but it's all real, and what happens affect the stock market.

There is now hundred of ships off the coast of Yeman.  They are from every nation in the world that has a Navy.  What are they doing there you ask?  There is a Huge Stargate (yes, like on the TV show) under the sea that is opening and the world elite is worried about it, and are most likely trying to stop it.  Supposedly it is going to render all the world's weapons worthless, and not able to work anymore.

Of course the world elite don't want that to happen as that would make everyone in the world equal, and they couldn't use us as their personal slaves anymore.  No more money needed, as the world goes through a positive transformation.  This is a good thing... for everyone who is honest and good, but a bad thing for the evil people who run the planet.

We are about to go through a wonderful transformation on, or around December 21st, 2012.  Call it Heaven for us good people, and Hell for those bad people.  Your religion isn't important, only what kind of person you really are "on the inside" is what's really important.

So, how do you keep the people away from the Gulf of Aden, (which is right off the coast of Yeman)... you stage another terrorist attack, which are better known as "False Flags". Read this...

http://www.reuters.com/article/idUSTRE6173II20100208

It keeps every one away while you all work to stop the Stargate from opening, or try to control it some how?  What they don't understand, is that the ending story was already written in the Bible... and the good guys win, the crooked banksters, gangsters, thugs, Illuminati, or whatever you what to call them... LOSE!

Of course they need to pay for the next staged war that we are going into, and how do you do that?  Crash the stock market of course.  Still think I'm nuts?  Again, when is a conspiracy NOT a conspiracy?  When it's true of course...

Here's on more interesting video for you... (by the way Goldman Sachs and the Carlyle group are co-owners of Kinder Morgan)

Are you starting to put the pieces together yet?

Red

Weekend Update…

81

 wallsteet-attacked-by-godzilla

Wall Street is Coming under attack!  Job losses, fake earnings, corporations defaulting on debt, bailout's for the rich, housing markets underwater... all spell a CRASH Coming!  After all, how else can you paid off your debt... just wipe them out instead..."That's How"!

If you think that this is just another 10% correction, and that it's now over... you're dead wrong!  It hasn't even started yet!  Want the evidence?  I'll direct you to the 3 charts below (found on Shanky's Charts... link on my Blogroll)...

Daily Chart

Shankys-Charts-Daily-SPX -02-07-2010

Weekly Chart

Shankys-Charts-Weekly-SPX-02-07-2010

Monthly Chart

Shankys-Charts-Monthly-SPX-02-07-2010

So, could Monday be a "Black Monday"?  I don't know?  But the rest of the week isn't looking good.  Wherever we peak on Monday (1070-1080... or maybe we already completed minor wave 2 up?), the selling to come after that will be huge.  It will be a minor wave 3 inside a larger wave 3... both inside Primary wave 3 (or C).  It's going to be scary from here on out.  At some point there will be "Panic Selling"... and I might not even want to make a daily post during those times?

Although I didn't create this bubble, I really don't want to be the center of an attention.  As a matter of fact, I never created this blog to gain a following... only to post my thoughts.  I don't use any type of marketing or even any other type of blog optimization technique's.  I really don't want any traffic to the site.  But apparently I have quite a few people reading it daily... that don't comment (which is fine).

I'm just looking to make enough money to retire on, and then relax and enjoy life a little.  So, if my daily posts become weekly posts... you'll know why.  (Not saying that I'll stop posting... only that I might take some time off at some point).

Moving on...

Tony-Caldaro-60-minute-SPY-chart-02-07-2010

Here's what I see for next week... Monday should have the continuation of minor wave 2 up, inside of larger wave 3 down.  When that ends, probably by midday Monday (but it could go into Tuesday?), the minor wave 3 down inside of larger wave 3 down will start.  I think we will bounce on the 200dma (daily chart) around 1020, and come back up for minor wave 4 (still inside larger wave 3 down), and have another push down later in the week for minor wave 5 down (possible target... the 50ma on the weekly charts, about 980).

Remember, the 1000 level is important to the bulls, and a break of it would have the bears jumping on the short side faster then you can blink an eye!  Then once all the bulls have sold out and the bears are on the short side... Bam!  ...here come the buy programs to rally us back up for Larger Wave 4!  How high?  I don't know?  But, it will probably be in line with option expiration on the 19th.

That's what I'd do if I were them

Red

P.S.  Keep in mind folks... nothing is written in stone.  This is only a forecast of the possible moves coming.  If the government comes into the market again, with a "Stimulus Package Number Two"... it all changes.  But for now, I believe they won't do that.  Not until the banks get done unloading their shares (a few months?).  Then they will come to the rescue again.

"Lather, Rinse... and Repeat"

Black Monday?

227

black-monday

Look out for next week... we're about to start a large wave 3 move down!  Destination... Unknown?  Monday is an "iffy" day, as we are now in a smaller wave 2 up inside of a larger wave 3 down.  So, it might not rollover until Tuesday, (but I created the image above just in case it does... as I thought it was cool looking).  I'll have more on my weekend update, but for now we bears might have to endure a small amount of pain while the tape pushes up to 1080 or so Monday morning.

That's about as high as I can possibly see it getting.  Honestly though... I don't think it will even come close.  We very well could drop Monday afternoon and not stop until we hit 1020 or so.  I waited all day for a chance to get in short and the tape looked so weak that I didn't think I'd have a chance to.  So, I got in around 1pm and the rally in the afternoon (unexpected... of course) put me a little in the negative on the position.

But, I'd already planned to hold it until OPX if necessary.  It's a 106/101 SPY put spread.  That means I bought the 106 and sold the 101.  When we hit the 102 area (not "IF", but "WHEN"), I'll get out and wait for a bounce to occur.  About 102.50 is where the 200dma is on the daily charts.  That should give the market a couple of days of a bounce, before more selling happens.  We could hit that level Monday if people start to panic in the afternoon?  Who knows?  It should be there before the week ends though... so don't panic!  Stay short!  We have lots more downside to come.

As for the bounce from the 102 area, I don't know yet if I'll play it back up or not, as it's too dangerous to go long right now.  I might take a small position, or just wait for it to peak and go short again.  We'll see when will cross that road.

Red

P.S. I know that it might seem like you have missed the big move and it's going to rally back on you... well stop thinking like that and relax!  The Monthly, Weekly, and Daily chart's are all rolling over.  Were going down to the low 900's... before the March expiration most likely.  Hang tight, the drop hasn't started yet!

Did Someone Press The Panic Button?

147

panicbutton

Holy Cow!  Did Wall Street hit the panic button today?  They sure fooled me on this one, as I didn't see such a huge sell off coming so soon.  I was stuck sitting in cash on this move.  Bummer!  This changes the game plan completely of course.  Yes, the turn date for Monday or Tuesday is still valid, but it looks like it started early.

If you are all ready short... stay!  If this caught you by surprise like it did me... pray for a bounce!  I was looking for a little bit of selling today, but mainly a flat day before one final move higher.  But, at least I wasn't long the market... man that would be painful.

Ok, moving on...

I see 2 different possibilities for tomorrow.  One is... A little more selling in the morning as the late-comers' sell on the news.  Then the big boys should step up and rally the rest of the day.  I don't mean a big rally by any means... only a small up to close the day positive.Two is... The numbers tomorrow isn't as bad as the market thought (government gets out their erasers), and we gap up a little and rally early on, and sell off into the afternoon.  Either way, I'm looking to get short.  The consolidation area that formed today was in the 107.25-107.50 spy level.  That will be hard to go through, and I might go short there?  The next level of resistance is around 108.30-108.35, as should be about as high as I can see the market getting.  I'll definitely be going short there.

Tony-Caldaro-60-minute-SPY-chart-02-04-2010

Either way it plays out, this would produce a smaller wave 2 up inside a larger wave 3 down.  That means that Monday (or possibly Tuesday) would have a smaller wave 3 inside a larger wave 3 coming!

If that happens... look out below!  We are going down hard and fast!  Wave 3's are the most powerful waves and when you have one wave 3 inside another wave 3... you've got a hurricane coming!  Now understand that we might not get a bounce tomorrow?  You know how they kept all the bears (and late bulls) from going long during the rally from last March.  It was almost straight up with no pullbacks to go long on.

Well, don't you think they will do the same thing on the way down?  Of course they will!  Any bounces are going to be small and won't last long.  I'd be shocked to see a 38.2% retrace from today's sell off.  I think we'll be lucky to get 23.2%.

Regardless of how high the bounce is (if there is one?) I'll go short tomorrow into next week.  I really expect it to be ugly.  All of next week should be down, with very little chances of getting short again.  We are rolling down on the daily charts now, the weekly charts, and the monthly charts.  It's not looking good for the bulls.  We will have some bounces along the way, but I'm expecting selling into March.

What I'm doing is simple... I getting short tomorrow on any bounce higher (with those targets mentioned above in mind).  Whether it coming in the morning, (which is possible), or in the evening, I'll be getting short and holding through all of next week, and maybe into option expiration?  It depends on how fast it falls and the key support levels it hits.  When it hits heavy support, I'll go to cash, wait for the bounce, and re-enter short for a continued fall into March.

Some of you might want to ride it out, but I swing trade and will be getting in and out when support levels are tagged.  This huge down day certainly has come as a big surprise to me, and to many others too.  That's exactly how they like to play it... catch everyone off guard!

Good Luck Everyone...

Red

Waiting For The Jobs Numbers…

206

The market went basically flat today, closing slightly lower.  This was the consolidation day that I was looking for yesterday.  So, I was off a day... nobody's perfect I guess.  Regardless, I'm looking for the swing trade play, and I'm just sitting in cash for now.

I think tomorrow could be another consolidation day, just like today.  Slightly up or down, but no big move yet.  Everyone seems to be waiting on the jobs numbers on Friday.  I think it will fool everyone and be viewed as positive... which will push the market higher again.

I'm really looking for a move to 112.00 spy or better.  I'd love for it to reach 113.00, which was the major lower level of support during the 2 week battle between the bulls and bears, while inside a sideways channel.  The 115.14 was the high, and the low was just a hair above 113.00 (spy).

The ideal plan to happen is for the market to pullback a little tomorrow and then rally one more time on the fake jobs numbers Friday, as you know the government is going to lie again.  Let's just hope they do a good job of it this time.

Here a chart of what I'm looking for...

The-Chart-Pattern-Trader-spy-daily-02-03-2010

The trades you decide to take shouldn't be based on what I'm taking.  I'm very confident of this wave 3 down coming, and that's why my risk tolerance is high.  Buying short term February puts could make you a ton of money or you could lose it all too?  My indicators tell me it's going to fall, so I'll be taking higher risks.  Choose wisely....

Red

The Bulls Are Running Again…

144

bull-run

Look out bears, the bulls are back!  NOT!  I don't believe that for one minute.  This is simply the larger wave 2 up that follows the wave 1.  We are still on track for larger wave 3 to start down next Monday or Tuesday.  I was wrong about today being a flat consolidation day, as the bulls just kept on charging.  That's fine with me as I'm not short anything right now.  (Still in my USO long though).

I can't really see tomorrow continuing to rally without a pause day, but it could.  A slight pullback, and then another move higher on Thursday or Friday is the logical thing to do... but who's says the market is logical?  Regardless, I swing trade, so I'm just waiting for the short term indicators to start too rollover again.

I'm still thinking that they will surprise everyone on the job's numbers Friday.  Of course I could be wrong, and they start to sell off after they are released, but my gut tells me that every trader already knows that the numbers are horrible.  With low expectations like that, it wouldn't be too hard to beat them.  Plus, they have a habit of tricking the bears a lot too.  Never under estimate the government.  They will fool you every time.

So hang tight everyone... our time is close now!

Red

P.S. I'll be buying straight puts on the SPY on Friday or Monday.  It depends on how high we go, as to which strike price I'm going to buy.  I'll be looking to buy February puts, as the move down should fall into this coming expiration on the 19th.  Everyones' risk tolerance is different (mine is quite high), but I'm looking for a strike price that is "out of the money" by about 2 points from the high.

So, for example... if we hit 112.00 on the spy by Friday, then I'll be buying the 110.00 strike price.  If we are lucky enough to hit 114.00, then I'll be buying the 112.00 strike price.  Remember, I'm looking for about a 100 point move down before option expiration.  That's a 10 point move on the SPY.  That's a HUGE move folks!  You could make 5 times your money in a 2 week period... or you could lose it all?  It all depends on what the market does, and I believe it's going to crash.  What do you believe?

s2Member®