
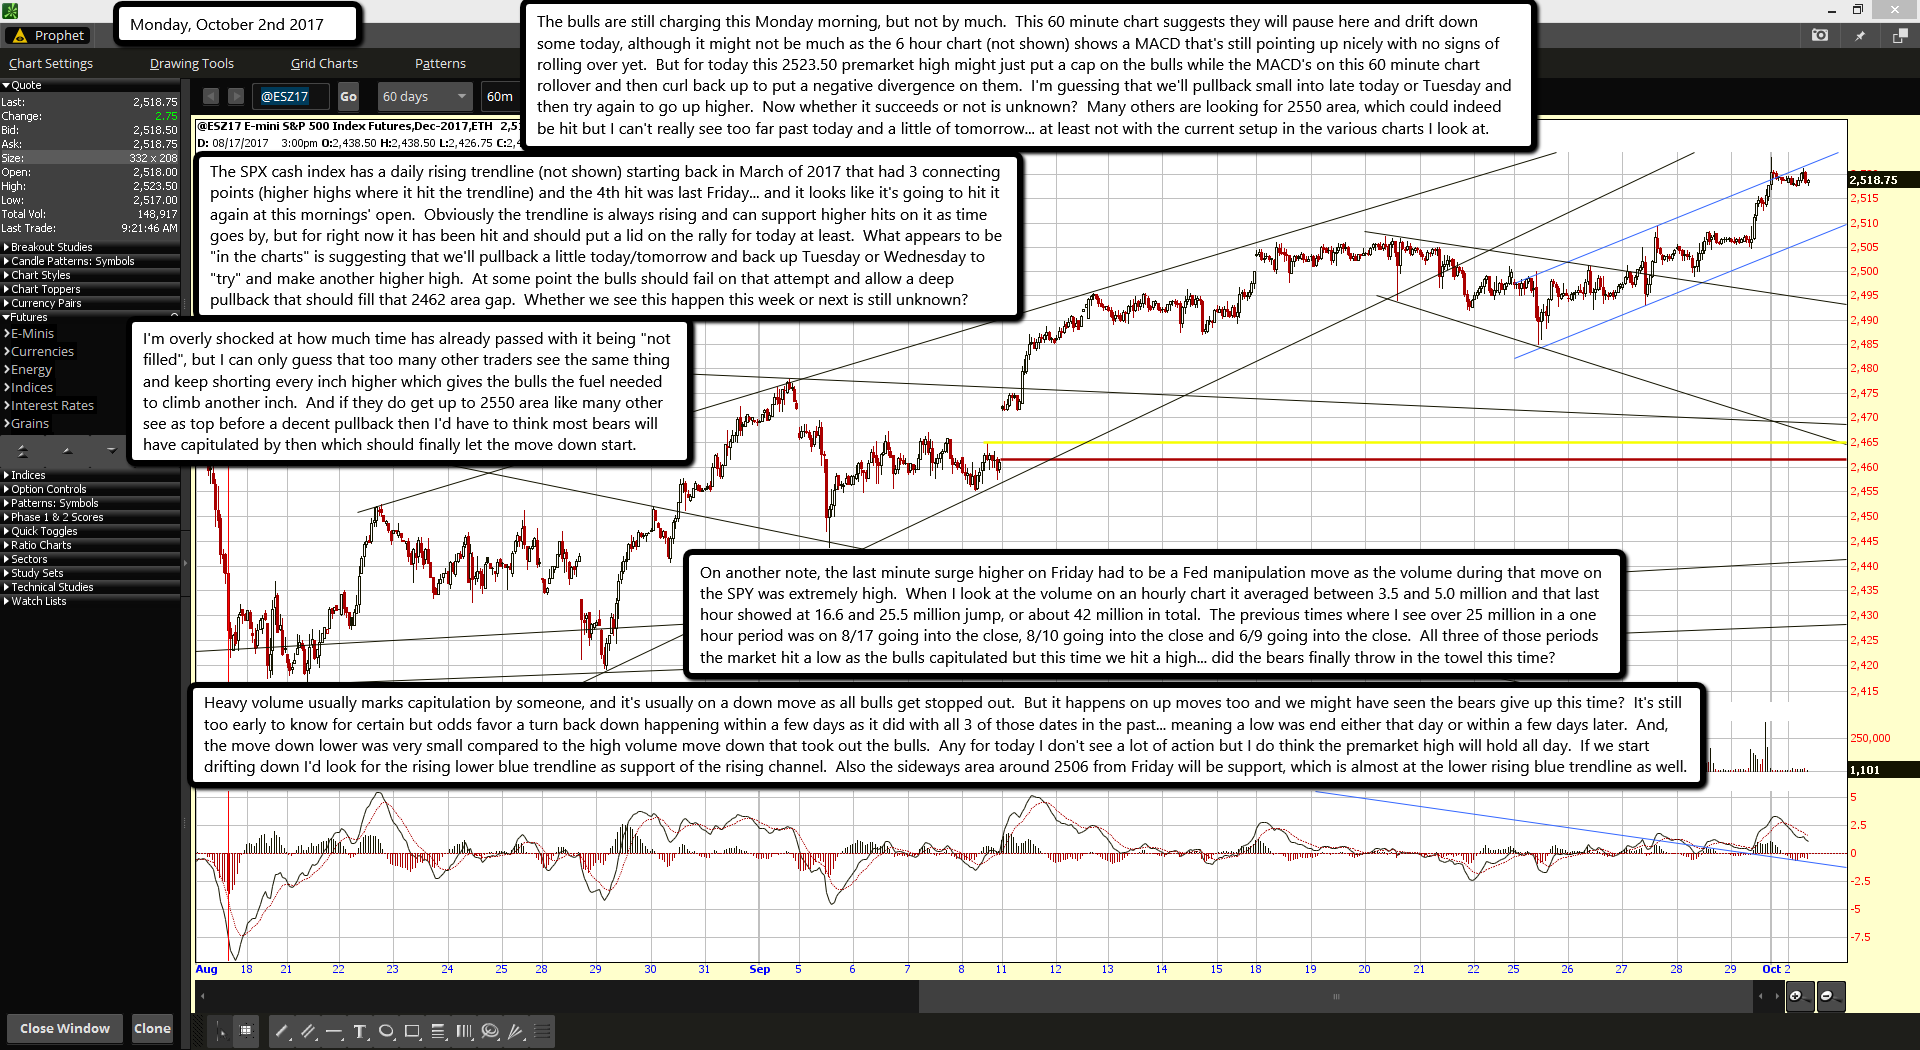
The bulls are still charging this Monday morning, but not by much. This 60 minute chart suggests they will pause here and drift down some today, although it might not be much as the 6 hour chart (not shown) shows a MACD that's still pointing up nicely with no signs of rolling over yet. But for today this 2523.50 premarket high might just put a cap on the bulls while the MACD's on this 60 minute chart rollover and then curl back up to put a negative divergence on them. I'm guessing that we'll pullback small into late today or Tuesday and then try again to go up higher. Now whether it succeeds or not is unknown? Many others are looking for 2550 area, which could indeed be hit but I can't really see too far past today and a little of tomorrow... at least not with the current setup in the various charts I look at.
The SPX cash index has a daily rising trendline (not shown) starting back in March of 2017 that had 3 connecting points (higher highs where it hit the trendline) and the 4th hit was last Friday... and it looks like it's going to hit it again at this mornings' open. Obviously the trendline is always rising and can support higher hits on it as time goes by, but for right now it has been hit and should put a lid on the rally for today at least. What appears to be "in the charts" is suggesting that we'll pullback a little today/tomorrow and back up Tuesday or Wednesday to "try" and make another higher high. At some point the bulls should fail on that attempt and allow a deep pullback that should fill that 2462 area gap. Whether we see this happen this week or next is still unknown?
I'm overly shocked at how much time has already passed with it being "not filled", but I can only guess that too many other traders see the same thing and keep shorting every inch higher which gives the bulls the fuel needed to climb another inch. And if they do get up to 2550 area like many other see as top before a decent pullback then I'd have to think most bears will have capitulated by then which should finally let the move down start.
On another note, the last minute surge higher on Friday had to be a Fed manipulation move as the volume during that move on the SPY was extremely high. When I look at the volume on an hourly chart it averaged between 3.5 and 5.0 million and that last hour showed at 16.6 and 25.5 million jump, or about 42 million in total. The previous times where I see over 25 million in a one hour period was on 8/17 going into the close, 8/10 going into the close and 6/9 going into the close. All three of those periods the market hit a low as the bulls capitulated but this time we hit a high... did the bears finally throw in the towel this time?
Heavy volume usually marks capitulation by someone, and it's usually on a down move as all bulls get stopped out. But it happens on up moves too and we might have seen the bears give up this time? It's still too early to know for certain but odds favor a turn back down happening within a few days as it did with all 3 of those dates in the past... meaning a low was end either that day or within a few days later. And, the move down lower was very small compared to the high volume move down that took out the bulls. Any for today I don't see a lot of action but I do think the premarket high will hold all day. If we start drifting down I'd look for the rising lower blue trendline as support of the rising channel. Also the sideways area around 2506 from Friday will be support, which is almost at the lower rising blue trendline as well.

