
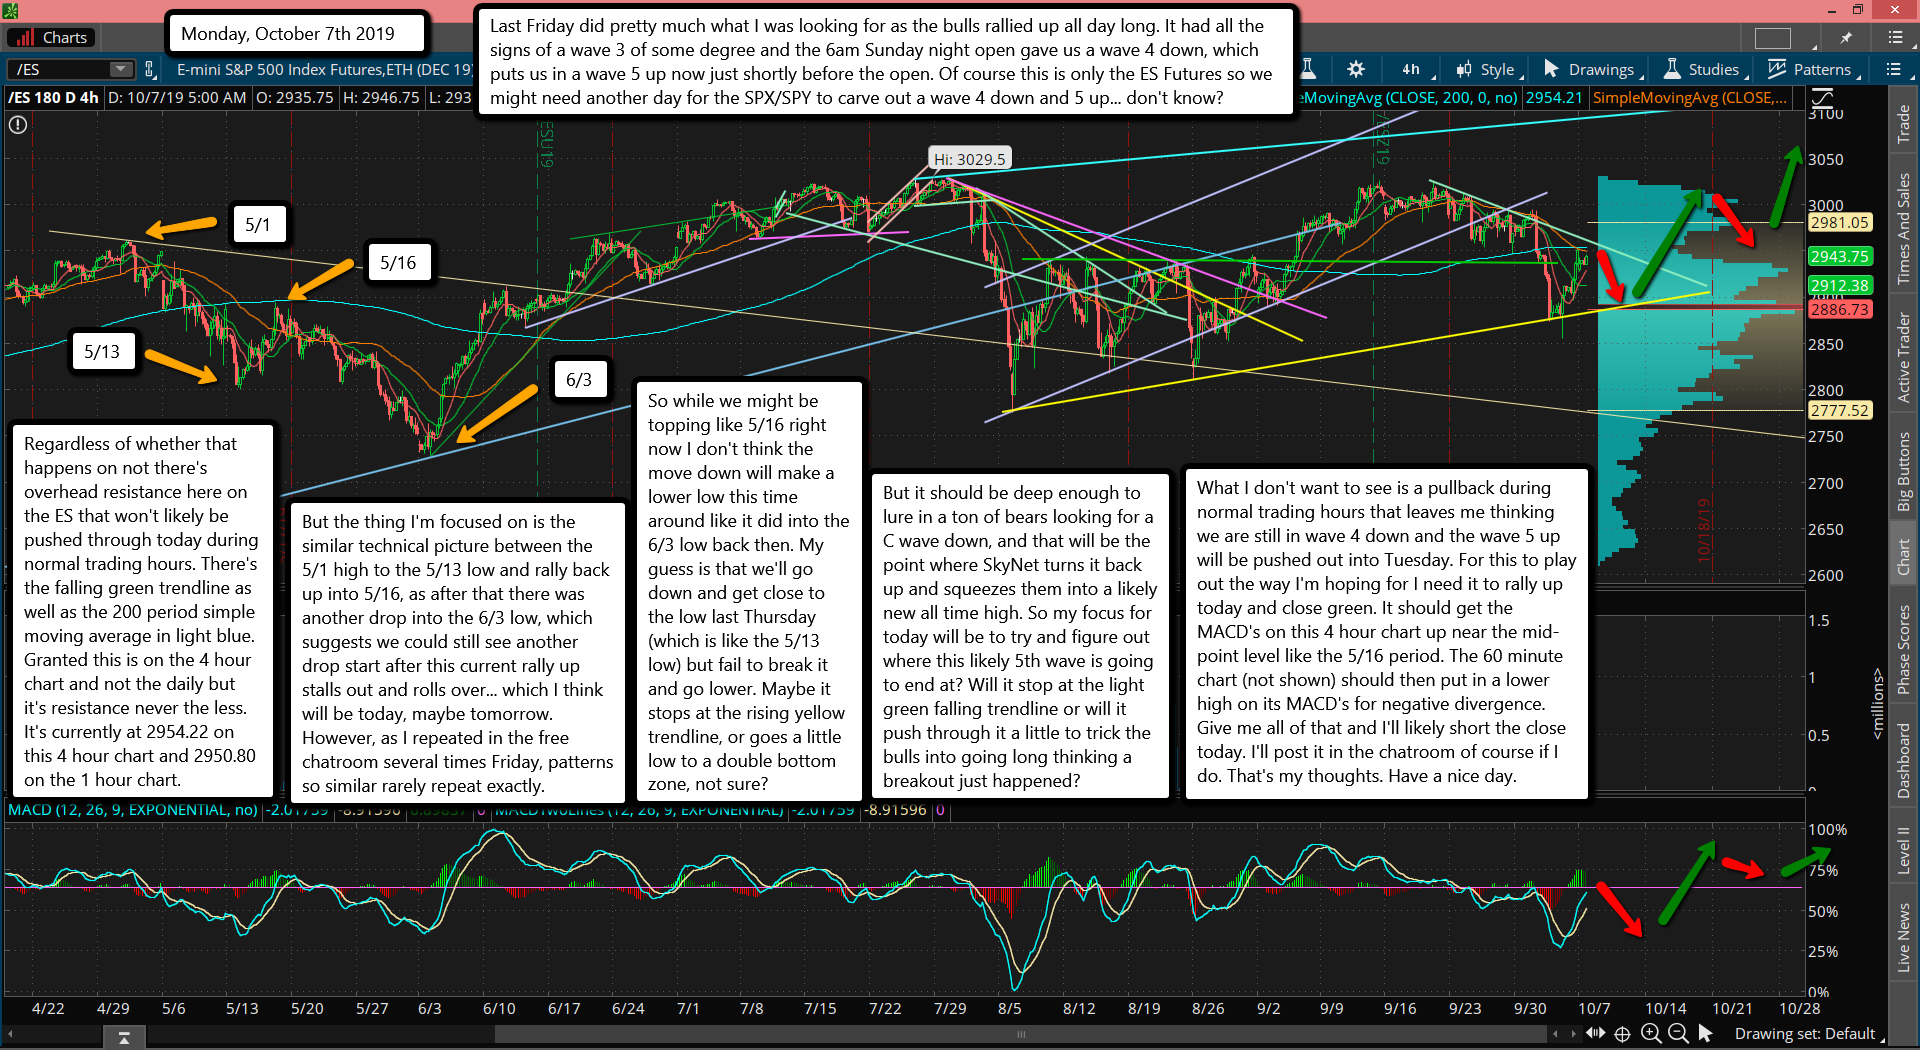
Last Friday did pretty much what I was looking for as the bulls rallied up all day long. It had all the signs of a wave 3 of some degree and the 6am Sunday night open gave us a wave 4 down, which puts us in a wave 5 up now just shortly before the open. Of course this is only the ES Futures so we might need another day for the SPX/SPY to carve out a wave 4 down and 5 up... don't know?
Regardless of whether that happens on not there's overhead resistance here on the ES that won't likely be pushed through today during normal trading hours. There's the falling green trendline as well as the 200 period simple moving average in light blue. Granted this is on the 4 hour chart and not the daily but it's resistance never the less. It's currently at 2954.22 on this 4 hour chart and 2950.80 on the 1 hour chart.
But the thing I'm focused on is the similar technical picture between the 5/1 high to the 5/13 low and rally back up into 5/16, as after that there was another drop into the 6/3 low, which suggests we could still see another drop start after this current rally up stalls out and rolls over... which I think will be today, maybe tomorrow. However, as I repeated in the free chatroom several times Friday, patterns so similar rarely repeat exactly.
So while we might be topping like 5/16 right now I don't think the move down will make a lower low this time around like it did into the 6/3 low back then. My guess is that we'll go down and get close to the low last Thursday (which is like the 5/13 low) but fail to break it and go lower. Maybe it stops at the rising yellow trendline, or goes a little low to a double bottom zone, not sure?
But it should be deep enough to lure in a ton of bears looking for a C wave down, and that will be the point where SkyNet turns it back up and squeezes them into a likely new all time high. So my focus for today will be to try and figure out where this likely 5th wave is going to end at? Will it stop at the light green falling trendline or will it push through it a little to trick the bulls into going long thinking a breakout just happened?
What I don't want to see is a pullback during normal trading hours that leaves me thinking we are still in wave 4 down and the wave 5 up will be pushed out into Tuesday. For this to play out the way I'm hoping for I need it to rally up today and close green. It should get the MACD's on this 4 hour chart up near the mid-point level like the 5/16 period. The 60 minute chart (not shown) should then put in a lower high on its MACD's for negative divergence. Give me all of that and I'll likely short the close today. I'll post it in the chatroom of course if I do. That's my thoughts. Have a nice day.

