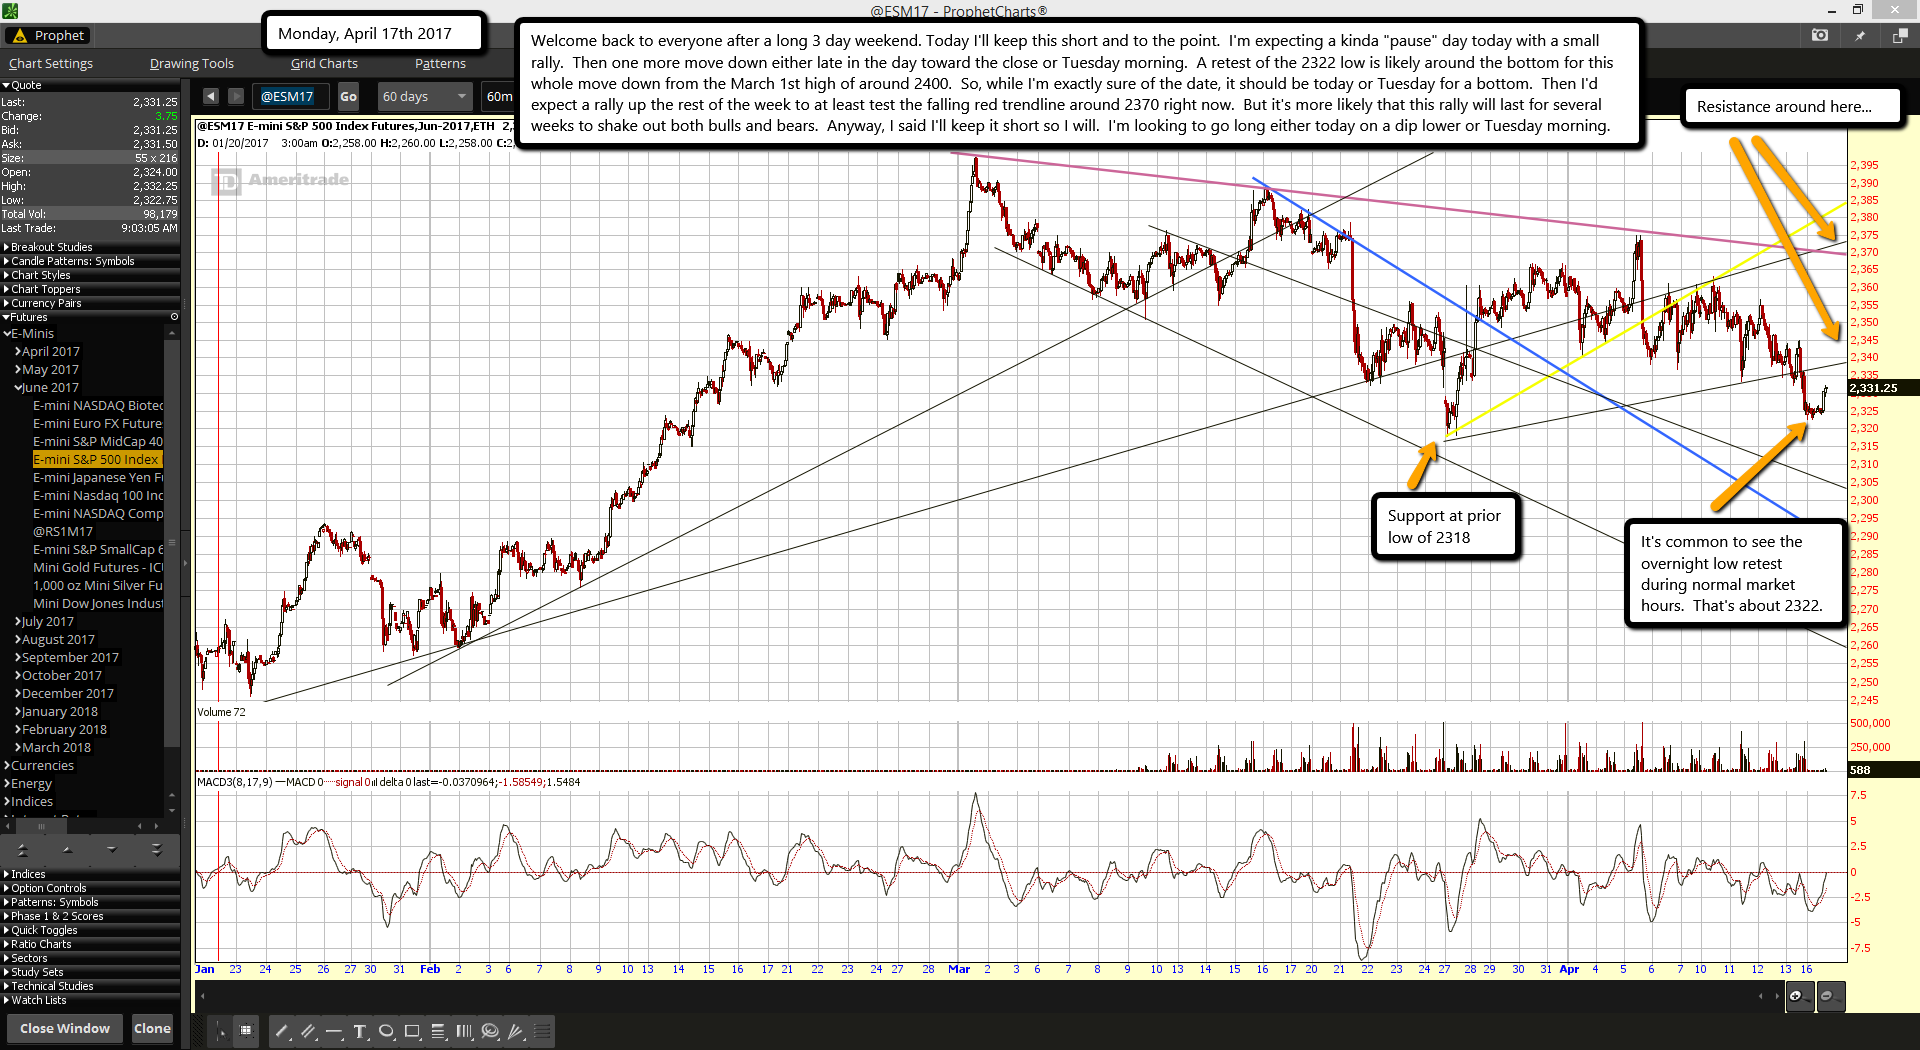
Welcome back to everyone after a long 3 day weekend. Today I'll keep this short and to the point. I'm expecting a kinda "pause" day today with a small rally. Then one more move down either late in the day toward the close or Tuesday morning. A retest of the 2322 low is likely around the bottom for this whole move down from the March 1st high of around 2400. So, while I'm exactly sure of the date, it should be today or Tuesday for a bottom. Then I'd expect a rally up the rest of the week to at least test the falling red trendline around 2370 right now. But it's more likely that this rally will last for several weeks to shake out both bulls and bears. Anyway, I said I'll keep it short so I will. I'm looking to go long either today on a dip lower or Tuesday morning.
ES Morning Update April 13th 2017
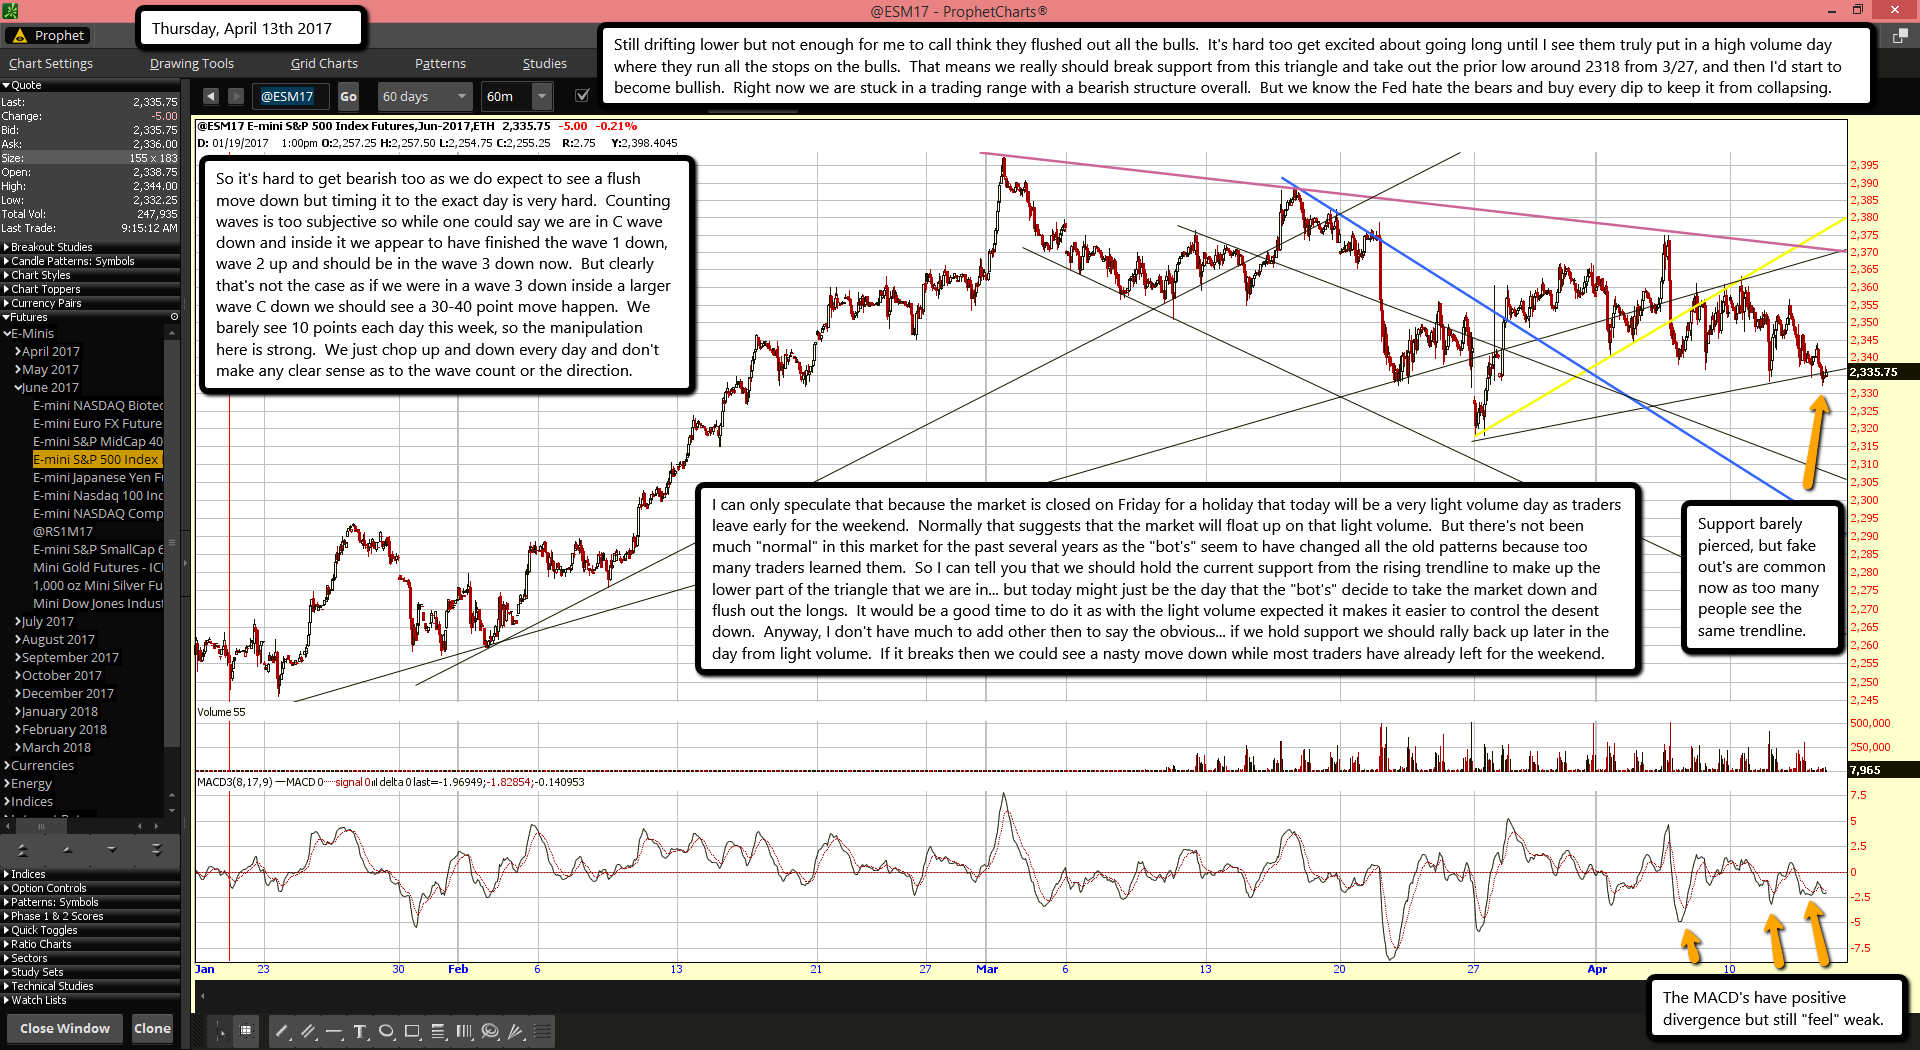
Still drifting lower but not enough for me to call think they flushed out all the bulls. It's hard too get excited about going long until I see them truly put in a high volume day where they run all the stops on the bulls. That means we really should break support from this triangle and take out the prior low around 2318 from 3/27, and then I'd start to become bullish. Right now we are stuck in a trading range with a bearish structure overall. But we know the Fed hate the bears and buy every dip to keep it from collapsing.
So it's hard to get bearish too as we do expect to see a flush move down but timing it to the exact day is very hard. Counting waves is too subjective so while one could say we are in C wave down and inside it we appear to have finished the wave 1 down, wave 2 up and should be in the wave 3 down now. But clearly that's not the case as if we were in a wave 3 down inside a larger wave C down we should see a 30-40 point move happen. We barely see 10 points each day this week, so the manipulation here is strong. We just chop up and down every day and don't make any clear sense as to the wave count or the direction.
I can only speculate that because the market is closed on Friday for a holiday that today will be a very light volume day as traders leave early for the weekend. Normally that suggests that the market will float up on that light volume. But there's not been much "normal" in this market for the past several years as the "bot's" seem to have changed all the old patterns because too many traders learned them. So I can tell you that we should hold the current support from the rising trendline to make up the lower part of the triangle that we are in... but today might just be the day that the "bot's" decide to take the market down and flush out the longs. It would be a good time to do it as with the light volume expected it makes it easier to control the desent down. Anyway, I don't have much to add other then to say the obvious... if we hold support we should rally back up later in the day from light volume. If it breaks then we could see a nasty move down while most traders have already left for the weekend.
ES Morning Update April 12th 2017
As told everyone in the chatroom yesterday I missed the morning update because I had to be at the hospital for my Aunt Betsy at 6:15am and didn't make it back in time before the market opened. They did not end up doing surgery on her as putting the stents in her right leg was too risky. She's got no blood flow to her leg and is in danger of losing the leg completely over time if something isn't done to restore blood. But she's only 70 pounds in weight and is just too tiny for the doctor to feel safe about surgery. She's my mother's sister and as you all know I lost my mother to a stroke last November and my dad before that in March. It's been a rough year or so as everyone expected Betsy to not make it as long as she has because she spent about 6 months last year between the hospital and the nursing home. Then no one saw my mother dying with a stroke as she was in pretty good health for 75 years old.
Anyway, sorry to get off subject but all the time you've seen me "not post" over the last year has been due to various family issues. I rarely even trade anymore as I have more then enough money to take a long time off and not worry about trading to make a living. But I still enjoy doing the morning post and chatting we people I've got to know over time. However, for my own trading I've been too distracted with my other more important project I'm working on with several partners. And that is the purchase of an OTC company. I'll be a partner in it and I'm extremely excited about it's future. It has a copper mine with a Billion Dollars of reserve in it and with the stock market expected to be in it's final 5th wave up the crash to follow in 2018/2019 should send all metals through the roof. So I fully expect this to be my retirement as while I have more then enough money to live for a long time right now it's not enough to completely retire on. This company will be though... and I fully expect to see in soar many multiples of times over the opening price after all the paperwork is complete. But of course I'll keep following the stock market and doing the posts for as long as I enjoy them. Just expect me to take some vacation time at some point... LOL!
Ok, back to the market. I'm still expecting another move down but right now we seem pretty rangebound in a triangle, and with Friday being a holiday and the markets closed it's doubtful if we'll see any breakdown of the triangle. In fact I'd expect some light volume float higher tomorrow... especially if we close down today. Overall we are building positive divergence on the MACD's here going all the way back to the 21st, but there's NOT been any real "Flush Out" to the downside yet and that makes me leery of expecting any rally to new all time highs again. Can we get up to the 2370 area where the two trendlines of resistance are currently meeting? Sure, but I wouldn't expect to see it busted unless we get that lower low first. This only applies for today and tomorrow, but if they continue this sideways chop into late next week then at that point the charts could be reset enough to bust up to new all time highs. It's all about "time" as the longer we chop in this range the less bearish it becomes and more bullish. The bears must attack soon or risk losing the overbought charts, because as time goes by the charts will become neutral and eventually they will be oversold. Anyway, I don't see any good setup today but if we drift down to touch the rising trendline of support on the triangle (about 2335 now) then it's likely a good long for Thursday.
ES Morning Update April 10th 2017
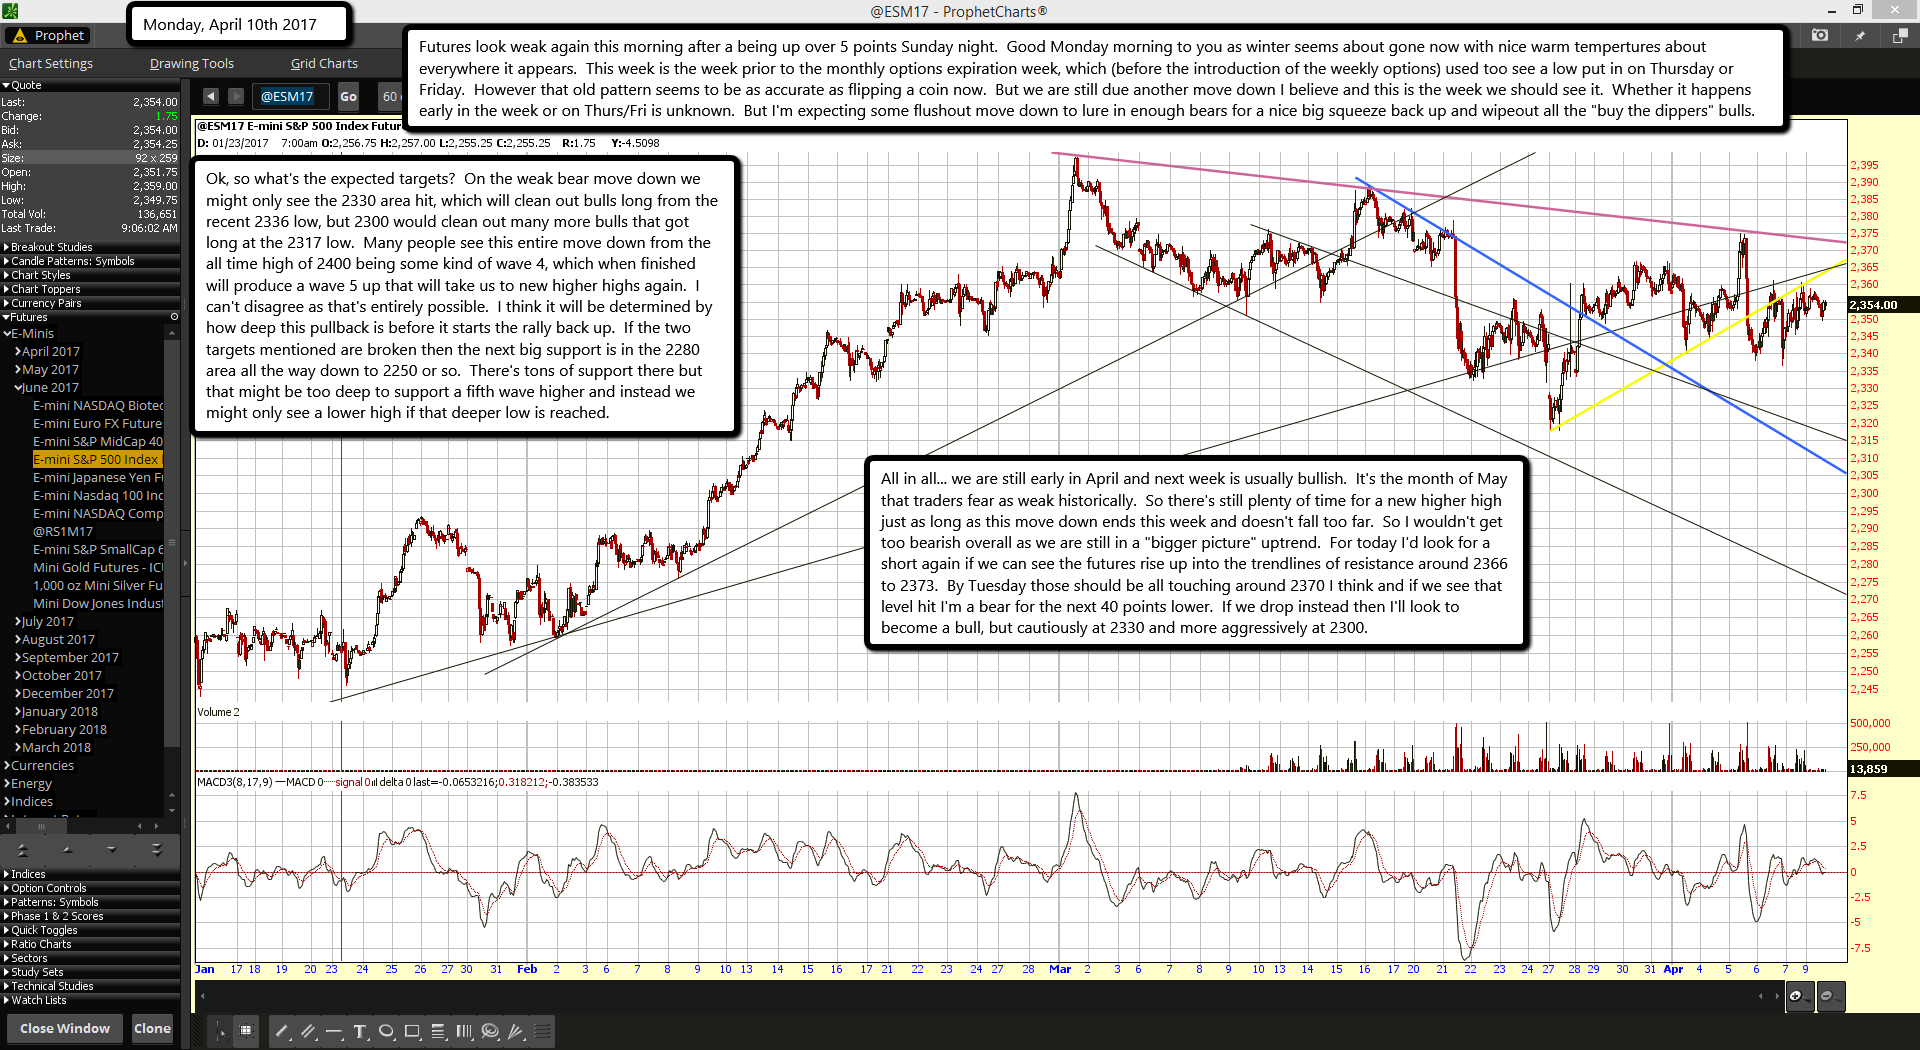
Futures look weak again this morning after a being up over 5 points Sunday night. Good Monday morning to you as winter seems about gone now with nice warm temperatures about everywhere it appears. This week is the week prior to the monthly options expiration week, which (before the introduction of the weekly options) used too see a low put in on Thursday or Friday. However that old pattern seems to be as accurate as flipping a coin now. But we are still due another move down I believe and this is the week we should see it. Whether it happens early in the week or on Thurs/Fri is unknown. But I'm expecting some flushout move down to lure in enough bears for a nice big squeeze back up and wipeout all the "buy the dippers" bulls.
Ok, so what's the expected targets? On the weak bear move down we might only see the 2330 area hit, which will clean out bulls long from the recent 2336 low, but 2300 would clean out many more bulls that got long at the 2317 low. Many people see this entire move down from the all time high of 2400 being some kind of wave 4, which when finished will produce a wave 5 up that will take us to new higher highs again. I can't disagree as that's entirely possible. I think it will be determined by how deep this pullback is before it starts the rally back up. If the two targets mentioned are broken then the next big support is in the 2280 area all the way down to 2250 or so. There's tons of support there but that might be too deep to support a fifth wave higher and instead we might only see a lower high if that deeper low is reached.
All in all... we are still early in April and next week is usually bullish. It's the month of May that traders fear as weak historically. So there's still plenty of time for a new higher high just as long as this move down ends this week and doesn't fall too far. So I wouldn't get too bearish overall as we are still in a "bigger picture" uptrend. For today I'd look for a short again if we can see the futures rise up into the trendlines of resistance around 2366 to 2373. By Tuesday those should be all touching around 2370 I think and if we see that level hit I'm a bear for the next 40 points lower. If we drop instead then I'll look to become a bull, but cautiously at 2330 and more aggressively at 2300.
ES Morning Update April 7th 2017
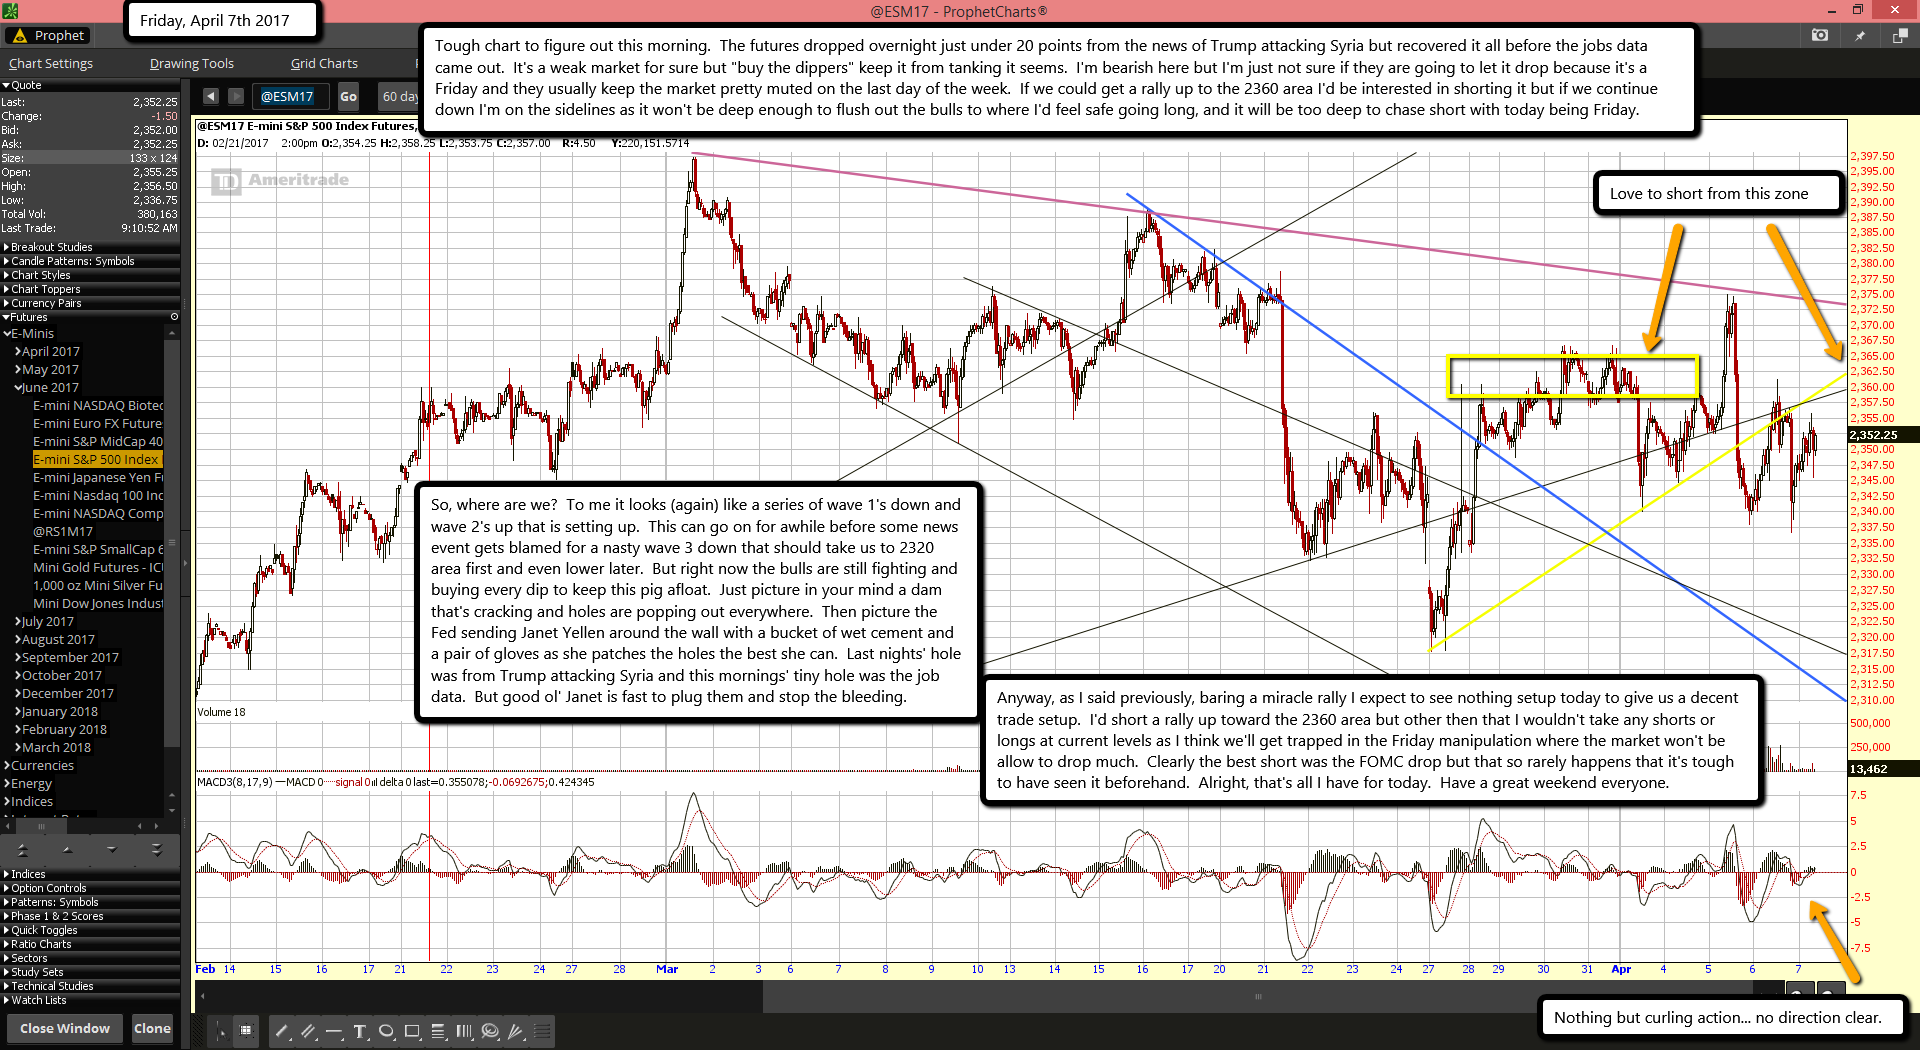
Tough chart to figure out this morning. The futures dropped overnight just under 20 points from the news of Trump attacking Syria but recovered it all before the jobs data came out. It's a weak market for sure but "buy the dippers" keep it from tanking it seems. I'm bearish here but I'm just not sure if they are going to let it drop because it's a Friday and they usually keep the market pretty muted on the last day of the week. If we could get a rally up to the 2360 area I'd be interested in shorting it but if we continue down I'm on the sidelines as it won't be deep enough to flush out the bulls to where I'd feel safe going long, and it will be too deep to chase short with today being Friday.
So, where are we? To me it looks (again) like a series of wave 1's down and wave 2's up that is setting up. This can go on for awhile before some news event gets blamed for a nasty wave 3 down that should take us to 2320 area first and even lower later. But right now the bulls are still fighting and buying every dip to keep this pig afloat. Just picture in your mind a dam that's cracking and holes are popping out everywhere. Then picture the Fed sending Janet Yellen around the wall with a bucket of wet cement and a pair of gloves as she patches the holes the best she can. Last nights' hole was from Trump attacking Syria and this mornings' tiny hole was the job data. But good ol' Janet is fast to plug them and stop the bleeding.
Anyway, as I said previously, baring a miracle rally I expect to see nothing setup today to give us a decent trade setup. I'd short a rally up toward the 2360 area but other then that I wouldn't take any shorts or longs at current levels as I think we'll get trapped in the Friday manipulation where the market won't be allow to drop much. Clearly the best short was the FOMC drop but that so rarely happens that it's tough to have seen it beforehand. Alright, that's all I have for today. Have a great weekend everyone.
ES Morning Update April 6th 2017
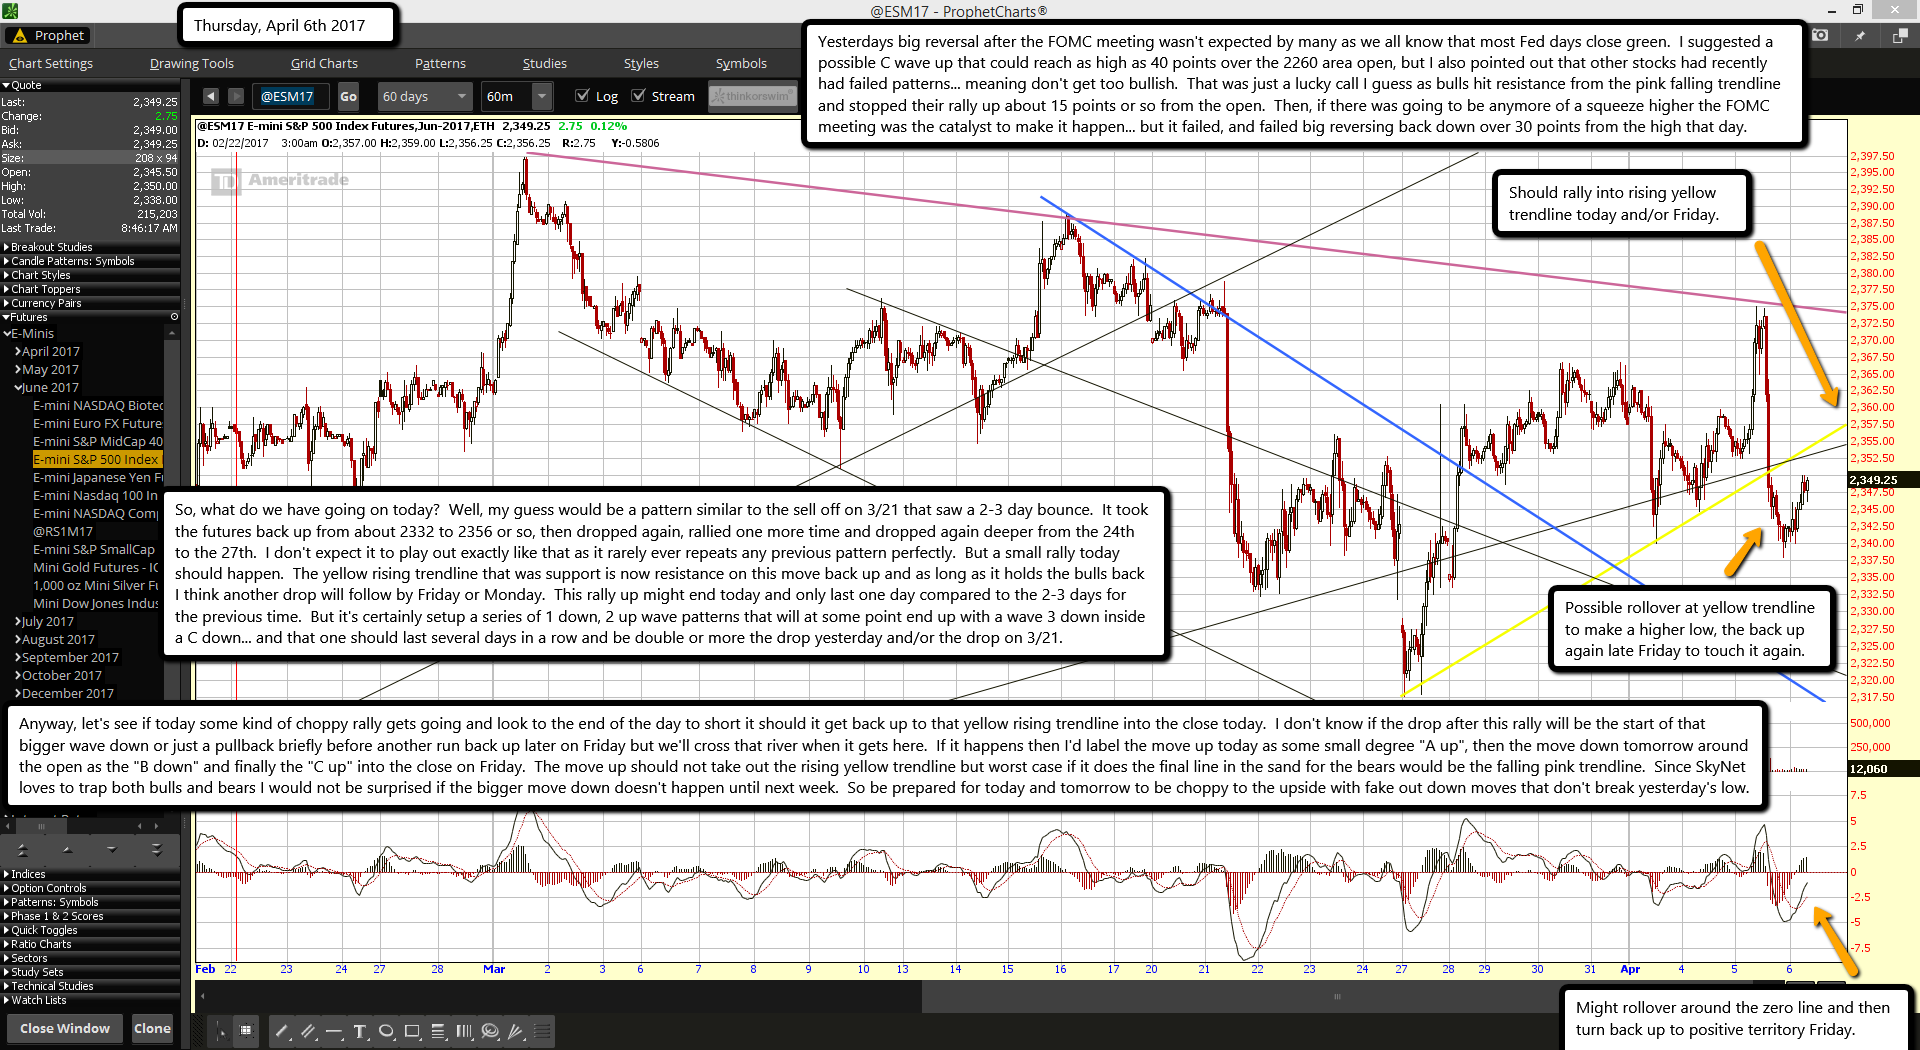
Yesterdays big reversal after the FOMC meeting wasn't expected by many as we all know that most Fed days close green. I suggested a possible C wave up that could reach as high as 40 points over the 2260 area open, but I also pointed out that other stocks had recently had failed patterns... meaning don't get too bullish. That was just a lucky call I guess as bulls hit resistance from the pink falling trendline and stopped their rally up about 15 points or so from the open. Then, if there was going to be anymore of a squeeze higher the FOMC meeting was the catalyst to make it happen... but it failed, and failed big reversing back down over 30 points from the high that day.
So, what do we have going on today? Well, my guess would be a pattern similar to the sell off on 3/21 that saw a 2-3 day bounce. It took the futures back up from about 2332 to 2356 or so, then dropped again, rallied one more time and dropped again deeper from the 24th to the 27th. I don't expect it to play out exactly like that as it rarely ever repeats any previous pattern perfectly. But a small rally today should happen. The yellow rising trendline that was support is now resistance on this move back up and as long as it holds the bulls back I think another drop will follow by Friday or Monday. This rally up might end today and only last one day compared to the 2-3 days for the previous time. But it's certainly setup a series of 1 down, 2 up wave patterns that will at some point end up with a wave 3 down inside a C down... and that one should last several days in a row and be double or more the drop yesterday and/or the drop on 3/21.
Anyway, let's see if today some kind of choppy rally gets going and look to the end of the day to short it should it get back up to that yellow rising trendline into the close today. I don't know if the drop after this rally will be the start of that bigger wave down or just a pullback briefly before another run back up later on Friday but we'll cross that river when it gets here. If it happens then I'd label the move up today as some small degree "A up", then the move down tomorrow around the open as the "B down" and finally the "C up" into the close on Friday. The move up should not take out the rising yellow trendline but worst case if it does the final line in the sand for the bears would be the falling pink trendline. Since SkyNet loves to trap both bulls and bears I would not be surprised if the bigger move down doesn't happen until next week. So be prepared for today and tomorrow to be choppy to the upside with fake out down moves that don't break yesterday's low.
ES Morning Update April 5th 2017
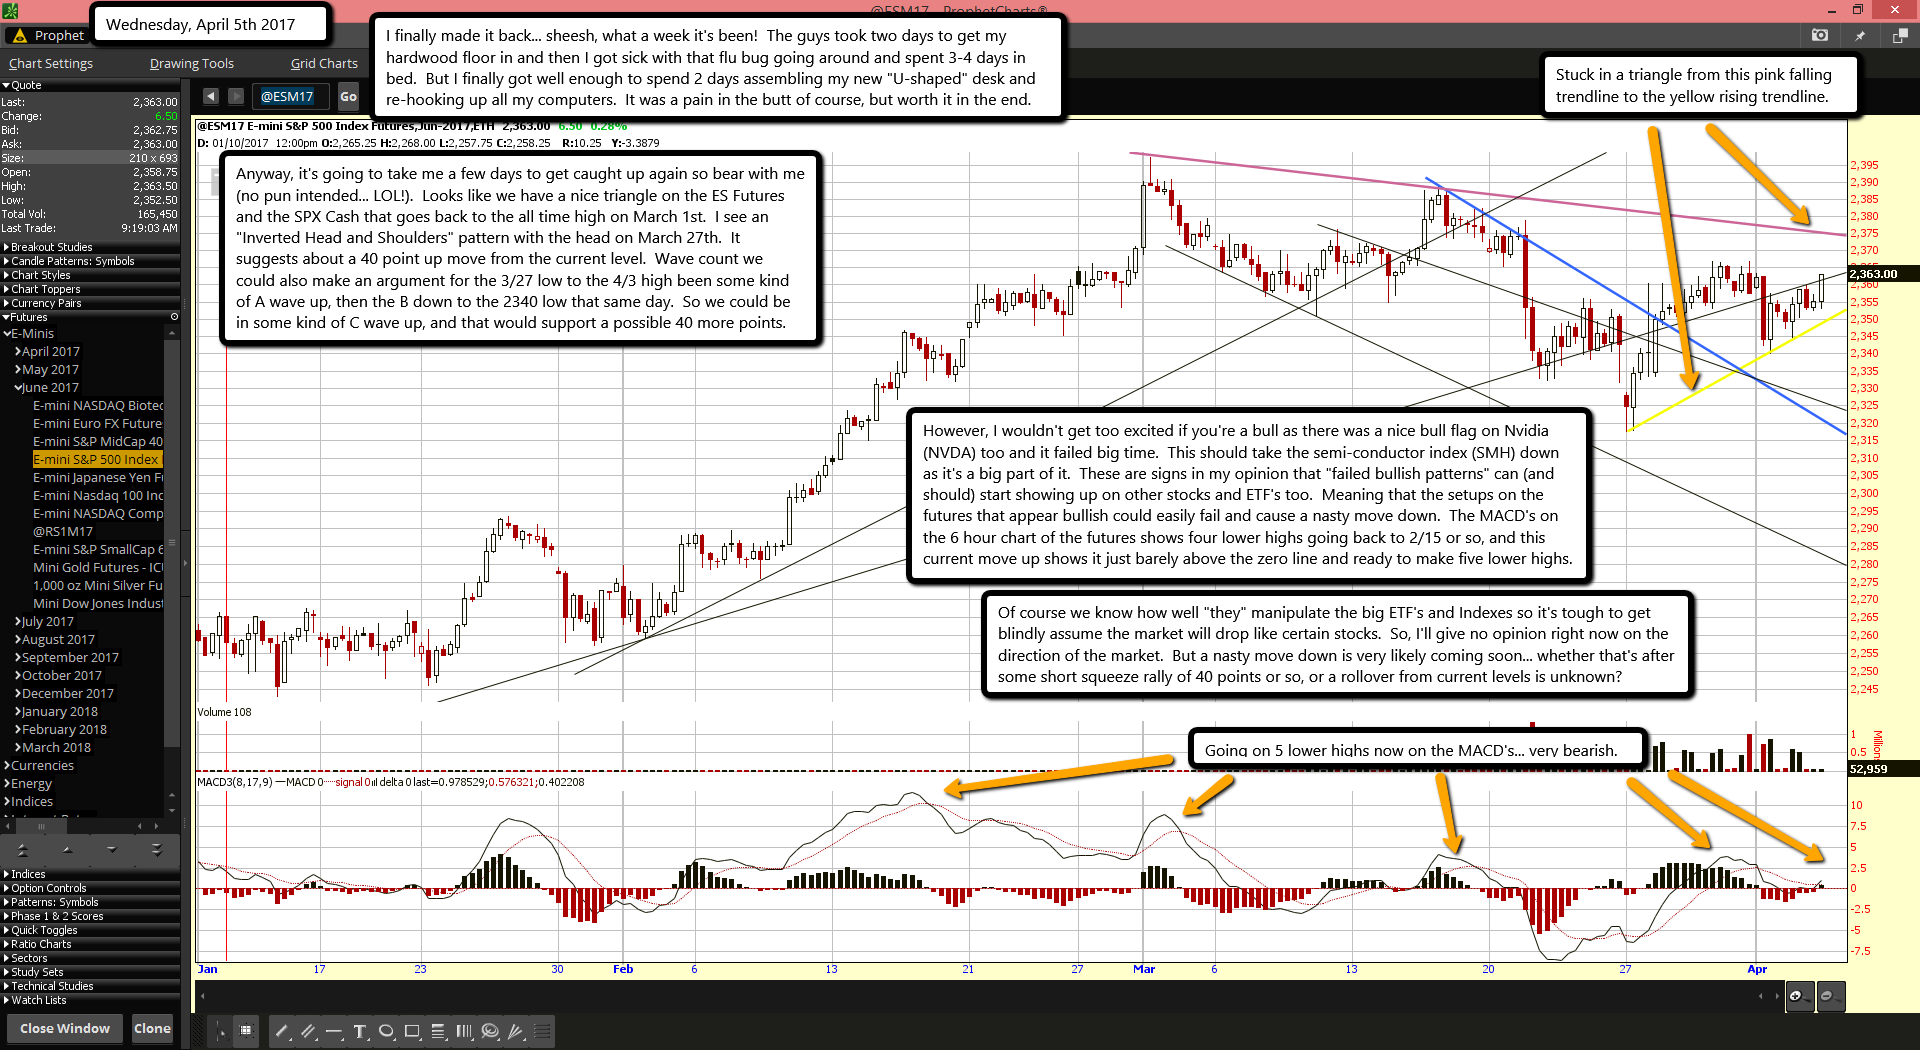
I finally made it back... sheesh, what a week it's been! The guys took two days to get my hardwood floor in and then I got sick with that flu bug going around and spent 3-4 days in bed. But I finally got well enough to spend 2 days assembling my new "U-shaped" desk and re-hooking up all my computers. It was a pain in the butt of course, but worth it in the end.
Anyway, it's going to take me a few days to get caught up again so bear with me (no pun intended... LOL!). Looks like we have a nice triangle on the ES Futures and the SPX Cash that goes back to the all time high on March 1st. I see an "Inverted Head and Shoulders" pattern with the head on March 27th. It suggests about a 40 point up move from the current level. Wave count we could also make an argument for the 3/27 low to the 4/3 high been some kind of A wave up, then the B down to the 2340 low that same day. So we could be in some kind of C wave up, and that would support a possible 40 more points.
However, I wouldn't get too excited if you're a bull as there was a nice bull flag on Nvidia (NVDA) too and it failed big time. This should take the semi-conductor index (SMH) down as it's a big part of it. These are signs in my opinion that "failed bullish patterns" can (and should) start showing up on other stocks and ETF's too. Meaning that the setups on the futures that appear bullish could easily fail and cause a nasty move down. The MACD's on the 6 hour chart of the futures shows four lower highs going back to 2/15 or so, and this current move up shows it just barely above the zero line and ready to make five lower highs.
Of course we know how well "they" manipulate the big ETF's and Indexes so it's tough to get blindly assume the market will drop like certain stocks. So, I'll give no opinion right now on the direction of the market. But a nasty move down is very likely coming soon... whether that's after some short squeeze rally of 40 points or so, or a rollover from current levels is unknown?
How giant digital adverts could soon be in our cities
Passers-by on a London street were recently amazed to see a fleeting image of a pink tongue protruding from fruity plump lips, seemingly suspended in mid-air.
It was the famous logo for the Rolling Stones and was part of an experiment by tech start-up Lightvert.
Its technology can produce images that appear to be 200m (656ft) high, but which only exist in the eye of the viewer for a fraction of a second.
So could we be on the verge of seeing giant digital ads in our cities, similar to those featured in the seminal 1982 sci-fi film Blade Runner?
Lightvert certainly hopes so.
Its tech, called Echo, works by employing a narrow - no more than 200mm - strip of reflective material fixed to the side of a building. A high-power projector mounted below or above the strip beams light off the reflector directly into the viewer's eye.
The image appears momentarily, exploiting what's called the "persistence of vision" effect - the way sparklers seem to leave a trail of light when you wave them around quickly.

"Echo technology is being well received by those who have seen it to date," says Daniel Siden, Lightvert's chief executive.
"Viewers are curious as to how it works and engage with it in a way you just don't see with traditional screen media."
He is hoping that landlords will grab the opportunity to turn their buildings into revenue-generating digital billboards that are huge, yet physically unobtrusive.
These are very early days for the firm, but Mr Siden believes outdoor advertising generally is overdue a leap forward in innovation.

But would you want a billboard to target adverts at you specifically?
That's what happened in Moscow recently. Drivers approaching a digital billboard were shown ads for Jaguar's new SUV (sports utility vehicle), but only if they were driving a different make of SUV.
A machine-learning camera recognized the vehicle's make and changed the ad to target those drivers.
The billboard image was adaptive, too, showing the Jaguar against a dark background if it was night-time, or maneuvering through snow if the weather was bad.
The ads were developed by Synaps Labs and founder Aleksey Utkin says there are plans to test similar ads in the US this summer.
But won't such ads be dangerously distracting?
A study on driver distraction by the Swedish National Road and Transport Research Institute found that digital billboards attracted the gaze of drivers for much longer than other signs.
Researchers found drivers often took their eyes off the road for more than two seconds - a threshold which other studies have found to be dangerous.
Some bricks-and-mortar retailers, such as video games specialist Game, are using augmented reality (AR) tech to bring their shop windows to life.
Overlaying moving digital images on to the real world, as seen through a smartphone camera, caught the public imagination after the release of Nintendo's Pokemon Go game.
"AR is no longer just a nice-to-see technology - it has a far more extensive commercial application for brands, where results can be tracked and measured," says Richard Corps, co-founder of Ads Reality.

"We're seeing a much wider industry use of AR tech in different environments, such as in education as well as retail."
The uptake of AR in advertising is likely to increase due to the demands of a new generation of consumer, says Alex Fenton, a lecturer in digital business at Salford Business School.
"AR has lots of potential," he says. "The technology has been around for many years but had failed to capture the imagination of the mainstream.
"But with things like Pokemon Go, there's now an acceptance from young people in particular about AR and its benefits."

A few years ago retailers were excited about the potential of pinging you specific offers and ads to your phone based on where you were in the store or High Street.
But "proximity marketing" as it's called, has so far failed to take off, mainly due to the high costs of installing and maintaining Bluetooth beacons used to locate shoppers precisely.
But Devicescape eschews Bluetooth and instead tracks smartphone users via the use of wi-fi hotspots.
"Our software establishes a person's presence in a particular location based on their proximity to the wi-fi network at that location," says Owen Geddes, the firm's vice president of market development.
"It could be anywhere, a supermarket, a concert hall, or a bus."
This has resulted in a 13% rise in customers clicking through to product websites, he maintains.
Once aware of a person's location, the system triggers the delivery of a targeted ad to that smartphone containing a link to a piece of online branded content.

"It could be a discount offer for use in the shop the person is visiting, or a piece of content such as a movie trailer," says Mr Geddes.
"Importantly, it is always relevant to the consumer because of their location."
But Chris Daly, chief executive of the Chartered Institute of Marketing (CIM), says customers are instinctively skeptical about how their data is used, and thinks the industry will need to tread carefully.
CIM research has shown that 92% of customers are wary about data collection and use.
"When using adtech, marketers must keep this in mind and ensure they do not overstep their reach when making use of consumer data," says Mr Daly.
Maybe sticking to giant ads in the sky would be less controversial.
ES Morning Update March 27th 2017
Good Morning everyone. Looks like the futures sold off more over the weekend breaking down from the triangle pattern it was in. Now we'll start looking for support at the falling black trendline pointing to 2305 currently. For today though it's not likely to drop that much more. The move down has been very controlled so I'd expect a bottom to be put in shortly after the open. After that we could see a rally later in the day and into Tuesday, but I don't think this selling is over with. The 2300 SPX (230 SPY) level seems very likely to be tested this week. So any rally today and/or Tuesday will likely reverse and head back down later in the week. It's looking too me like we'll see the 2300 level tested by this Thursday or Friday if the futures play out as I think they will.
Now, for resistance on the way up... the 2340-2345 zone where those two black trendlines intercept is the most obvious, and then the falling blue trendline around 2350 currently... but it should be in the 2340-2345 area too by Tuesday I'd guess. What I think we might see is an "inverted head and shoulders" pattern setup that fails late this week. The left shoulder would be the 2332 low on the 21st/22nd. The head would be put in today either already at 2317 or some retest today that dips a little lower. Then the rally up later today will probably put in some type of ABC pattern. The A up might goes as high as 2340? Then the B down should fool everyone into shorting it, but it might stop at 2320 to make the right shoulder. Everyone will see it and go long as the next move up should be a C wave in that ABC pattern and the breakout for the inverted head and shoulders pattern.
If this happens it "should" be the trick SkyNet plays on the bulls as the pattern should fail and produce another drop that takes out the head and finds support around the 2300 area. This is my preferred scenario but we all know that SkyNet doesn't give me what I want very often. My 2nd scenario would be some kind of bottom again early today then some weak chop to make a small rally later but not coming close at all to the 2340-2345 resistance zone. Instead it would just hang around the current price level and possibly grind up to as high as 2330, but not high enough to let the trapped bulls out. Then we'd see the move down to 2300 or so by tomorrow if this second scenario plays out. I favor scenario one as I see positive divergence now on the MACD's but I'll take whatever SkyNet throws at me (kinda don't have a choice... LOL). Anyway, that's what I see possible for this week.
P.S. If you don't see a new update tomorrow it's because I'm putting down new hardwood floor in my computer room and the computers aren't all hooked back up yet. I'll be back online as soon as possible.
ES Morning Update March 24th 2017
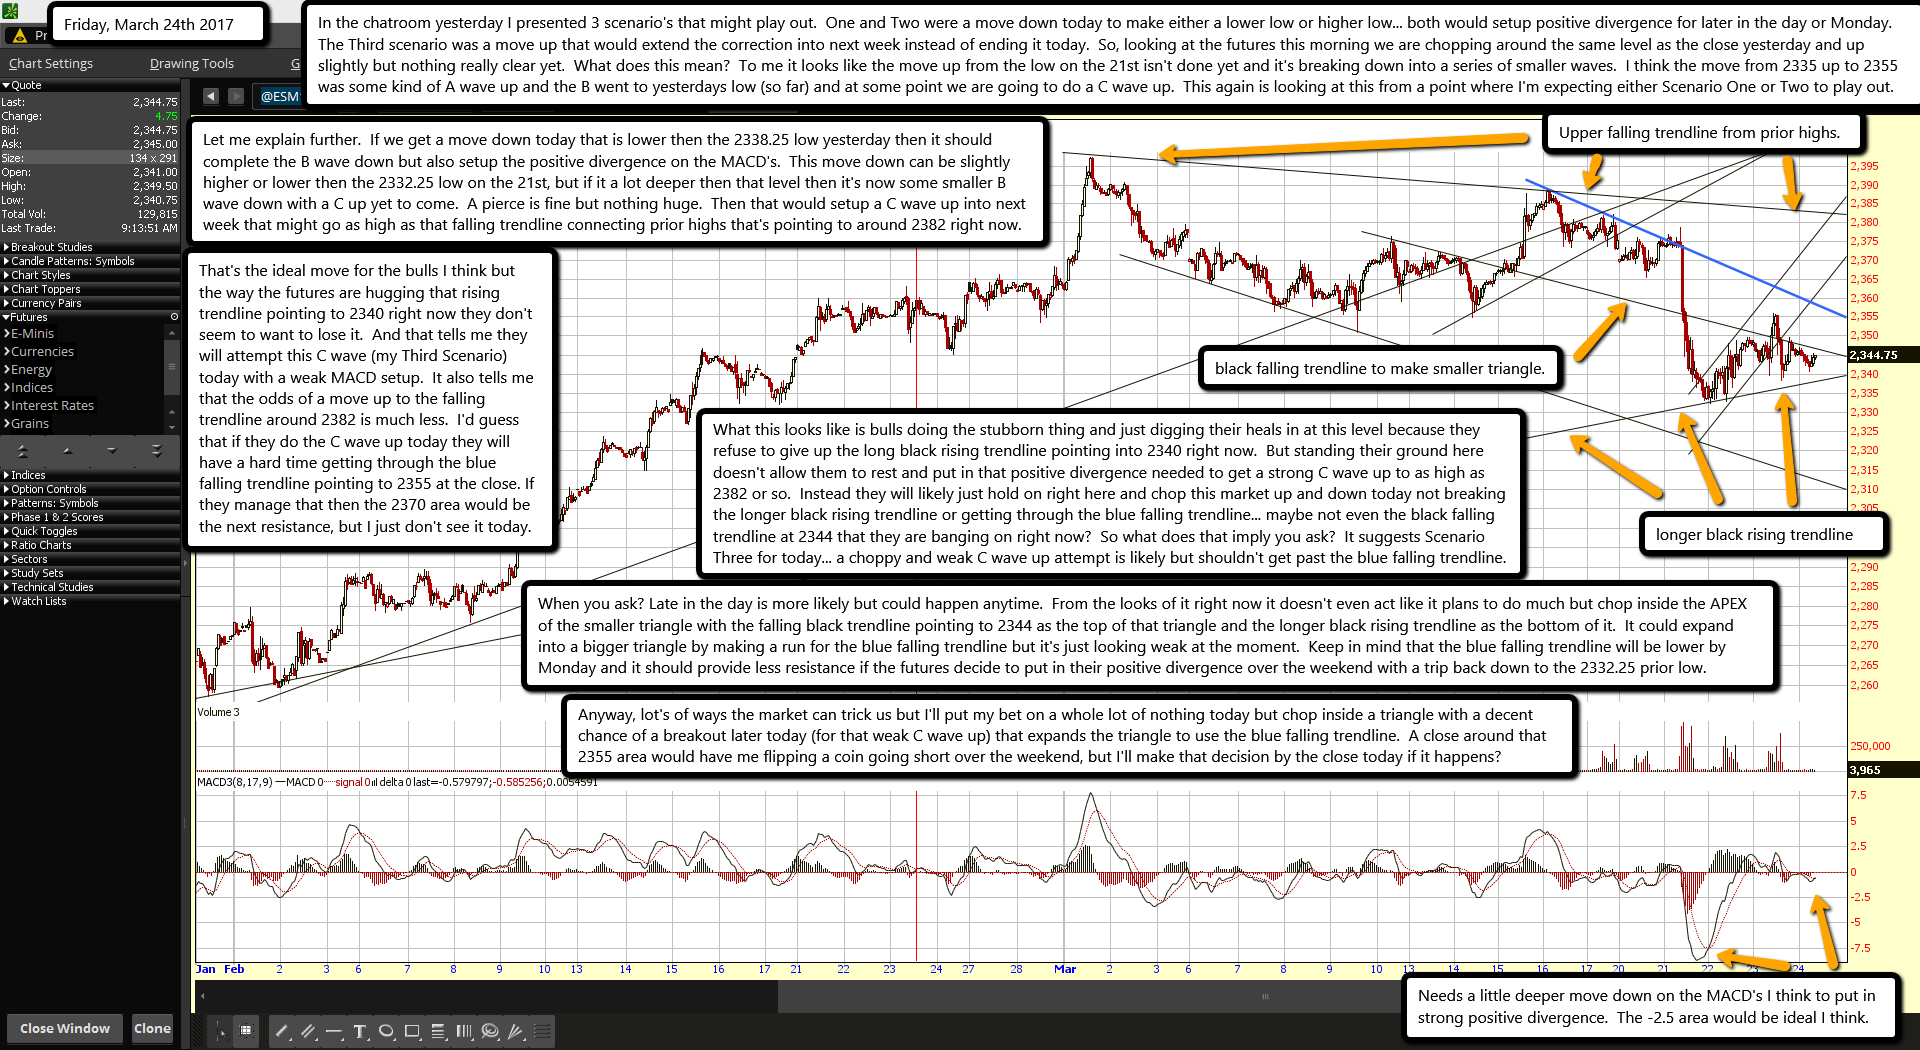
In the chatroom yesterday I presented 3 scenario's that might play out. One and Two were a move down today to make either a lower low or higher low... both would setup positive divergence for later in the day or Monday. The Third scenario was a move up that would extend the correction into next week instead of ending it today. So, looking at the futures this morning we are chopping around the same level as the close yesterday and up slightly but nothing really clear yet. What does this mean? To me it looks like the move up from the low on the 21st isn't done yet and it's breaking down into a series of smaller waves. I think the move from 2335 up to 2355 was some kind of A wave up and the B went to yesterdays low (so far) and at some point we are going to do a C wave up. This again is looking at this from a point where I'm expecting either Scenario One or Two to play out.
Let me explain further. If we get a move down today that is lower then the 2338.25 low yesterday then it should complete the B wave down but also setup the positive divergence on the MACD's. This move down can be slightly higher or lower then the 2332.25 low on the 21st, but if it a lot deeper then that level then it's now some smaller B wave down with a C up yet to come. A pierce is fine but nothing huge. Then that would setup a C wave up into next week that might go as high as that falling trendline connecting prior highs that's pointing to around 2382 right now.
That's the ideal move for the bulls I think but the way the futures are hugging that rising trendline pointing to 2340 right now they don't seem to want to lose it. And that tells me they will attempt this C wave (my Third Scenario) today with a weak MACD setup. It also tells me that the odds of a move up to the falling trendline around 2382 is much less. I'd guess that if they do the C wave up today they will have a hard time getting through the blue falling trendline pointing to 2355 at the close. If they manage that then the 2370 area would be the next resistance, but I just don't see it today.
What this looks like is bulls doing the stubborn thing and just digging their heals in at this level because they refuse to give up the long black rising trendline pointing into 2340 right now. But standing their ground here doesn't allow them to rest and put in that positive divergence needed to get a strong C wave up to as high as 2382 or so. Instead they will likely just hold on right here and chop this market up and down today not breaking the longer black rising trendline or getting through the blue falling trendline... maybe not even the black falling trendline at 2344 that they are banging on right now? So what does that imply you ask? It suggests Scenario Three for today... a choppy and weak C wave up attempt is likely but shouldn't get past the blue falling trendline.
When you ask? Late in the day is more likely but could happen anytime. From the looks of it right now it doesn't even act like it plans to do much but chop inside the APEX of the smaller triangle with the falling black trendline pointing to 2344 as the top of that triangle and the longer black rising trendline as the bottom of it. It could expand into a bigger triangle by making a run for the blue falling trendline but it's just looking weak at the moment. Keep in mind that the blue falling trendline will be lower by Monday and it should provide less resistance if the futures decide to put in their positive divergence over the weekend with a trip back down to the 2332.25 prior low.
Anyway, lot's of ways the market can trick us but I'll put my bet on a whole lot of nothing today but chop inside a triangle with a decent chance of a breakout later today (for that weak C wave up) that expands the triangle to use the blue falling trendline. A close around that 2355 area would have me flipping a coin going short over the weekend, but I'll make that decision by the close today if it happens?
ES Morning Update March 23rd 2017
I've added in a new rising trendline and the starting point on it is the low back in December of 2016 then connecting to the February 2017 low and extending into yesterdays low. Sometimes you miss trendlines and have to go back and try to figure out why the market stopped where it did... only to see a trendline you missed. I'm also showing you the 6 hour chart today instead of the 60 minute chart. On this chart we can the futures seem to be in a rising channel but also struggling to get through the falling black trendline that acts as resistance and makes the top line of a triangle with the bottom line of that triangle being the new much longer black rising trendline. The triangle is much bigger if you get past that black falling trendline and look for the blue falling trendline, as that also makes another triangle.
Ok, triangles and channels... which is going to work? Well, after watching this market manipulate the sheep over and over into the wrong position I'm guessing that the rising triangle will fail today and the falling black trendline will keep the futures from rallying through it. And I'm thinking the new longer black rising trendline will hold as well. Therefore, SkyNet will do it's favorite pattern today... the triangle. I'm looking for a rangebound day where the market goes up and down small inside the APEX of this triangle. The 60 minute chart has MACD's that came up from -8 or so to +2 yesterday and are now back down to a hair over zero. What should happen is that it dips into the negative again and recycles back up late in the day maybe going to -2.5 or so before turning. At the same time the futures should stay inside the triangle.
LOL... before I got finished typing this update the rising channel broke!
Katy Perry accused of witchcraft by nuns
Two nuns who are strongly opposed to Katy Perry purchasing their former convent accused Katy Perry of witchcraft and of “selling her soul to the devil”. They really don’t want her to move in there.
The singer whose last single was about people being too “comfortable in their bubble” has been attempting to buy, for the past two years, a gigantic convent in Los Feliz, Los Angeles. Perry made a $14.5 million offer to buy the eight-acre property but five nuns maintaining the estate fought tooth and nail to stop the deal. The judge finally sided with the Perry, who will most likely move into the estate once the transaction has been approved by the Vatican.
“Perry initially thought that she would be able to buy the former convent from the archdiocese of Los Angeles, run by Archbishop Jose Gomez, and made a $14.5 million (£9.3 million) bid. However, the five nuns living in the property at the time deemed that Perry would be an unsuitable owner and pushed to sell it to businesswoman Dana Hollister instead, who wanted to turn it into a hotel. A local Catholic archbishop then argued that it was him and not the nuns who owned the property and that it was his wish to sell the property to Perry.
The Hollywood Reporter now reports that judge Stephanie Bowick issued a ruling on Tuesday (March 14) that the nuns “did not have authority to sell the property to Hollister” and “nevertheless failed to validly consummate the transaction.”
– NME, Judge sides with Katy Perry as nuns accuse singer of witchcraft
The property is maintained by Sister Rita Callanan, 78 and Sister Rose Catherine Holzman, 86, who belong the Order of the Immaculate Heart of the Blessed Virgin Mary. Sister Callanan stated that she would ‘not be very happy at all if Perry got the property adding: ‘I do not like Katy Perry’s lifestyle’.
Amidst the court battle, the nuns have been extremely vocal about their opposition to the sale, even branding Perry as “disgusting” and hinting that she would desecrate the convent’s sacred grounds. In an interview with the Daily Mail, the nuns explained the time they confronted Katy Perry about her selling her soul to the devil and more.
“Recalling a meeting the sisters had with the singer, Sister Callanan said: ‘She brought her mother Mary to the meeting and I just thought, ‘Oh God help us.’
‘Katy Perry was all dressed very nicely and said: ‘I have this tattoo on my wrist and it says Jesus.
‘And I wanted to say, ‘yes and what is the tattoo on your behind?’
The nun also quizzed Perry on remarks she had made about ‘selling her soul to the devil’ when she moved from Christian music into mainstream pop.”
The estate was originally built in 1927 for the broadcaster and entrepreneur Earle Anthony. It was then sold in 1961 to Catholic philanthropist Sir Daniel Donohue. Soon after, his son committed suicide on the property.
In 1969, Manson’s followers butchered the couple Leno and Rosemary LaBianca in their house adjoining the property.
The couple was stabbed dozens of times in a ritualistic matter. Leno LaBianca was given 14 puncture wounds with an ivory-handled, two-tined carving fork, which was left jutting out of his stomach. A steak knife was also planted in his throat. Manson’s followers wrote “Rise” and “Death to pigs” on the walls and “Healter Skelter” on the refrigerator door, all in LaBianca’s blood. These events occurred on the day following the infamous killing of Sharon Tate (Roman Polanski’s pregnant wife) by Manson’s “family” (read my article about it here).
“In August 1969, a night after the murder of Sharon Tate and others by followers of Charles Manson, Leno and Rosemary LaBianca were also butchered by the Manson family — and the misspelled phrase “Healter Skelter” was written in blood on a refrigerator — in a home that adjoins the nuns’ property.”
– NY Times, 2 Nuns, a Developer and Katy Perry Walk Into a Real Estate Deal
Charles Manson was a product of the MKULTRA program. He was described by Fritz Springmeier as “both a Monarch slave and a handler”. His programmers knew ahead of time what were going to be the next hits. He was basically used by the elite to carry out ritualistic murders. Manson was reportedly programmed using Beatles songs (Manson himself claimed that the song Helter Skelter contained hidden messages intended for his family).
“The Manson killings were performed according to ancient ritual with hoodwinks and “cords of initiation” around the necks of the sacrifices. (…)
What we are witnessing in the wake of the public enactment of these alchemical psychodramas, whose spiritual consequences for mankind are far more momentous than most have thus far guessed, is a process of global occult initiation”.
– Michael, A. Hoffman, Secret Societies and Psychological Warfare
The entire Manson saga was deeply interconnected with the occult elite’s Satanic industry.
“the murders attributed to the Son of Sam, the Manson Family, and numerous other interconnected killings (including possibly the Zodiac murders) were not what they appeared to be. While these killings appeared to be the random work of serial/mass murderers, they actually were contract hits carried out for specific purposes by an interlocking network of Satanic cults … In other words, these were professional hits orchestrated and disguised to look like the work of yet another ‘lone nut’ serial killer.”
– David McGowan, “There’s Something About Henry”
So this is the property Katy Perry has been attempting to purchase for the past two years. Is it truly the perfect place to drink “green tea and meditate” … or to carry out Black magick rituals?
***
Bette Davis’ Christian daughter claims her famous mother practiced witchcraft
A neurotic, controlling and manipulative drunk who indulged in the occult and spent decades trying to break up her daughter’s marriage – that’s the shocking portrayal of legendary film star Bette Davis by her eldest child B.D. Hyman.
Nearly 30 years after Davis died, her daughter is still waging a war against her famous mother in YouTube videos to promote her Christian ministry.
And the fight is even more vicious than the rivalry between Davis and her What Ever Happened To Baby Jane? co-star Joan Crawford, which is recounted in Ryan Murphy’s new TV series, Feud.
Hyman, now 69, who lives in Charlottesville, Virginia is a born-again Christian who runs her own ministry.
In a series of YouTube videos called A Long Day’s Journey Into Light, she shares her ‘testimony’ with her followers.
It includes claims that her mom dabbled in witchcraft, casting spells on her enemies from her bed, and that the star’s ‘demonic’ curse on Hyman and her family led to her grandson’s bipolar diagnosis and her daughter facing terminal cancer.
In a 2015 video, Hyman says: ‘[She] would sit on her bed and she had this big metal wastebasket and she would have her secretary get a piece of clothing from someone who had vexed her, crossed her in her view, and she would take this piece of clothing and she would mumble incoherently and she would then set it on fire and hold it over this metal wastebasket, and laugh as it burned and she dropped it into this container.
‘People’s lives were destroyed. They fell apart. All sorts of horrible things happened to them.’
She also claims to have witnessed her mother’s ‘demonic cackling,’ watching her ‘transform into a Satanic figure, [with] a Satanic face, long claws on the end of her hands,’ scraping at the glass of a terrace door during a 1982 trip to her Davis, California home.
Hyman added that her mother was ‘the poster girl for the spirit of control’ and described how she became increasingly ‘invasive’ and destructive’ in her and her family’s life.
The claims are just another chapter in Hyman’s bitter relationship with her mom, which she exposed in her 1985 tell-all, My Mother’s Keeper: A Daughter’s Candid Portrait of Her Famous Mother.

May sets Brexit date for March 29
British Prime Minister Theresa May will formally trigger Brexit on March 29 but tensions have already concentrated around the punishment the European Union might try to extract from any deal.
European Commission President Jean-Claude Juncker told German newspaper Bild the UK may have to abandon a trade deal unless it agreed to the high terms offered by the EU, including a “divorce bill” up to £60 billion.
Mr Juncker said Brexit would bring the remaining 27 members closer together. He said they will fall in love with each other again and renew their vows with the European Union because “Britain’s example will make everyone realise that it’s not worth leaving.”
He said: “Half memberships and cherrypicking aren’t possible. In Europe you eat what’s on the table or you don’t sit at the table.”
But the chair of Westminster’s European Scrutiny Committee, Bill Cash responded with a terse reminder that Britain didn’t owe anything to the EU, in a “legal or political’’ sense.
In an inflammatory remark, Mr Cash said it was worth bearing in mind that the UK helped restructure Germany’s post war debts back in 1953.
Mrs May has already indicated she will walk away from a bad trade deal and have a no deal if the EU wanted to extract a savage punishment.
Mrs May yesterday notified the EU Council president Donald Tusk of the official date the United Kingdom will trigger article 50 of the Lisbon Treaty, — on Wednesday next week — which kick starts the two year formal divorce proceedings from the EU.
The official start of proceedings will start with a formal letter sent by Mrs May to the EU.
ES Morning Update March 22nd 2017
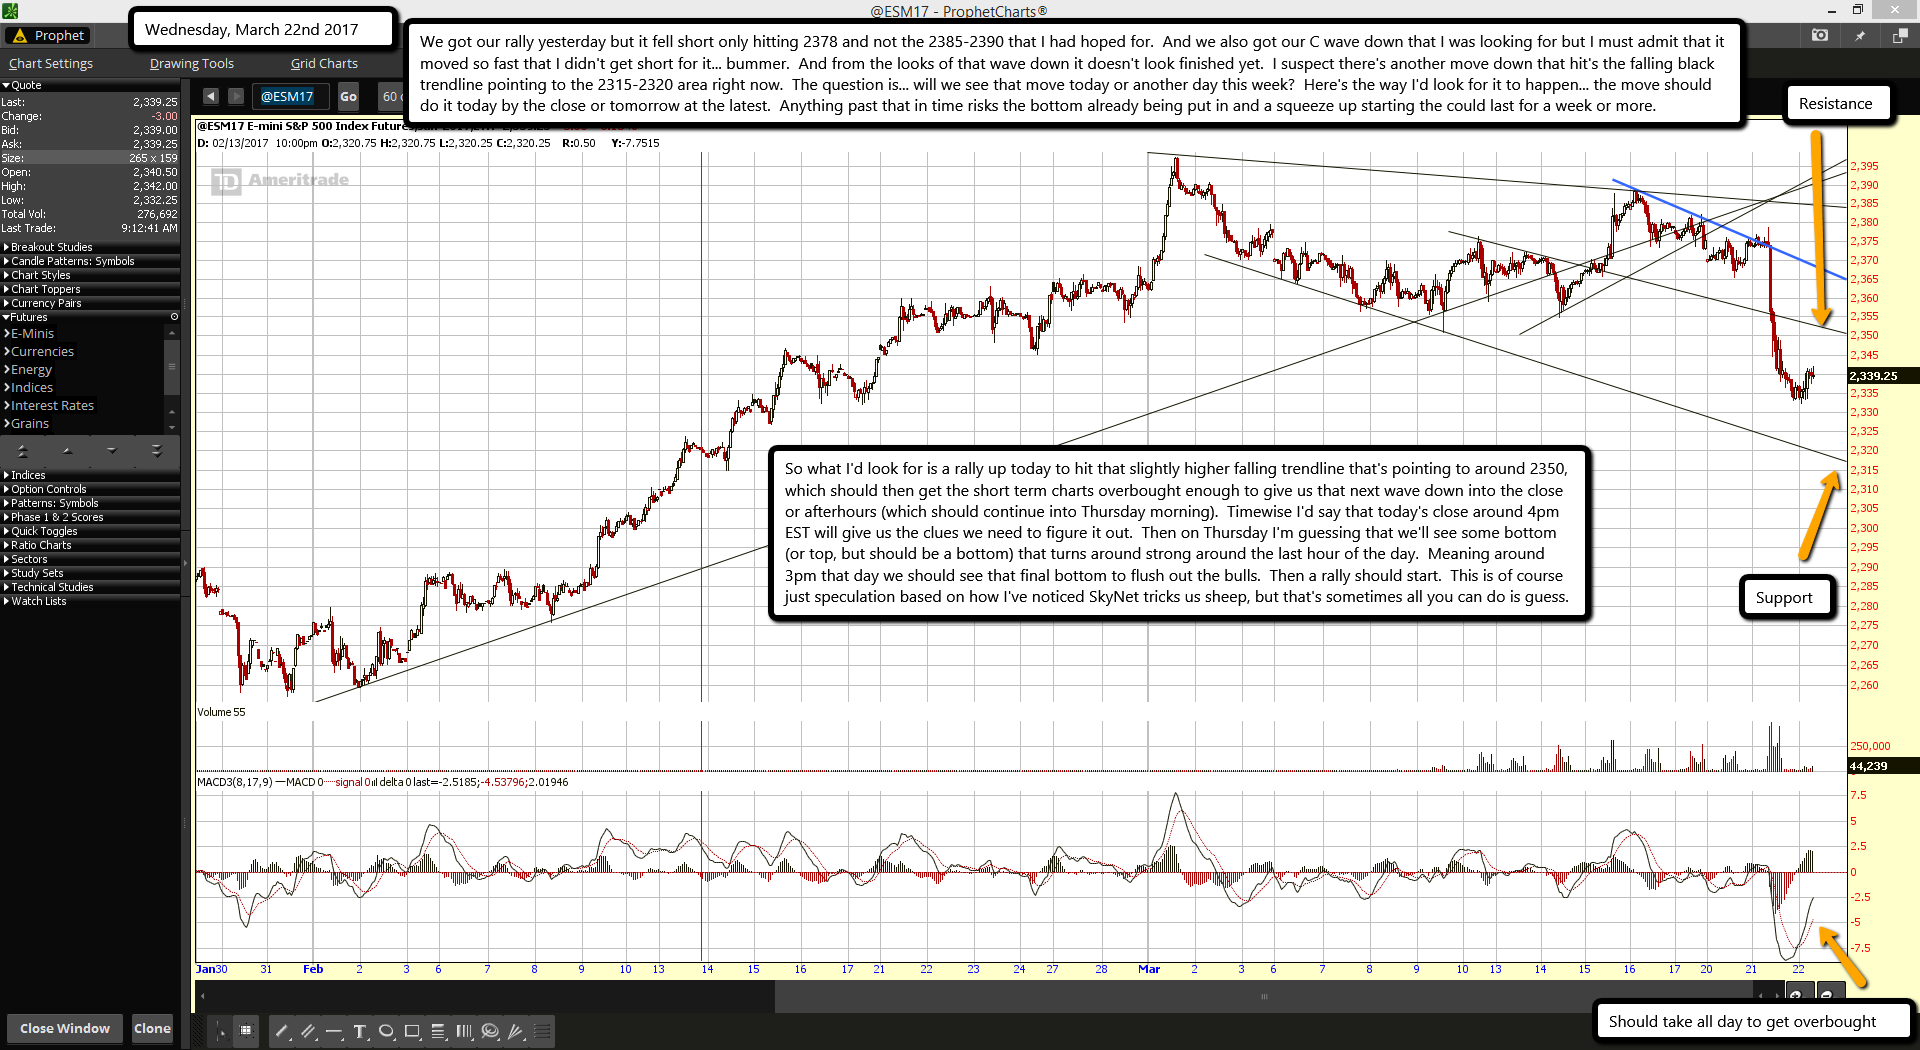
We got our rally yesterday but it fell short only hitting 2378 and not the 2385-2390 that I had hoped for. And we also got our C wave down that I was looking for but I must admit that it moved so fast that I didn't get short for it... bummer. And from the looks of that wave down it doesn't look finished yet. I suspect there's another move down that hit's the falling black trendline pointing to the 2315-2320 area right now. The question is... will we see that move today or another day this week? Here's the way I'd look for it to happen... the move should do it today by the close or tomorrow at the latest. Anything past that in time risks the bottom already being put in and a squeeze up starting the could last for a week or more.
So what I'd look for is a rally up today to hit that slightly higher falling trendline that's pointing to around 2350, which should then get the short term charts overbought enough to give us that next wave down into the close or afterhours (which should continue into Thursday morning). Timewise I'd say that today's close around 4pm EST will give us the clues we need to figure it out. Then on Thursday I'm guessing that we'll see some bottom (or top, but should be a bottom) that turns around strong around the last hour of the day. Meaning around 3pm that day we should see that final bottom to flush out the bulls. Then a rally should start. This is of course just speculation based on how I've noticed SkyNet tricks us sheep, but that's sometimes all you can do is guess.
ES Morning Update March 21st 2017
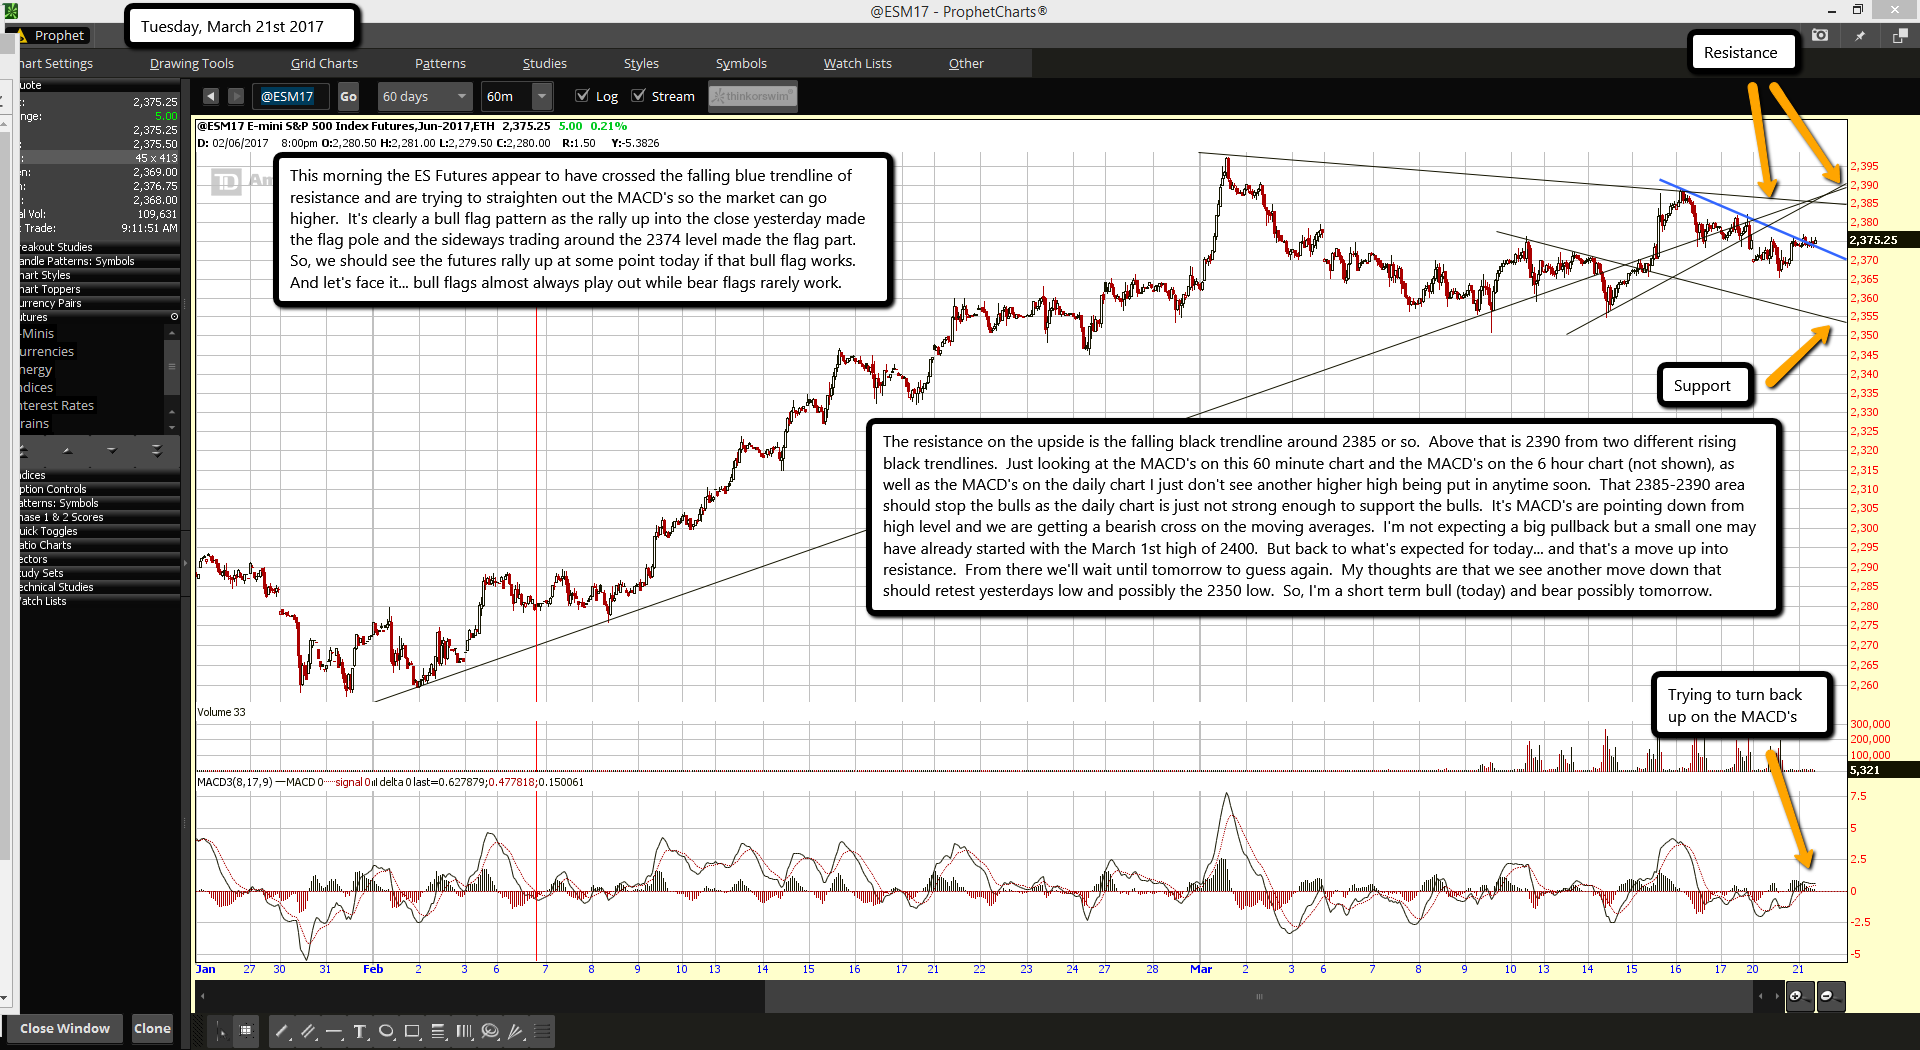
This morning the ES Futures appear to have crossed the falling blue trendline of resistance and are trying to straighten out the MACD's so the market can go higher. It's clearly a bull flag pattern as the rally up into the close yesterday made the flag pole and the sideways trading around the 2374 level made the flag part. So, we should see the futures rally up at some point today if that bull flag works. And let's face it... bull flags almost always play out while bear flags rarely work.
The resistance on the upside is the falling black trendline around 2385 or so. Above that is 2390 from two different rising black trendlines. Just looking at the MACD's on this 60 minute chart and the MACD's on the 6 hour chart (not shown), as well as the MACD's on the daily chart I just don't see another higher high being put in anytime soon. That 2385-2390 area should stop the bulls as the daily chart is just not strong enough to support the bulls. It's MACD's are pointing down from high level and we are getting a bearish cross on the moving averages. I'm not expecting a big pullback but a small one may have already started with the March 1st high of 2400. But back to what's expected for today... and that's a move up into resistance. From there we'll wait until tomorrow to guess again. My thoughts are that we see another move down that should retest yesterdays low and possibly the 2350 low. So, I'm a short term bull (today) and bear possibly tomorrow.
ES Morning Update March 20th 2017
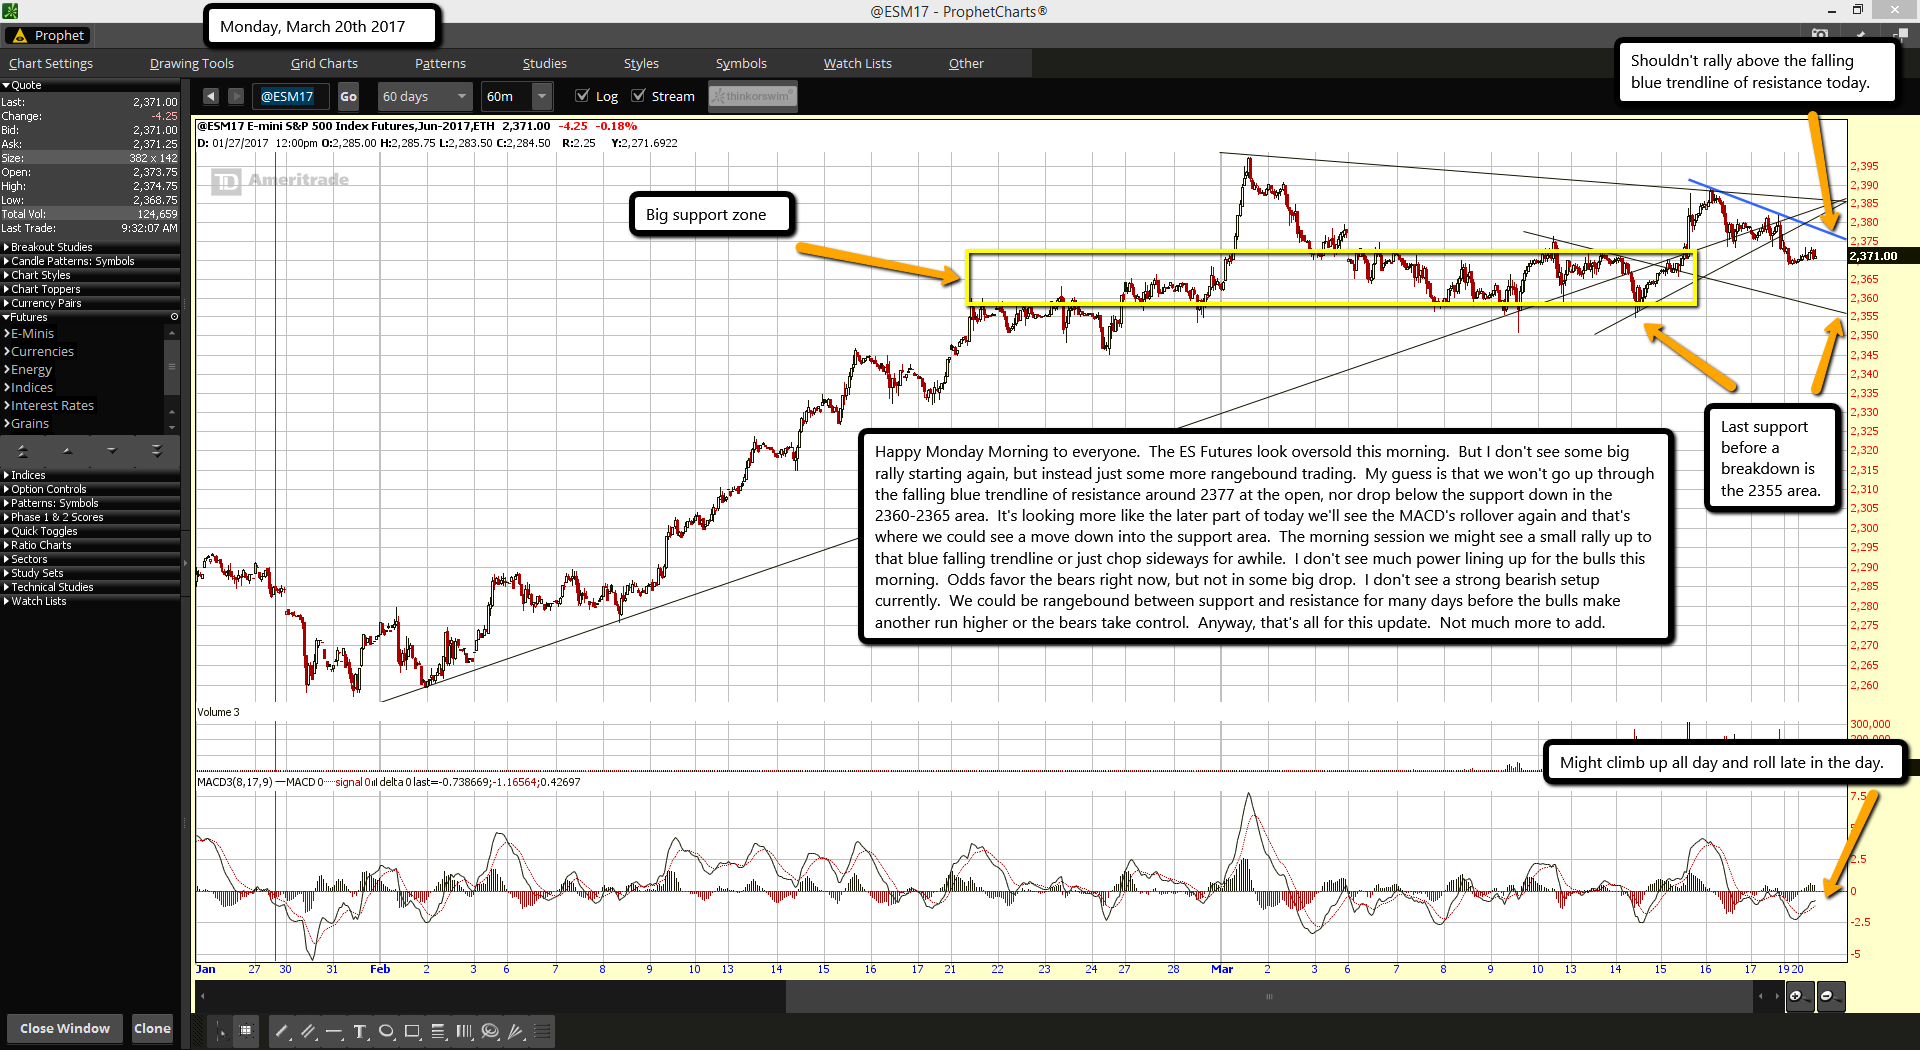
Happy Monday Morning to everyone. The ES Futures look oversold this morning. But I don't see some big rally starting again, but instead just some more rangebound trading. My guess is that we won't go up through the falling blue trendline of resistance around 2377 at the open, nor drop below the support down in the 2360-2365 area. It's looking more like the later part of today we'll see the MACD's rollover again and that's where we could see a move down into the support area. The morning session we might see a small rally up to that blue falling trendline or just chop sideways for awhile. I don't see much power lining up for the bulls this morning. Odds favor the bears right now, but not in some big drop. I don't see a strong bearish setup currently. We could be rangebound between support and resistance for many days before the bulls make another run higher or the bears take control. Anyway, that's all for this update. Not much more to add.
ES Morning Update March 17th 2017
Futures seem to stuck now in a triangle and will probably stay inside the APEX of it all day today. The downward sloping blue trendline is the resistance and the lower rising black trendline of the channel is the support. I thought we might turn back up yesterday and hit the top trendline of the rising channel (before I added this new falling blue trendline) and then rollover today. But that didn't happen as went down all day yesterday and hovered at the 2380 area of support.
So, let's keep it simple for today. Since it's the monthly options expiration odds favor a range-bound day to pin the SPY where the most options expire worthless. That's another reason to expect the futures (and the SPX cash and SPY) to stay in the APEX of the triangle not breaking through overhead resistance or losing support. Triangle patterns are the most frustrating for both bulls and bears and naturally the favorite setup that SkyNet likes to use to keep every trader from making money. That's all for today. Have a great weekend everyone.
ES Morning Update March 16th 2017
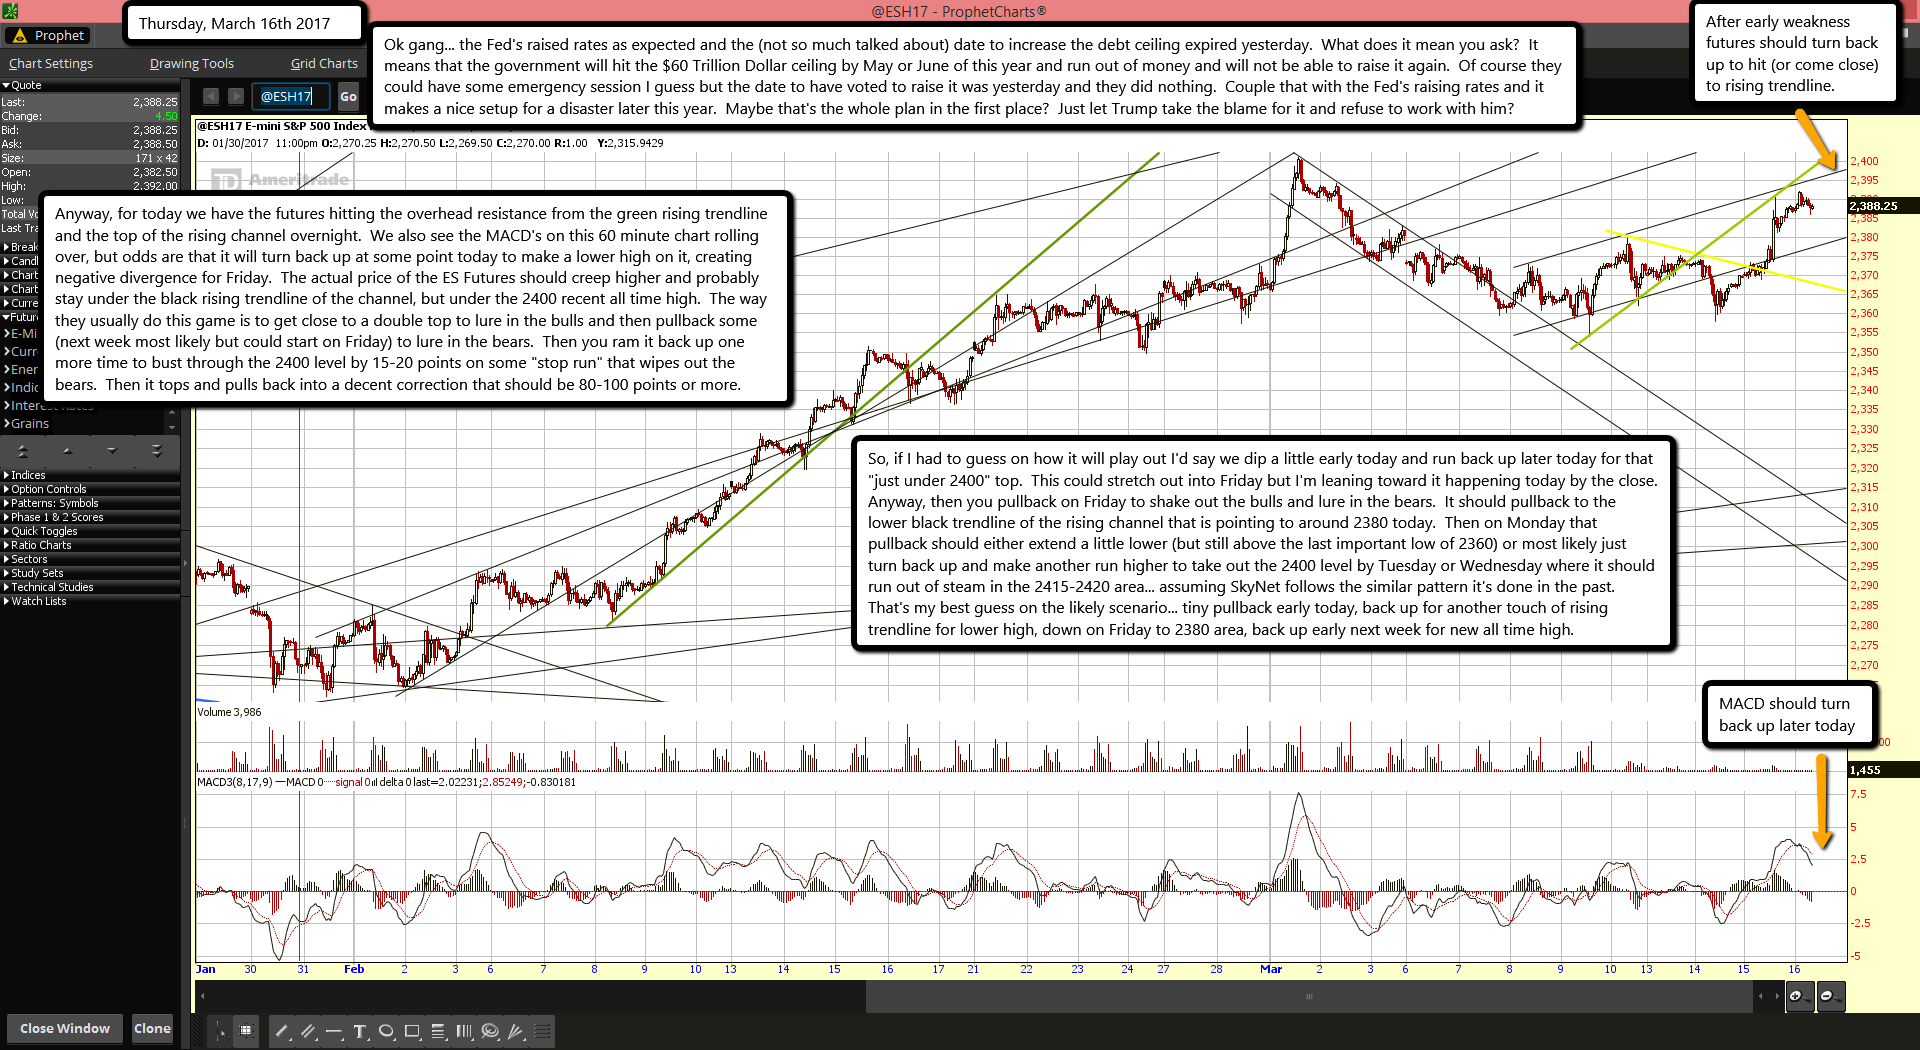
Ok gang... the Fed's raised rates as expected and the (not so much talked about) date to increase the debt ceiling expired yesterday. What does it mean you ask? It means that the government will hit the $60 Trillion Dollar ceiling by May or June of this year and run out of money and will not be able to raise it again. Of course they could have some emergency session I guess but the date to have voted to raise it was yesterday and they did nothing. Couple that with the Fed's raising rates and it makes a nice setup for a disaster later this year. Maybe that's the whole plan in the first place? Just let Trump take the blame for it and refuse to work with him?
Anyway, for today we have the futures hitting the overhead resistance from the green rising trendline and the top of the rising channel overnight. We also see the MACD's on this 60 minute chart rolling over, but odds are that it will turn back up at some point today to make a lower high on it, creating negative divergence for Friday. The actual price of the ES Futures should creep higher and probably stay under the black rising trendline of the channel, but under the 2400 recent all time high. The way they usually do this game is to get close to a double top to lure in the bulls and then pullback some (next week most likely but could start on Friday) to lure in the bears. Then you ram it back up one more time to bust through the 2400 level by 15-20 points on some "stop run" that wipes out the bears. Then it tops and pulls back into a decent correction that should be 80-100 points or more.
So, if I had to guess on how it will play out I'd say we dip a little early today and run back up later today for that "just under 2400" top. This could stretch out into Friday but I'm leaning toward it happening today by the close. Anyway, then you pullback on Friday to shake out the bulls and lure in the bears. It should pullback to the lower black trendline of the rising channel that is pointing to around 2380 today. Then on Monday that pullback should either extend a little lower (but still above the last important low of 2360) or most likely just turn back up and make another run higher to take out the 2400 level by Tuesday or Wednesday where it should run out of steam in the 2415-2420 area... assuming SkyNet follows the similar pattern it's done in the past. That's my best guess on the likely scenario... tiny pullback early today, back up for another touch of rising trendline for lower high, down on Friday to 2380 area, back up early next week for new all time high.
ES Morning Update March 15th 2017
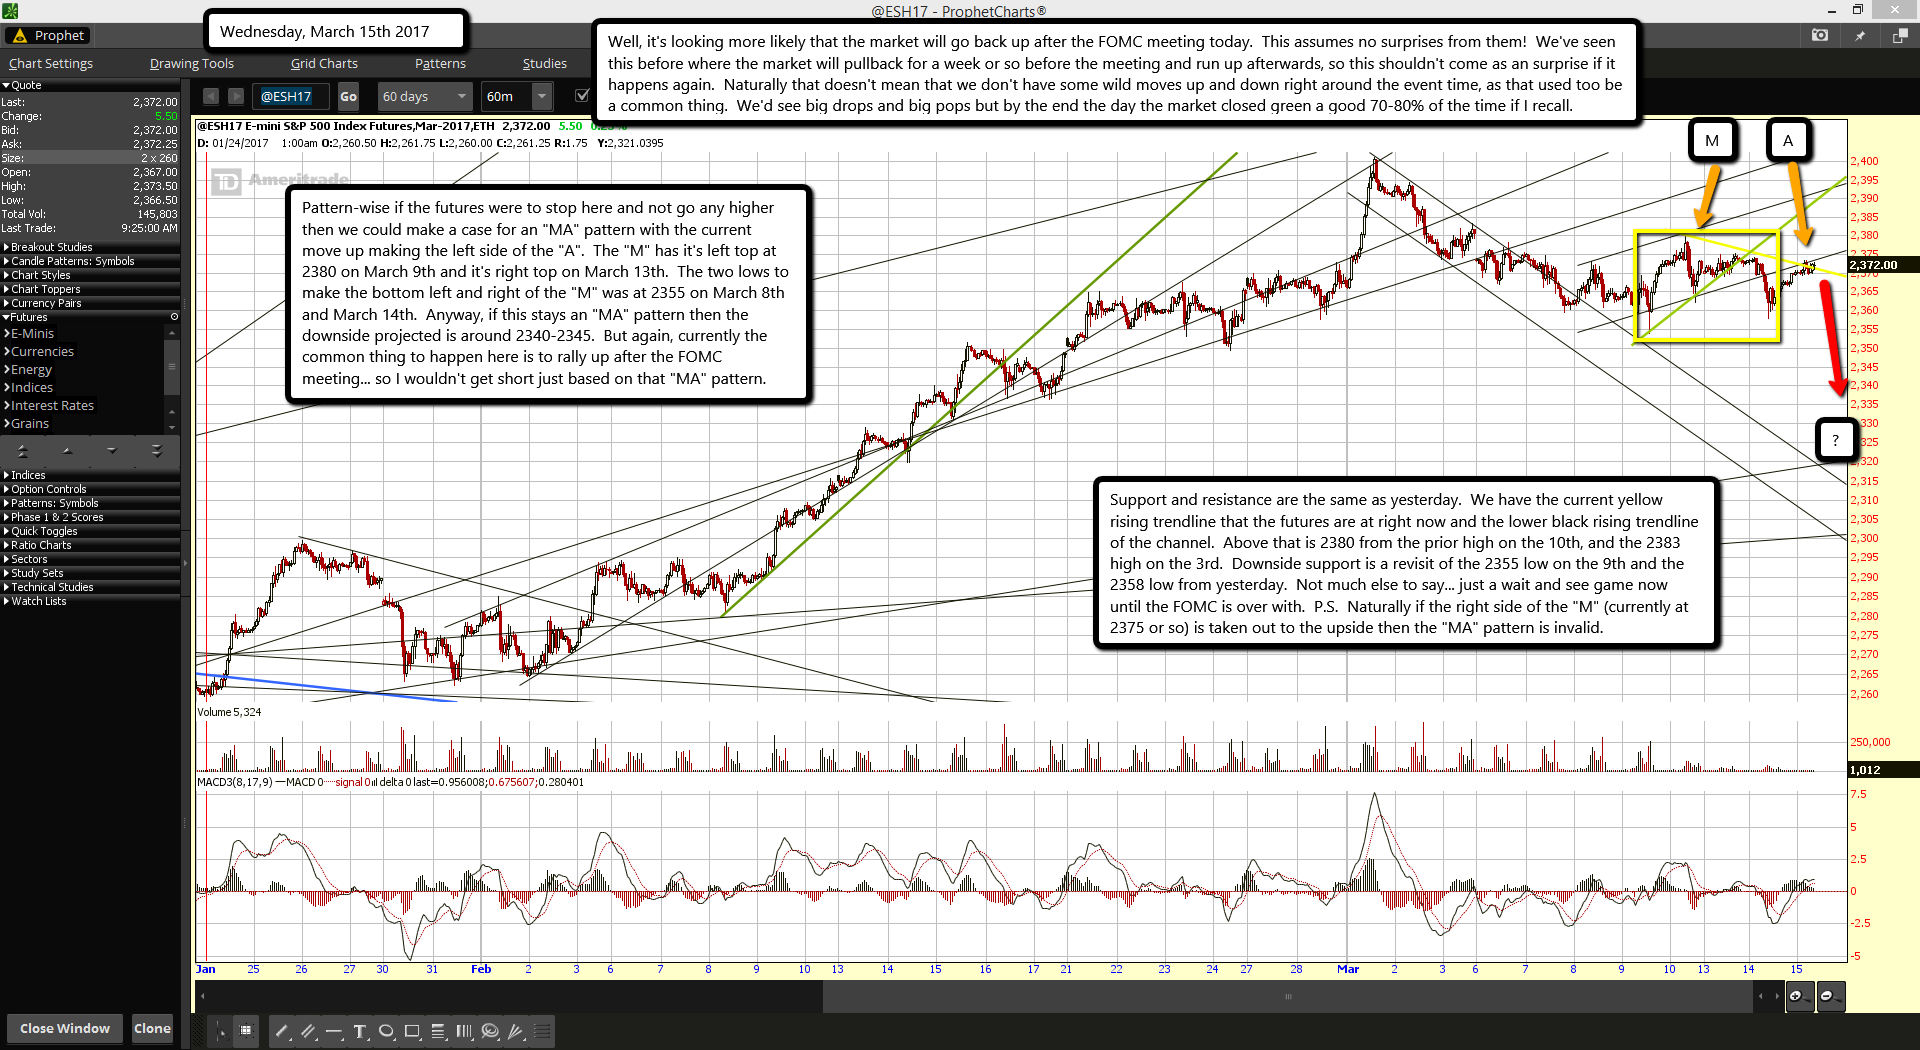
Well, it's looking more likely that the market will go back up after the FOMC meeting today. This assumes no surprises from them! We've seen this before where the market will pullback for a week or so before the meeting and run up afterwards, so this shouldn't come as an surprise if it happens again. Naturally that doesn't mean that we don't have some wild moves up and down right around the event time, as that used too be a common thing. We'd see big drops and big pops but by the end the day the market closed green a good 70-80% of the time if I recall.
Pattern-wise if the futures were to stop here and not go any higher then we could make a case for an "MA" pattern with the current move up making the left side of the "A". The "M" has it's left top at 2380 on March 9th and it's right top on March 13th. The two lows to make the bottom left and right of the "M" was at 2355 on March 8th and March 14th. Anyway, if this stays an "MA" pattern then the downside projected is around 2340-2345. But again, currently the common thing to happen here is to rally up after the FOMC meeting... so I wouldn't get short just based on that "MA" pattern.
Support and resistance are the same as yesterday. We have the current yellow rising trendline that the futures are at right now and the lower black rising trendline of the channel. Above that is 2380 from the prior high on the 10th, and the 2383 high on the 3rd. Downside support is a revisit of the 2355 low on the 9th and the 2358 low from yesterday. Not much else to say... just a wait and see game now until the FOMC is over with. P.S. Naturally if the right side of the "M" (currently at 2375 or so) is taken out to the upside then the "MA" pattern is invalid.
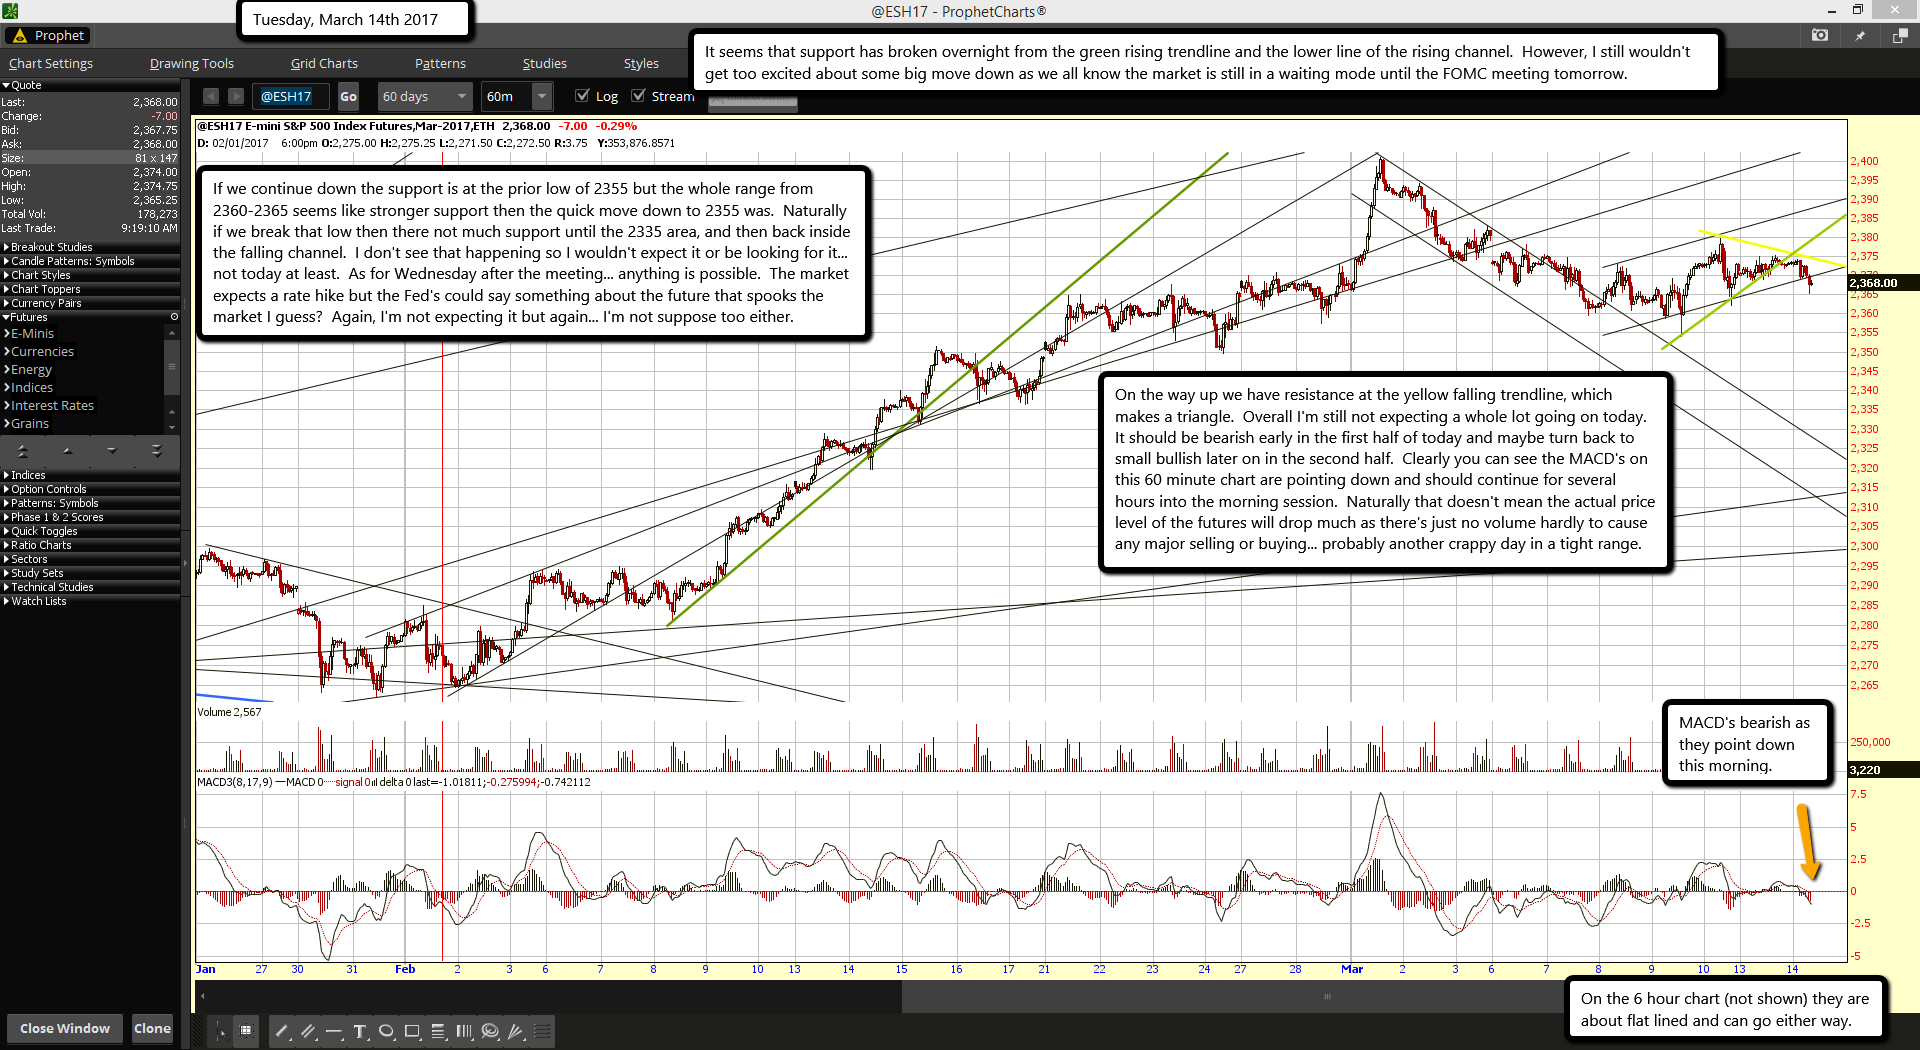
ES Morning Update March 14th 2017
It seems that support has broken overnight from the green rising trendline and the lower line of the rising channel. However, I still wouldn't get too excited about some big move down as we all know the market is still in a waiting mode until the FOMC meeting tomorrow.
If we continue down the support is at the prior low of 2355 but the whole range from 2360-2365 seems like stronger support then the quick move down to 2355 was. Naturally if we break that low then there not much support until the 2335 area, and then back inside the falling channel. I don't see that happening so I wouldn't expect it or be looking for it... not today at least. As for Wednesday after the meeting... anything is possible. The market expects a rate hike but the Fed's could say something about the future that spooks the market I guess? Again, I'm not expecting it but again... I'm not suppose too either.
On the way up we have resistance at the yellow falling trendline, which makes a triangle. Overall I'm still not expecting a whole lot going on today. It should be bearish early in the first half of today and maybe turn back to small bullish later on in the second half. Clearly you can see the MACD's on this 60 minute chart are pointing down and should continue for several hours into the morning session. Naturally that doesn't mean the actual price level of the futures will drop much as there's just no volume hardly to cause any major selling or buying... probably another crappy day in a tight range.