Wendy's is investigating "unusual activity" related to cards used in some of its restaurants.
The fast food chain launched an investigation after being alerted this month by the payments industry to possible fraudulent charges being made "elsewhere after payment cards were legitimately used at some restaurants," said spokesman Bob Bertini.
Wendy's is working with cybersecurity experts, payment industry contacts and law enforcement to look into the possible fraud. It's unclear how many cards or restaurant locations may have been affected.
"Until this investigation is completed, it is difficult to determine with certainty the nature or scope of any potential incident," Bertini said.
The possible security breach was first reported Wednesday by Krebs on Security.
Toyota on Wednesday kept the title of world’s biggest automaker for the fourth straight year after saying it sold 10.15 million vehicles globally in 2015, driving past Volkswagen and General Motors.
Dented by a pollution-cheating scandal, Volkswagen earlier logged sales of 9.93 million vehicles worldwide, while Chevrolet and Cadillac maker GM moved 9.8 million last year.
Toyota shares jumped 3.80% to end at 6,881 yen ($58) in Tokyo on Wednesday, boosted by reports it is in talks with Suzuki over a partnership to build compact cars for emerging markets, including India.
Strong North American demand drove Toyota’s figures as total sales slipped 0.8% from 2014, largely owing to a slowdown in Japan where a weak economy hit demand.
Toyota is also facing sluggish sales in Thailand and Indonesia while a Japanese consumption tax hike planned for next year could spark a rush in buying -- and subsequent slowdown as prices go up.
The Japanese giant was likely to keep the top automaker crown for at least another year, but a slowdown in top vehicle market China could hurt its numbers, analysts said.
“Toyota is benefiting from the strength of the US auto market, and we expect it to continue to grow this year, so the company should keep its crown,” said Yoshiaki Kawano, a Tokyo-based analyst at research firm IHS.
“But in China, Toyota lags behind VW or Nissan”.
In the first half of the year, the German giant, whose other brands include Porsche and Audi, was set to become the world’s biggest automaker as it rode momentum in emerging economies.
But then it posted its first drop in annual sales for more than a decade, as the company was hammered by a massive pollution cheating scandal.
Volkswagen was sideswiped by stunning revelations in September that it had fitted 11 million vehicles with devices designed to dodge pollution tests.
This file picture taken on August 8, 2014 shows employees of Toyota Motor's subsidiary Toyota Motor Kyushu checking Lexus vehicles on an assembly line at the Miyata Plant in Miyawaka, Fukuoka Prefecture.
(AFP)
The US government has said it was suing VW for $20 billion in civil penalties over the scandal.
Quality issues
Toyota broke GM’s decades-long reign as the world’s top automaker in 2008 but lost it three years later to the US firm, as Japan’s 2011 earthquake-tsunami disaster dented production and disrupted the supply chains.
However, in 2012 it once again overtook its Detroit rival and has remained on top since.
On Wednesday, rival Nissan said its global sales hit a calendar-year record 5.42 million units. Including Nissan’s French partner Renault, the group’s 8.22 million combined sales put it in fourth place globally.
South Korea’s Hyundai sat in fifth spot with 8.01 million vehicles sold.
Toyota’s upbeat announcement comes despite the firm struggling to recover its reputation for safety after the recall of millions of cars around the world for various problems in recent years, including an exploding air bag crisis at supplier Takata.
Visitors check out Toyota Vitz at a Toyota showroom in Tokyo on Wednesday.
(AP)
At least 10 deaths globally and scores of injuries have been linked to the faulty airbags fitted in cars made by some of the world’s leading auto giants.
Toyota, maker of the Camry sedan and Prius hybrid, had stopped building new plants for several years, and turned its focus to quality rather than sales volume.
The company is also overhauling its production methods, vowing to slash development costs to try to offset any downturn in the market and squeeze more productivity out of existing plants.
Toyota is pushing further into the fast-growing market for environmentally friendly cars, especially in China where officials are struggling to contain an air pollution crisis.
It has also released its first mass-market hydrogen fuel-cell car, the Mirai, and redesigned the top-selling Prius.
Volkswagen’s new chief executive, meanwhile, has said his firm was abandoning its ambition to become the world’s biggest carmaker.
“For me, this obsession with unit sales and the ambition to constantly reach new records makes no sense,” Matthias Mueller told the weekly WirtschaftsWoche in an interview published in December.
“I’m not going declare sheer size as an end in itself.”
His predecessor Martin Winterkorn had focused on VW overtaking Toyota as the world’s biggest carmaker by 2018.
NEW YORK — The machines are definitely getting smarter.
JPMorgan Chase said it is upgrading its entire fleet of ATMs this year to include several new perks — including the option to withdraw money using a smartphone.
The first phase of the rollout will let customers withdraw cash from a Chase ATM using a one-time pin number that will be sent to their smartphones, said JPMorgan spokesman Michael Fusco.
In the second phase, customers will be able to withdraw cash simply by tapping their phones to the ATM, using the same technology that enables Apple Pay and other payment apps, Fusco said.
"This is not replacing debit cards, just giving customers another convenient option if they do not have their debit card with them," Fusco said in a statement.
The ATM upgrades will provide other perks, including:
► Withdrawals of up to $3,000 on ATMs located inside branches and during branch hours.
► The ability for customers to choose a custom withdrawal amounts. Rather than multiples of $20’s, a customer may request $48 and receive it in the form of one $20, four $5’s, and eight $1’s.
► Check cashing via ATM.
► By the end of 2017, customers will also be able to make their Chase credit card and mortgage payments at the ATM.
The changes comes as Chase's monthly ATM transactions outpace the number of teller transactions in its branches, and as JPMorgan has been cutting costs, including staff, to boost profits.
JPMorgan has ATMs at more than 1,500 branches.
The bank is aiming to increase the number of teller transactions processed by ATMs to 90% from a current rates of 60% by the end of 2016.
Follow USA TODAY reporter Kaja Whitehouse on Twitter: @kajawhitehouse
2015 was a mixed year for FCA. Jeep sales soared past 1.2 million and the automaker continued to earn profits in North America. But sales fell sharply in Brazil and troubles emerged in China.
Fiat Chrysler Automobiles on Wednesday said it earned a profit of $2.2 billion in 2015 (2.03 billion euro) when Ferrari is included but that number drops to just $410 million (377 million euro) when results from the exotic sports car brand are removed -- illustrating why the automaker's stock has dropped since the start of the year when Ferrari was spun off into a separate brand.
FCA's profits soared 91% when Ferrari is included from $1.15 billion in 2014 but dropped by 40% from $687 million in 2014 when Ferrari is included because of higher recall costs and one-time charges related to a plan to realign the company's capacity in North America. Details about that plan will be announced later today.
The automaker took a charge of $906 million (834 million euro) during the fourth quarter to cover costs related the realignment of its North American production and a charge of $827 million (906 million euro) related to higher recall costs.
FCA's stock has dropped about 45% from $13.99 per share on Dec. 31 to $7.61 per share on Tuesday. The automaker officially spun off Ferrari into a separate company at the start of the year.
The automaker also said its total revenue increased 18% to $120 million (110.6 billion euro) in 2015 compared with $101.7 billion (93.6 billion euro) in 2014 as sales of its Jeep brand continued to soar globally.
2015 was a mixed year for FCA as the automotive industry thrived in North America but economic woes hit Brazil and China.
FCA continued to be profitable in the U.S. where industry sales hit a historic high of 17.47 million and the Auburn Hills automaker kept its sales streak alive with 67 consecutive months of year-over-year sales gains.
Globally, FCA sold more than 1.2 million Jeeps as the rugged SUV brand continued to be the automaker's best selling brand. Jeep's sales gains were helped by the launch of the Renegade -- a compact SUV -- in Brazil, Europe and the U.S.
Higher Jeep sales helped FCA sell a total of 4.61 million new cars and trucks in 2015, up slightly from 4.61 million in 2014. However, FCA fell short of the 4.8 million vehicles it thought it could sell for the year.
Wall Street also focused attention on Marchionne's thesis, announced in April, that the automotive industry must consolidate through mergers to deal with rapidly rising product development, regulatory and technology costs.
FCA revealed the Alfa Romeo Guilia sedan in Milan in June as part of a plan to relaunch the Italian premium brand globally. But the Guilia has yet to go on sale and FCA is planning to overhaul its plan for the brand. Maserati's relaunch got off to a good start in 2014 but its sales fell 22% over the first nine months of 2015.
For those and other reasons, FCA is expected to also unveil an overview of its five-year plan today.
In 2014, Marchionne said FCA would spend $52 billion (48 billion euro) over five years in his quest to boost annual sales of cars and trucks from 4.6 million in 2014 to 7 million by 2018.
Contact Brent Snavely: 313-222-6512 or bsnavely@freepress.com. Follow him on Twitter @BrentSnavely.
Read or Share this story: http://on.freep.com/1RNdXOp
[ad_2]
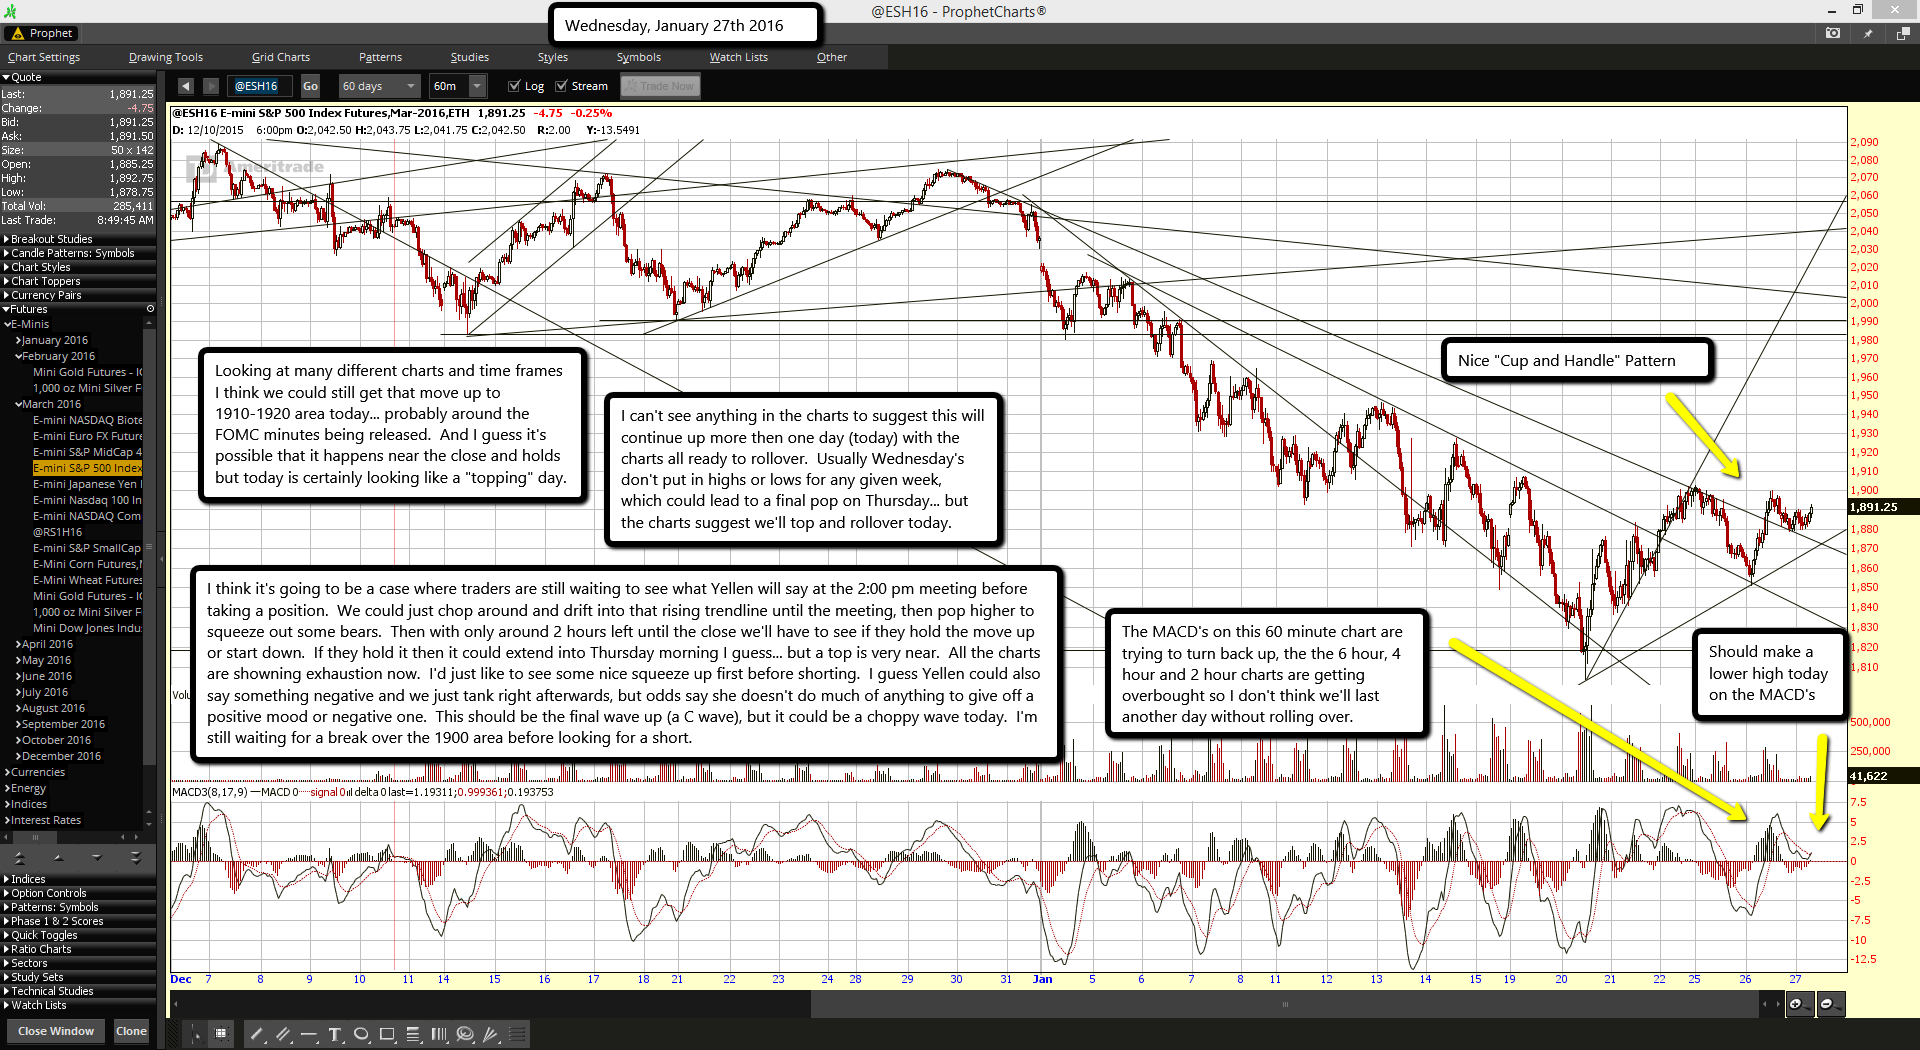
Nice "Cup and Handle" Pattern. Should make a lower high today on the MACD's.
The MACD's on this 60 minute chart are trying to turn back up, the the 6 hour, 4 hour and 2 hour charts are getting overbought so I don't think we'll last another day without rolling over.
Looking at many different charts and time frames I think we could still get that move up to 1910-1920 area today... probably around the FOMC minutes being released. And I guess it's possible that it happens near the close and holds but today is certainly looking like a "topping" day.
I can't see anything in the charts to suggest this will continue up more then one day (today) with the charts all ready to rollover. Usually Wednesday's don't put in highs or lows for any given week, which could lead to a final pop on Thursday... but the charts suggest we'll top and rollover today.
I think it's going to be a case where traders are still waiting to see what Yellen will say at the 2:00 pm meeting before taking a position. We could just chop around and drift into that rising trendline until the meeting, then pop higher to squeeze out some bears. Then with only around 2 hours left until the close we'll have to see if they hold the move up or start down. If they hold it then it could extend into Thursday morning I guess... but a top is very near. All the charts are showing exhaustion now. I'd just like to see some nice squeeze up first before shorting. I guess Yellen could also say something negative and we just tank right afterwards, but odds say she doesn't do much of anything to give off a positive mood or negative one. This should be the final wave up (a C wave), but it could be a choppy wave today. I'm still waiting for a break over the 1900 area before looking for a short.
Volatile stock and oil markets have some investment strategists looking for the Federal Reserve to step in with a balm Wednesday by signaling more modest rate hikes this year than it had previously planned.
But economists say the Fed is likely to acknowledge the recent global and market turbulence without indicating a change in course, especially with the U.S. labor market continuing to turn in blockbuster job growth.
“They don’t want to tip their hand one way or another because they don’t know,” says Michael Gapen, chief U.S. economist of Barclays and a former Fed staffer.
Futures markets are giving virtually no chance the Fed will raise its benchmark interest rate after a two-day meeting that began Tuesday, but analysts will be scouring its post-meeting statement for clues on the future path of rate increases.
Last month, the central bank lifted its federal funds rate by ¼ percentage point, its first hike in nearly a decade, and projected it will continue to raise rates gradually, by another percentage point this year. Fed policymakers attributed the relatively gentle approach to persistently low inflation, weakness overseas and lingering, postrecession headwinds to growth.
Economists figured that rough blueprint called for the next ¼ point rate increase in March, with three more similar hikes in 2016.
So far this year, however, the news on China’s economic slowdown has gotten only more dire, oil prices have tumbled further on fears of weakening global demand, and stocks are down about 6%, even after a rally that began last week. The dollar, meanwhile, has continued to strengthen, a development that could further hamper exports and economic growth while pushing down inflation.
By impeding growth, business investment and hiring, Morgan Stanley reckons, these developments already have had the effect of four rate hikes. The Fed raises rates to cool off an accelerating economy that poses the risk of excessive inflation.
Noting that some Fed policymakers viewed the December rate increase as a close call, “the bar for an additional hike in March seems insurmountable now,” Morgan Stanley wrote in a research note.
Money Manager Patrick Adams of Choice Investment Group wrote to clients that the Fed on Wednesday “should have some serious back-peddling regarding the outlook for the economy and expected interest rate increases.”
But while Morgan Stanley agrees that a March move is now unlikely, it adds that “it is too early (for the Fed) to admit defeat.”
Gapen is more bullish. He still believes the Fed will hoist rates again in March as the healthy job market more than offsets a weak global economy, strong dollar and falling oil prices, which have hammered manufacturers and business investment.
Employers have added an average 284,000 jobs a month since October, and many economists believe the falling unemployment rate -- now a near-normal 5% -- will soon spur faster wage growth and inflation. Consumer spending, which accounts for 70% of economic activity, also has picked up this year, notwithstanding a recent dip.
Gapen expects the government to report Friday that the economy grew a meager 0.5% at annual rate in the fourth quarter, but he predicts a rebound to 2.5% growth in the current quarter.
How will the Fed convey the wait-and-see message that many economists anticipate?
Goldman Sachs’s David Mericle believes Fed policymakers will acknowledge the new economic minefields by noting they’re “monitoring global economic and financial developments.” He predicts the Fed will add that risks to its outlook are now “nearly balanced” instead of “balanced.”Such language also “avoids shutting the door to a March hike,” he wrote in a research note.
Economists also expect the Fed to tone down its previous assessment of the economy while keeping its upbeat view of the labor market.
Although some analysts believe a gloomier statement could goose stocks by suggesting more gradual rate increases, Gapen says it could have the opposite effect by raising fears of a weakening economy. That’s what happened in September, he notes, when the Fed put off its first rate hike amid troubles overseas and in financial markets.
U.S. stocks, still searching for stability after yesterday's sell-off and a rocky start to the new year, surged Tuesday as volatile oil prices climb 6% and move back above $32 a barrel and Wall Street shrugs off another stock rout in China overnight.
Investors were encouraged by a batch of better-than expected corporate earnings reports as several companies in the Dow Jones industrial average beat estimates, including 3M (MMM), Johnson & Johnson (JNJ) and Procter & Gamble (PG).
The Dow was up about 280 points, or 1.7%, in afternoon trading and is on track for its best one-day point-gain since Dec. 4. The Standard & Poor's 500 stock index gained 1.4% and the Nasdaq composite was 1.3% higher.
Stocks also got a lift from some solid economic data, with November home prices up 0.9% in November, topping forecasts, according to S&P Case Shiller. January consumer confidence also topped expectations, hitting a level of 98.1, above December's reading of 96.3. The strong reading on consumer confidence suggests consumers have not been totally freaked out by the financial markets' wild gyrations in 2016.
Phil Orlando, chief investment strategist at Federated Investors, says the rally has been fueled by the rebound in oil prices, solid earnings and good economic data. But he believes the big reason for the rally is that Wall Street is betting that the Federal Reserve will signal Wednesday at the end of its two-day policy meeting that it may have to dial back its plans for four interest rate hikes this year due to market and economic volatility to kick off 2016.
Orlando expects Fed chair Janet Yellen to use the policy statement to "reset market expectations" for fewer coming rate hikes this year.
"We believe a March rate hike is off table and that the Fed will take a more cautious, dovish and data-dependent approach to its rate-hike cycle over the course of the year," Orlando told USA TODAY.
The turbulent year for stocks continues amid a jittery trading environment in which stock movements are increasingly tied to the direction of oil prices, the global economic outlook in the face of slowing growth in China and uncertainty over interest rate policy at home.
U.S.-produced crude rebounded Tuesday and was up 6% to $32.23 a barrel in afternoon trading. Oil, which rallied sharply late last week, relapsed Monday, tumbling more than 5%.
Investors were again digesting a big market sell-off in mainland China, where the Shanghai composite fell 6.4% to its lowest level since December 2014.
Wall Street is also eagerly awaiting the policy statement on interest rates from the Federal Reserve, which will be released Wednesday at 2 p.m. ET at the end of the Fed's two-day January meeting. Investors will be closely looking for any clues that the Fed might suggest the U.S. central bank will be less aggressive on interest rate hikes this year than originally planned due to the persistent volatility in the energy and stock markets around the globe.
When the Fed hiked short-term rates a quarter-point in December for the first time in nearly a decade, it forecast four more quarter-point moves this year. But Wall Street is pricing in one at the moment.
The fourth-quarter 2015 earnings season rolls on today, with Apple, the world's most-valuable company reporting results after the bell.
In Europe, stocks were off their earlier lows and closed higher. The broad Stoxx Europe 600 finished up 0.8%, the German DAX rallied 0.9% and the CAC 40 in Paris finished up 1.1%.
Wang Baoan, the chief of China’s National Bureau of Statistics, at a news conference last week. Credit
European Pressphoto Agency
HONG KONG — The veracity of China’s economic data has been increasingly questioned as the slowing pace of the country’s growth has startled the world. And a new investigation into the official who oversees the numbers is unlikely to inspire confidence.
The Communist Party’s anticorruption commission announced late Tuesday that it was looking into the head of the country’s statistics agency over what it called “serious violations.”
It is unclear whether the investigation into the agency’s head, Wang Baoan, who became the director of the National Bureau of Statistics of China last April, is related to his current role or to his previous one as vice minister of finance. The commission did not release any further details about the inquiry.
The investigation comes at a delicate time for China, as the country’s shrinking manufacturing sector and falling stock market have unnerved global investors. Any further doubt about its economic figures could paint an even darker picture of the health of the economy, adding to the pain in the markets. Stocks in Shanghai, which closed before the announcement, were off 6.4 percent on Tuesday.
China’s economy is faltering, prompting concerns that are now shaking global stock markets.
OPEN Graphic
The statistics bureau has a variety of responsibilities that are hard to balance even in the best of times.
The bureau is supposed to provide China’s leaders with an unvarnished assessment of the country’s economic strengths and weaknesses, even while reassuring the public about growth and maintaining consumer confidence. It is also supposed to release enough detailed and accurate information for investors and corporate leaders to make sound decisions about economic and financial prospects.
Few doubt that China has grown enormously over the past three decades. But economists, bankers and analysts who study the numbers believe that the bureau smooths data, underestimating growth during economic booms and overestimating it during downturns.
Many economists are worried that China’s economy is not expanding anywhere close to the nearly 7 percent annual pace that bureau data still show. By some estimates, the pace is half of the official figures.
Those skeptical about the data point, in part, to the underlying numbers.
For example, electricity consumption, long a barometer of economic health and of the veracity of economic statistics, was nearly unchanged last year instead of rising in line with growth in China’s gross domestic product. Some have cited the lack of correlation as a sign of possible fudging in the country’s economic statistics, while optimists have said that the figures may show how China is shifting away from energy-intensive manufacturing.
State news media reported last month that several officials in northeastern China had admitted to inflating investment figures and other data in previous years. Such moves, the reports indicated, helped explain steep drops in reported data from the region last year.
Still, the bureau has consistently and repeatedly defended its statistics, contending that critics do not adequately understand the data or the Chinese economy. And the market impact of the investigation could be limited by the fact that many were already wondering about China’s data.
“The international credibility of China’s G.D.P. figures is anyway very low, so this probably is not a severe blow,” said Diana Choyleva, the chief economist and head of research at Lombard Street Research, an economic analysis group in London. Lombard estimates that China’s gross domestic product grew 3.2 percent last year, not the 6.9 percent that the National Bureau of Statistics claims.
The reliability of China’s economic data goes to the heart of the market’s concerns.
At the official rate, China grew last year at the slowest pace in 25 years. The government is trying to manage a slowdown, without letting the pain create social unrest.
That can make it hard to discern what’s really happening in the economy. Among other problems, it has a glut of old-line factories that make products like steel, glass and cement. That industrial overcapacity stems from years of debt-financed investment in industries that now show little sign that they can repay those loans.
Beijing is trying to rebalance its economy to focus more on consumer spending and services. But concerns about the pace of change play into the worries about the data.
Take the steel industry.
China produced 804 million tons of steel last year, even as demand faltered. Over all, China’s steel-making capacity was set to reach 1.17 billion tons last year, according to estimates from Fitch Ratings.
The government is taking steps to work through some of the excess. The country’s State Council, or cabinet, decided on Sunday that it would close 100 million to 150 million tons of steel-making capacity. That would mean cutting capacity by an amount similar to the total annual steel output of Japan, the world’s No. 2 steel maker.
The State Council decision, which was released on Monday, also called for large reductions in coal-mining capacity, without providing a target figure.
But it is a balancing act for the Chinese authorities.
Li Xinchuang, the head of the China Metallurgical Industry Planning and Research Institute, told the official Xinhua news agency that the planned steel mill closings could cost 400,000 jobs. “Large-scale redundancies in the steel sector could threaten social stability,” he warned.
The disjointed attempts of policy makers to manage the stock markets and the currency are only adding to skepticism about the economy.
The outflows of capital reflect the uncertainty about the direction of the currency — and about the broader economy. Excluding foreign investment, capital outflows probably rose to as much as $900 billion in 2015, economists at Standard Chartered wrote on Tuesday in a research note.
In response to the outflows, China’s central bank, the People’s Bank of China, has been eating into its reserves at a record pace in recent months. The central bank is trying to prop up the value of the Chinese currency, the renminbi, which is under pressure as the country’s growth prospects weaken.
The situation is forcing the central bank to pump more money into the system, to help banks keep lending. On Tuesday, the central bank added 440 billion renminbi, equivalent to about $67 billion, to its financial system, according to an announcement on its website.
It is all making for messiness in the markets. After the fall on Tuesday, Chinese stocks were at their lowest level in 13 months.
Shares of Sprint surged Tuesday after the wireless carrier boosted guidance for the current quarter and reported smaller losses and more postpaid customers during the third quarter.
As of morning trading, Sprint jumped 9% after reporting third quarter results, saying they added the most postpaid customers in three years.
For the quarter, Sprint reported operating losses of $197 million, well below the $2.5 billion posted during the same quarter last year. Sprint reported revenue of $8.107 billion, short of estimates.
But it was Sprint's fiscal year guidance that swayed Wall Street. The carrier bumped up revenue forecasts from $6.8-$7.1 billion to $7.7-$8 billion. The company also forecast fiscal year 2016 revenue as high as $10 billion.
Sprint CEO Marcelo Claure says stable revenue and a sharp drop in churn among wireless customers contributed to the quarter. "It’s clear from our quarterly results that we are making great progress on achieving our goals," said Claure in a statement.
On Monday, Sprint confirmed it has cut more than 2,500 jobs since last fall, as the company plots a turnaround. AT&T and Verizon dominate the wireless market, while T-Mobile surged past Sprint with its lineup of "Uncarrier" mobile plans.
Maybe you've had a soul-sucking commute for years. Or maybe you just log way too many long days away from your family and faithful hound.
So no wonder you'd love to find a comparable job with benefits that lets you work from home.
The good news: That's now a real possibility at many companies, large and small.
FlexJobs, a job board for those seeking telecommuting, remote or freelance work, just released its annual list of the top 100 companies that are hiring.
The vast majority of them offer the most full-time telecommuting jobs of any employer in FlexJobs' database, which has 40,000 companies.
Among the top 20 are UnitedHealth Group, Dell, IBM, Aetna, PAREXEL and SAP.
The jobs run the gamut from senior- and mid-level management positions to mid-career non-management posts as well as entry-level opportunities.
And they exist in several fields, including IT, health, sales, education and marketing.
Some of the most common job titles that are hired for telecommuting are writer, engineer, project manager, IT analyst and sales representative.
Who's hiring now?
A full 30% of North American employees at SAP, the enterprise application software maker, telecommute full time. Right now the company is looking for a vice president to develop sales plans for its banking industry products.
That new VP will likely report to the head of the financial services division, who himself telecommutes from Maryland, even though the hub for that division is New York.
The growth in telecommuting at SAP has been fostered not only by technological innovation but by the growth of global teams. So even though the company has an office in Palo Alto, California, it may make more sense for a developer who lives there to telecommute anyway, if her whole team is based abroad.
"Why go through the rigors of the commute?" said Jewell Parkinson, head of human resources for SAP North America.
At health insurer Aetna, meanwhile, 47% of employees telecommute for either some portion of the week or full-time. The company is on the hunt for a doctor to serve as a full-time medical director. The job involves providing clinical expertise, offering case management consultation, and leading clinical improvement projects among other responsibilities.
At PAREXEL, a biopharmaceutical services provider, 40% of its North American employees telecommute at least a day or two a week, if not every day. The Boston-based firm is on the hunt for a project manager in the Midwest to work from home full time.
It's not surprising that PAREXEL -- or any other employer -- requires a telecommuting hire to live in a given area. Yes, often the promise of a telecommuting job is that you can live wherever you want and your employer can seek out the best talent wherever they live. But there could be several reasons why they would restrict the search to certain states or regions. Among them, clients you'll be working with may be located in that area, you may be required to report to meetings a few times a month at a regional office, or your employer may only process employment taxes in certain states.
To make FlexJob's list, the companies seeking out telecommuters had to post at least 100 job openings for them in 2015, but those at the top typically posted thousands.
Here are the top 20 companies that have posted the most full-time telecommuting jobs:
1. UnitedHealth Group
2. Dell
3. IBM
4. Humana
5. Aetna
6. Kelly Services
7. Salesforce
8. PAREXEL
9. CyberCoders
10. VMware
11. SAP
12. First Data
13. Xerox
14. Oracle
15. A Place for Mom
16. CACI International
17. ADP
18. Dell SecureWorks
19. Allergan Inc.
20. Anthem
CNNMoney (New York) First published January 26, 2016: 9:24 AM ET
SEATTLE -- As part of a broad brand update, Alaska Airlines on Monday unveiled a makeover for the company’s logo and iconic Eskimo face that has been on the tail of the carrier’s airplane fleet since the early 1970s.
“We’ve grown tremendously over the past 5 years, adding 90 new markets and 26 new cities, and as we get bigger and go to all to all these new places, we needed a brand identity that was fresh, modern, relevant, but also reflected who were are on the inside,” Sangita Woerner, Alaska’s vice president of marketing, told Today in the Sky.
The change to the logo -- or wordmark is subtle. Basically, it's a streamlining of the capital “A” in Alaska and an overall bolding of the font. Modifications to the Eskimo face are more noticeable and were made, in part, to allow the image to show up better online and on mobile devices.
“The face is essentially the same, but we cleaned up some of the lines,” said Woerner. “We wanted to make sure he was recognizable and that people could still the warmth and kindness in his face.”
To add energy to the image and better reflect all the places Alaska Airlines now flies, the carrier added colors to the fur lining of the Eskimo’s
parka. And those colors have descriptive names to denote the places Alaska flies and the feelings the carrier hopes the image evokes: “tropical green” for destinations such as Hawaii and Costa Rica and “breeze, midnight, atlas and calm” for the flying experience.
“It’s not a revolution, it’s an evolution, is what our customers told us in focus groups,” said Woerner.
The Eskimo face first appeared on the tails of Alaska Airlines' airplanes in 1972. Back then the company had a four-logo paint scheme that included a totem pole, a gold miner, Russian spires (to represent early Russian heritage in Alaska) and a native Alaskan in a fur-lined parka.
The Eskimo became the fleet-wide tail logo in 1976, although in 1988 the carrier considered moving away from the Eskimo to a mountain scene on the tail. That plan was put aside after residents of Alaska objected.
“There was such a sense of pride and commitment, that we decided to keep him and have never wavered from that,” said Woerner.
The first plane with the new wordmark, Eskimo face and refreshed paint theme was introduced Monday afternoon at a meeting of more than 1,800 Alaska Airlines employees in the carrier’s Seattle hangar.
By the end of 2016, more than 40 planes will be painted with the new livery design, including 18 new planes due from Boeing. The rest will get repainted as part of the regular maintenance schedule, said Woerner, “so it will take a few years to get the entire fleet repainted.”
Alaska’s new branding went live Monday afternoon on the airline’s website and mobile app. Passengers traveling through Seattle-Tacoma International Airport on Tuesday morning will see updated branding at Alaska’s gates and in the lobby area. By the end of 2016, the new branding should be in the more than 100 airports where Alaska has operations.
The new branding will be applied to the in-flight magazine, safety cards, menus, food packaging, luggage tags and other items beginning in February.
This spring, Alaska Airlines' elite-level Mileage Plan members will get new cards that reflect the new branding. Woerner also said that “close to the summer” Alaska will change the name of the lounges in Seattle, Portland, Anchorage and Los Angeles from the Board Room to the Alaska Lounge.
Harriet Baskas is a Seattle-based airports and aviation writer and USA TODAY Travel's "At the Airport" columnist. She occasionally contributes to Ben Mutzabaugh's Today in the Sky blog. Follow her at twitter.com/hbaskas.
And the burger chain can largely thank all-day breakfast for that.
The company said that same-store sales in the fourth quarter ended Dec. 31 increased 5.7 percent — the best performance for the chain since its same-store sales rose 8.9 percent in the first quarter of 2012, nearly four years ago.
By comparison, quick-service sandwich chains’ same-store sales rose 2.8 percent during those three months, company executives said Monday. That’s a 2.9-percent gap.
“We’ve regained market share we’ve given up in recent years,” McDonald’s CEO Steve Easterbrook said during the company’s fourth quarter earnings call Monday. “We had good momentum in our business before the quarter began, and it accelerated through the fourth quarter.”
Easterbrook was not ready to declare the turnaround successful, however. He noted that the company needs another six months before it can start shifting its planning toward more long-term growth.
“We had two quarters of growth in our turnaround,” Easterbrook said. “I’d like to see another quarter or two before we move to a longer-term growth plan. By the middle of the year, I’m confident it [will be] the right time to transition to long-term growth plans.”
Indeed, the company said in its earnings filing that it remains focused on generating higher customer counts. For the full year, even despite the strong fourth quarter, customer counts fell 3 percent at McDonald’s. That came after a 4.1-percent decline the year before. Fourth-quarter traffic numbers were not available.
Investors had been expecting a strong McDonald’s report for months — the company’s stock price was up about 10 percent in the weeks preceding the report and had managed to remain flat this year despite an ugly stock market. The company’s stock was up about 2 percent by early afternoon trading and had hit a new 52-week high.
McDonald’s reported same-store sales growth in all of its major segments. But investors had been closely watching U.S. results, where the company has been weak amid intense competition from other burger chains. The company has 14,000 of its more than 36,000 locations in its home market, where it gets more than a third of its revenues.
That home market is slightly smaller now than it was a year ago, too: McDonald’s domestic unit count last year declined by 91 locations, to 14,259 units, from 14,350 restaurants. Overall, however, the company added 267 locations worldwide, to 36,525 units.
The primary driver of domestic sales growth in the fourth quarter came from the company’s decision to start selling a selection of nine breakfast items after 10:30 a.m., answering a demand from customers that dates back years. That also represented arguably the biggest news in the entire quick-service restaurant sector during the period.
The performance of all-day breakfast “exceeded our launch expectations and for a period longer than we anticipated,” Easterbrook said.
Twitter's (TWTR) stock is crashing. Management is in upheaval. But the micro blogging site has one giant thing going for it — $3.5 billion in cash — which buys it lots of time.
Shares of Twitter are down 65 cents, or 3.6%, to $17.19 Monday after CEO Jack Dorsey said four top executives were leaving the company. The stock is now down 68% from its highest point over the past 52-weeks and off 55% over the past year. The stock is indicating a serious situation for the company.
Investors seem to be preparing for the worst — but the company's financial standing indicates it has plenty of time to get things right: 412 years to be exact. Twitter — like many of the most valuable recent technology initial public offerings — has a giant advantage: Cash. And lots of it. The company ended its most recently reported quarter with $3.5 billion in cash and investments, says S&P Capital IQ. If the company only burns $8.5 million a year in free cash — as it did the past 12 months — that's enough cash to last 412 years.
That's a long time for Dorsey to figure things out. It is important to note that Twitter does have $1.4 billion in long-term debt. But the servicing of that debt is already included in the company's free cash flow. Debt could cause issues, though, if the company's interest rate is driven higher when if it looks to refinance in the future.
Twitter is the best example of recent technology and consumer electronics companies with the deep pockets to endure a serious market disruption. Twitter is one of the 39 cash-burning tech and consumer electronics companies that went public the past five years that also have two years or more of cash and investments based on their free cash flow over the past 12 months. Another 65 tech companies that went public the past five years generate free cash flow. There were 113 tech and consumer electronics companies that sold shares to the public over the past five years.
The financial situation shows the interesting disconnect between disastrous stock prices — and the relative strength of the company's cash reserves. Online gaming company Zynga (ZNGA) is another example. Shares of Zynga are down 75% over the past five years — as investors lament the company's uneven growth and perpetual losses. The company has burned $52 million over the past 12 months. But here's the bright spot — the company ended its most recently reported period with nearly $1.1 billion in cash and investments. That would last 20 years at the current burn rate. That gives the company lots of time to find the next FarmVille.
Certainly, some of these companies could increase their burn rates which would reduce their dry powder. Some, too, could use up some of the cash to make acquisition, buy back stock or pay dividends. But with their cash reserves so full — you can see why many aren't breaking a sweat under their hoodies.
RECENT CASH-BURNING TECH AND CONSUMER ELECTRONICS IPOS WITH LARGEST CASH RESERVES RELATIVE TO FREE CASH FLOW *
Company, Symbol, Years of cash left, % ch. from hi (stock)
Twitter, TWTR, 412, -68%
Quotient Techology, QUOT, 264, -66%
FireEye, FEYE, 52, -73%
M/A-Com, MTSI, 36, -8.4%
Rapid7, RPD, 33, -50%
Source: S&P Capital IQ, USA TODAY
* Based on free cash flow
** IPOs over the past five years in tech and consumer electronics
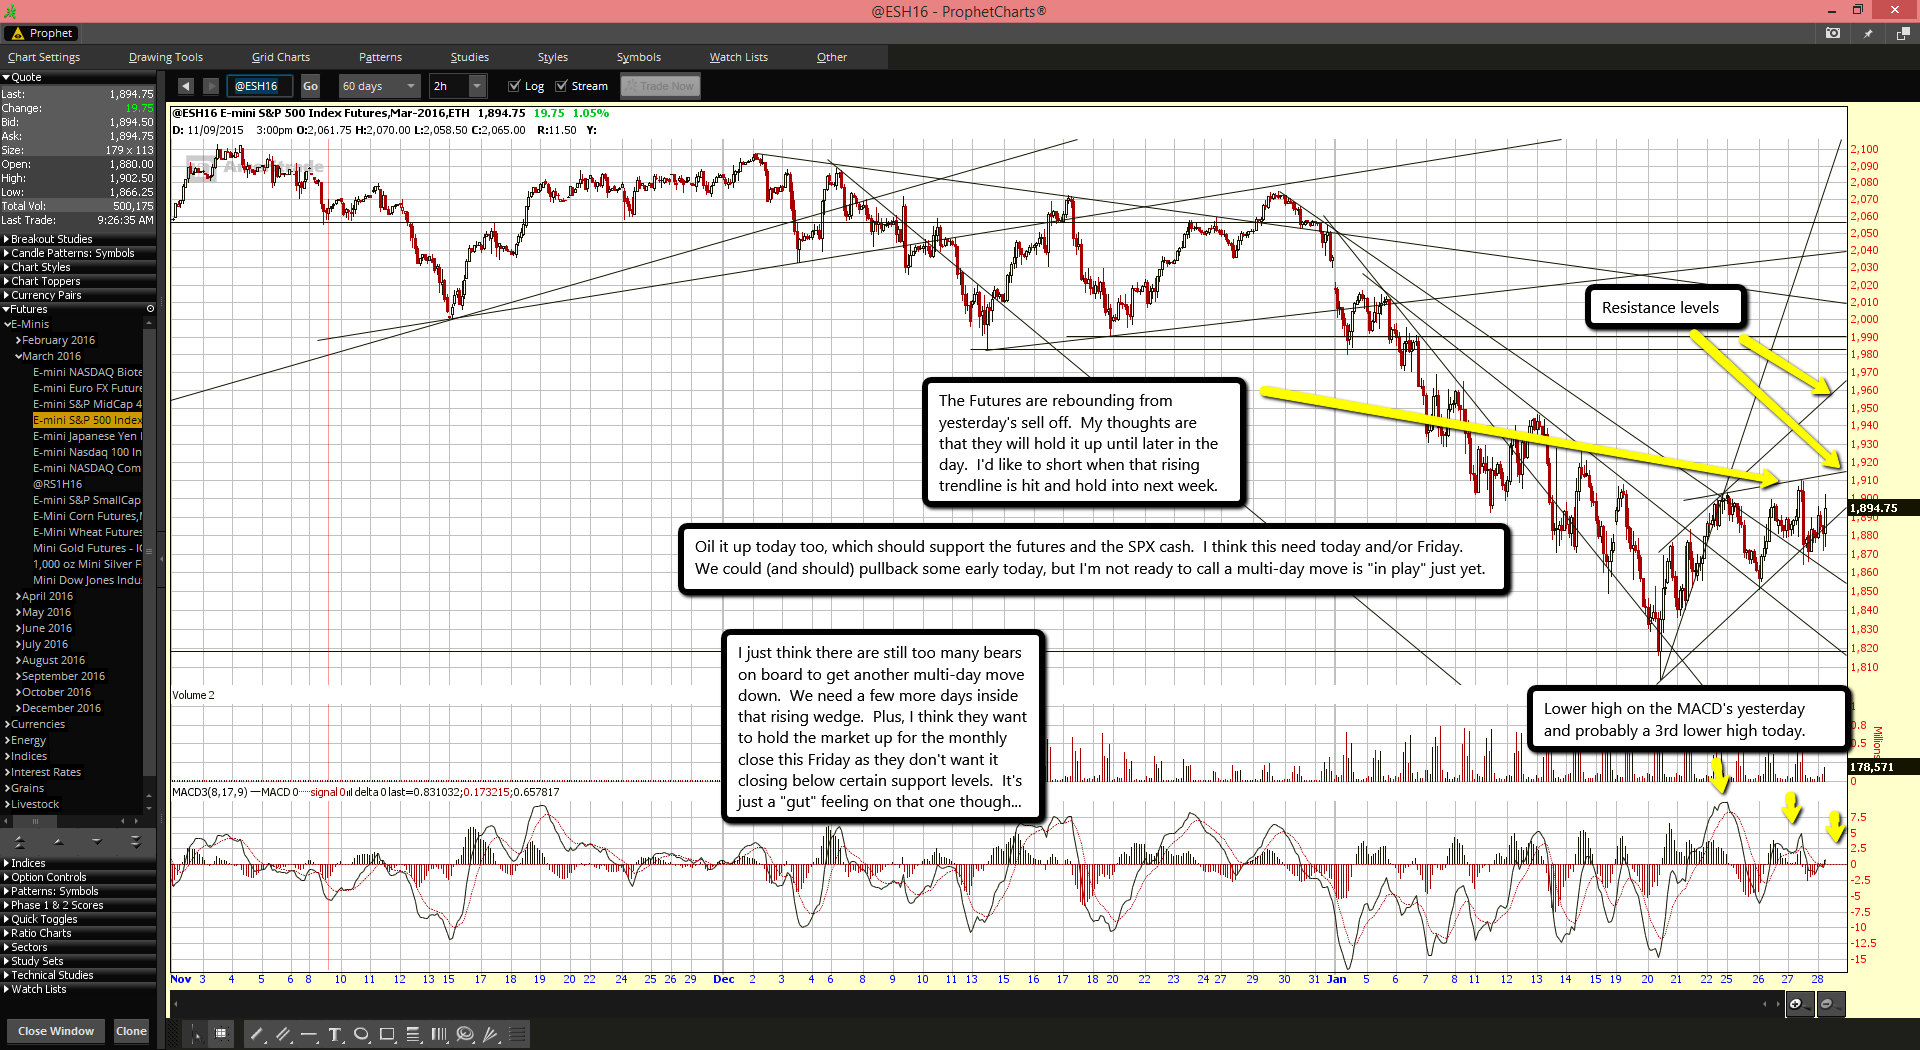
I'm looking for 1905-1910 are on this futures chart to end the ABC move up from the bottom of 1804... then we go down again.
I think we'll see a lower high put in on this 60 minute MACD and at the same time put in a slightly higher high on the futures (then Friday's high).
My thoughts here are to look for a short if we get up to Fridays' high of 1900 up to 1910 as I think that's all we'll see on the upside before rolling back down again. Hopefully we see it today as my calculations for a short entry are based on this happening before the close.
If it can't get through that falling trendline of resistance that stopped the rally Friday and yesterday then we 2 possible scenario's at play.
One is that the high was put in Friday and we start another big move down taking out the current low.
Two is that we drift down on the trendline all day not breaking it and not taking out the 1850 low, which would make a bull flag and allow a gap over it tomorrow in front of the FOMC meeting.
Either way I do see the market taking another move down soon... like within a few days. I don't see this current bottom of 1804 being hit only once and not at least retested before a larger rally starts. Of course if it breaks then the we could really see another big drop as there's not much support until the low 1700 area.
The year 2016 will be a year to remember when it comes to the stock market!
Will it crash? I think so... it fact I think we could see the market drop well below the 2000 and 2007 prior tops on the SPX later this year. Why? Because of "clues" put out by the insiders as to the coming low. Naturally I don't know how to fully read their coded messages as I'm not one of the wolves but just a wise sheep. But they are clearly send out many clues to everyone with their eyes open.
Last year when I told everyone that we'd likely crash on August 24th (2 months in advance) I did so based on many factors. I first seen the technical setup in the charts that suggested we were topping out and should rollover in the fall of that year. Then I counted the wave structure to see what wave count we could be in.
Now while I don't use trust Elliottwave only as a means to forecast the future, it did in this case match up with the technical analysis of the charts at the time. It also matched up with the historical patterns of late August being a weak period in the market.
When calculating the wave structure it suggested that a Primary Wave 4 down would happen in late August, whereas the Primary 2 down happened around the same period in 2011. Then came the coded message... the "Lucy" movie with her passport showing August 24th, 2015 as the expiration date.
The movie was released on July 31st, 2014... just 13 months in front the crash. That's 389 days... or 1 year and 24 days (not including the 24th). Here's the story line:
When a boyfriend tricks Lucy (Scarlett Johansson) into delivering a briefcase to a supposed business contact, the once-carefree student is abducted by thugs who intend to turn her into a drug mule. She is surgically implanted with a package containing a powerful chemical, but it leaks into her system, giving her superhuman abilities, including telekinesis and telepathy. With her former captors in pursuit, Lucy seeks out a neurologist (Morgan Freeman), who she hopes will be able to help her.
The movie is similar in natural to another movie called "The Matrix", which again... tells us sheep that we living a world that isn't real. It's just a 3 dimension program where we take a physical form as a human body, but are true self is just an immortal spirit. I think the Bible tells the same message, but most people still don't it.
The Matrix movie also had a passport in it, and it had September 11th, 2001 as the expiration date. It was released on March 31st, 1999... which is 2 years, 5 months, and 11 days (895 days) before the 9/11 event happened (not including the 11th). That's 2 movies with dates on passports foretelling something bad happening on those dates.
Coincidence? I think not. "They" have been telling us sheep for decades what they plan to do, and when it's scheduled to happen. It's coded of course and most of us don't see it in advance.
So, here we are again with several new movies scheduled to come out soon... that again, should have clues in them for the insiders to read that will tell the future in advance. First we have the movie called "The Fifth Wave"...
It's coming out January 22nd, 2016 (which means it already out now as I'm doing this post). If I add 389 days to it I get February 14th, 2017. If I add 895 days to it I get July 5th, 2018. I'm sure there will be clues in the movie for all to see... but spotting them is sometimes hard. It might not be on a passport this next time around?
But if it repeats the Lucy movie pattern we could see some important event on the 15th of February in 2017. Maybe that will be a bottom in the market the 666 low on March 9th, 2009 was? Or if it's more like the Matrix movie it could be a devaluation in the currency on July 6th, 2018 as suggested on this old cover of the Economist magazine from January 1988.
It's it strange to see a coin with 2018 on it? There will be clues in the movie called "The Fifth Wave" for sure... but I can't say for certain that I'll catch them. So I'll need your help as loyal readers of this blog to assist me in spotting them all. Just post a comment on this post if you see something valuable.
Time between movie releases and events...
Those time periods in days between each movie could mean nothing of course, as both movies weren't even close. So I don't expect any new movie to have any similar pattern either. The only thing to note is that the time period between the release of the movie and the event foretold in the movie seems to be speeding up.
So while the movie called "The Matrix" took 895 days the movie called "Lucy" took much less... only 389 days. Doing simple math it says that the Lucy movie was only 43.46% of the same time length of The Matrix movie. If you take 43.46% of 389 days you get 169 days... which would July 9th, 2016 using the January 22nd, 2016 release of the movie called "The Fifth Wave".
Now that means nothing really as the coded messages are "in the movie" and I can't just do simple math to predict some future date based on one correlation between the two movies called The Matrix and Lucy. No, we have to look closely in the movie to see if they tell us any dates... and again, I'll need your help on that as I'm only one person.
Moving on to the next new movie...
We have another interesting movie coming up called "Money Monster", with George Clooney and Julia Roberts in it. Here's the story line:
Lee Gates is a bombastic TV personality whose popular financial network show has made him the money wiz of Wall Street. But after he hawks a high tech stock that mysteriously crashes, an irate investor takes Gates, his crew, and his ace producer Patty Fenn hostage live on air. Unfolding in real time, Gates and Fenn must find a way to keep themselves alive while simultaneously uncovering the truth behind a tangle of big money lies.
Sounds to me like a story about Jim Cramer as we all know how crooked that guys is. He's paid to lie to use sheep every day to get us to buy stocks at the top and to sell at the bottom as the insiders take the opposite side of our trade.
I would miss that crook either if he was held hostage for real... LOL!
Money Monster... coming May 2016
I find the old "one eye" an obvious message to the insiders that this movie will have coded information in it. I guess it's supposed to look like the eye on the dollar bill but I think it's also meant to portray reptilian aliens, as they all worship these demon creatures.
Anyway, with the movie set to come out in May we could see a top in the market it that period if my calculations are correct? From a technical point of view, adding in wave counts, and historical data, a top should happen between late May and early June of this year.
Short term though we could have already bottomed on January 20th, but only for a bounce I think as I do see another wave down to follow, and it should end in March. Then a 2-3 month rally into May/June before all hell breaks loose.
Let's look at the charts now...
This monthly chart shows us how similar this pattern is when compared to the 2000 and 2007 tops and crashes. The 10 and 20 month MACD's for each period crossed and the market dropped for several months, then rallied back up to backtest the moving averages before rolling over again and crashing. This is why I think we'll see that May/June high, or backtest... and it's why I also don't think the January 20th bottom was all for this wave down. We should bounce some and go lower into March before the multi-month rally.
Looking at that chart you can see that they are attempting to save the lower trendline from breaking on a closing bias for this month of January. They pierced it last week and came back above... but the month isn't over with yet. We still have one more week of trading yet to come. However, it's very possible that they still save the trendline in that rising channel as I don't see us breaking the January 20th low before the end of the month.
You'll also see how the ROC (rate of change) is now negative (-4.42%) and went negative back in the 2000 and 2007 tops/crashes. Above that you see the RSI dipping below the 50 level, now sitting at 47.90 (that's the "Relative Strength Index), which isn't good for anyone thinking we are still in a bull market.
Just looking at the angle of steep decline that the MACD's are falling from right now clearly says we are on our way to another crash soon. There nothing in this chart that I can point to that will support the bull market continuing.
The link to the presidential cycle...
If you've been reading my blog for any period of time you should know by know that everything in this matrix (that we call "the world") is the opposite of the truth. It's all lies on the main stream media outlets as they constantly mislead the sheep into the slaughtering pin every day.
Almost all of the larger, well promoted stories on the news are made up. There's no real school shooting as they tell you there was. There's no real beheading of Americans in the middle east. There's no real enemy over there that they call "The Taliban", "Al Qaeda" or "Isis"... it's all made up to control the sheep with FEAR (that's YOU and ME by the way).
The stock market is no different. They have always controlled it and manipulated it to steal the money from the sheep. And they always schedule the massive rallies and the crashes to their benefit... both financially and politically.
This is why we saw the past crashes happen around the exiting of one president and the election of a new one. There are many articles about it on the internet to show the link between the presidential cycle and the stock market so you can do your own research there. I'll just tell you what I think.
I see that when they have a president in for 8 years ( 2 terms) and it's near the end of his reign they tend to have a correction or a crash. The 1987 stock market crash was one year before Reagan left office. The 2000 top and crash in 2001 and 2002 was when Clinton left after 8 years and Bush took over. Then again after another 8 years the market topped out in 2008 when Bush left and crashed with the new president in 2009.
This cycle is common throughout history and while it's not always pointing to a crash after every 2 term president the odds go up huge when combined with other technical analysis, elliottwave patterns, and historical data all line up... which they ALL do right now!
So here we are with another 2 term president (Obama) about ready to leave office and a stock market so overbought from artificial injections of stimulus that the odds of this time being different are about as good as them bring back 8-track tape players!
Does this all look planned to you, or do you think it's just another coincidence that these crashes happen around presidential exit and entry periods?
There are many other reasons to suggest that a crash is unavoidable no matter what... mean even if "they" decided to change their minds about the planned crash they have scheduled.
What are they? Many things point to them not being able to stop this crash. There's the obvious fact that they can't get any other sucker (I mean country) to buy their Treasury Bonds, which they use to pay the interest on their debt. That ended over a year ago as the government started buying their own Bonds, which is like you running out of food and forced to eat our own fingers and toes.
In the past we, as in, American, have been like Zombies eating other dead Zombies countries as they foolishly buy our worthless bonds and we use that food to keep from going bankrupt. But those days are over with now as there's no one left to buy our debt. We have run out of fingers and toes to eat and will soon starve to death.
This is means there's nothing left for the Fed's to do to save this dying market even if they wanted too. It's over with... there's no more life support. The fat pig of a market is on it's last breath now.
Then there's the issue of the aging baby boomers that are downsizing to smaller places, meaning the real estate market is also going to take another hit as more and more of those larger homes coming into the marketplace. I guess on the bright side the smaller condo's and apartments could hold their value better as this older generation moves into them.
Regardless, there's too many other factors that say that even if all those people kept their homes it still won't keep the real estate market up. There's simply not enough demand from the other generations to keep the prices of home up. The overbuilding of homes during the 2002-2007 real estate bubble is just too huge to be overcome, meaning there's still a ton of supply out there and little demand.
Harry Dent does an excellent job covering all of that on his site and the video's he's done. If you want to learn more go find him and watch his video's. I'll just keep it short as this post is long enough already... the market doesn't have a chance of "NOT Crashing"! It's coming, and very likely it will happen later this year.
Do I know the coming stock market crash bottom?
I have a clue... a FP (fake print) showing the likely "coming stock market crash target low" but I don't want to post it here on the blog publicly. However, I will share it with people privately. Here's the deal... I'm starting a chatroom and want YOU, my loyal reader to join me in it. If you do, I'll show you the FP with the expected low.
For now this chatroom will be completely FREE, and I'll keep it that way for awhile (maybe a month or so?) as a "thank you" for all the comments and emails you've done for me and this site. However, I will have too charge a fee for this room in the future. It does cost me money out of my pocket every month to run it.
But, I'll give everyone in the room prior to it going paid a very special discount. It will be short lived of course but I'll make it cheap enough for everyone to afford. I'm not planning on charging for awhile now, but you still had better join as soon as possible so you'll be ready to get the discount when going to a paid room.
Also note that I've put all of my favorite people's "Tweet's" and "Videos" on a new page called "Social Wall", which has one page that combines both of them and separate pages for just all their tweets and another just for all their videos. If you have a favorite person I you think I should include on either please let me know and I'll add them.
Back to the market...
Currently the monthly chart looks extremely bearish and ready to make the cross of the 10 and 20 month moving averages. When it does there's no doubt that the high for the market was previously put in. Right now it's "tentatively" put in last year with the May 2015 high, but it's not set in stone just yet.
Considering how much damage has been done to this month of January already we can't rule out them saving that rising channel before the month ends, and then rallying in February, March, April and May. It's not looking good for them NOT breaking down again in at least one of those months to put in another lower low "intra-month" level outside of that lower rising trendline.
So while I'm jumping ahead of myself and acting like it has already happened the facts are that the 10 month moving average is still above the 20 month moving average by about 11 points with the 10MA sitting at 2036.27 and the 20MA sitting at 2027.06 for the month of January.
However, there's been a lot of damage done this month and even with a multi-month rally starting in February it's hard to believe they could stop them from crossing within the next several months. I won't rule it out complete of course as we've seen them pull rabbit after rabbit after rabbit of that hat that Ben Bernanke once wore before giving it to the next magician named Janet Yellen.
Let's look at what they say they are planning to do this year...
Raise rates is the answer. They've stated that they plan on raising interest rates again, and some analysts think that the Fed's will raise them 3-4 times. Now I don't know who to believe on that as we really don't know what their plans are until they have there FOMC meetings and announce another rate hike. But everything they've hinted at so far DOESN'T suggest any more stimulus and DOES suggest more rate hikes.
None that suggests anything bullish that would allow some new "all time" high to be put in again before they pop the bubble and crash it. Looking back at the 2000 and 2007 tops and crashes we see that in the 2000 bubble the market didn't crash until 2001 and 2002, which was early in the 2 terms that Bush was in. The election back then was November 2nd, 1999 and Clinton turned the presidency over to Bush in January of 2000.
So it was in his first couple of years that we saw the stock market crash, but in the 2007 top the crash happened during the 2008 election year and bottomed of course on March 9th, 2009... which was the start of Obama as president.
You can see that we do have a time window of 1-2 years for this to all unfold, but it extremely likely to happen either this year of 2016 or 2017 with the new president. Chartwise, it's looking very likely to happen in late 2016... but again, until I see that bearish cross on the monthly chart I can't rule out one more higher high.
These people have been manipulating the stock market (and the world) for longer then you and I combined have been alive, so let's just play this one month at a time for forecasting the longer picture. Then one day at a time in the chatroom.
Short term we appear to have a bottom in that should hold for awhile... like several weeks or even several months. The time window I have for this bottom to hold is from now until the first week of February. If they don't go back down within that period then we should rally up into March. So the bears still have about 2 weeks left to drop her hard again if they want another lower low. If not, we should have a nice rally into March before I see much danger of another drop.
Considering that this market is predicted to be a crash equal to or bigger then the 1929 crash we have to think that every last ditch effort will be done to fool the most people before they let it collapse. So while I can do all the charting, wave counting I want... and add in all the historical data, it's still a RIGGED market!
The only way to really know what's going to happen is to get the information directly from those that are controlled it and have the exact date of the crash already scheduled... which means the "Coded" messages in the movies might be the sheeps' only hope to figuring it all out. Watch every new movie you can and look for clues, then send them to me and/or post them in the comments of this post.
The ES is trying to hold this support/resistance line this morning.
The MACD's on the 2 hours are only around the +7.5 and +5 area but this 60 minute is almost to zero already.
This morning we have a lot of snow up in the northern east coast states, which could lead to light volume today. So even-though the charts are bearish and suggest a pullback we might not go as deep as we normally should.
Technically we should go back down about half of the move up, or in the 1850-1860 area (1860-1870 SPX). It should be some kind of ABC down and it looks like the A will happen right at the open this morning. Considering the fact that this 60 minute chart is near the zero level on the MACD's I'd just look for the A wave down to end in the morning session at some point and then a B wave up later in the day. The C wave down should then happen Tuesday morning.
This is what it looks like might happen right now before the open. But there's another possible scenario at play here. The move up from last week might not be finished yet. It's possible that it turns back up and makes a slightly higher high around the 1910 area. On this chart it shouldn't go below 1880 if that's going to play out. It would be a 5th wave up inside a C up from the 1840 area on the 21st last week. You can see it looks like it had a wave 1 up (inside a larger wave C up) from that 1840 area to the 1880 area high, then down to 1850 area for the wave 2 and back up to 1900 area for the wave 3 close on Friday. So this early move down this morning could be a wave 4 down with a wave 5 up to 1910 or so to complete the C wave up with the A up and B down from 1804 to 1875 back to 1840 area.
I'm pointing that count out mainly due to the light volume expected from the snow keeping traders home today and because the market tends to turn when around the zero area on the 60 minute and 2 hour charts with their MACD's. So since we are close to that level we could turn back up at the open and make a lower high on the MACD's of this 60 minute chart and a slightly higher high in the market.
That's 2 scenario's... one bullish and one bearish. So we look for the bullish one to give us a short at the 1910 area or the bearish one to give us a long at the 1850-1860 area. It seems logical that we'll see one or the other happen.
[ad_1]
Mike Snider and Jessica Guynn, USA TODAY 7:19 p.m. EST January 24, 2016
SAN FRANCISCO — Jack Dorsey is overhauling the leadership of Twitter in a bid to reverse the ailing fortunes of the social media company that has lost the faith of Wall Street.
Two key executives Alex Roetter, Twitter’s head of engineering, and Kevin Weil, head of product, are leaving the company, according to two people familiar with the matter but not authorized to discuss it publicly. Twitter also plans to announce two new board members, including a high-profile media personality, part of Dorsey's plan to shake up the leadership of the company. It will also name a new chief marketing officer.
Among the other executives leaving the company is Katie Jacobs Stanton, vice president of global media, the people said.
Re/code, the technology news service that first reported the shake-up, also claims the head of Twitter's Vine unit, Jason Toff, and Jana Messerschmidt, vice president of global business development and platform, may leave the company.
Twitter spokesman Will Stickney declined to comment.
Twitter co-founder Dorsey, who took over as interim CEO in July 2015 and was appointed as CEO in October 2015, is trying to revitalize the company he co-founded in 2006.
Twitter (TWTR) shares have fallen to $17.84, far below its $26 November 2013 IPO price, as investors have growing increasingly alarmed by slowing user growth and the company's prospects of gaining more mainstream traction.
Dorsey has taken steps to stabilize Twitter since taking over as CEO, overseeing a wave of layoffs, naming Google's former business chief Omid Kordestani as Twitter’s executive chairman and working on new features to make Twitter easier to use such as "Moments" and increasing Twitter's 140-character limit to 10,000.
[ad_2]
[ad_1]
Luke Roney, Newser Staff 1:43 p.m. EST January 24, 2016
(NEWSER) – Use of plastic has increased 20-fold in the past half-century; production of the ubiquitous material is expected to double again in the next 20 years (and nearly quadruple over the next 50). And, CNN Moneyreports, nearly a third of all plastic packaging "escapes collection systems."
As for where the rest goes, more than 8 million tons of plastics end up entering our oceans each year, where the pieces can survive for hundreds of years. There are believed to be 165 million tons of it in the ocean right now. We're dumping the equivalent of one garbage truck's worth into the ocean per minute; that's projected to jump to four per minute by 2050, according to a report released Tuesday by the World Economic Forum and Ellen MacArthur Foundation. And that report has an ominous warning: We're on track to have more plastic than fish, by weight, in the world's oceans by 2050. (Right now, the ratio is about 1:5, plastics to fish.)
And the discarded plastic that doesn't end up in the ocean is likely be put in a landfill; those two resting places end up holding about 70% of our plastic, the Washington Post reports. Just 5% of plastics are effectively recycled, according to the Guardian. It's not just a problem of pollution.
"After a short first-use cycle, 95% of plastic packaging material value, or $80 to $120 billion annually, is lost to the economy," the report says.
The solution? A "new plastics economy," per the report, that includes more recycling, reusable packaging, and compostable plastic packaging. "After-use plastics could, with circular economythinking, be turned into valuable feedstock,” Martin R. Stuchtey, who helped produce the report, tells the Guardian. (This tiny animal may solve a big pollution problem.)
[ad_2]
The oil surge helped propel Australia's benchmark S&P/ASX200 index 1.8 per cent higher to 5006.6. Photo: Jessica Shapiro
Australian shares closed over the 5000-mark for the first time since January 7, after a surge in oil prices was fuelled by talk of more European monetary stimulus coupled with a weather-driven surge in demand for heating oil in the United States.
Oil prices jumped 10 per cent on Friday, one of the biggest daily rallies ever, helped push global markets higher as bearish traders who had taken out record short positions scrambled to close them, betting the market's long rout may finally be over.
The strong overseas leads helped propel the benchmark S&P/ASX200 index 1.8 per cent higher to 5006.6 while the broader All Ordinaries closed 1.7 per cent up at 5057.1, the third straight day of gains for both indices.
A massive snowstorm on the US East Coast sent US heating oil up more than 10 per cent, helping to fuel a 15 per cent gain in crude prices over two days that has reversed nearly half of the relentless, fund-driven selloff that had pushed crude below $US30 a barrel for the first time in 12 years.
ECB chief Mario Draghi's announcement last week that the ECB may look into further easing measures at their meeting in March also helped to spark the major two-day rally in oil.
But the ECB has form in overpromising and under delivering, said BetaShares economist David Bassanese.
"Late last year ECB President "Super" Mario Draghi hinted that he might unleash even more quantitative easing in view of continued downside risks to European inflation. It got markets excited for a time, but he then failed to produce the bazooka markets were hoping for in December, which led markets to sink again.
"Draghi is at it again. Last Thursday – after doing nothing at the latest ECB policy meeting – he hinted the Bank would look again at policy "and possibly reconsider our monetary policy stance at our next meeting in early March."
"Like Pavlov's dog, markets are salivating again."
Both the US Federal Reserve and Bank of Japan hold policy meetings this week, with the Fed meeting on January 26-27 and the Bank of Japan meeting immediately after, on January 28-29.
Investors will look for any hints of when the Fed intends to make a second interest rate hike, while there is speculation that the BoJ could opt to take additional easing measures.
IG Market analyst Angus Nicholson said that despite the good rally, the gains could be reversed.
"The ASX hasn't managed a close above 5000 since 7 January, and while the rally has been very strong...there has been no major change in fundamentals to support the rally, and the concern is if and when it fizzles out, markets could even drop below their recent lows," he said.
"These concerns are likely holding back a lot of "bottom-pickers". The rally in oil has the least fundamental support, and the huge bounce we've seen in prices could well be reversed by another EIA oil inventories miss this week."
Among blue-chip stocks, BHP put on 0.1 per cent to $15.28 but Rio Tinto slipped 1.2 per cent to $39.16. Telstra gained 0.7 per cent to $5.58.
But it was banks and energy stocks that led the market. The banks recorded strong gains: ANZ 3.4 per cent to $24.15, Commonwealth Bank 3.2 per cent to $79.00, National Australia Bank 3.1 per cent to $27.76, and Westpac 3.3 per cent to $30.91.
Energy stocks were the market's best performers. Woodside rose 3.8 per cent to $26.42, Santos put on 4.2 per cent to $2.96, Origin gained 5.5 per cent to $4.05, Beach Energy shot up 10.8 per cent to 41 cents and Liquefied Natural Gas soared 11.6 per cent to 67 cents.
Wal-Mart Stores (NYSE:WMT) watchers probably know by now that the retailer is shutting down 269 stores globally this month, including all 102 of its Wal-Mart Express stores.
With the announcement, Wal-Mart pulled the plug on one of its latest retail experiments, and while the news attracted headlines, the question of why the chain failed has been largely ignored.
Launched in 2011, the Express format bore little resemblance to the traditional Wal-Mart Supercenter. While Supercenters average 180,000 square feet and size and carry around 100,000 stock-keeping units, the Express stores were just 12,000-15,000 square feet in size, equivalent to the average Walgreen's.
Image source: Wal-Mart.
The company hoped its price advantage would benefit the smaller-footprint stores, and that it would complement trips to Supercenters. However, the company overlooked two major obstacles in doing so.
Groceries are its game now
56% of the company's sales now come from groceries. Wal-Mart's Supercenters and Neighborhood Markets rely on regular traffic from food shoppers to carry over to its other retail departments, and its expansion into groceries over the last 20 years has been the primary driver of sales growth.
Its Neighborhood Markets, which are about the size of a Whole Foods Market, have been so successful because they are almost entirely grocery stores. The Express stores were too small to fill customers' food shopping needs, however, and instead carried products like toilet paper, stationery, and toys as well as some fresh foods and staples. Most also included a pharmacy.
Wal-Mart made several other mistakes on the merchandising level, seemingly shrinking its Supercenters to fit into a much smaller size instead of developing a concept around the format. It stocked multiple brands of the same item, costing space, and consumers often felt the product selection was not right. The company did not have data or experience with consumer preferences in such stores the way its competitors did, and it was eager to adapt to feedback. Finally many of the stores were simply cannibalized by Supercenters, underscoring a larger problem with the Express format.
Doomed from the start Instead of targeting urban areas as its dollar-store and convenience store rivals were doing, Wal-Mart opened Express stores in the rural Southern areas it already dominated, with the majority located within 10 miles of a Supercenter.
The first Walmart Express store was opened in Gentry, Arkansas, a town of just 3,000 in the company home base in the Northwest part of the state. Wal-Mart could have used the Express format to penetrate new markets, but instead, it tethered them to Supercenters, expecting the small stores to complement weekly trips to its larger stores. That proved unprofitable, however, as customer traffic did not warrant the additional locations.
The company has long struggled to penetrate urban markets, and its unwillingness to do so with its Express stores shows that weakness. Ironically, the convenience-store format is probably best designed for dense, traffic-filled cities where residents rely on public transportation -- just the kind of place where Wal-Mart would struggle to open a Supercenter.
While Wal-Mart is folding its Express format, Target Inc (NYSE:TGT) is expanding its own. The company is quietly adding CityTarget and smaller-format Target Express locations, as it says its CityTarget stores have been among its most successful. Unlike Wal-Mart, Target's sales are driven by clothing and home goods, non-grocery items that are easier to supply since perishability is not an issue. Target has also cultivated a more urban, higher-income customer base than Wal-Mart, giving it a brand advantage in those markets.
As for Wal-Mart, cities remain its biggest opportunity, but the closure of the Express format represents another step backwards. Along with the Express store closings, the company is shutting down a number of discount stores and Neighborhood Markets in urban parts of California, and backing out of a deal to open two stores in poorer areas of Washington, DC, leaving city officials irate. The culprit there seems to be rising minimum wages as Wal-Mart has complained that its recently opened DC stores are underperforming.
Despite the closures, Wal-Mart will open enough stores this year to finish with a net addition, but its inability to penetrate urban markets is a problem. It's already saturated the rural South. Without reaching new customers, the company's turnaround will continue to be stalled.
The next billion-dollar iSecret
The world's biggest tech company forgot to show you something at its recent event, but a few Wall Street analysts and the Fool didn't miss a beat: There's a small company that's powering their brand-new gadgets and the coming revolution in technology. And we think its stock price has nearly unlimited room to run for early, in-the-know investors! To be one of them, just click here.