Friday, October 23, 2026
Home Blog Page 31

ES Morning Update October 11th 2019

0

Ok gang, this morning we see the futures up nicely as they pushed through that falling light green trendline (finally... only took 9 attempts!). I did a chart after the close yesterday in the chatroom and will post it again here with this mornings update. I believe we are a couple of days away from a very large drop. It's setting up for Lucy3 again and could trigger on Tuesday of next week at the close.

If you refer the chart from yesterday you'll see I believe we are in small C wave up (from the 2888 low on 10/8), inside a medium wave 2 up (from the 2855 low on 10/3), inside a large C wave down (from the 3025 high on 9/13 or 3024 on 9/19?). The large A down was the drop from the 3029 high on 7/29 to the 2775 low on 8/5... which is 169 points in total. I expect this C down to be at least that much again, but usually C waves are like 1.618% of the A wave, so a move back down near the June 3rd low is possible.

For the short term though I think we are in a "tiny wave 3" up today of "small wave C up". That leaves Monday and Tuesday to carve out the "tiny wave 4" down and "tiny wave 5" up. That should complete the "small wave 2" up, which ends "medium wave 2" up and then (drum roll please) "medium wave 3" down inside "large wave C" down beginning! It's the wave we've all be looking for... a bull killer!

I'm not into EW really for predicting the future but I do use it with other technical stuff and that's why I'm referencing it today. There more factors involved here then just wave counting but they all match up nicely, so this time around Lucy3 has a great chance of happening. If you don't know what I'm talking about you'll have to join the free chatroom and go read a page I labeled "Codes" and then you'll "get it". Put simply though... it's a BIG DROP! So get ready bears, your time is near.

Have a wonderful and super blessed weekend. Remember that God is in full control of this world and he loves you. I know he loves me as ever since I've been talking (praying) to him daily he's answered my prayers. Totally amazing, as all you have to do is ask for help and he's there. God Bless.

ES Morning Update October 10th 2019

0

WOW! What a crazy afterhours session last night in the futures. Everything looked fine until about 6:15pm EST and then the bottom fell out and dropped into a low of 2881, which was about a 36 point fall from the 4:00pm close. It got wilder from there as it rallied back up into 8:00pm to 2917... which was the 4:00pm close.

After that it dropped hard again, hitting 2886 and one more time it rallied up into around 9:30pm or so for a 2923 high. Finally it calmed down and has been going sideways every since then. It set to open around that area too. Fortunately I exited all my longs yesterday around 3pm in the afternoon and stayed in cash. I did NOT see this "Crazy Ivan" move at all. I guess Sean Connery tricked me on that one.

But I wasn't following him either (not in any position) so he never caught me. But we still have time for a Red October, so the hunt goes on. Yesterday I said I believed we'd chop around today and into Friday with a slow grind higher to around the 2950 area (+/-10), which could still be accurate. I say "could" as I'm not sure now with the wild west show last night. But possibly that was just SkyNet hitting all the stops on both the bulls and bears? If so then it has certainly cleared them out I'd say.

Therefore it should be free to get back on track and do what it should do... chop upward into Friday. That's still my "best guess" but I'm not playing it of course. No positions for me right now. We'll see how today plays out and tomorrow. If all goes as planned then hopefully there will be an opportunity to take a short over the weekend. But bears need to be scared to short it of course. Or maybe I need to wait unti Monday, just not sure right now. So I'll end this update now and try to re-gather my thoughts for later. Have a great day.

ES Morning Update October 9th 2019

0

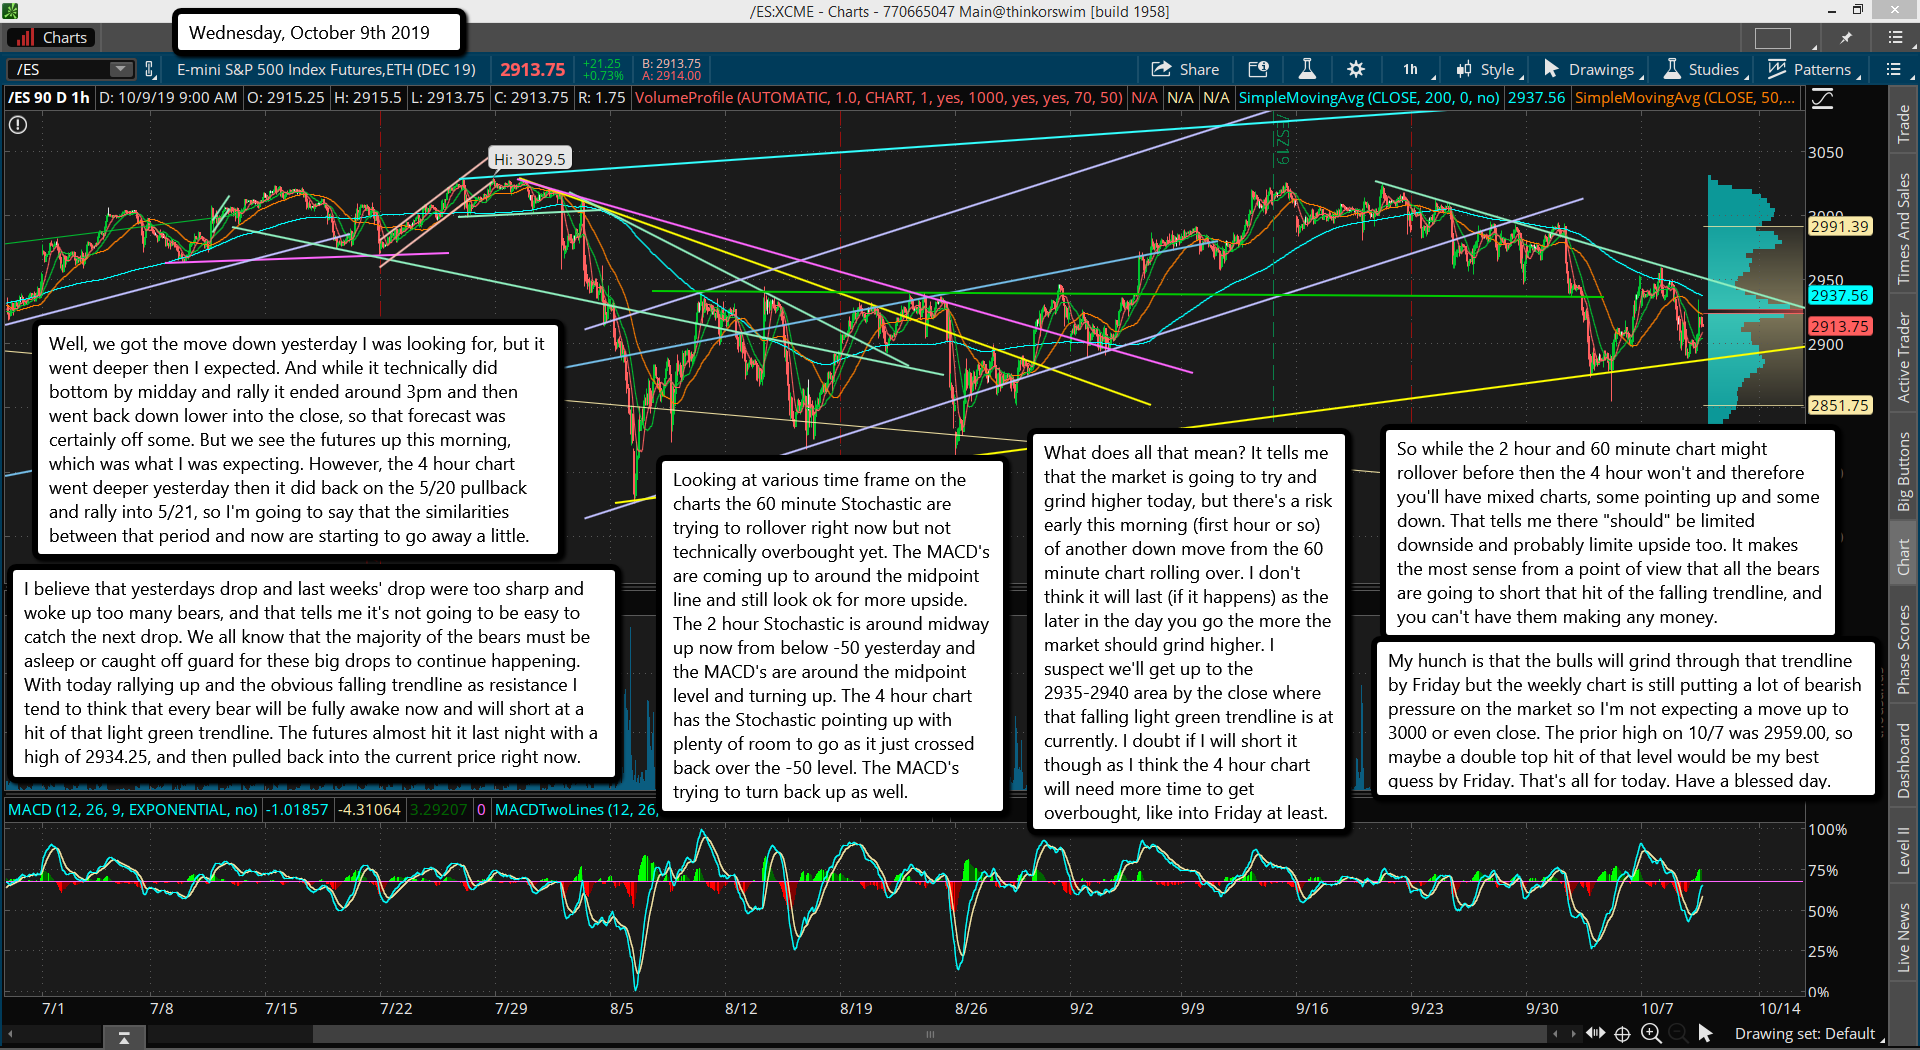
Well, we got the move down yesterday I was looking for, but it went deeper then I expected. And while it technically did bottom by midday and rally it ended around 3pm and then went back down lower into the close, so that forecast was certainly off some. But we see the futures up this morning, which was what I was expecting. However, the 4 hour chart went deeper yesterday then it did back on the 5/20 pullback and rally into 5/21, so I'm going to say that the similarities between that period and now are starting to go away a little.

I believe that yesterdays drop and last weeks' drop were too sharp and woke up too many bears, and that tells me it's not going to be easy to catch the next drop. We all know that the majority of the bears must be asleep or caught off guard for these big drops to continue happening. With today rallying up and the obvious falling trendline as resistance I tend to think that every bear will be fully awake now and will short at a hit of that light green trendline. The futures almost hit it last night with a high of 2934.25, and then pulled back into the current price right now.

Looking at various time frame on the charts the 60 minute Stochastic are trying to rollover right now but not technically overbought yet. The MACD's are coming up to around the midpoint line and still look ok for more upside. The 2 hour Stochastic is around midway up now from below -50 yesterday and the MACD's are around the midpoint level and turning up. The 4 hour chart has the Stochastic pointing up with plenty of room to go as it just crossed back over the -50 level. The MACD's trying to turn back up as well.

What does all that mean? It tells me that the market is going to try and grind higher today, but there's a risk early this morning (first hour or so) of another down move from the 60 minute chart rolling over. I don't think it will last (if it happens) as the later in the day you go the more the market should grind higher. I suspect we'll get up to the 2935-2940 area by the close where that falling light green trendline is at currently. I doubt if I will short it though as I think the 4 hour chart will need more time to get overbought, like into Friday at least.

So while the 2 hour and 60 minute chart might rollover before then the 4 hour won't and therefore you'll have mixed charts, some pointing up and some down. That tells me there "should" be limited downside and probably limited upside too. It makes the most sense from a point of view that all the bears are going to short that hit of the falling trendline, and you can't have them making any money.

My hunch is that the bulls will grind through that trendline by Friday but the weekly chart is still putting a lot of bearish pressure on the market so I'm not expecting a move up to 3000 or even close. The prior high on 10/7 was 2959.00, so maybe a double top hit of that level would be my best guess by Friday. That's all for today. Have a blessed day.

ES Morning Update October 8th 2019

0

This morning we see the futures down, which is what I suggested might happen in the chatroom yesterday. Basically it looks like we completed a 5 wave pattern up and are currently doing an ABC move down, with this early drop likely being the C part. Short term charts where just too overbought yesterday for the market to get through that falling light green trendline, so a pullback was much needed.

The test for the bulls will be to end this down move in the first half of today and turn back up for another run at trying to get through that trendline. The 4 hour MACD's are exactly where I thought they would be when the turn down was supposed to happen. You'll notice they also turned back up later that day and into the next day to try to get through the falling trendline it was struggling with back then. It failed and rollover over again, which would be like hitting today trendline tomorrow, failing and rolling over Thursday, then back up into Friday to fail again.

It will be interesting to see here if this pattern continues to mirror the past one as we go forward into tomorrow and the rest of the week. I worry that if too many people spot the comparison it will fail to continue "move for move" and do something tricky... like breakthrough the falling light green trendline maybe? But it if does indeed continue to mirror that prior pattern then a drop at some point soon (like after Friday) should take us down to revisit last Thursdays low at the very least.

From there we'll have to see what the charts look like but if they still look similar to the prior period then as much as I hate to say it, I don't think it will hold. I was kinda rooting for a blow off top rally into late October but it's not looking good right now for that to happen. Odds are now shifting to move down similar to that 5/16 bounce high down to the 6/3 low. So if the pattern continues we should bounce back up today into tomorrow and hit the falling light green trendline again, fail at it, drop on Thursday, then make one final bounce back up to hit it again on Friday.

After that it's pretty much straight down into the June 3rd low... and since we have a FP on the QQQ that is right around that June 3rd low it's looking like it could be a real one now. We'll continue to play it day by day but if the bulls can't get through that falling green trendline soon it's going to start down hard next week. For today I think we'll bottom by midday and turn back up for a run to the falling green trendline into Wednesday. Have a wonderful and blessed day.

ES Morning Update October 7th 2019

0

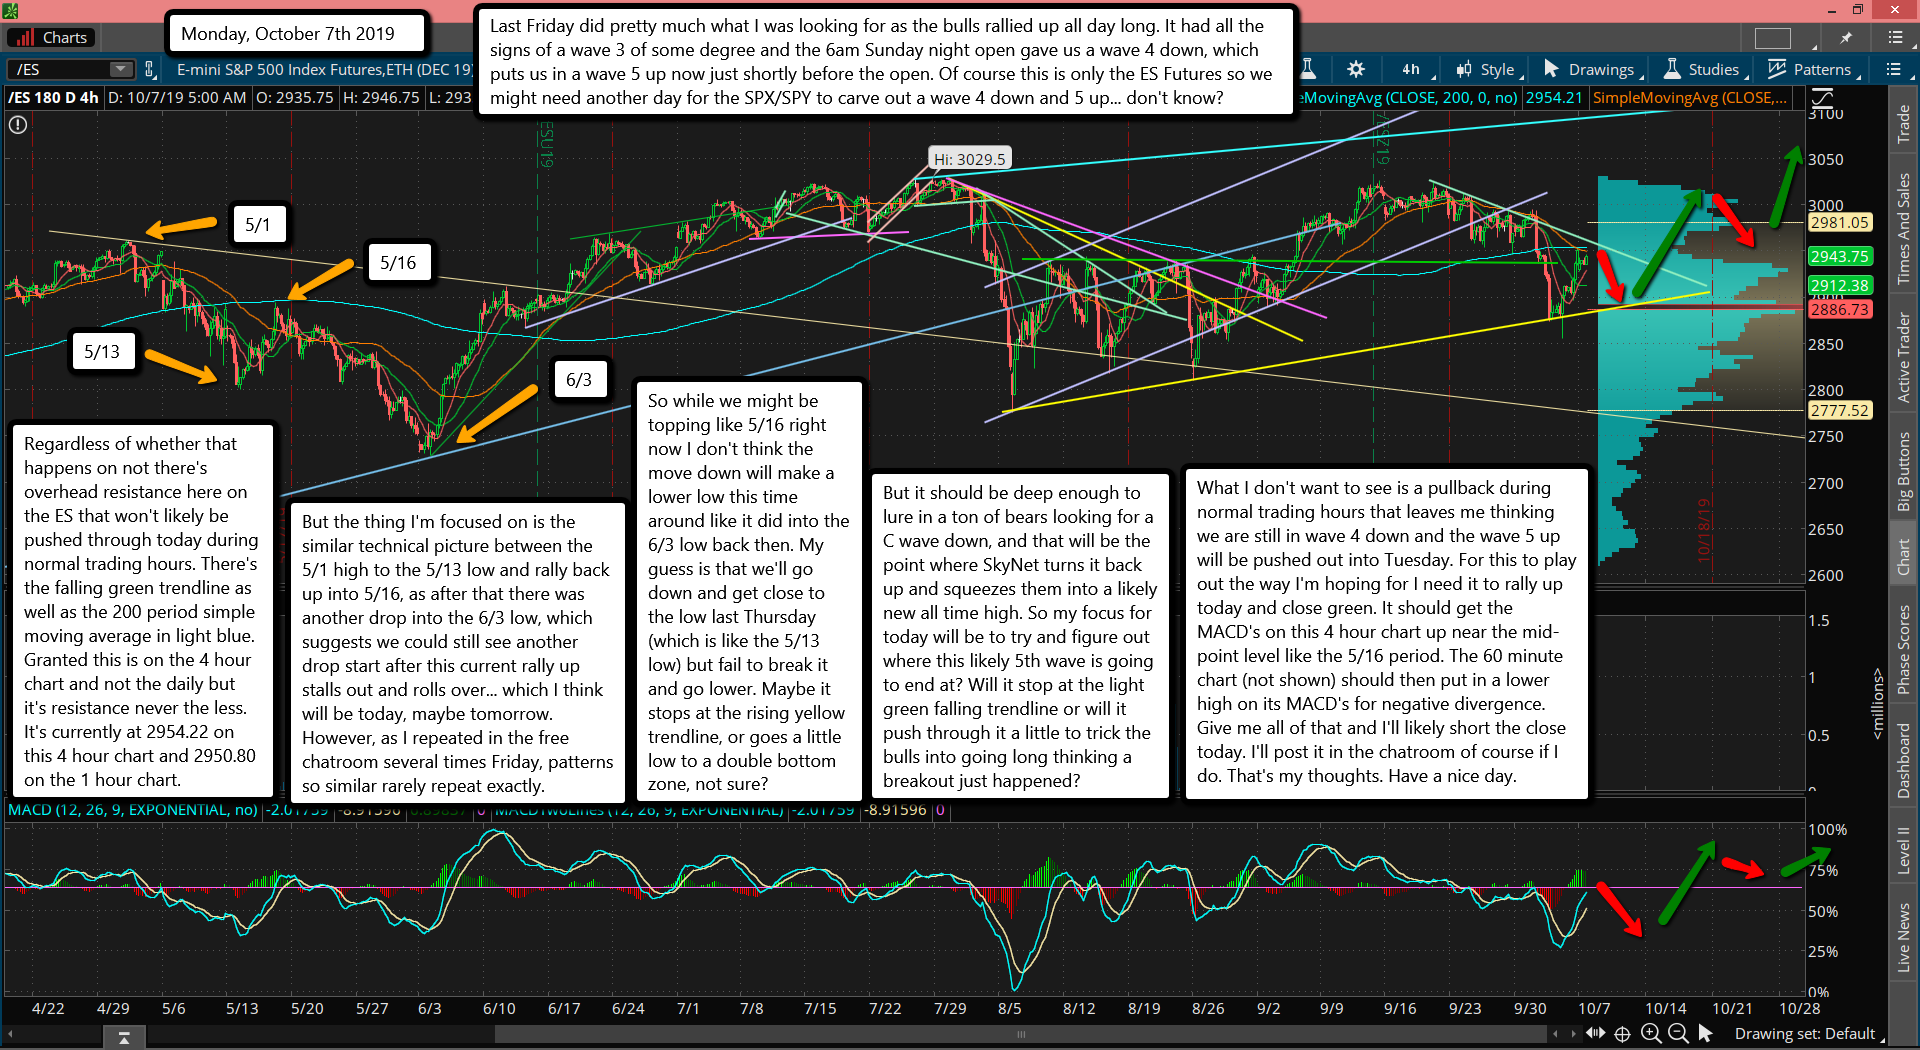
Last Friday did pretty much what I was looking for as the bulls rallied up all day long. It had all the signs of a wave 3 of some degree and the 6am Sunday night open gave us a wave 4 down, which puts us in a wave 5 up now just shortly before the open. Of course this is only the ES Futures so we might need another day for the SPX/SPY to carve out a wave 4 down and 5 up... don't know?

Regardless of whether that happens on not there's overhead resistance here on the ES that won't likely be pushed through today during normal trading hours. There's the falling green trendline as well as the 200 period simple moving average in light blue. Granted this is on the 4 hour chart and not the daily but it's resistance never the less. It's currently at 2954.22 on this 4 hour chart and 2950.80 on the 1 hour chart.

But the thing I'm focused on is the similar technical picture between the 5/1 high to the 5/13 low and rally back up into 5/16, as after that there was another drop into the 6/3 low, which suggests we could still see another drop start after this current rally up stalls out and rolls over... which I think will be today, maybe tomorrow. However, as I repeated in the free chatroom several times Friday, patterns so similar rarely repeat exactly.

So while we might be topping like 5/16 right now I don't think the move down will make a lower low this time around like it did into the 6/3 low back then. My guess is that we'll go down and get close to the low last Thursday (which is like the 5/13 low) but fail to break it and go lower. Maybe it stops at the rising yellow trendline, or goes a little low to a double bottom zone, not sure?

But it should be deep enough to lure in a ton of bears looking for a C wave down, and that will be the point where SkyNet turns it back up and squeezes them into a likely new all time high. So my focus for today will be to try and figure out where this likely 5th wave is going to end at? Will it stop at the light green falling trendline or will it push through it a little to trick the bulls into going long thinking a breakout just happened?

What I don't want to see is a pullback during normal trading hours that leaves me thinking we are still in wave 4 down and the wave 5 up will be pushed out into Tuesday. For this to play out the way I'm hoping for I need it to rally up today and close green. It should get the MACD's on this 4 hour chart up near the mid-point level like the 5/16 period. The 60 minute chart (not shown) should then put in a lower high on its MACD's for negative divergence. Give me all of that and I'll likely short the close today. I'll post it in the chatroom of course if I do. That's my thoughts. Have a nice day.

ES Morning Update October 4th 2019

0

Yesterday we what appears to me to be a "capitulation" spike move down. It was quickly recovered and the market has been going up ever since. You can see the MACD's have turned up nicely from that low on this 4 hour chart. It tells me the bottom is "in" for awhile. Of course nothing goes straight up without a pause or small pullback, which could happen if the 2 hour or 1 hour charts get overbought.

But pullbacks from here should be small as there's not much overhead resistance until you get up to the falling light green trendline and the 200 SMA in light blue. In the chatroom I posted a chart where I compared this to the 5/13 low and rally up into 5/16, and that still applies. They are very similar in a lot of ways. I've looked at the charts with MACD's, Histogram Bars, Full Stochastic on many different time frame.

They are almost too similar, which of course makes one wonder if they will repeat or not? I'll just play it day by day until we get up there I guess. My worry is that if I can see the pattern then so can many, many other traders, and when something is too obvious it rarely works. My speculation (hunch) is that we'll hit the falling light green trendline and rollover (like 5/16) but when we get back down to the yellow rising trendline (or even a little deeper to a double bottom from yesterday) we'll turn back up hard instead of breaking down lower like to move down to the 6/3 low did.

I'm not sure on it of course as I do have a FP on the QQQ that points to a revisit of that 6/3 low, but I want to be open minded here for the tricks SkyNet might play. For now though I'm still long and plan to hold into next week. I took a second long position at the fast recovery bounce back up yesterday as it looked very much like the bottom to me. Any updates or changes I will of course continue to post in the free chatroom.

If you are not a member you should join. There's a lot of good people there and we enjoy just chatting about life as well... especially during the boring times of the day. If you have trouble signing up just email me. Red (at) RedDragonLeo (dot) com Have a wonderful and blessed weekend. The temperature will start dropping for me here in Ohio. Starting tomorrow it will leave the summer 90's and enter the fall 70's... yippee!

ES Morning Update October 3rd 2019

0

Well gang, we dropped right to that rising yellow trendline and stopped... for now at least. I'm showing you the 4 hour chart this morning as I want you to notice how it's trying to turn back up right now, and how it looks similar to the low around 5/13, which turned back up from around the 20%+ area (we are closer to 25% currently) to rally into around 5/16 where it popped over the center line briefly and looks to have tagged about 70% or so.

From there it drop again into the 6/2 low in the ES price be that MACD line made a "slightly higher low" in the 20%+ area this time. That's a positive divergence on it for sure, which indeed put in the low and allowed a rally up into the 7/29 high. Pattern never repeat exactly but similar is common. So my thinking is that the bulls will hold this rising yellow trendline today (and 2874 for the double bottom) and turn that 4 hour MACD back up late in the day or tomorrow and produce a rally up into Friday or Monday.

After that we'll have to see if it looks ready to roll back over again or continue higher. The DOW is at a critical level too as it tries to hold the even number 26,000 level and the 200 day SMA currently at 26,064.77... which is another reason for a bounce here. The SPX has it's 200 day SMA at 2874.37... so it's no coincidence that was the low yesterday. I took a long yesterday via selling a put credit spread (291/290) that expires next Wednesday as my thinking is that we'll be well over 291 by expiration if a similar rally happens like that 5/13-5/16 bounce.

It always feels scary at times like this, just like 2 days ago when the market gaped up and ran to 2994.50 while I was stuck short. But that October 1st high was indeed a bull trap as the market fell off a cliff afterwards and put us over a 100 points lower to the current level we are at this morning. I feel the same right now as I did then, like I was wrong in making that decision to short like going long yesterday. And I suspect today will be a slow grind sideways day to keep me guessing more on my decision. I pray to God for patience today, as well as every day. Give me wisdom, courage, strength and discernment as well please Lord as this market is run by satan and he's a tough one to trade against. Where's my fiddle Johnny? Have a wonderful day.

ES Morning Update October 2nd 2019

0

Wow! What a day yesterday was. Here I was stuck short and hating it but around 10am that all changed as the market started to drop, and continued down all day long. Needless to say I'm a happy person today. My underwater positions turned into a profit... yippee. Ok, for today we see some follow-through on the downside as the futures lost the horizontal green trendline of support, which was the prior multi-highs back in August.

The only obvious lower trendline for the next support is the one in yellow, but the "even number" level of 2900 (26,000 DOW) will likely provide some kind of bounce (if we get there?). For today though I'm neutral as most days after a large drop day are "pause" days. Meaning they chop around a little going slightly lower then back up and commonly end the day around flat. Tomorrow and Friday is what I'm focused on.

I'd like to see a nice buy signal setup, or sell... but that would take a strong move up starting today, tomorrow and Friday, and that's unlikely. Basically, I'll be in cash for the next few days waiting for the next strong setup... buy or sell. Again, I don't see it being a sell as the bears are now fully awake... and they have bulls trapped long now. So again, odds are we'll drift lower the next few days (not big like yesterday) to lure in bears to short looking for another huge drop. It should also cause the bulls to capitulate.

Once that happens we should get a nice move back up. How much is anyone's guess as I have a downside target (via a FP on the QQQ) that tells me we will revisit the June, 2019 lows... but when is the question? Will it be in October, or November? I don't know? I'm just going to stick with what the market gives me each day and go with that. Have a great day.

ES Morning Update October 1st 2019

0

The futures are up some this morning but the overnight session had them up more... and they managed to pop through the 200 simple moving average on this 60 minute chart. The bears are getting tired it seems as 3000 seems to be the goal for the bulls right now. The DOW is also seeking the big even number as it looks ready to take out 27,000 by the open.

I'm not sure what to make of this? Is it for real or another "fake out" to get the bulls trapped long before a reversal back down? Only time will tell I guess. I'm currently in a short position and obviously not liking it. I still feel like the market isn't bearish enough to support a strong rally up to new all time highs, nor bullish enough to allow a big drop. It's just in no mans land with a bullish short term bias this morning.

I hate being trapped on the wrong side but that's part of trading I guess as you win some and lose some. I'll give this more time to see what happens but I suspect we'll see a bunch of traders flip to long this morning. Will that cause the market to flip back to bearish mode or will it rally on up and pay the longs? I wish I knew. Today is the first day of the month of October so maybe it's just new mutual fund money being put to work and won't last but a few days? Anyway, I don't have much to add this morning so I'll end it here. Have a wonderful Tuesday.

ES Morning Update September 30th 2019

0

Short post this morning gang. My brain isn't working yet... sorry. I was going to do a post over the weekend about the HUGE business opportunity coming soon, and I still plan to do it... so hang in there, it's coming. There's some "possible" FP's of 296.90 on the SPY from afterhours Friday but they got hit Sunday night. However, if we do rally back up any today that's the level I'd focus on.

The 294.69 level on the SPY is the 50 day simple moving average, and it's been holding as support quite well last week. But 200 day simple moving average is probably the real target to focus on, as it's near the FP level on the QQQ, and just a hair above the June 2019 lows. That level on the SPY is 282.97, and I think we'll eventually get there in the coming month. On the ES that same moving average is all the way down to 2835.92, and on the DOW it's a 26,050.90.

On the short term though I just don't have much to say, so I won't. I'll get to that business opportunity as soon as possible as well. But don't worry as it's still in prelaunch and had only 50-60 people involved a week or so back. The last business done by this same man had over a million people... so YEAH, it's SUPER Early right now. Have a blessed day.

ES Morning Update September 27th 2019

0

The 298.38 FP was hit in the premarket session yesterday but by the time the market opened it was already down more then I was comfortable chasing it. SkyNet must be reading my posts and knew I was planning to short the hit of that FP but with Wednesday rallying up into the close and coming shy of it by 27 cents I thought I would wait until the open on Thursday to see if it hit.

Wrong! SkyNet hit the high (and FP) around 4:47 am EST Thursday morning and started going down from there. That is very frustrating as remember from a week or so back the FP on the QQQ of 194.78 was missed by 7 cents with a high on 9/12. True, it didn't rollover quickly like the SPY yesterday so shorting it wouldn't have been very profitable. But in all my years of tracking fake prints I've learned that they put out (by who I do not know?) to signal where the market is going too... not necessarily to say it will hit it and turn the other way immediately.

Most of the time they do turn but not always. Sometimes they chop sideways for awhile and then turn or continue in the same direction. What I can speculate on is that if the market is overall bullish the upside FP's will get pierced through and downside FP's will fall shy of hitting.

In a bearish market the opposite seems true where the upside FP's fall shy (at least in the normal trading hours) and the downside FP's will get pierced. Since we have the 194.78 FP on the QQQ falling shy by 7 cents and the 298.38 FP on the SPY falling shy by 27 cents into the close yesterday, I have to think the market is overall in a bearish mode.

Meaning it's getting harder and harder to keep it going up, which is amazing with the $75 Billion Dollars being pumped into it currently and until October 10th. One has to wonder where the market would be without that funny money.

Anyway, for today we can see the ES is back-testing the 200 SMA on this 60 minute chart, so I have to lean bearish until it proves itself by pushing through. However, with today being Friday I doubt if the bulls will let it drop much. More then likely we will continue to see these nice one day drops that float back up into the close each day until that funny money it's being put into the system each day.

It seems like the market opens, the big boys sell, the market drops some, the big boys stop selling, and the market floats back up into the close. A clear sign of distribution by insiders. It should all be done before this funny money injection runs out. So I expect a strong sell signal to setup within the next 2 two weeks, but until then it might just be a day traders market. Have a blessed weekend.

P.S. The business opportunity I've been talking about in the free chatroom has opened its' doors now so I'll do a weekend post on it to try an explain it the best I can. Timing is everything in life and since this one is just starting the opportunity is at its' biggest point. The owner has a proven track record as he did a company like this around 2003 or so and ran a Billion Dollars through it with about a million people involved world wide. My close friend (who knows the owner personally) told me there was only 50-60 people involved a week or so back (before it was open), so that tells you about how early in the stages of the company it is in right now. And get this... right now everyone has a chance to sign up for FREE! Yeah, that's HUGE! Afterwards the cost will be only $28.00 per month, so everyone can afford it. Anyway, more coming over the weekend.

ES Morning Update September 26th 2019

0

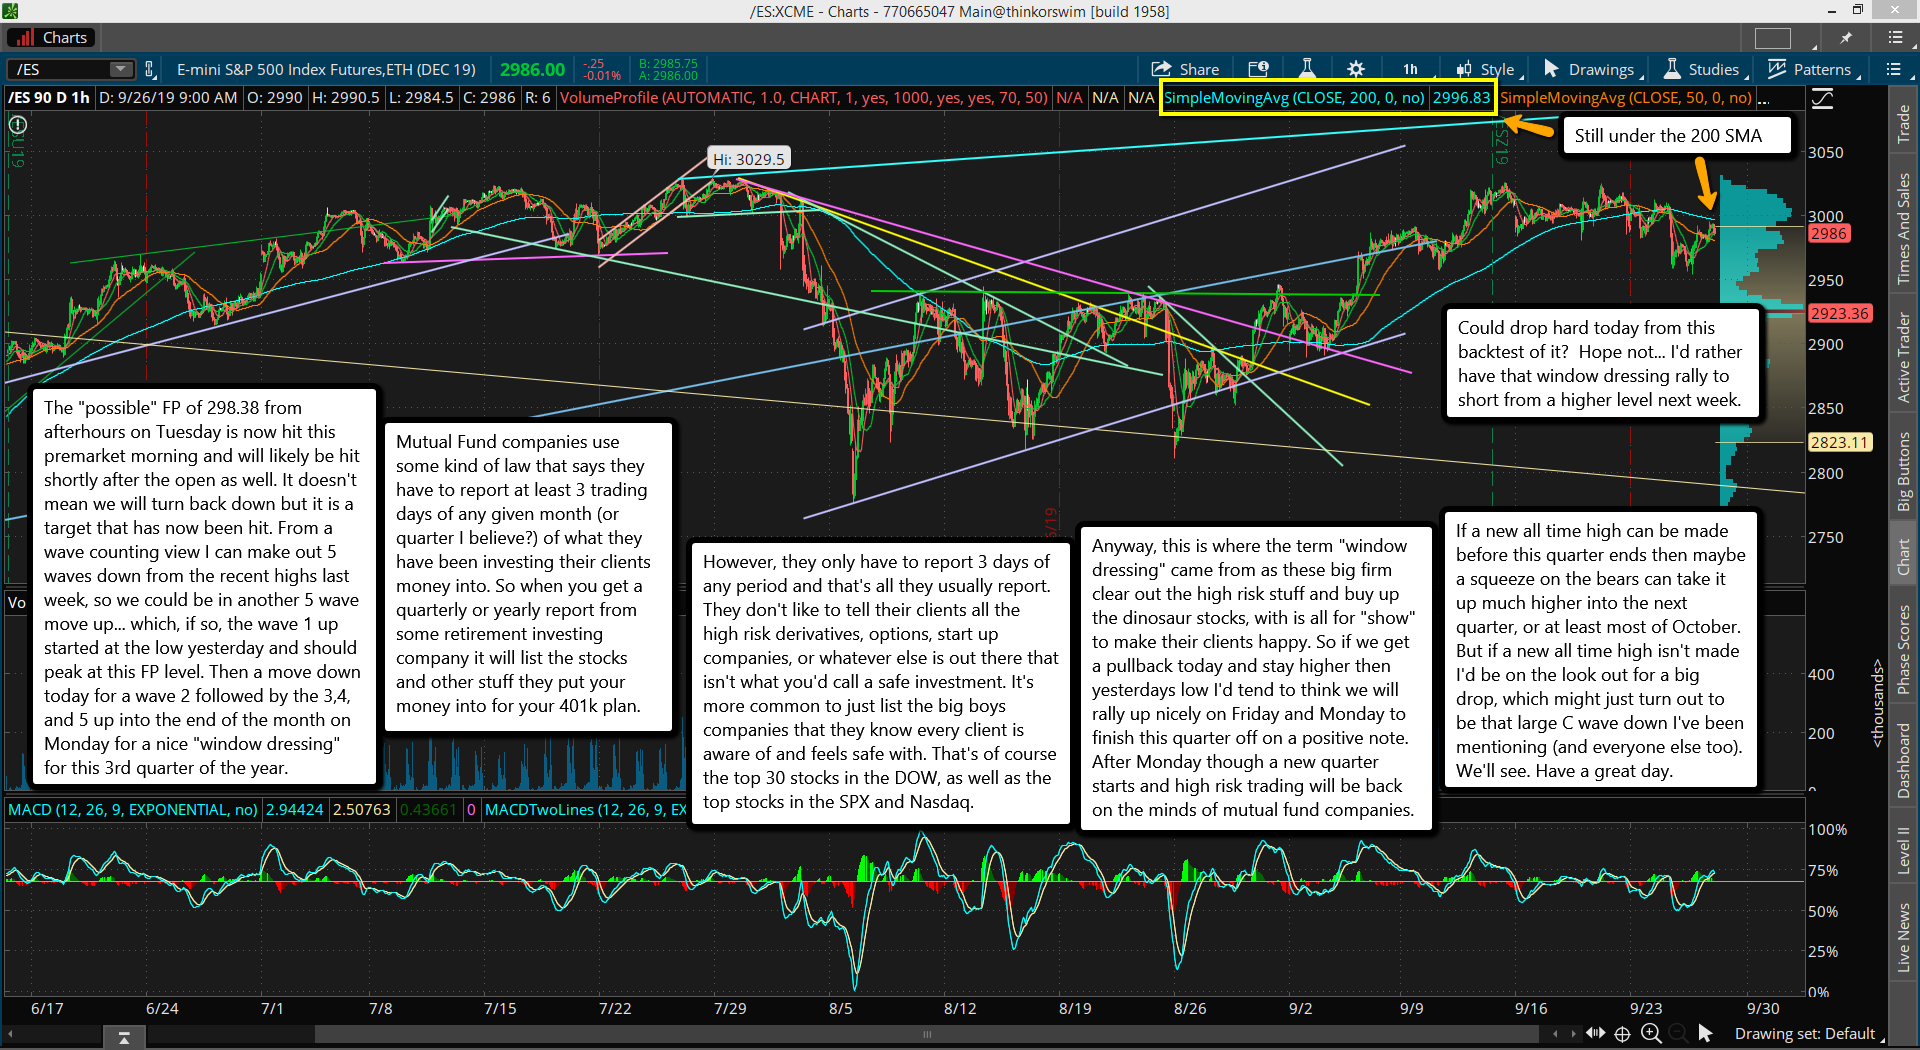
The "possible" FP of 298.38 from afterhours on Tuesday is now hit this premarket morning and will likely be hit shortly after the open as well. It doesn't mean we will turn back down but it is a target that has now been hit. From a wave counting view I can make out 5 waves down from the recent highs last week, so we could be in another 5 wave move up... which, if so, the wave 1 up started at the low yesterday and should peak at this FP level. Then a move down today for a wave 2 followed by the 3,4, and 5 up into the end of the month on Monday for a nice "window dressing" for this 3rd quarter of the year.

Mutual Fund companies use some kind of law that says they have to report at least 3 trading days of any given month (or quarter I believe?) of what they have been investing their clients money into. So when you get a quarterly or yearly report from some retirement investing company it will list the stocks and other stuff they put your money into for your 401k plan.

However, they only have to report 3 days of any period and that's all they usually report. They don't like to tell their clients all the high risk derivatives, options, start up companies, or whatever else is out there that isn't what you'd call a safe investment. It's more common to just list the big boys companies that they know every client is aware of and feels safe with. That's of course the top 30 stocks in the DOW, as well as the top stocks in the SPX and Nasdaq.

Anyway, this is where the term "window dressing" came from as these big firm clear out the high risk stuff and buy up the dinosaur stocks, with is all for "show" to make their clients happy. So if we get a pullback today and stay higher then yesterdays low I'd tend to think we will rally up nicely on Friday and Monday to finish this quarter off on a positive note. After Monday though a new quarter starts and high risk trading will be back on the minds of mutual fund companies.

If a new all time high can be made before this quarter ends then maybe a squeeze on the bears can take it up much higher into the next quarter, or at least most of October. But if a new all time high isn't made I'd be on the look out for a big drop, which might just turn out to be that large C wave down I've been mentioning (and everyone else too). We'll see. Have a great day.

ES Morning Update September 25th 2019

0

Yesterdays drop was a surprise but in this news driven market it seems that surprise drops happen a lot. The Trump impeachment news will take the blame I guess for the move down yesterday. But in reality we all know the market is very overbought and just staying up in this zone due to the funny money the Feds are pumping into it every day until at least October 10th. Technically we are still trading in a range so nothing there has changed... just wider then then I mentioned yesterday.

As for today I'm just going to wait and watch as I don't have any clear picture. But some clues should appear over the next few days to tell me if the market is setting up for a big drop or a strong rally. Yeah, it's hard to believe we could be setting up for a rally but sideways trading for awhile is also called "consolidation", and it could be filled with "buying" (by insiders) which means another strong leg up is coming, or "selling" (same insiders), which of course means a drop is coming. I don't know the answer yet... unfortunately.

Odds would favor a sell of course but we all know how tricky SkyNet is, so a buy is certainly possible. I'm just going to remain neutral here until I can figure out what SkyNet is setting up for... and that's not an easy task. Meaning I could "not see it" and miss the drop or rally. But I think I'll catch it this time. I think it will show its true colors (the next direction) by this Friday.

I think down as I still feel like that possible large ABC wave pattern needs to complete and we've only had the large A down from the July top to the August low, and have been in the large B up ever since. A large C down is needed I think and then a year end rally to new all time highs. Yeah, I could be wrong and the "so called" large A down is just a wave 4 and we are in a wave 5 up now... which could be correct? I can't rule out anything right now but should know more by this Friday. Until then I'm neutral. Have a blessed day.

ES Morning Update September 24th 2019

0

The futures are set to open over the 3000 level on the ES (and over 27,000 on the YM, aka... the DOW). I had bought a small long yesterday morning and closed it out shortly after 4pm because of that late day pullback. Also because the market had pierced through 3000 and 27,000 earlier and didn't hold above them. I was a little worried about that being a failure attempt and that we could rollover this morning and open down. It's still possible I guess but less likely with the capture of the all important "even number" levels.

Like I said yesterday, the Fed's are pumping $75 Billion a day into this market and will do so until at least October 10th (the last day on their schedule). So it's going to be hard to believe we'll get much going on the downside with that kind of funny money supporting it. Is it cheating? Of course it is, but that's what all governments do... so don't be shocked. Everything in this world that has value the elite have lots of it, and they therefore have a vested interest in keep the inflated pig of a stock market up as high as possible for as long as possible. When they know they can't keep it up much longer they start selling out slowly over many months in advance, and once they are done they pull the plug and let it collapse.

That time is coming but probably not until next year. It will be an epic battle between those elite in control of the market and Trump as he will attempt to keep the market up until after the election. Who will win is unknown but odds say the elite will as they've done this move many times in the past (think 1929, 1987, 2000, and 2007) and presidents never stopped them back then, so what makes you think this time will be different? I don't. I think they will drop this market hard in 2020 regardless of what Trump wants. Will he still get re-elected? Probably so, as he'll blame it on the elite (aka, the deep state)... and he'll be correct.

Anyway, for today I don't see much happening. Looks like another boring day where bears try to short it and the funny money keeps it from going down. We appear to be rangebound again this week. But it's a pretty nice and wide range, and should be fun for day traders to go in an out. We were down in the low 2980's yesterday and we could easily revisit it again and still be rangebound. As you all know I'm looking for that last top before the drop starts that takes us down the June 3rd lows. It's coming but with all the funny money being put into the market we might not see it start until after October 10th... just don't know yet? But I'll get some great clues along the way I'm sure and if a strong sell signal triggers prior to that date I should be able to catch it. Until then it's more chop. Have a great day.

ES Morning Update September 23rd 2019

0

Sunday night the market popped higher but this morning it erase all those gains, so I'm not sure what to think about it right now? I'll have to wait to see what the day brings to get a better feel for it. I will add that the Fed's have scheduled $75 Billion worth of QE going on each day until October 10th, so we might not see any new downtrend start until after it's finished. More then likely we'll be range-bound between the mid-high 2900's up to the low-mid 3000's, with some breakout to a new all time high likely before the coming correction down to the June, 2019 low (at least that's where I think it's going).

This breakout though should be brief and not hold more then a day, nor lead to some move up to 3100, 3150, or whatever the big upside targets are currently. This is what I currently see, and it based a lot on the Fed's injecting all that stimulus into the market each day, which should keep it from starting any new downtrend. If it doesn't look like it's going to hold then I should get some kind of signals saying so, and will of course update everyone.

Today however is a mystery to me. We are into a support zone from 9/5 to 9/11, so I'd lean toward an early low and a float back up the rest of the day. Then the rest of this week I'll just have to watch closely to see if any sell signals get through the QE being put into the market. Maybe one still develops and makes it until the trigger date, but I'm not holding my breath on it. Anyway, have a blessed day.

ES Morning Update September 20th 2019

0

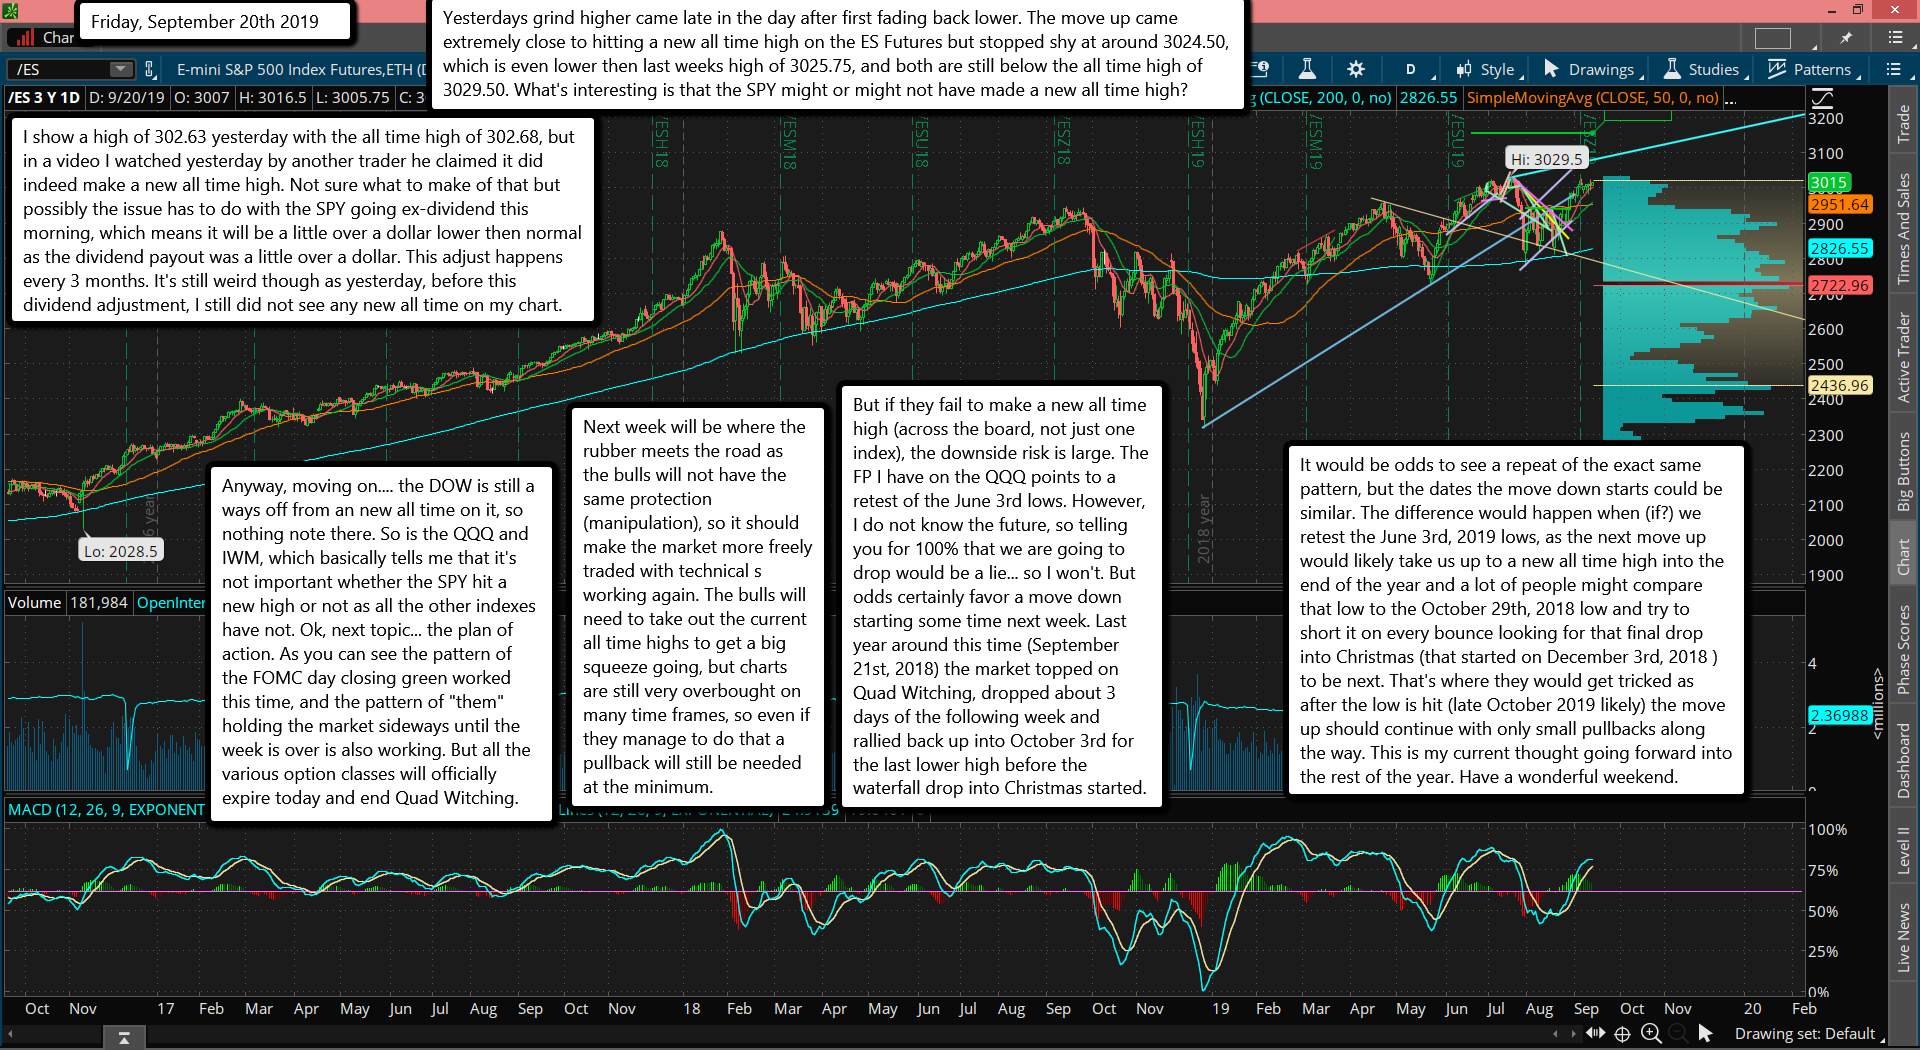
Yesterdays grind higher came late in the day after first fading back lower. The move up came extremely close to hitting a new all time high on the ES Futures but stopped shy at around 3024.50, which is even lower then last weeks high of 3025.75, and both are still below the all time high of 3029.50. What's interesting is that the SPY might or might not have made a new all time high?

I show a high of 302.63 yesterday with the all time high of 302.68, but in a video I watched yesterday by another trader he claimed it did indeed make a new all time high. Not sure what to make of that but possibly the issue has to do with the SPY going ex-dividend this morning, which means it will be a little over a dollar lower then normal as the dividend payout was a little over a dollar. This adjust happens every 3 months. It's still weird though as yesterday, before this dividend adjustment, I still did not see any new all time on my chart.

Anyway, moving on.... the DOW is still a ways off from an new all time on it, so nothing note there. So is the QQQ and IWM, which basically tells me that it's not important whether the SPY hit a new high or not as all the other indexes have not. Ok, next topic... the plan of action. As you can see the pattern of the FOMC day closing green worked this time, and the pattern of "them" holding the market sideways until the week is over is also working. But all the various option classes will officially expire today and end Quad Witching.

Next week will be where the rubber meets the road as the bulls will not have the same protection (manipulation), so it should make the market more freely traded with technical s working again. The bulls will need to take out the current all time highs to get a big squeeze going, but charts are still very overbought on many time frames, so even if they manage to do that a pullback will still be needed at the minimum.

But if they fail to make a new all time high (across the board, not just one index), the downside risk is large. The FP I have on the QQQ points to a retest of the June 3rd lows. However, I do not know the future, so telling you for 100% that we are going to drop would be a lie... so I won't. But odds certainly favor a move down starting some time next week. Last year around this time (September 21st, 2018) the market topped on Quad Witching, dropped about 3 days of the following week and rallied back up into October 3rd for the last lower high before the waterfall drop into Christmas started.

It would be odds to see a repeat of the exact same pattern, but the dates the move down starts could be similar. The difference would happen when (if?) we retest the June 3rd, 2019 lows, as the next move up would likely take us up to a new all time high into the end of the year and a lot of people might compare that low to the October 29th, 2018 low and try to short it on every bounce looking for that final drop into Christmas (that started on December 3rd, 2018 ) to be next. That's where they would get tricked as after the low is hit (late October 2019 likely) the move up should continue with only small pullbacks along the way. This is my current thought going forward into the rest of the year. Have a wonderful weekend.

ES Morning Update September 19th 2019

0

The FOMC is now over and what I wild day it was after the minutes were released with wild swings up and down several times until a sharp drop went down and stayed down for a little while before ripping back up into the close. It wasn't your typical meeting, that's for sure. What does it all mean? It's a crack in the dam the bulls built I think. It says things aren't as good as many think.

It doesn't mean we are ready to rollover and start a nice correction yet, but it does tell me that the upside is limited here. I do not know if we will make a new all time high or not but I'll sit with the pattern from past FOMC days where a turn happens within 2-4 days afterwards. The Fed don't want to be the blame for any lasting drop after a meeting so they hold up the market for several days until some other news event can take the blame. The VIX contracts expired yesterday, and we still have other index contracts and options yet to go, but they will all be done by the close on Friday.

Next week will be free to start a correction and I do still think we'll see it. But right now I don't know what day will be the start of that down move. I should be able to figure it out as we get closer but for now we are still likely to chop around until this week ends. Bulls need to step on it if they want a new all time high as "time" is their enemy. My best guess is that if they don't make it by Monday or Tuesday of next week then it's not happening.

For today I don't see much. A grind higher or sideways to keep the bears trapped that shorted the bottom yesterday, and of course make all the puts expire worthless into tomorrow. That's about all I have to add as most everything I've already said in prior morning updates this week still apply. Have a wonderful day and may God Bless you in life.

ES Morning Update September 18th 2019

0

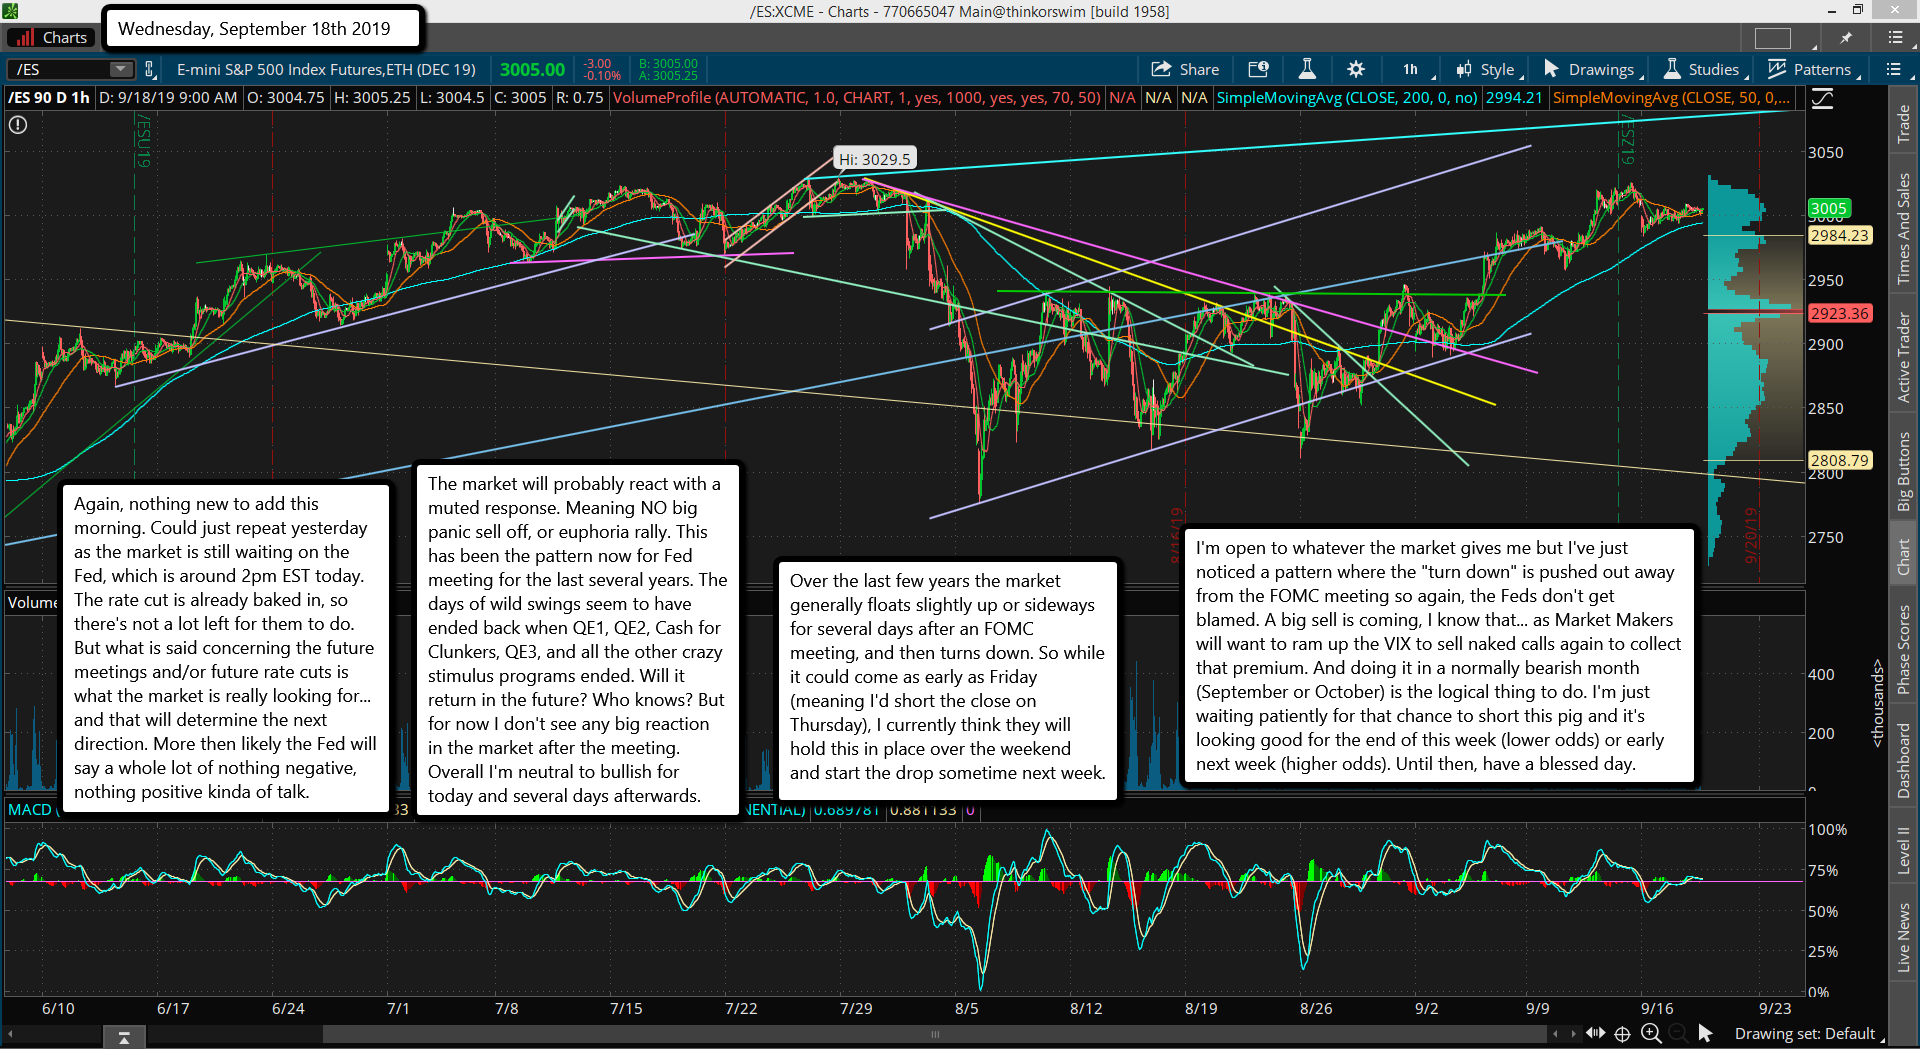
Again, nothing new to add this morning. Could just repeat yesterday as the market is still waiting on the Fed, which is around 2pm EST today. The rate cut is already baked in, so there's not a lot left for them to do. But what is said concerning the future meetings and/or future rate cuts is what the market is really looking for... and that will determine the next direction. More then likely the Fed will say a whole lot of nothing negative, nothing positive kinda of talk.

The market will probably react with a muted response. Meaning NO big panic sell off, or euphoria rally. This has been the pattern now for Fed meeting for the last several years. The days of wild swings seem to have ended back when QE1, QE2, Cash for Clunkers, QE3, and all the other crazy stimulus programs ended. Will it return in the future? Who knows? But for now I don't see any big reaction in the market after the meeting. Overall I'm neutral to bullish for today and several days afterwards.

Over the last few years the market generally floats slightly up or sideways for several days after an FOMC meeting, and then turns down. So while it could come as early as Friday (meaning I'd short the close on Thursday), I currently think they will hold this in place over the weekend and start the drop sometime next week.

I'm open to whatever the market gives me but I've just noticed a pattern where the "turn down" is pushed out away from the FOMC meeting so again, the Feds don't get blamed. A big sell is coming, I know that... as Market Makers will want to ram up the VIX to sell naked calls again to collect that premium. And doing it in a normally bearish month (September or October) is the logical thing to do. I'm just waiting patiently for that chance to short this pig and it's looking good for the end of this week (lower odds) or early next week (higher odds). Until then, have a blessed day.

ES Morning Update September 17th 2019

0

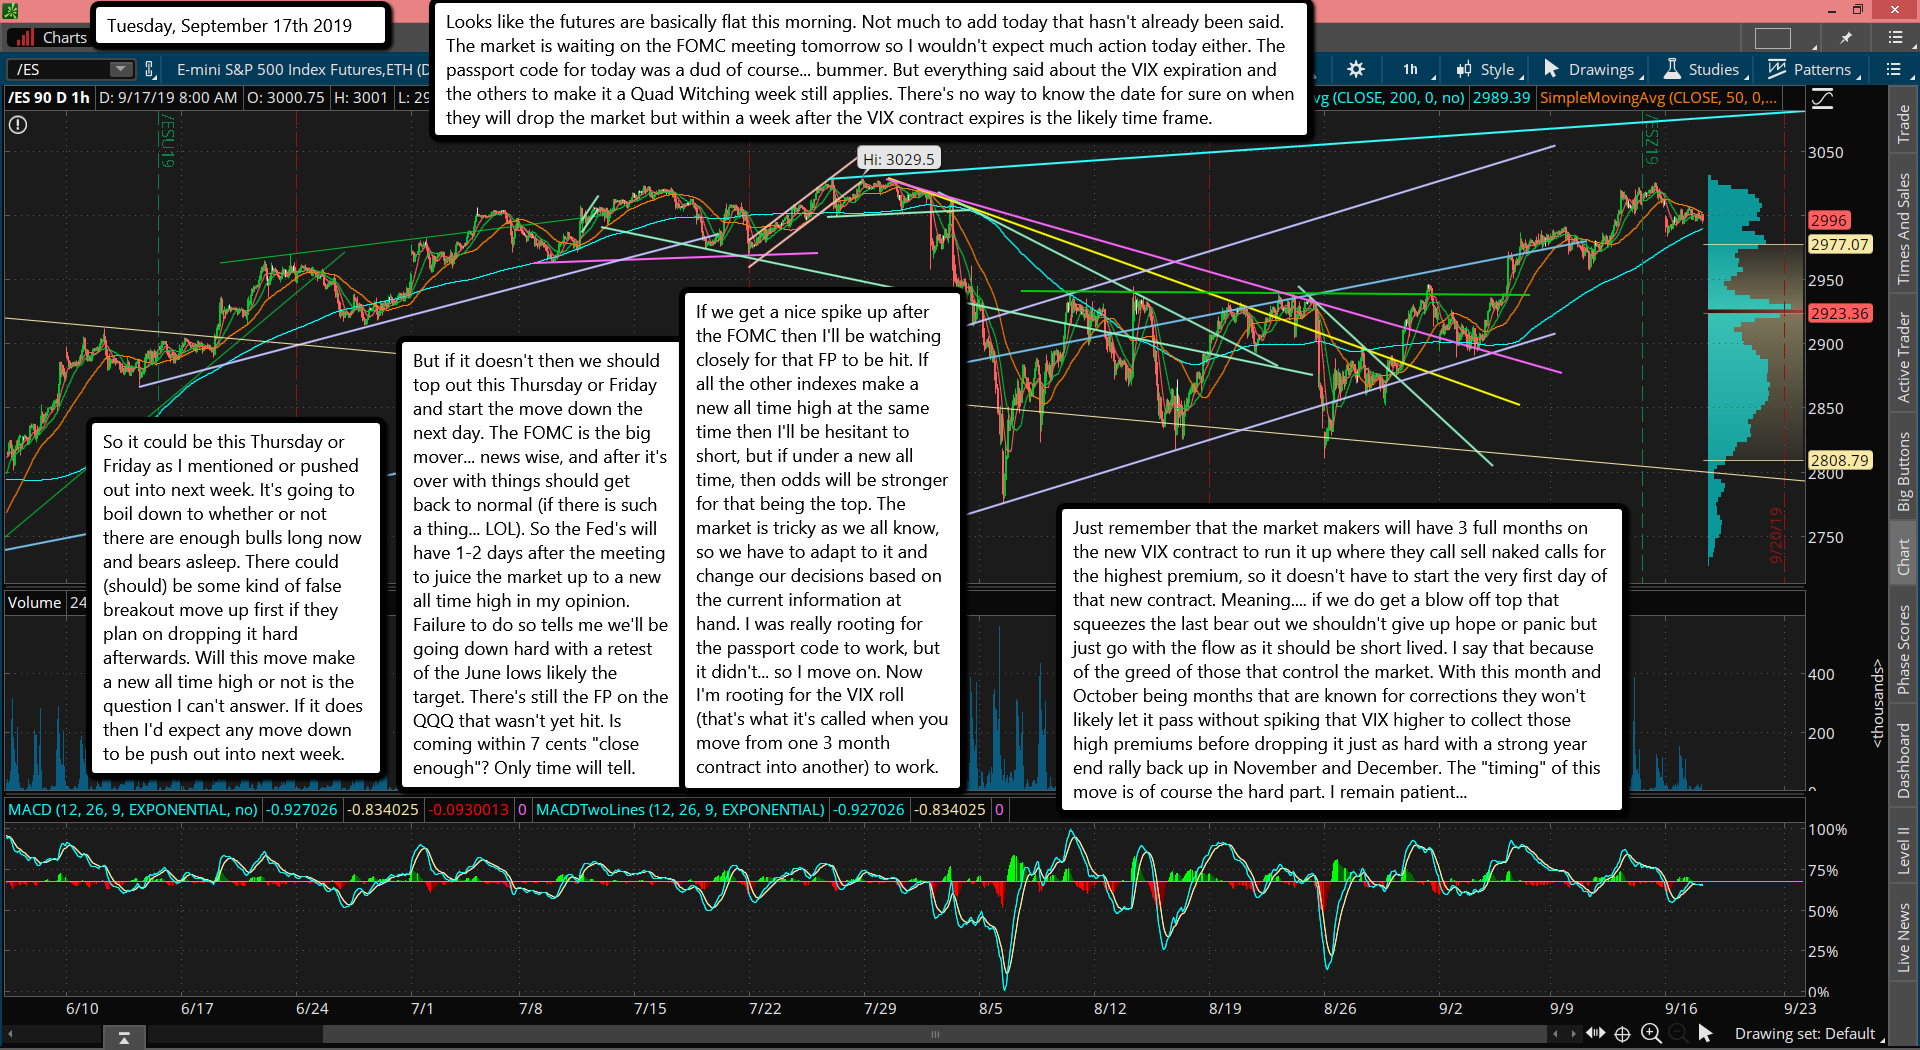
Looks like the futures are basically flat this morning. Not much to add today that hasn't already been said. The market is waiting on the FOMC meeting tomorrow so I wouldn't expect much action today either. The passport code for today was a dud of course... bummer. But everything said about the VIX expiration and the others to make it a Quad Witching week still applies. There's no way to know the date for sure on when they will drop the market but within a week after the VIX contract expires is the likely time frame.

So it could be this Thursday or Friday as I mentioned or pushed out into next week. It's going to boil down to whether or not there are enough bulls long now and bears asleep. There could (should) be some kind of false breakout move up first if they plan on dropping it hard afterwards. Will this move make a new all time high or not is the question I can't answer. If it does then I'd expect any move down to be push out into next week.

But if it doesn't then we should top out this Thursday or Friday and start the move down the next day. The FOMC is the big mover... news wise, and after it's over with things should get back to normal (if there is such a thing... LOL). So the Fed's will have 1-2 days after the meeting to juice the market up to a new all time high in my opinion. Failure to do so tells me we'll be going down hard with a retest of the June lows likely the target. There's still the FP on the QQQ that wasn't yet hit. Is coming within 7 cents "close enough"? Only time will tell.

If we get a nice spike up after the FOMC then I'll be watching closely for that FP to be hit. If all the other indexes make a new all time high at the same time then I'll be hesitant to short, but if under a new all time, then odds will be stronger for that being the top. The market is tricky as we all know, so we have to adapt to it and change our decisions based on the current information at hand. I was really rooting for the passport code to work, but it didn't... so I move on. Now I'm rooting for the VIX roll (that's what it's called when you move from one 3 month contract into another) to work.

Just remember that the market makers will have 3 full months on the new VIX contract to run it up where they call sell naked calls for the highest premium, so it doesn't have to start the very first day of that new contract. Meaning.... if we do get a blow off top that squeezes the last bear out we shouldn't give up hope or panic but just go with the flow as it should be short lived. I say that because of the greed of those that control the market. With this month and October being months that are known for corrections they won't likely let it pass without spiking that VIX higher to collect those high premiums before dropping it just as hard with a strong year end rally back up in November and December. The "timing" of this move is of course the hard part. I remain patient...

ES Morning Update September 16th 2019

0

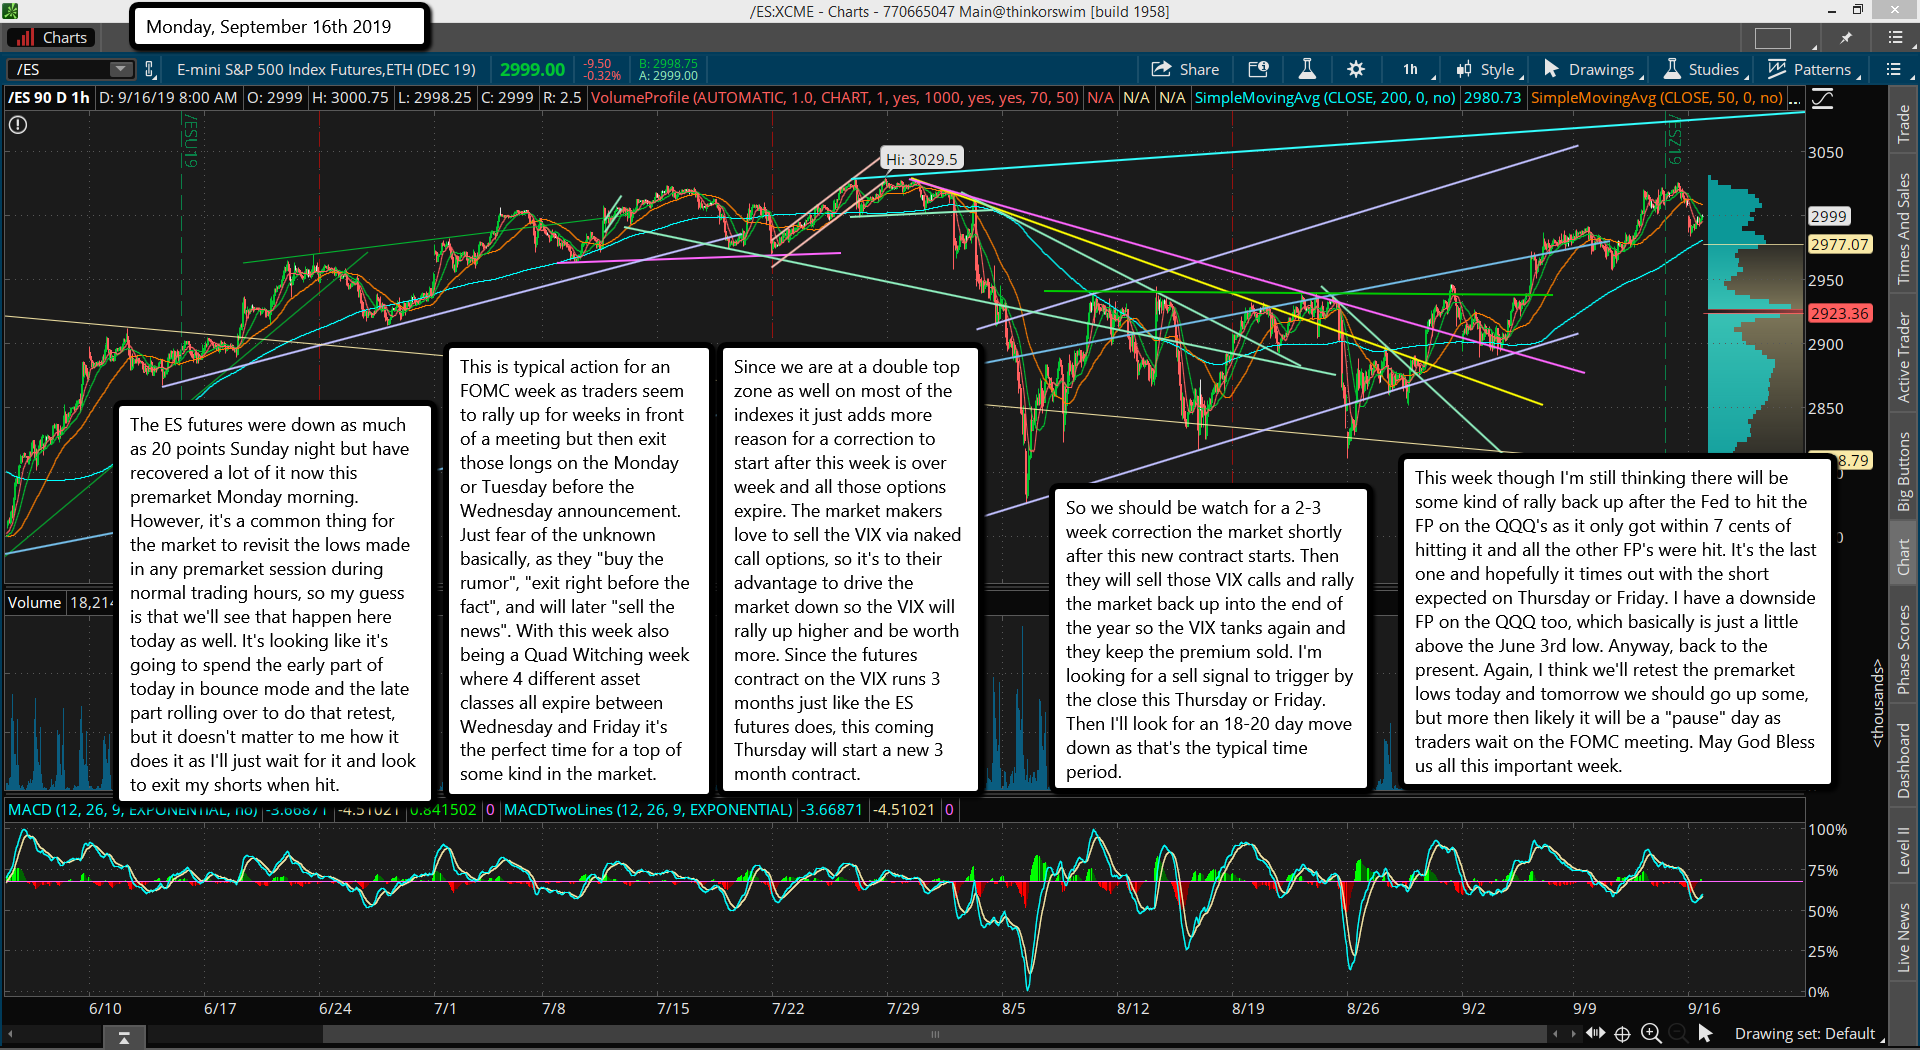
The ES futures were down as much as 20 points Sunday night but have recovered a lot of it now this premarket Monday morning. However, it's a common thing for the market to revisit the lows made in any premarket session during normal trading hours, so my guess is that we'll see that happen here today as well. It's looking like it's going to spend the early part of today in bounce mode and the late part rolling over to do that retest, but it doesn't matter to me how it does it as I'll just wait for it and look to exit my shorts when hit.

This is typical action for an FOMC week as traders seem to rally up for weeks in front of a meeting but then exit those longs on the Monday or Tuesday before the Wednesday announcement. Just fear of the unknown basically, as they "buy the rumor", "exit right before the fact", and will later "sell the news". With this week also being a Quad Witching week where 4 different asset classes all expire between Wednesday and Friday it's the perfect time for a top of some kind in the market.

Since we are at a double top zone as well on most of the indexes it just adds more reason for a correction to start after this week is over week and all those options expire. The market makers love to sell the VIX via naked call options, so it's to their advantage to drive the market down so the VIX will rally up higher and be worth more. Since the futures contract on the VIX runs 3 months just like the ES futures does, this coming Thursday will start a new 3 month contract.

So we should be watch for a 2-3 week correction the market shortly after this new contract starts. Then they will sell those VIX calls and rally the market back up into the end of the year so the VIX tanks again and they keep the premium sold. I'm looking for a sell signal to trigger by the close this Thursday or Friday. Then I'll look for an 18-20 day move down as that's the typical time period.

This week though I'm still thinking there will be some kind of rally back up after the Fed to hit the FP on the QQQ's as it only got within 7 cents of hitting it and all the other FP's were hit. It's the last one and hopefully it times out with the short expected on Thursday or Friday. I have a downside FP on the QQQ too, which basically is just a little above the June 3rd low. Anyway, back to the present. Again, I think we'll retest the premarket lows today and tomorrow we should go up some, but more then likely it will be a "pause" day as traders wait on the FOMC meeting. May God Bless us all this important week.

s2Member®