Saturday, November 21, 2026
Home Blog Page 76

Delta: ‘Large-scale cancellations’ after crippling power outage

0

Delta grounds departing flights due to system outage The week got off to a bad start for Delta passengers.

Delta Air Lines flights were grounded for at least six hours early Monday by a global computer system outage, causing large-scale cancellations and stranding hundreds of thousands of passengers.

At 8:40 a.m. ET, Delta said the ground stop had been lifted but that only "limited" departures had resumed. It's expected that flights will be delayed and canceled throughout the day.

"Customers heading to the airport should expect delays and cancellations," Delta warned. "While inquiries are high and wait times are long, our customer service agents are doing everything they can to assist."

Delta(DAL), the world's second largest airline, said the problem was a power outage at its Atlanta hub.

The number of flights and passengers affected by the problem was not immediately available. But Delta, on average, operates about 15,000 daily flights, carrying an average of 550,000 daily passengers during the summer.

The cause of the power outage was not immediately known. U.S. law enforcement officials are working with Delta, a U.S. official told CNN. But there are no indications that a computer hack is responsible. Delta has given indications it does not believe it was hacked.

Getting information on the status of flights was particularly frustrating for passengers.

Delta conceded it was having trouble providing accurate flight status on airport departure boards, at delta.com, the Fly Delta App and from Delta representatives on the phone.

The airline said if a flight is canceled or significantly delayed, passengers will be entitled to a refund, though it did not specify what is considered "significantly" delayed.

Even passengers booked on a flight Monday whose flights are not canceled can make a one-time change to their tickets without the normal fee. But they could have to pay the difference in fare for a new flight. They will need to start travel by this Friday to benefit from the lack of a change fee.

The Joseph family from Suffern, New York, arrived at LaGuardia Airport in New York for a flight to Orlando, the start of a vacation to Disney World for their six children.

"Delta is just saying the systems are down and we are going to be late," said Frantzy Joseph, the family's father.

"We're feeling OK. We're excited to go Disneyworld. We just want to catch the flight," said Claudia Joseph, the family's mother.

Passengers on Twitter reported problems -- including the inability to check in or being stuck on the tarmac -- from airports around the world, including San Francisco, Rome and Athens.

"The airline provided passengers with little information," said New Yorker Carly Hayes, who was due to travel from Fiumicino Airport in Rome to New York's JFK, in an Instagram post.

Jackie Watanabe, who was due to travel from Las Vegas to Minneapolis, tweeted that the airline was handing out blankets to passengers who wanted to get some sleep on the floor of the terminal there.

"I'm not ready to go into camping mode yet, but other passengers are," she said, tweeting a photo of sleeping passengers.

delta delays jackie wantabe

Sean Carson, due to travel from Kona, Hawaii, to Los Angeles, said he had been on a plane for more than four hours. He told CNN the pilot announced earlier that pizza was being delivered.

Reports of delays on social media appeared to have begun around 3 a.m. ET.

Delta's problems come less than three weeks after Southwest Airlines canceled more than 1,000 flights following a system outage.

Facebook takes aim at ad-blocking software

0
facebook screenFacebook has fired a warning shot at ad-blocking software by making changes that will force desktop users to see adverts.

The rising popularity of ad-blockers poses a threat to online businesses that rely on advertising revenue.

The social network told users it understood how annoying ads could be.

It promised to better offer tools for controlling what material does make it through to users' newsfeeds.

"As we offer people more powerful controls, we'll also begin showing ads on Facebook desktop for people who currently use ad blocking software," said Facebook's advertising vice-president Andrew Bosworth in a blog post.

Users will be allowed to customize the types of adverts they see by selecting the brands and businesses they prefer.

"People don't like to see ads that are irrelevant to them or that disrupt or break their experience," Mr Bosworth added.

Ad-blockers do not usually work on mobile devices, which account for most visits to Facebook, but nevertheless prevent advertising worth billions from being seen.

Facebook generated $6.2bn (£4.7bn) in revenue from adverting in the most recent quarter.

About 200 million people worldwide use ad-blocking software on their computers.

The move is likely to rekindle a debate between content providers that rely on advertising revenue and users trying to avoid unwanted commercials.

This is not Facebook's first step at controlling what users see in their newsfeeds.

Earlier this month it took steps to limit "clickbait" stories - articles that carry headlines that make a story seem more interesting than it actually is.

Wholesale inventories up 0.3% in June

0

A forklift operator loads a semi-trailer with pallets of seasoning at the Badia Spices factory in Doral, Florida.

A forklift operator loads a semi-trailer with pallets of seasoning at the Badia Spices factory in Doral, Florida.

U.S. wholesale inventories unexpectedly rose in June on gains in stocks of farm products and other nondurable goods, suggesting an upward revision to the second-quarter economic growth estimate.

The Commerce Department said on Tuesday that wholesale inventories increased 0.3 percent after having been initially estimated as unchanged. Inventories for May were revised up to show a 0.2 percent rise instead of the previously reported 0.1 percent gain.

Economists had forecast wholesale inventories unchanged in June in line with the government's estimate last month. That unchanged reading was incorporated in the advance second-quarter gross domestic product estimate published last month.

The component of wholesale inventories that goes into the calculation of GDP—wholesale stocks excluding autos—increased 0.3 percent in June. That would imply a mild upward revision to the second-quarter GDP growth estimate.

An outright drop in inventory investment subtracted almost 1.2 percentage points from GDP growth in the second quarter, restricting the rise in output to a tepid 1.2 percent annualized rate. Inventories have weighed on GDP growth since the second quarter of 2015 as businesses sell piles of unwanted goods.

In June, wholesale stocks of farm products increased 4.0 percent after rising 6.2 percent in May. Wholesale inventories of drugs surged 4.9 percent after declining 3.8 percent in May. Auto inventories dipped 0.1 percent in June.

Sales at wholesalers jumped 1.9 percent after rising 0.7 percent in May. In June, it would have taken wholesalers 1.33 months to clear shelves, down from 1.35 months in May.

What are markets doing? Check here.

ES Morning Update August 9th 2016

0

b7db5ad5-e0d9-4025-83c9-03f770f2087b

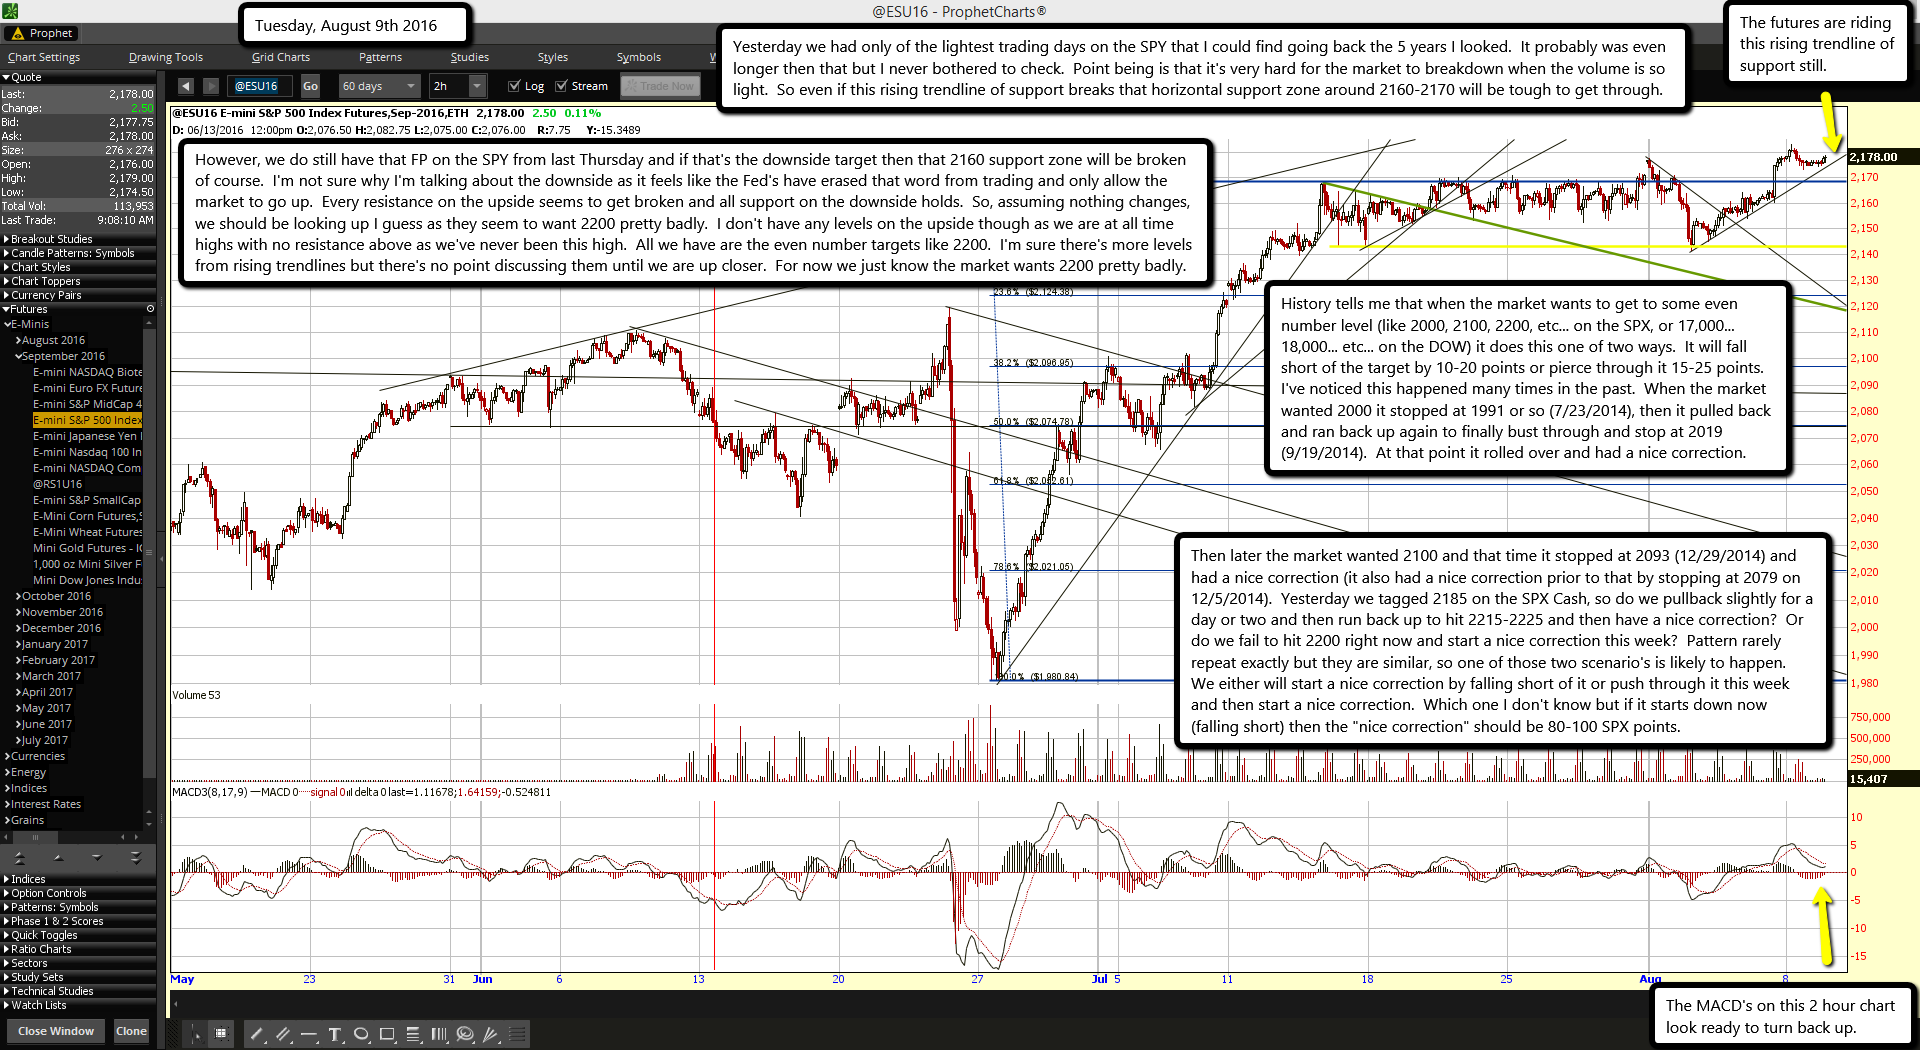
The futures are riding this rising trendline of support still.

The MACD's on this 2 hour chart look ready to turn back up.

Yesterday we had only of the lightest trading days on the SPY that I could find going back the 5 years I looked.  It probably was even longer then that but I never bothered to check.  Point being is that it's very hard for the market to breakdown when the volume is so light.  So even if this rising trendline of support breaks that horizontal support zone around 2160-2170 will be tough to get through.

However, we do still have that FP on the SPY from last Thursday and if that's the downside target then that 2160 support zone will be broken of course.  I'm not sure why I'm talking about the downside as it feels like the Fed's have erased that word from trading and only allow the market to go up.  Every resistance on the upside seems to get broken and all support on the downside holds.  So, assuming nothing changes, we should be looking up I guess as they seem to want 2200 pretty badly.  I don't have any levels on the upside though as we are at all time highs with no resistance above as we've never been this high.  All we have are the even number targets like 2200.  I'm sure there's more levels from rising trendlines but there's no point discussing them until we are up closer.  For now we just know the market wants 2200 pretty badly.

History tells me that when the market wants to get to some even number level (like 2000, 2100, 2200, etc... on the SPX, or 17,000... 18,000... etc... on the DOW) it does this one of two ways.  It will fall short of the target by 10-20 points or pierce through it 15-25 points.  I've noticed this happened many times in the past.  When the market wanted 2000 it stopped at 1991 or so (7/23/2014), then it pulled back and ran back up again to finally bust through and stop at 2019 (9/19/2014).  At that point it rolled over and had a nice correction.

Then later the market wanted 2100 and that time it stopped at 2093 (12/29/2014) and had a nice correction (it also had a nice correction prior to that by stopping at 2079 on 12/5/2014).  Yesterday we tagged 2185 on the SPX Cash, so do we pullback slightly for a day or two and then run back up to hit 2215-2225 and then have a nice correction?  Or do we fail to hit 2200 right now and start a nice correction this week?  Pattern rarely repeat exactly but they are similar, so one of those two scenario's is likely to happen.  We either will start a nice correction by falling short of it or push through it this week and then start a nice correction.  Which one I don't know but if it starts down now (falling short) then the "nice correction" should be 80-100 SPX points.

ES Morning Update August 8th 2016

0

f700fdc1-d058-4ebf-9513-c0576493c54f

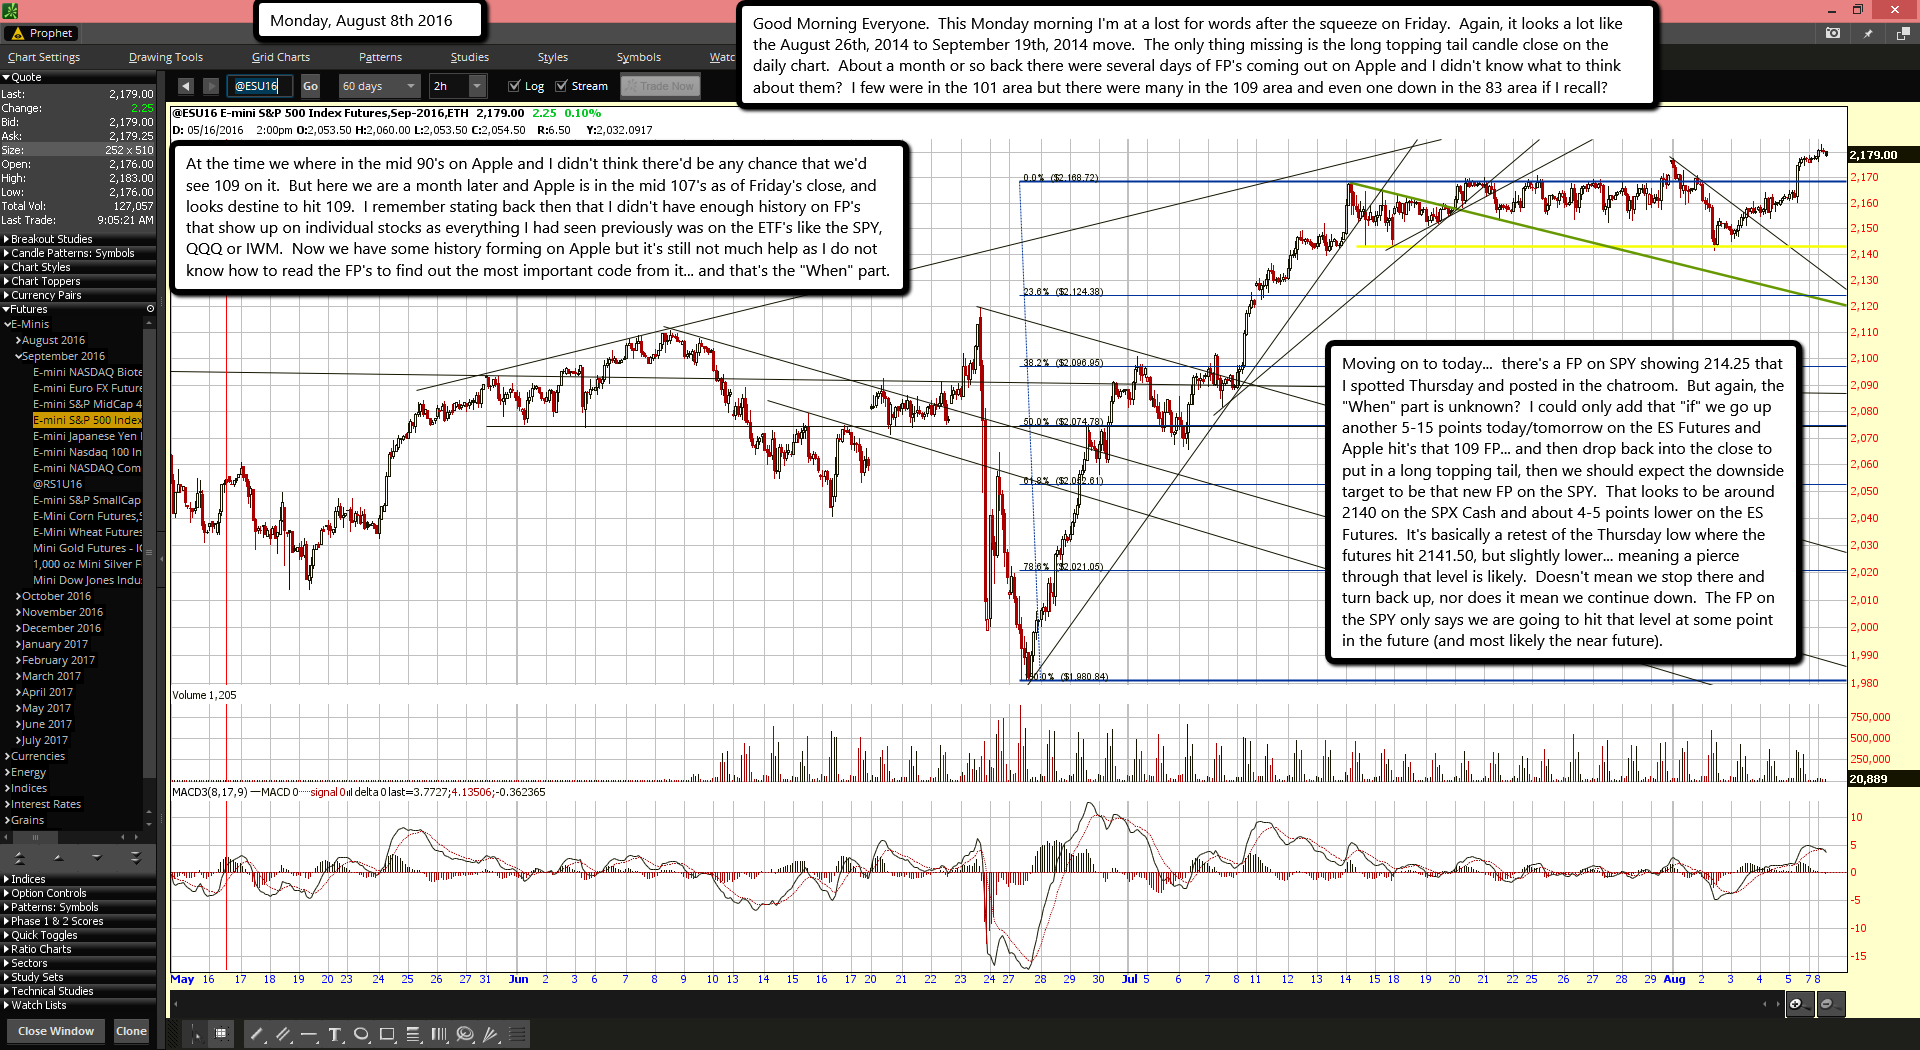
Good Morning Everyone.  This Monday morning I'm at a lost for words after the squeeze on Friday.  Again, it looks a lot like the August 26th, 2014 to September 19th, 2014 move.  The only thing missing is the long topping tail candle close on the daily chart.  About a month or so back there were several days of FP's coming out on Apple and I didn't know what to think about them?  I few were in the 101 area but there were many in the 109 area and even one down in the 83 area if I recall?

At the time we where in the mid 90's on Apple and I didn't think there'd be any chance that we'd see 109 on it.  But here we are a month later and Apple is in the mid 107's as of Friday's close, and looks destine to hit 109.  I remember stating back then that I didn't have enough history on FP's that show up on individual stocks as everything I had seen previously was on the ETF's like the SPY, QQQ or IWM.  Now we have some history forming on Apple but it's still not much help as I do not know how to read the FP's to find out the most important code from it... and that's the "When" part.

Moving on to today...  there's a FP on SPY showing 214.25 that I spotted Thursday and posted in the chatroom.  But again, the "When" part is unknown?  I could only add that "if" we go up another 5-15 points today/tomorrow on the ES Futures and Apple hit's that 109 FP... and then drop back into the close to put in a long topping tail, then we should expect the downside target to be that new FP on the SPY.  That looks to be around 2140 on the SPX Cash and about 4-5 points lower on the ES Futures.  It's basically a retest of the Thursday low where the futures hit 2141.50, but slightly lower... meaning a pierce through that level is likely.  Doesn't mean we stop there and turn back up, nor does it mean we continue down.  The FP on the SPY only says we are going to hit that level at some point in the future (and most likely the near future).

OPEC oil freeze talks may be resurrected

0
EPA AUSTRIA ECONOMY OPEC EBF ENERGY & RESOURCES AUT

The Organization of the Petroleum Exporting Countries may resurrect its heretofore futile attempts to freeze petroleum output in a bid to inject life into oil prices.

OPEC member countries will hold an informal meeting "on the sidelines" of the International Energy Forum from Sept. 26-28 in Algeria, the organization said Monday in a statement.

The meeting comes about a week after oil prices briefly tumbled below $40 per barrel amid renewed fears of a global glut of oil, which had sent the commodity spiraling below $30 per barrel earlier this year before a sharp rebound to above $50 enticed some producers to get back in the game.

OPEC countries have considered an output freeze multiple times over the last year, but have failed to reach a consensus each time, including the latest attempt in June. The group's stranglehold on global oil prices has loosened in recent years amid political tension between Saudi Arabia and Iran, the surge of U.S. production and concerns about global economic growth.

"OPEC continues to monitor developments closely, and is in constant deliberations with all member states on ways and means to help restore stability and order to the oil market," OPEC said Monday.

Despite the stalemate that has gripped OPEC at recent meetings, traders appeared encouraged by the prospect of fresh talks over a deal. The price of West Texas Intermediate oil, the U.S. benchmark, rose 2.1% to $42.66 at 8:17 a.m. Brent crude, the global benchmark, rose 1.9% to $45.09.

"While the last try a few months ago failed spectacularly, declarations from some OPEC countries indicate that another stab at cooperation on a freeze deal may be attempted in September," JBC Energy analysts said Monday in a research note. "This is indicative of the significant pressure some of these producers are under in terms of their economies."

Any encouragement drawn from the possibility of an OPEC freeze may be offset by the prospect of additional U.S. production coming online.

The number of active U.S. oil rigs is up 21% since its May low, according to Goldman Sachs. More U.S. oil could keep prices low.

Bitfinex users set to lose 36% of their holding in bitcoin hack

0
A man walks out of a shop displaying a bitcoin sign during the opening ceremony of the first bitcoin retail shop in Hong Kong.A man walks out of a shop displaying a bitcoin sign during the opening ceremony of the first bitcoin retail shop in Hong Kong.
Bitfinex allows users to trade in several different digital currencies, including bitcoin, and deposit U.S. dollars in their account.

A total of 119,756 bitcoins, worth $70.5 million at today's price, were stolen as a result of a cybersecurity breach.

Bitfinex's decision is likely to disappoint many of the site's users who held assets other than bitcoins, warned Charles Hayter, chief executive and founder of digital currency comparison website CryptoCompare.

"What's disappointing is that the losses seem to be arbitrarily decided with larger operators being offered sweetners to keep them trading - and there is little clarity on BitFinex's company losses," Hayter told CNBC via email.

To compensate users, BitFinex is crediting each account with a digital token that will record how much the customer has lost as a result of the hack. These tokens will either be redeemed in full by the company in the future or they can be exchanged for shares in BitFinex's parent company, iFinex Inc. The statement did not specify any timeframe for the redemption.

"The convertible debt token is a way of kicking the can down the road and finding breathing space for the exchange - it opens up interesting trading possibilities with its junk status as well as a fair few legal ramifications," explained Hayter.

Hayter criticised BitFinex's latest attempt to deal with the situation.

"It's all been desperately scrambled together to give some form of closure - although a lot of their plan has not been fully fleshed out with details thin on the ground," he said.

ES Morning Update August 5th 2016

0

2e3cbd5e-5485-4fb3-9628-35ae2fc93895

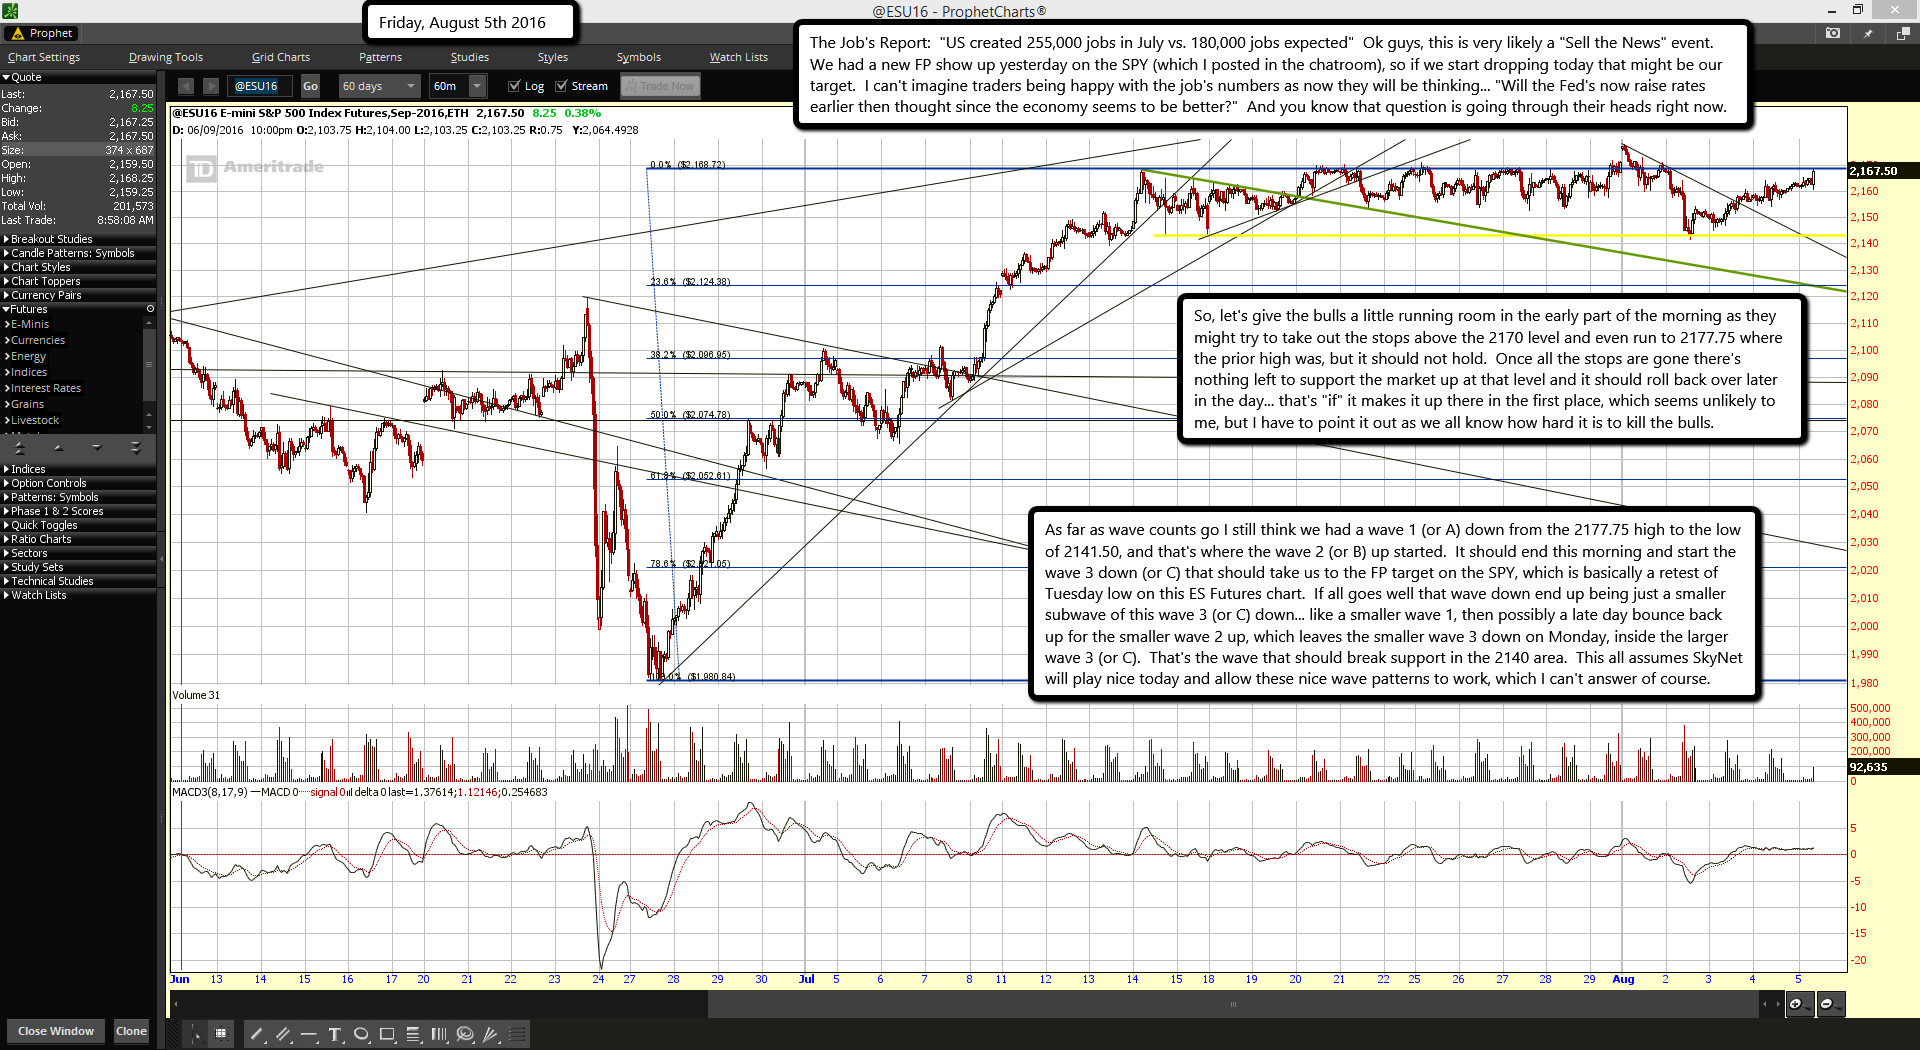
The Job's Report:  "US created 255,000 jobs in July vs. 180,000 jobs expected"  Ok guys, this is very likely a "Sell the News" event.  We had a new FP show up yesterday on the SPY (which I posted in the chatroom), so if we start dropping today that might be our target.  I can't imagine traders being happy with the job's numbers as now they will be thinking... "Will the Fed's now raise rates earlier then thought since the economy seems to be better?"  And you know that question is going through their heads right now.

So, let's give the bulls a little running room in the early part of the morning as they might try to take out the stops above the 2170 level and even run to 2177.75 where the prior high was, but it should not hold.  Once all the stops are gone there's nothing left to support the market up at that level and it should roll back over later in the day... that's "if" it makes it up there in the first place, which seems unlikely to me, but I have to point it out as we all know how hard it is to kill the bulls.

As far as wave counts go I still think we had a wave 1 (or A) down from the 2177.75 high to the low of 2141.50, and that's where the wave 2 (or B) up started.  It should end this morning and start the wave 3 down (or C) that should take us to the FP target on the SPY, which is basically a retest of Tuesday low on this ES Futures chart.  If all goes well that wave down end up being just a smaller subwave of this wave 3 (or C) down... like a smaller wave 1, then possibly a late day bounce back up for the smaller wave 2 up, which leaves the smaller wave 3 down on Monday, inside the larger wave 3 (or C).  That's the wave that should break support in the 2140 area.  This all assumes SkyNet will play nice today and allow these nice wave patterns to work, which I can't answer of course.

Inside The Titanic II: Identical Replica Of Titanic To Set Sail In 2018

0

Clive Palmer has an unsinkable dream: to have a replica of the Titanic set sail sometime in 2018. The Australian businessman first began planning the project in 2012, but the original launch was delayed. Now, 106 years after the untimely end of the ship’s namesake, the Titanic II is planned to embark on its maiden voyage from Jiangsu in Eastern China to Dubai.

“The new Titanic will of course have modern evacuation procedures, satellite controls, digital navigation and radar systems and all those things you’d expect on a 21st century ship,” assures James McDonald, the marketing director of Blue Star Line. For example, the new ship will have a 2,700 lifeboat capacity for its 2,435 member crew, as opposed to the original’s lifeboat capacity of 1,178 for its 2,223 passengers.

Grand staircase

Historically, the grand staircase was reserved for first-class passengers

Café Parisien

Built to look like a sidewalk cafe in France, the Café Parisien was also reserved for first class passengers

The Smoking Room, resembling a London gentlemen’s club, was a place for men to relax

The pool

On the original ship, the pool was filled with salt water after the ship had set sail

Marconi room, where “state of the art” technology allowed passengers to send messages

First class stateroom

The first class dining saloon

The first class dining room spanned the entire width of the ship

Second class cabins

Turkish bath, similar to a sauna

The bridge

Third class dining saloon, where passengers ate communally

The dining room’s menu changed daily

The original Titanic

Titanic II

Watch a video about the new ship below:


In case you forgot about the "reason" the Titanic was sunk in the first place I suggest you watch this video:

The Titanic (Olympic) was deliberately sunk to drown the opposition to the federal reserve in 1912 and on 1913 the federal reserve was created and than in 1914 world war 1 started financed in both sides by this federal bank by making money out of thin air in order to build a new world order for Jewish supremacy

What does this say for 2018 you ask? Possibly it's saying that a new Central Bank is coming to replace the Federal Reverse? I'm not sure really but "they" have something planned for this period I'll bet. Maybe it's the currency devaluation year? Just random thoughts...

Red

ES Morning Update August 4th 2016

0

ES Morning Update August 4th 2016

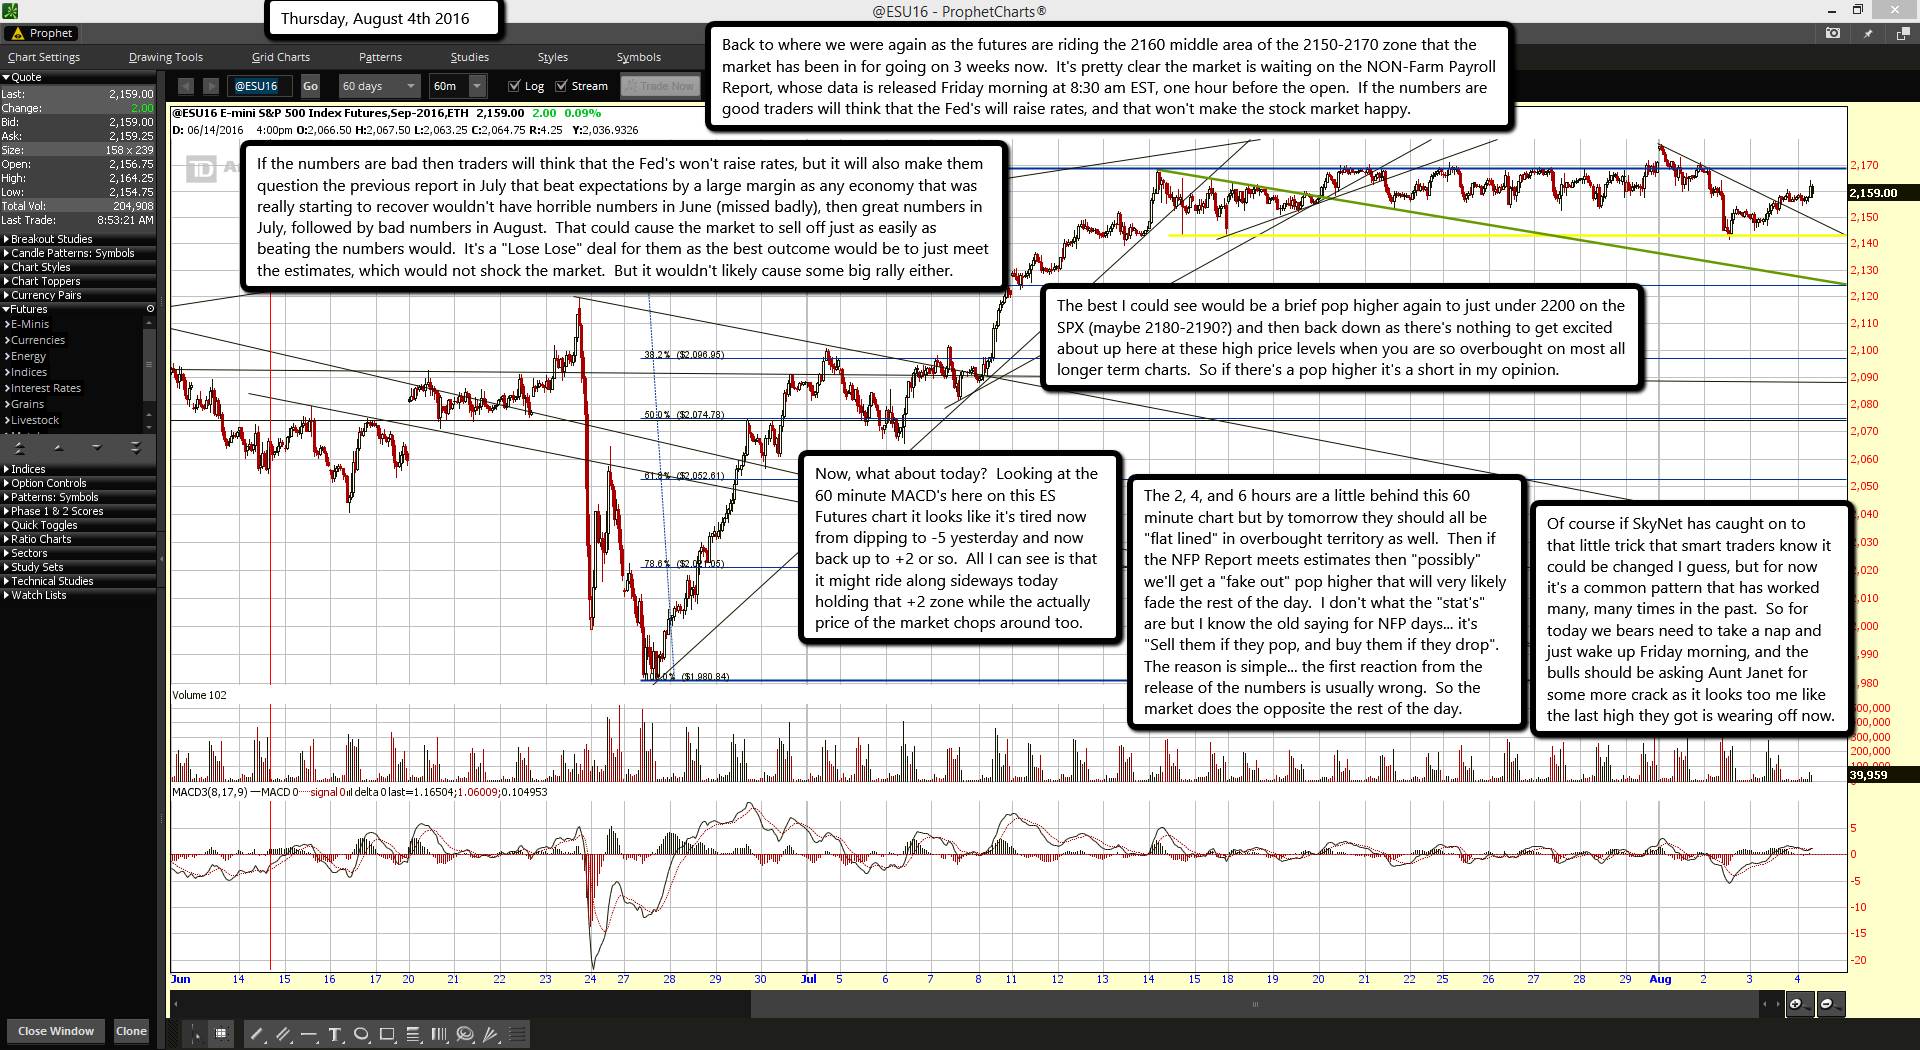
Back to where we were again as the futures are riding the 2160 middle area of the 2150-2170 zone that the market has been in for going on 3 weeks now.  It's pretty clear the market is waiting on the NON-Farm Payroll Report, whose data is released Friday morning at 8:30 am EST, one hour before the open.  If the numbers are good traders will think that the Fed's will raise rates, and that won't make the stock market happy.

If the numbers are bad then traders will think that the Fed's won't raise rates, but it will also make them question the previous report in July that beat expectations by a large margin as any economy that was really starting to recover wouldn't have horrible numbers in June (missed badly), then great numbers in July, followed by bad numbers in August.  That could cause the market to sell off just as easily as beating the numbers would.  It's a "Lose Lose" deal for them as the best outcome would be to just meet the estimates, which would not shock the market.  But it wouldn't likely cause some big rally either.

The best I could see would be a brief pop higher again to just under 2200 on the SPX (maybe 2180-2190?) and then back down as there's nothing to get excited about up here at these high price levels when you are so overbought on most all longer term charts.  So if there's a pop higher it's a short in my opinion.

Now, what about today?  Looking at the 60 minute MACD's here on this ES Futures chart it looks like it's tired now from dipping to -5 yesterday and now back up to +2 or so.  All I can see is that it might ride along sideways today holding that +2 zone while the actually price of the market chops around too.

The 2, 4, and 6 hours are a little behind this 60 minute chart but by tomorrow they should all be "flat lined" in overbought territory as well.  Then if the NFP Report meets estimates then "possibly" we'll get a "fake out" pop higher that will very likely fade the rest of the day.  I don't what the "stat's" are but I know the old saying for NFP days... it's "Sell them if they pop, and buy them if they drop".  The reason is simple... the first reaction from the release of the numbers is usually wrong.  So the market does the opposite the rest of the day.

Of course if SkyNet has caught on to that little trick that smart traders know it could be changed I guess, but for now it's a common pattern that has worked many, many times in the past.  So for today we bears need to take a nap and just wake up Friday morning, and the bulls should be asking Aunt Janet for some more crack as it looks too me like the last high they got is wearing off now.

Trump v. Clinton: Stocks can predict the winner

0

Forget the polls. Wall Street has another way to predict whether Donald Trump or Hillary Clinton will be the next president of the United States.

Keep an eye on the stock market from August 1 through October 31.

presidential election

If stocks go up during that three month stretch, expect Clinton to win. If stocks slide, Trump will likely prevail.

Those critical three months have been astonishingly accurate at predicting the next president, says Sam Stovall, a stock market expert at S&P Global Market Intelligence.

Stovall looked at the data for every presidential election going back to 1944 (FDR v. Dewey). If stocks rose in price from July 31 to October 31, the party that currently controlled the White House won the election 82% of the time.

This year, the key stretch will start on August 1, since July 31 is a Sunday.

Similarly, if stocks (measured by the S&P 500 index that tracks the performance of 500 of America's largest companies) fell, voters opted to kick out the party in power and replace it 86% of the time.

"We all know that prices lead fundamentals. And more times than not, S&P 500 price returns identified whether the incumbent president, or his party, was reelected or replaced," wrote Stovall in his report on elections and the market.

The basic idea is that if the economy is growing and people think the good times will continue, they are likely to want to stick with the same presidential party (in this case the Democrats). If they are fearful, stocks tend to fall, and voters want new leadership.

The only times that the stock market predictor didn't work were in years where a strong third party candidate was involved (e.g. 1968 or 1980) or when there was a surprise geopolitical shock like 1956 when England and France seized the Suez Canal from Egypt.

The third party factor could be make Election 2016 more difficult to predict too. Libertarian Gary Johnson has been polling around 10%.

The stock market is coming into the "presidential predictor stretch" near all-time highs. Wall Street experts have very mixed views on whether it can go up more from here.

Goldman Sachs: Avoid stocks for next 3 months

0


Goldman Sachs thinks the good times may be over for stocks for a little while.

July was great for the market, with the S&P 500 rising nearly 4% and setting seven record closing highs. Fears about Brexit faded, allowing more than 90% of investors to make money last month, according to data shared exclusively with CNNMoney by Openfolio.

But Goldman Sachs is warning that stocks "remain expensive and earnings growth is poor." The influential investment bank downgraded stocks to "underweight" over the next three months.

"Until the growth situation improves, we are not that constructive on equities, particularly after this type of rally," Goldman strategists wrote in a report Sunday.

Growth concerns were magnified on Friday, when investors learned that the U.S. economy grew at sluggish 1.2% pace between April and June. That sobering GDP report dashed hopes for a spring rebound from the first quarter's anemic 0.8% growth pace.

Dow bounces back Brexit

Stocks may be more vulnerable to disappointing news because of how far they've climbed lately. The Dow is currently sitting at 18,400, or roughly 3,000 points above its mid-February low. That's a huge move.

Goldman isn't going out on a limb by warning of possible turmoil in the next few months. History shows the August/September period can be rough for stocks. Those two months are the worst for the S&P 500 in terms of monthly price increases since World War II, according to S&P Global Market Intelligence.

The challenges may be greater this time around. Not only does growth remain elusive for much of the globe, but there is a lot of uncertainty about policy. Goldman cited the Brexit negotiations in Europe, China's attempt to manage its slowdown and the looming presidential election in the U.S.

The other problem is that stocks look pricey. The S&P 500 is trading at 17.87 times its projected earnings over the next 12 months, the loftiest multiple since June 2004, according to S&P.

The bulls are hoping that earnings, the real driver of stock prices, will catch up to the market. While tech companies like Facebook (FB, Tech30) and Amazon(AMZN, Tech30) have reported blockbuster profits, the S&P 500 is still on track to report its fourth consecutive quarter of shrinking earnings.

Even if profits don't rebound, the markets have been supported by extremely low bond yields that make stocks look cheaper by comparison. But many worry that bonds are in the middle of a massive bubble that will eventually reverse.

All of this explains why Goldman Sachs is advising clients to put money into cash. Some investors are doing just that. The average Openfolio portfolio in July held 10.3% in cash, up from 8.2% in May.

But Goldman isn't telling people to keep their money under the mattress. The firm remains neutral on stocks over the next 12 months and told investors to "look for opportunities to re-enter upon pullback in equities."

ES Morning Update August 3rd 2016

0

c2777d0d-c84c-4425-9e72-245d970a54f2

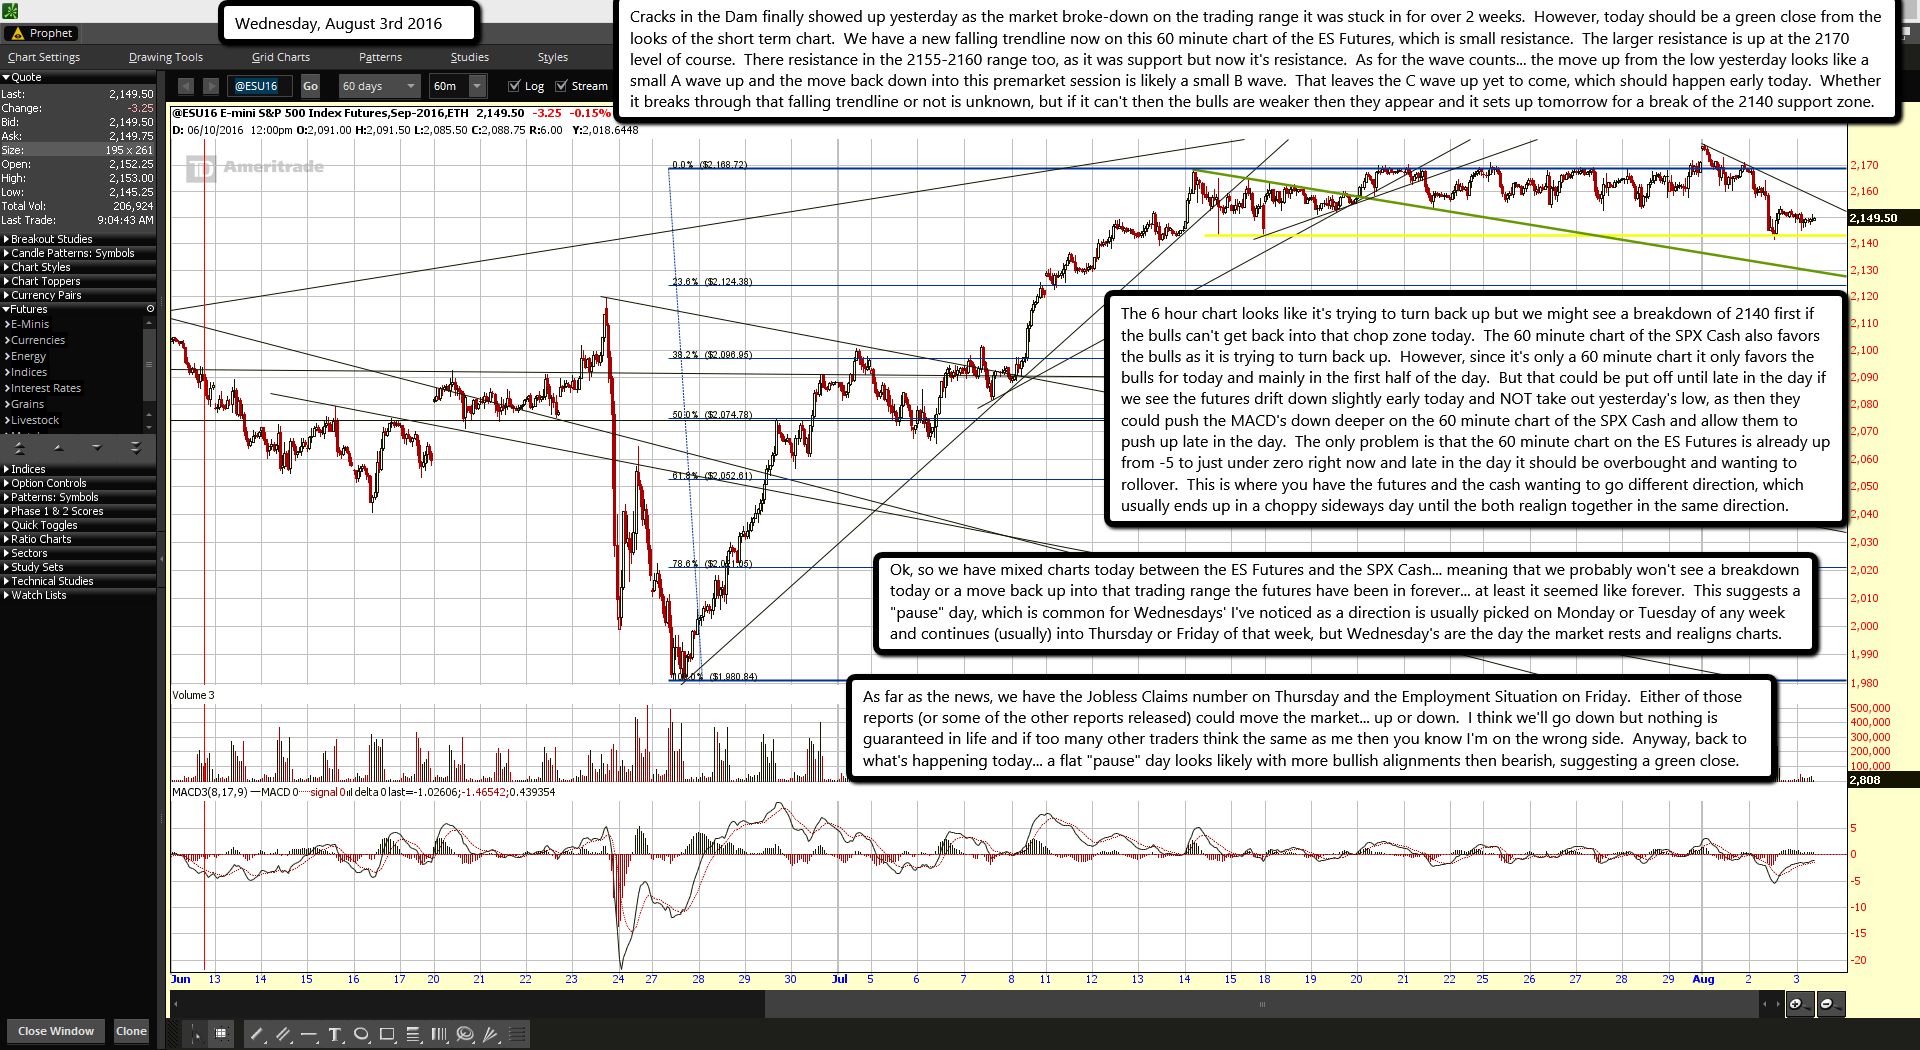
Cracks in the Dam finally showed up yesterday as the market broke-down on the trading range it was stuck in for over 2 weeks.  However, today should be a green close from the looks of the short term chart.  We have a new falling trendline now on this 60 minute chart of the ES Futures, which is small resistance.  The larger resistance is up at the 2170 level of course.  There resistance in the 2155-2160 range too, as it was support but now it's resistance.  As for the wave counts... the move up from the low yesterday looks like a small A wave up and the move back down into this premarket session is likely a small B wave.  That leaves the C wave up yet to come, which should happen early today.  Whether it breaks through that falling trendline or not is unknown, but if it can't then the bulls are weaker then they appear and it sets up tomorrow for a break of the 2140 support zone.

The 6 hour chart looks like it's trying to turn back up but we might see a breakdown of 2140 first if the bulls can't get back into that chop zone today.  The 60 minute chart of the SPX Cash also favors the bulls as it is trying to turn back up.  However, since it's only a 60 minute chart it only favors the bulls for today and mainly in the first half of the day.  But that could be put off until late in the day if we see the futures drift down slightly early today and NOT take out yesterday's low, as then they could push the MACD's down deeper on the 60 minute chart of the SPX Cash and allow them to push up late in the day.  The only problem is that the 60 minute chart on the ES Futures is already up from -5 to just under zero right now and late in the day it should be overbought and wanting to rollover.  This is where you have the futures and the cash wanting to go different direction, which usually ends up in a choppy sideways day until the both realign together in the same direction.

Ok, so we have mixed charts today between the ES Futures and the SPX Cash... meaning that we probably won't see a breakdown today or a move back up into that trading range the futures have been in forever... at least it seemed like forever.  This suggests a "pause" day, which is common for Wednesdays' I've noticed as a direction is usually picked on Monday or Tuesday of any week and continues (usually) into Thursday or Friday of that week, but Wednesday's are the day the market rests and realigns charts.

As far as the news, we have the Jobless Claims number on Thursday and the Employment Situation on Friday.  Either of those reports (or some of the other reports released) could move the market... up or down.  I think we'll go down but nothing is guaranteed in life and if too many other traders think the same as me then you know I'm on the wrong side.  Anyway, back to what's happening today... a flat "pause" day looks likely with more bullish alignments then bearish, suggesting a green close.

Norway to create world’s first floating underwater tunnel (VIDEO)

0
© NPRA

The Norwegian coast may be beautiful but with more than a thousand fjords cutting into it, getting from one place to another often requires lengthy journeys.

Norway’s Public Roads Administration (NPRA) has an ambitious plan to solve the problem by building the world’s first floating submerged tunnel system about 30 meters (100ft) underwater.

© NPRAThe $25 billion project will allow vehicles to travel under the Norwegian Sea avoiding a 21-hour drive along the coastline.

The route from the southern city of Kristiansand to Trondheim in the north currently includes seven ferry crossings. As most of the waterways are wide with the largest a mile deep, it is not feasible to construct a traditional bridge. The tunnel would shorten the trip to just over 10 hours.

The first-of-its kind structure will be made up of two 1,200 meter (4,000ft) curved concrete tubes, floating up to 30 meters (100ft) below the surface. The tubes will be supported by pontoons on the surface and kept stable with connecting trusses. For extra stability, the construction might be bolted to the bedrock as well.

On the surface, there would be wide gaps between the pontoons to allow ferries to pass through.

© NPRA

The first underwater tunnel will connect Oppedal and Lavik, passing through the 1,300 meter (4,300ft) deep, 1,000 meter (3,300ft) wide Sognefjord.

Traveling along the new route would feel like driving through any other tunnel, according to Arianna Minoretti, a senior engineer with the NPRA.

A fjord at sunrise, west of Drammen, Norway © Bob Strong

The submerged construction will be able to cope with rough weather that is typical for the country, according to NPRA. It will also allow easier access to rural communities.

“Having this connection means that people there do not have to wait for a helicopter to go to the hospital,” Minoretti says.

The project is planned to be completed by 2035, and will preserve the landscape for those who still want to take the scenic route, the agency says.

Nick Denton Files for Bankruptcy, Just Weeks After Gawker Did

0

Nick Denton, chief executive and founder of Gawker, in court during the company’s trial against Hulk Hogan in March.

Nick Denton, the founder and chief executive of Gawker Media, filed for personal bankruptcy on Monday to protect himself from a legal judgment awarded in March to the former professional wrestler Hulk Hogan in an invasion-of-privacy lawsuit.

“Ever since the verdict, this was a likely outcome,” Mr. Denton said in an instant message.

Gawker, which faces a $140 million judgment, filed for Chapter 11 bankruptcy in June and put itself up for sale. The company will be sold at an auction that is expected to occur later this month.

Filing for bankruptcy puts a stay on claims from creditors, including court judgments, meaning Hulk Hogan, whose real name is Terry G. Bollea, will not be able to collect his award.

Gawker is appealing the judgment made by a jury that awarded Mr. Bollea $115 million in damages and $25 million more in punitive damages. Mr. Denton is personally liable for $10 million and jointly liable for $115 million.

“I don’t have that kind of money lying around,” Mr. Denton said on Monday. “In fact, almost all my net worth is in the independent media business to which I have devoted my working life the last 14 years.”

In May it was disclosed that Peter Thiel, the billionaire Silicon Valley entrepreneur, had secretly financed Mr. Bollea’s lawsuit. He said he was also funding other legal cases against the company.

”The time has come for Nick Denton to accept responsibility for the decisions he made and the rewards he reaped based on the suffering and humiliation of others,” David Houston, a lawyer for Mr. Bollea, said in a statement. “His bankruptcy has nothing to do with who paid Mr. Bollea’s legal bills, and everything to do with Denton’s own choices and accountability.”

Mr. Bollea sued Gawker Media, Mr. Denton and Albert J. Daulerio, the former editor in chief of Gawker.com, in 2012 over Gawker’s publication of a tape that showed Mr. Bollea having sex with a woman who was the wife of his former friend. Mr. Daulerio, who was ordered to pay $100,000, is also expected to file for bankruptcy.

In his Chapter 11 bankruptcy petition, Mr. Denton listed $10 million to $50 million in assets and $100 million to $500 million in liabilities.

Mr. Denton’s bankruptcy filing, which was long anticipated, is nevertheless the latest blow to Gawker, which he founded in 2002. The company has faced numerous challenges in the past year, including the departure of two top editors after Gawker published, and then removed, an article about a married male media executive who sought to hire a gay escort.

Still, Mr. Denton said his personal bankruptcy would not have much of an effect on Gawker, and he painted an optimistic portrait.

“For the company, this does not mean too much,” he said. “I am committed to finding the brands and the people a secure home, free of this vendetta. The bids are due in two weeks, and the operation is in great shape, with growing traffic and revenue.”

In a memo to the Gawker Media staff, Mr. Denton praised the company for keeping its “focus and momentum.”

“What really lifts my spirits is the way in which we have stood together and just kept on writing, coding and selling,” he wrote.

Is Donald Trump Jewish?

0
UNITED STATES - MAY 23: Grand Marshal Donald Trump marches in the Salute to Israel Parade on Fifth Ave. (Photo by Ron Antonelli/NY Daily News Archive via Getty Images)

Grand Marshal Donald Trump marches in the Salute to Israel Parade on Fifth Ave.

http://mileswmathis.com/trump.pdf

As usual, this is just my opinion, based on private research Readers have been begging me to do Trump, but I don’t think this is what they expected or wanted. Many have been fooled by him. I really don’t have much to say about this bozo actor, except to say that he has been one more test of the gullibility of the American public—a test they have failed. Even those who don’t like him have been fooled into thinking he is real person. He is about as real as Dudley Do-Right or Rocky the Flying Squirrel.


Hmmm...

Now I don't know too much about the ranks of those that join the Free Masons but I do know that many high ranking elites are 33rd degree Masons.  But is there a title inside them that is called "Grand Marshall"?  I don't know?

I will say that I don't believe that Trump became a Billionaire without doing something crooked.  Maybe he's not a Free Mason?  Don't know?  But he's well connected to all of the known gangsters out there... whether they call themselves Free Masons Cone-heads , Skull and Bones Idiots, Child raping Catholic Criminals, or Illuminati light bulbs!

This Trump guy is still the lessor of two evils between him and Killary but lets face it... neither are worth voting for.  Where's the check box on the ballot that says "None of the Above"?

Red

ES Morning Update August 2nd 2016

0

f816dd41-7e5d-4d68-9720-512c59374deb

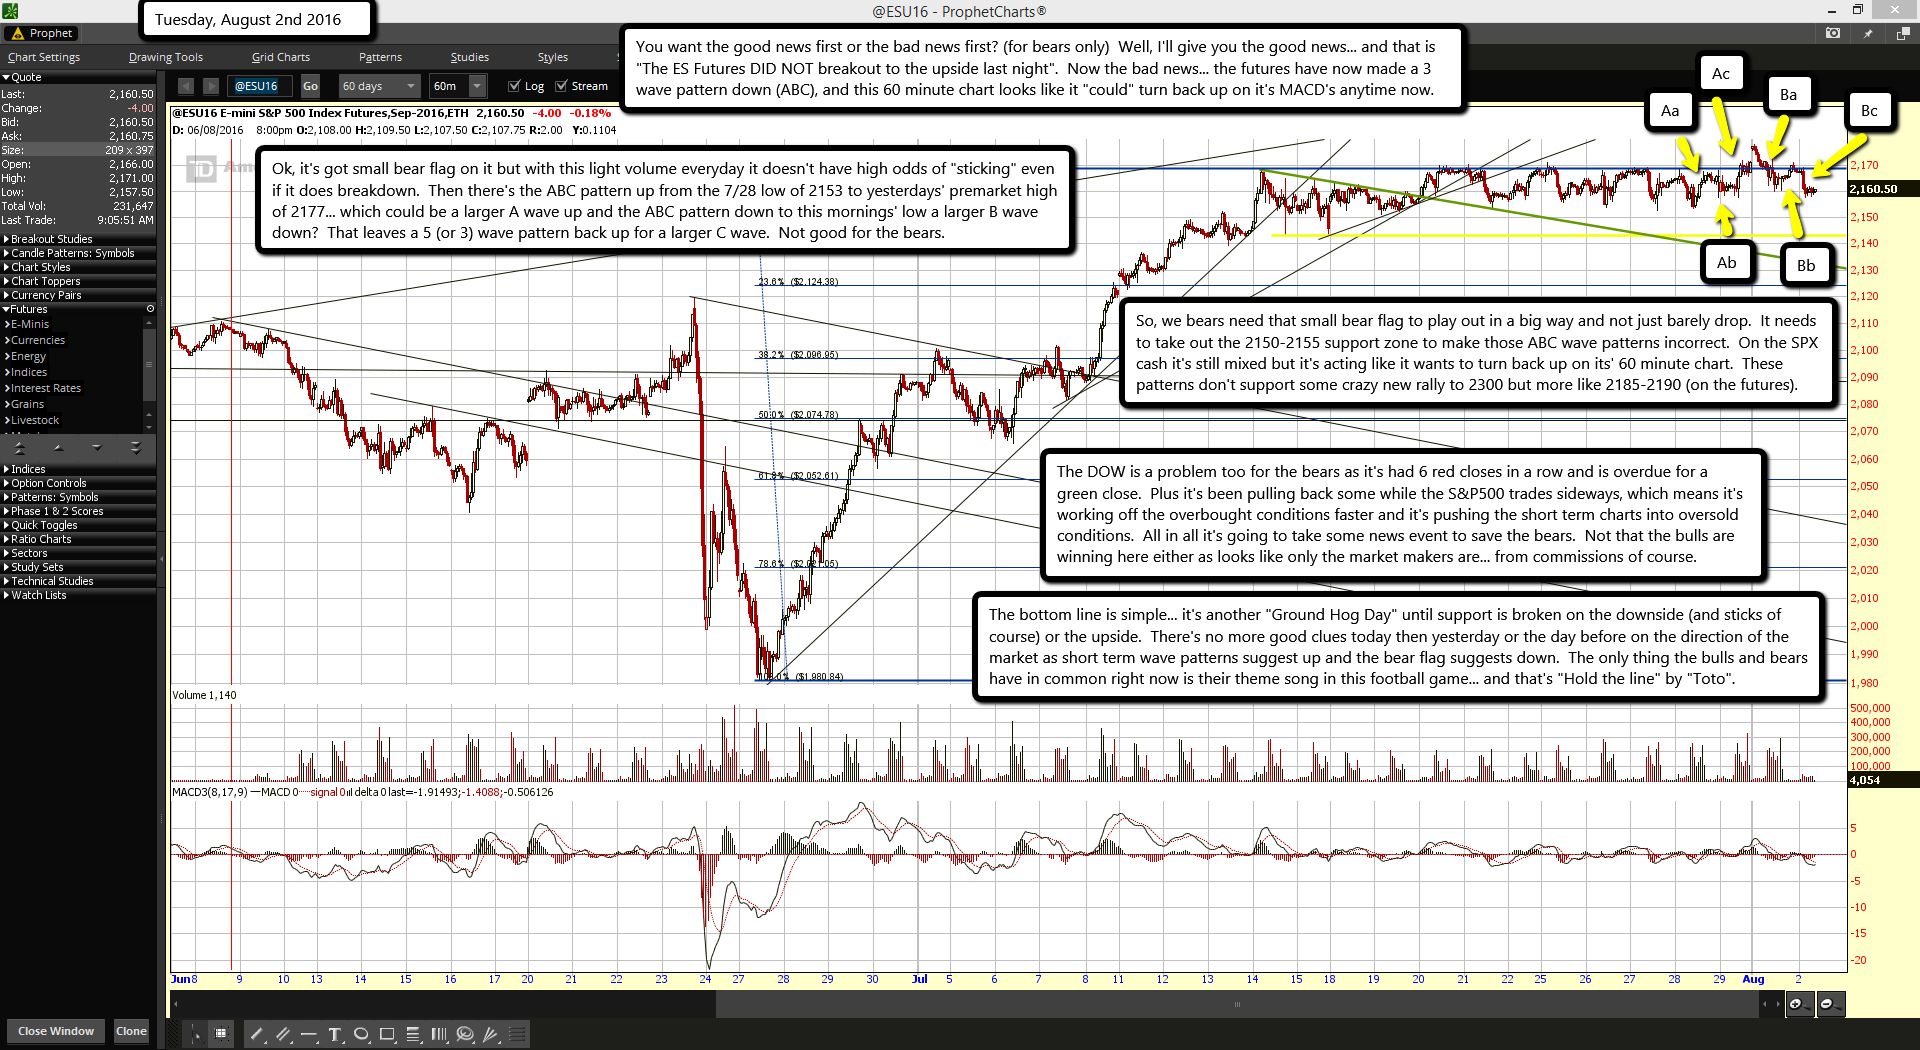
You want the good news first or the bad news first? (for bears only)  Well, I'll give you the good news... and that is "The ES Futures DID NOT breakout to the upside last night".  Now the bad news... the futures have now made a 3 wave pattern down (ABC), and this 60 minute chart looks like it "could" turn back up on it's MACD's anytime now.

Ok, it's got small bear flag on it but with this light volume everyday it doesn't have high odds of "sticking" even if it does breakdown.  Then there's the ABC pattern up from the 7/28 low of 2153 to yesterdays' premarket high of 2177... which could be a larger A wave up and the ABC pattern down to this mornings' low a larger B wave down?  That leaves a 5 (or 3) wave pattern back up for a larger C wave.  Not good for the bears.

So, we bears need that small bear flag to play out in a big way and not just barely drop.  It needs to take out the 2150-2155 support zone to make those ABC wave patterns incorrect.  On the SPX cash it's still mixed but it's acting like it wants to turn back up on its' 60 minute chart.  These patterns don't support some crazy new rally to 2300 but more like 2185-2190 (on the futures).

The DOW is a problem too for the bears as it's had 6 red closes in a row and is overdue for a green close.  Plus it's been pulling back some while the S&P500 trades sideways, which means it's working off the overbought conditions faster and it's pushing the short term charts into oversold conditions.  All in all it's going to take some news event to save the bears.  Not that the bulls are winning here either as looks like only the market makers are... from commissions of course.

The bottom line is simple... it's another "Ground Hog Day" until support is broken on the downside (and sticks of course) or the upside.  There's no more good clues today then yesterday or the day before on the direction of the market as short term wave patterns suggest up and the bear flag suggests down.  The only thing the bulls and bears have in common right now is their theme song in this football game... and that's "Hold the line" by "Toto".

Tesla, SolarCity may announce merger today

0

Elon Musk is CEO of Tesla, chairman of SolarCity and the biggest shareholder in both companies.

Tesla Motors Inc. said it would buy solar panel installer SolarCity Corp. for $2.6 billion in shares to form a one-stop clean-energy shop.

The combined entity will offer consumers solar panels, home battery storage systems and electric cars under a single brand. "Solar and storage are at their best when they're combined," the companies said in a blog post on Tesla's website.

Tesla expects to achieve "significant" cost savings and "dramatic improvements" in manufacturing efficiency as a result of the acquisition of solar panel installer SolarCity, Tesla CEO Elon Musk said today.

He said the combined companies will have a "stronger balance sheet," but likely will require a "small equity capital raise" next year. Both companies have been burning through cash and have projected achieving positive cash flow later this year.

Tesla and SolarCity expect to save $150 million in costs in the first full year after the deal closes as the combination would improve manufacturing efficiencies and reduce customer acquisition costs. Musk said he thought the combined companies could "significantly exceed" that mark in the first year.

Combining the electric car maker with the solar panel installer is a major part of Musk's strategy, who earlier in July unveiled his "Master Plan, Part Deux" that calls for the combined company to offer consumers a single source of hardware to power a low-carbon lifestyle.

Musk is CEO of Tesla, chairman of SolarCity and the biggest shareholder in both companies. A merger agreement had not been certain because SolarCity formed a special committee to review Tesla's offer independent of the influence of Musk and other executives close to him.

Under the agreement, Tesla would hold 93.5 percent of the combined companies and SolarCity 6.5 percent. The deal is expected to win approval in the fourth quarter, the companies said.

The deal includes a "go-shop" provision that will allow SolarCity, which had market value of $2.62 billion as of Friday close, to solicit offers from other buyers through Sept. 14.

Musk has argued that combining Tesla with SolarCity will allow the combined company to reach consumers more effectively, installing solar panels on their roofs, sending power to Tesla storage batteries in their homes, and Tesla cars in their garages. Batteries from Tesla's $5 billion gigafactory outside Sparks, Nev., will be central to the combined enterprises.

Tesla shareholders have gradually warmed up to the deal with SolarCity following initial apprehension after Tesla announced its offer on June 21. After dropping to below $190 per share following the offer, Tesla shares have recovered and ended trading on Friday at $234.79. SolarCity shares closed at $26.70 Friday.

Besides Musk, several Tesla and SolarCity executives, including Musk's cousins, SolarCity CEO Lyndon Rive and SolarCity board member Peter Rive, have recused themselves from voting their shares when the deal comes to a vote.

Tesla is scheduled to release its second-quarter results on Aug. 3.

The company said earlier this month that its deliveries for the quarter fell short of its forecasts. Analysts will be looking for signs that the company is containing its costs and slowing its cash burn.

Tesla took a hit on June 30 when the U.S. National Highway Traffic Safety Administration disclosed it was investigating a fatal accident that killed the driver of a Tesla Model S while he was using the car's Autopilot system, which takes partial control of steering and braking Since then, Musk has defended the Autopilot technology.

MARKET SNAPSHOT: U.S. Stocks End Lower As Crude Oil Re-enters Bear Market

0

Tesla and SolarCity fall after reaching merger deal

U.S. stocks lost momentum to finish mostly lower Monday as crude-oil futures returned to bear-market territory and weaker-than-expected manufacturing data raised doubts about the strength of the economy.

The S&P 500 shed 2.76 points, or 0.1%, to close at 2,170.84 after the large-cap gauge hit a record intraday high of 2,178.29. A 3.3% drop in the energy sector dragged the S&P 500 into negative territory, outweighing modest gains in health-care and tech stocks.

The Dow Jones Industrial Average fell 27.73 points, or 0.2%, to close at 18,404.51.

However, the Nasdaq Composite Index climbed 22.06 points, or 0.4%, to end at 5,184.20, boosted by appetite for tech giants, including a 1.8% jump in shares of Apple Inc. (AAPL).

Meanwhile, losses for crude snowballed, with the U.S. oil benchmark dropping almost 4% and at one point trading below the key $40 level amid worries about a supply glut and subdued demand. Crude oil is now off 21.8% from its peak of $51.23 a barrel hit in early June, signifying a bear market, or drop of at least 20% from a recent peak.

On the economic front, the Institute for Supply Management's closely watched manufacturing index for July fell to 52.6 from 53.2, while construction spending fell 0.6% in June. The Markit manufacturing purchasing managers index for July rose to 52.9 compared with June's 51.3.

"People are nervous as oil crashes below $40, given the context of the weak GDP report and somewhat weak ISM data.  They are back to doubting whether the market's rally is as strong as it could be," said Bruce McCain, chief investment strategist at Key Private Bank.

Prospects for a near-term interest-rate increase by the Federal Reserve have faded since the weak GDP reading on Friday.

Corporate quarterly results will continue to feature prominently this week even as the season winds down, though no major companies reported Monday. So far, about two-thirds of S&P 500 companies have announced quarterly results thus far, with 71% beating on earnings and 57% reporting revenue above estimates.

Fed speakers: The market appeared to brush aside comments from New York Federal Reserve Bank President William Dudley and Dallas Fed President Rob Kaplan, who both argued at separate events Sunday and Monday that an interest-rate hike this year shouldn't be ruled out .

Stocks to watch: Shares in Tesla Motors Inc.(TSLA) and SolarCity Corp.(SCTY) lost ground on news that the companies have reached a merger agreement. SolarCity also released updated guidance.

Meanwhile, Chinese ride-sharing giant Didi Chuxing Technology Co. has agreed to buy the China operations of Uber Technologies Inc.

Uber and investors in its UberChina unit will take a 20% stake in Didi. UberChina is backed by China's search giant

Baidu Inc. (BIDU). Didi's backers include e-commerce group Alibaba Group Holding Ltd. (BABA) and internet giant Tencent Holdings Ltd. (0700.HK)

Shares of Fleetmatics Group PLC. (FLTX) soared 39% on news of a pending acquisition by Verizon.

Energy stocks were the biggest losers in the S&P 500, with all shares in the sector finishing in the red. Murphy Oil Corp.(MUR), Williams Cos.(WMB), Diamond Offshore Drilling Inc.(DO), and Transocean Ltd.(RIG) all fell sharply.

Other markets: European stocks drifted lower while in Asia, stocks finished mixed

The Shanghai Composite Index closing off 0.9% after China's manufacturing Purchasing managers index for July indicated contraction for the first time in five months. Elsewhere, the Nikkei 225 index and other Asian markets rose, benefiting from diminished chances for a U.S. rate increase.

The yen, meanwhile, weakened against the U.S. dollar after disappointing stimulus action from the Bank of Japan last week.

Gold finished modestly higher and silver closed at a two-year high

ES Morning Update August 1st 2016

0

5b1df889-199b-4464-a19e-8fa8c0ebf75c

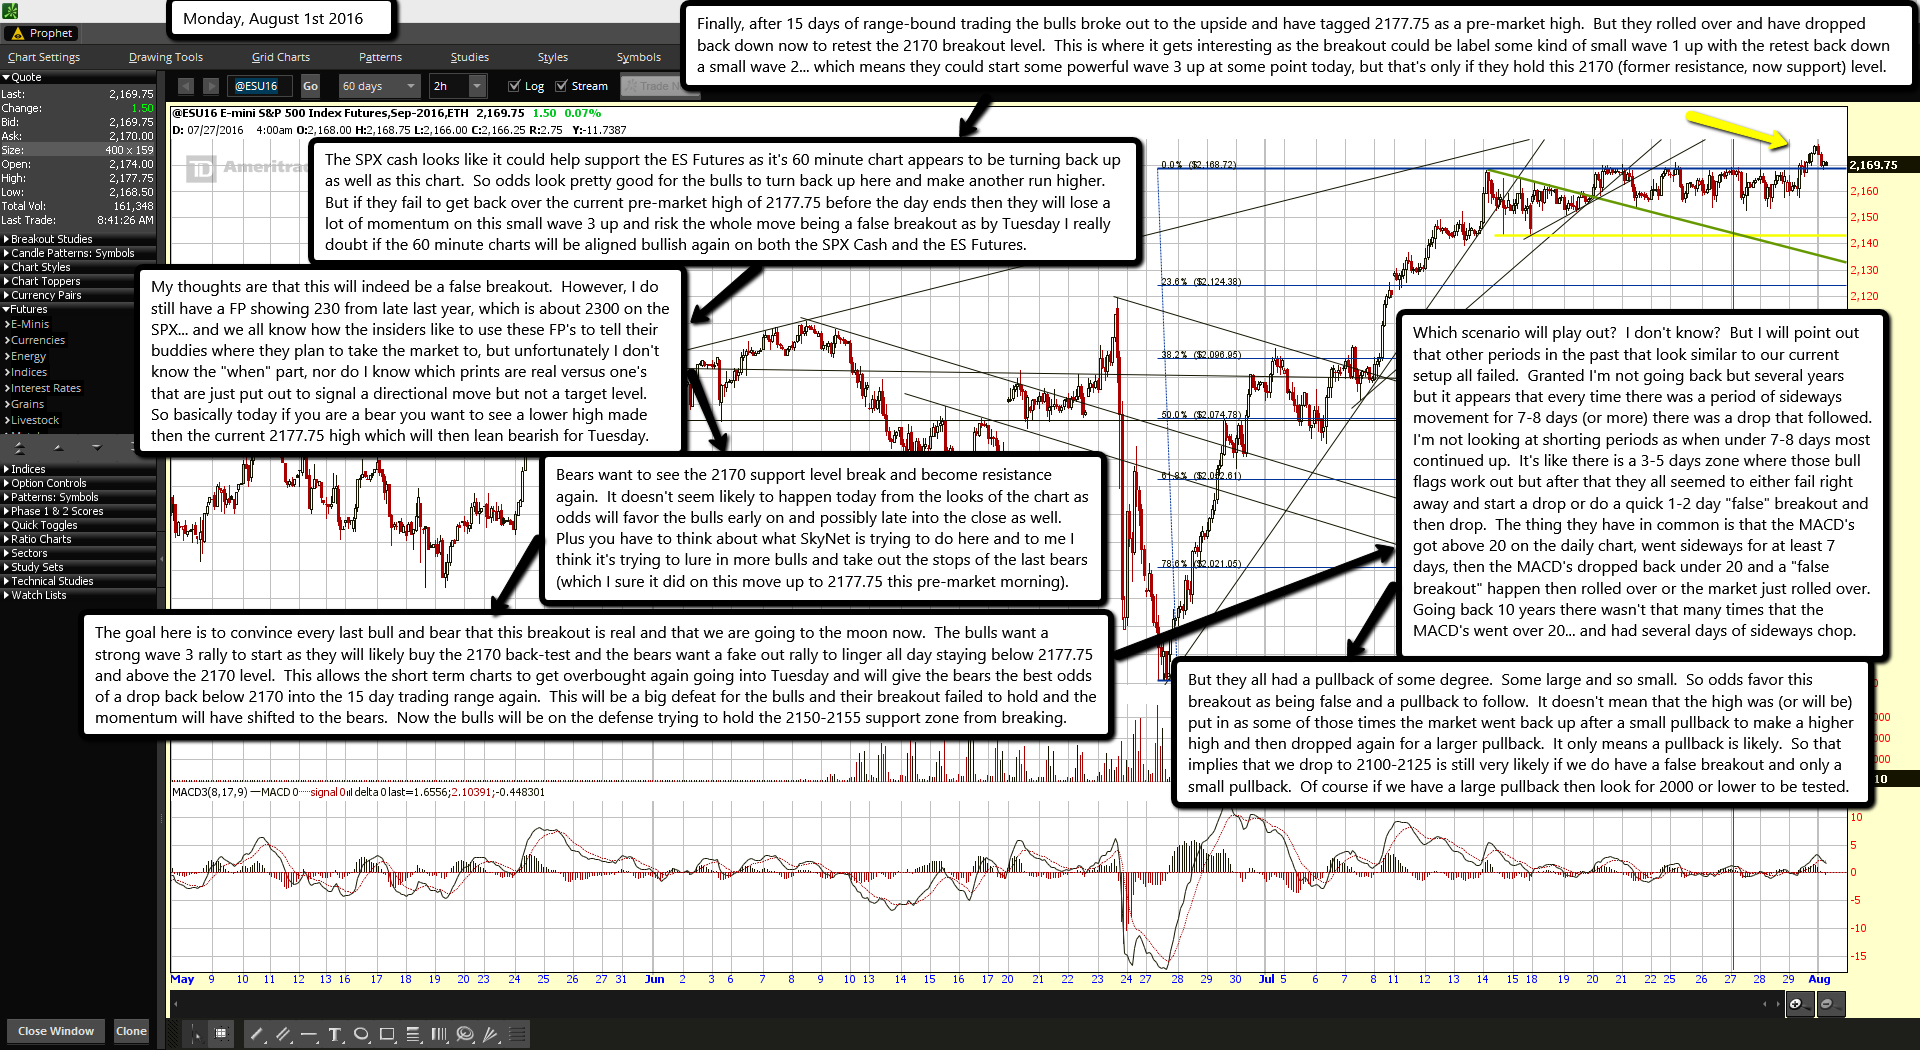
Finally, after 15 days of range-bound trading the bulls broke out to the upside and have tagged 2177.75 as a pre-market high.  But they rolled over and have dropped back down now to retest the 2170 breakout level.  This is where it gets interesting as the breakout could be label some kind of small wave 1 up with the retest back down a small wave 2... which means they could start some powerful wave 3 up at some point today, but that's only if they hold this 2170 (former resistance, now support) level.

The SPX cash looks like it could help support the ES Futures as it's 60 minute chart appears to be turning back up as well as this chart.  So odds look pretty good for the bulls to turn back up here and make another run higher.  But if they fail to get back over the current pre-market high of 2177.75 before the day ends then they will lose a lot of momentum on this small wave 3 up and risk the whole move being a false breakout as by Tuesday I really doubt if the 60 minute charts will be aligned bullish again on both the SPX Cash and the ES Futures.

My thoughts are that this will indeed be a false breakout.  However, I do still have a FP showing 230 from late last year, which is about 2300 on the SPX... and we all know how the insiders like to use these FP's to tell their buddies where they plan to take the market to, but unfortunately I don't know the "when" part, nor do I know which prints are real versus one's that are just put out to signal a directional move but not a target level.  So basically today if you are a bear you want to see a lower high made then the current 2177.75 high which will then lean bearish for Tuesday.

Bears want to see the 2170 support level break and become resistance again.  It doesn't seem likely to happen today from the looks of the chart as odds will favor the bulls early on and possibly late into the close as well.  Plus you have to think about what SkyNet is trying to do here and to me I think it's trying to lure in more bulls and take out the stops of the last bears (which I sure it did on this move up to 2177.75 this pre-market morning).

The goal here is to convince every last bull and bear that this breakout is real and that we are going to the moon now.  The bulls want a strong wave 3 rally to start as they will likely buy the 2170 back-test and the bears want a fake out rally to linger all day staying below 2177.75 and above the 2170 level.  This allows the short term charts to get overbought again going into Tuesday and will give the bears the best odds of a drop back below 2170 into the 15 day trading range again.  This will be a big defeat for the bulls and their breakout failed to hold and the momentum will have shifted to the bears.  Now the bulls will be on the defense trying to hold the 2150-2155 support zone from breaking.

Which scenario will play out?  I don't know?  But I will point out that other periods in the past that look similar to our current setup all failed.  Granted I'm not going back but several years but it appears that every time there was a period of sideways movement for 7-8 days (or more) there was a drop that followed.  I'm not looking at shorting periods as when under 7-8 days most continued up.  It's like there is a 3-5 days zone where those bull flags work out but after that they all seemed to either fail right away and start a drop or do a quick 1-2 day "false" breakout and then drop.  The thing they have in common is that the MACD's got above 20 on the daily chart, went sideways for at least 7 days, then the MACD's dropped back under 20 and a "false breakout" happen then rolled over or the market just rolled over.  Going back 10 years there wasn't that many times that the MACD's went over 20... and had several days of sideways chop.

But they all had a pullback of some degree.  Some large and so small.  So odds favor this breakout as being false and a pullback to follow.  It doesn't mean that the high was (or will be) put in as some of those times the market went back up after a small pullback to make a higher high and then dropped again for a larger pullback.  It only means a pullback is likely.  So that implies that we drop to 2100-2125 is still very likely if we do have a false breakout and only a small pullback.  Of course if we have a large pullback then look for 2000 or lower to be tested.

s2Member®