Saturday, October 24, 2026
Home Blog Page 91

Re: Panama Papers palaver

0

Abimbola Adelakun

I read  Abimbola Adelakun article on Thursday entitled, Panama Papers palaver  and what jolted me was the writer’s assertion that tax avoidance was tantamount to “cheating the system”.

To further rub in the narrative of cheating, the word “corruption” was repeatedly used to describe the usage of tax havens for the purpose of tax planning.

My worry is that there are millions of readers who rely on the writer to learn the basics of taxation and financial matters and to deliberately criminalise tax planning is unkind, unhelpful and perhaps, with due respect, misinforming the reading public.

The writer is entitled to her opinion on tax havens but she is not entitled to twist the fact. While for instance, I can state that I do not like sugar, which is my opinion, but I cannot say that sugar is bitter because that sugar is sweet is a fact which cannot be twisted by my dislike for sugar.

Tax havens are legitimate tax planning instruments. As long as no financial, criminal or tax laws are breached,  they are perfectly legitimate. Tax avoidance is not tax evasion. While we can all have our opinions on the morality issues tax havens throw up, it is important we do not substitute our opinions for facts.

Tunde Esan,

legal practitioner/tax consultant,

+23408033246.
Source link

Tsipras demonizes IMF to rally troops for bailout sacrifices

0

Greek Prime Minister Alexis Tsipras arrives to welcome General Secretary of OECD Angel Gurria (not pictured) at the Maximos Mansion in Athens, Greece, March 10, 2016. REUTERS/Michalis KaragiannisThomson ReutersGreek Prime Minister Alexis Tsipras arrives to welcome General Secretary of OECD Angel Gurria at the Maximos Mansion in AthensBy Paul Taylor

BRUSSELS (Reuters) - In Athens, walls have ears.

The leaking of a conference call of International Monetary Fund officials on Greece's latest bailout review has further undermined mutual trust in fraught debt talks, embarrassed the European Commission and infuriated the IMF and Germany.

At stake are the IMF's reputation as a stern enforcer of financial rescue programs meant to make indebted states viable and the European Union's determination to hold the euro zone together and avert another damaging Greek crisis.

Greek Prime Minister Alexis Tsipras exploited the leak at home to demonize the IMF, rally his left-wing Syriza party ahead of more painful sacrifices to secure the next slice of European loans, and try to put his conservative opponents in a corner.

But efforts to drive a wedge between the EU institutions and the IMF, and isolate IMF Europe director Paul Thomsen, a veteran of six years of acrimonious negotiations with Athens, fell flat.

"Each time Tsipras is going to have to compromise, he needs to create an external enemy," said George Pagoulatos, professor of European politics and economy at Athens University. "It's part of his old populist playbook.

"It's smart domestic politics even if it is dumb diplomacy."

After a transcript of the March 19 conversation was posted on Internet site WikiLeaks, Tsipras demanded the IMF explain whether it was plotting to push Greece to the brink of default to make it swallow harsher austerity measures. The text offers little support for such accusations, although the IMF officials do note that Athens only compromises when it runs out of money.

IMF Managing Director Christine Lagarde made clear whom she held responsible, backing her staff and writing to Tsipras: "It is critical that your authorities ensure an environment that respects the privacy of their internal discussions and take all necessary steps to guarantee their personal safety."

The leak highlighted known differences between the IMF and the EU over the state of Greece's third international bailout since 2010, and over how much more Athens needs to do to meet its fiscal targets and make its debt sustainable.

More damagingly, it laid bare the IMF staff's contempt for the European Commission, seen as too soft on the Greeks.

It undercut months of patient efforts by Tsipras and Finance Minister Euclid Tsakalotos to rebuild lenders' trust after the havoc wrought by former Finance Minister Yanis Varoufakis, who sparred acrimoniously with his euro zone colleagues and leaked documents to try to bounce them into concessions.

It also shone a light on a complex, three-dimensional chess game the IMF is playing to try to make Greece accept painful reforms of pensions, taxation and bad loans while pressuring Germany and its allies to grant Athens substantial debt relief.

Put simply, the IMF's position is that the Greek economy is in worse shape than rosy EU forecasts suggest, and that a necessary relaxation of fiscal targets must be balanced by greater debt relief from euro zone lenders.

Since the Europeans refuse an outright debt write-off, known as a "haircut", they will have to stretch out loan maturities for decades and give Athens a 20-year debt service holiday.

Otherwise the numbers won't add up and the program is headed for failure, the IMF says.

"The bottom line is the debt will not be repaid in our lifetime," said Jacob Kirkegaard, senior fellow at the Peterson Institute for International Economics in Washington.

"The IMF is gearing up for new clients in the emerging economies. That is not best done by being soft on Greece. They won't go to the (IMF) board to approve participation in a third Greek bailout without something they think is tough and credible," he said.

Brussels contends that both the economy and Greek compliance with the bailout program are better than the IMF thinks, hence the first review should be concluded soon, allowing Athens to access the next 5 billion euros ($5.70 billion) of loans.

In the transcript, IMF Greece mission chief Delia Velculescu complains that the Commission agrees on joint positions only to back down to the Greeks the next day, giving Athens no incentive to make tough reforms.

Thomsen belittles tax increases proposed by Greece to plug the fiscal gap as "Mickey Mouse stuff". He also suggests German Chancellor Angela Merkel should be made to choose between giving Athens substantial debt relief or seeing the IMF pull out.

Germany, the biggest creditor, is the most reluctant about major debt restructuring. Its parliament insists on a continued IMF presence to enforce budget savings and minimize the need for stretching out loans and freezing interest payments.

How the three-way tug-of-war between the IMF, Greece and Berlin will play out remains uncertain. The sequencing will be tricky, but no side seems to have an interest in walking away.

The Germans are more dependent now on Greece to act as Europe's gatekeeper than they were during last year's crisis over a possible "Grexit" from the euro zone. Berlin needs Athens' cooperation to process and detain migrants and refugees until they can be send back to Turkey.

The Tsipras government has spent much political capital to keep Greece in the euro zone and reach the long sought debt relief negotiations. It cannot afford to alienate the lenders.

And the IMF too does not want to abandon Greece as a black mark on its record.

"Four of the five euro zone bailouts have gone pretty well - an 80 percent success rate. Yet if the IMF walks away from Greece now, everything they've done in Europe will be remembered as a failure," said Kirkegaard.

($1 = 0.8773 euros)

Source link

USPS, Shiny Objects, Recovery, and Recession – What They Think

0

Commentary & Analysis

The USPS exigent price increase has expired, and USPS says they “will lose approximately $2 billion in annual revenue resulting from a price reduction” which they knew was going to expire. The increase was to help “recover for the massive volume and revenue losses resulting from the Great Recession.” Yet, Dr. Joe shows that the declines in USPS volume kept declining after the economic recovery began in mid-2009. Then Dr. Joe talks about recession in light of recent economic data. Yeah, they’ll be calling him Dr. Doom again.

By Dr. Joe Webb
Published: April 11, 2016

The “forced” price reduction by the US Postal Service (read their release) is, as my late mother-in-law used to say with a slight Hungarian accent, “a lotta hooey.” This was the expiration of an increase forced onto postal customers and the public based on the terms of an exigent price increase program to save the USPS when they were in financial trouble. During its time, the USPS was to get their house in order before its planned expiration.

Now, the USPS is claiming it is being shortchanged when in reality its customers were being overcharged. Is this like the slayer of parents asking for the mercy of the court because he was recently orphaned? USPS problems are a long term combination of self-infliction, myopia and a large doses of oversight and regulatory meddling. It’s time to set the USPS free, and let it run as a real business making the hard decisions real businesses have to make.

Instead, they’re backed into a corner. By focusing automation efforts on big postal customers who supply the bulk of their volume, where the savings would be fastest and biggest, they rarely found time to nurture small postal user volume or make aggressive efforts to create new businesses. EDDM is not the answer for everyone.

This is the downside of Pareto analysis. In the 80-20 rule, you focus on the 20 that gives you the 80. But Pareto is a snapshot, and the 20 that gives you the 80 today might be totally different tomorrow. It solves short term problems. Call it the Motorola problem. The company that gave us Six Sigma quality got lost producing defect-free products that the market did not want. Look at the shiny object while a competitor steals your market share.

This inside-out thinking makes great accounting sense quarter-to-quarter as you can show cost-saving acumen, but you neglect the big world outside. There remains little comprehension that their pricing is out of line with competitors, and they are shackled by numerous political rent-seekers who influence their actions in destructive ways.

If this was a real business, especially a publicly traded company, no board of directors would have allowed the precipitous decline in sales to persist without dramatic actions and swift changes in management and strategy. Those management changes would be people from outside of their business, not internal promotions. The USPS is not known as a hotbed of entrepreneurial innovation by its very design. (Lysander Spooner, where are you now that we need you?)

Before anyone mentions the pension payments that were part of the USPS agreements in the past, those are real actuarial costs, and a contractual commitment that was known well in advance. All businesses deal with costs that they cannot control, especially of a regulatory and compliance nature, with much of them hidden in all of their costs. The USPS has many benefits that businesses cannot have, many of them in a report by Robert Shapiro and discussed at the Brookings Institution. As one can imagine, the USPS community hated the “study,” as detractors would use quotes around the word so as to disparage it.

What do they have to show for the exigent price increase? The press release about the recent Annual Compliance Determination said “The majority of products failed to meet service performance targets for FY 2015.” Kudos to the Postal Regulatory Commission for not taking the easy way out and renewing the exigent increase. Whether anything comes of it remains to be seen.

Now a calm look at the data. In last week’s newsletter, the chart of the week looked at Every Door Direct Mail (EDDM). Here are other data for major categories.

It is helpful to look at what has happened to postal volume in ways outside of revenues that cannot be distorted by inflation. In terms of pieces, standard mail has stabilized while others have declined. Had volume kept up with population, it would be 13% higher than in 2001.

In terms of weight, mail is getting lighter. This may be a surprise, but mailers react to price increases by redesigning the nature of their mailings. All postal price changes are reacted to by its customers. Postal costs are not their only costs, nor is the postal service their only choice to reach their target audience.

The per household pieces of mail since 2001 is down -36% (excluding packages), and the total weight of mail delivered per household is down -40%.

The USPS is hampered by law from expanding into other services and from reacting to the actions of competitors. This fosters strategic blindness to market needs as they focus on the services they have and can only get approvals for minor changes to them. USPS says they understand that there are alternatives but they do little to decisively act on their recognition.

The USPS press release said “The PRC granted an exigent surcharge beginning in January 2014… to recover for the massive volume and revenue losses resulting from the Great Recession.” Look at the charts: the volume and revenue losses occurred after the economic recovery began in mid-2009. Standard mail stabilized and even rose for a short time. First class and periodicals continued to decline because postal prices did not keep up with competitive alternatives; they were declining prior to the recession and just continued to do so. During the recovery, mobile media, smartphones, and other technologies kept taking dollars that would previously have supported postal volume. Some first class mail volume was switched to standard mail; in other words, USPS lost a portion of its first class volume to itself as customers attempted to manage their costs.

It’s time to set the USPS free. It needs to become a publicly owned company where half of the stock is held by the union members and their pension funds. It needs a board of directors comprised of owners, not stakeholders, not rent-seekers, and not placeholders. Those whose very livelihoods depend on the growth success of the organization need to be there, not those stretching out its survival.

Until that happens (which is never), here is my advice to printers. Navigating the nature of the USPS and its regulations has always been a special skill rewarded by the marketplace. No matter what the situation, USPS costs will be going up, if not in a nominal sense, but because the cost disparity with other media will continue to widen. That means that data management, customer and prospect analytics for mailers, and automation have to make up for the cost disparities that the USPS is unable to address. There is great interest in new ink jet presses, such as those to be shown at drupa (especially Benny Landa’s efforts) that may deliver new production capabilities that can increase flexibility, reduce production steps (such as eliminate two-pass approaches like digital printing on offset shells), and give print a fighting chance as a mailed medium again. If you are only in the mailing business for part of your volume, seek alliances with mailing specialists who will be able to keep up with the technologies needed to be profitable in this kind of environment. All printers used to do mailings; it is becoming a highly specialized niche that you can’t be successful in with out full commitment. There are few products, like EDDM, that are directly targeted to small business that are appropriate in certain uses, that small print businesses can handle with little sophistication. But big mail will require big data and big automation to balance increasing costs of compliance and postage.

The Economy: Love Those Mixed Messages

GDPNow last +0.1% but it fell because of bad wholesale inventory numbers, which may not be as bad news as it sounds. GDP and net inventories had been out of balance, inflating GDP more than its underlying trend.

There is no doubt a recession is possible and this GDP estimate did seem to attract a lot of attention of analysts claiming that this could indicate the start of a recession. If you really wanted to declare a recession, the last peak of manufacturing using the factory orders data was in mid-2014.

Recessions are always declared after they started and always at the last peak of economic activity. The last time a recession was declared we were eleven months into it. The last recession began in December 2007 and was not declared until November 2008. Many of the economic indicators during that period were good, and the true evidence of the recession did not occur until commodities prices collapsed. This time, commodities prices collapsed already and are starting to rebound.

The old rule of thumb of two consecutive quarters of negative growth was never the official definition of a recession. It’s the task of the National Bureau of Economic Research to declare them, and their guidelines are there for all to see. Here are the key comments; italics and underscores are mine:

“The committee's approach to determining the dates of turning points is retrospective. We wait until sufficient data are available to avoid the need for major revisions. In particular, in determining the date of a peak in activity, and thus the onset of recession, we wait until we are confident that, even in the event that activity begins to rise again immediately, it has declined enough to meet the criterion of depth. As a result, we tend to wait to identify a peak until many months after it actually occurs.”

This means that any businessperson will suspect that a recession is in place before the academics declare it. They have the luxury of sitting around and waiting for data. Business owners do not. Stay vigilant.
Source link

Zirx’s new platform lets auto companies offer their own concierge service

0

More than two months ago, Zirx pivoted away from being an on-demand valet service to focus exclusively on the enterprise. Today, the company announced its launch mobility service, a platform targeting automotive companies to not only manage vehicle transportation logistics, but also provide a better experience to their customers.

Since its founding in 2014, Zirx has focused on helping you park cars, whether you were a private user or a business customer. But the company didn’t see profitability with its valet service so it went all in on the enterprise. With Zirx Mobility Services, it’s providing a full stack logistics offering to auto makers, dealerships, and fleet owners. Services include delivering cars from a customer to be repaired or from one dealership to another, along with many others. Essentially Zirx has white-labeled its valet service specifically for auto companies.

Zirx Mobility Services transportation dashboard

“The automotive industry is in a period of big change, more change than it’s ever had,” Zirx CEO Sean Behr told VentureBeat. “The industry as a whole is worried that people are going to buy fewer cars and that this company called Uber is posing a threat to their bread and butter business. It makes them move in the space to deliver a better customer experience and address this gap in the changing market.”

He described Zirx Mobility Services as a full-service platform, one that gives companies a dashboard to manage requests and an API to integrate into their own apps. In addition to the six cities where Zirx previously offered its consumer service, it has added Boston and Chicago. Behr explained that with his company’s pivot, market expansion is now dictated by demands from companies in those cities.

Zirx Mobility Services is purely business-focused, meaning that consumers can’t use it to have their cars parked — in fact, Zirx has eliminated its parking garages. However, if BMW wanted to offer a service where it would pick up a customer’s vehicle when it needed servicing, gas, or washing, that would be among the capabilities of Zirx’s platform.

Zirx Mobility Services

Zirx’s Mobility Services can manage logistics for multiple vehicles, and its algorithm optimizes the process so agents are used more efficiently. Zirx has moved away from its one-size flat-fee model, saying that a usage-based pricing plan is needed — companies are charged based on the time and distance.

Behr offered this scenario: “Imagine if you rent a car, but find that you need a larger vehicle? They can have a Chevy Tahoe show up at your front door on Friday at 5 p.m., they tell you what it costs, you sign the paperwork, and there you go. Then you get home on Sunday night, the last thing you want to do is bring the car back to the rental car center and fill it up with gas. The company can come pick it up from you for a surcharge…”

Businesses can use Zirx’s web-based console to request Zirx pick up or deliver a vehicle, or integrate Zirx’s mobility service directly into their own platforms through the open API. “Most companies run this stuff with paper and pen,” Behr explained. “It’s a replacement of paper and pen spreadsheets, emails, and print-outs.”

Although he wouldn’t disclose specific names, Behr acknowledged that “a couple dozen” companies have already signed up for Zirx’s service. He also stated that because of Zirx’s pivot, all of the eight markets where it operates are expected to be profitable by May. While the whole company won’t turn a profit by then, Behr said it could sometime this year.

Zirx also announced today that it has partnered with Openbay and BAMA Commercial Leasing on the launch of its mobility services. Openbay specializes in helping you get auto repairs and maintenance done on your vehicles, something that Zirx believes its service can help facilitate — you find a place to take your car to and it’ll have an agent come pick it up and deliver it back. With BAMA Commercial Leasing, Zirx helps to deliver the company’s fleet of vehicles from one place to another.

This isn’t the first time that Behr’s team has had an offering for businesses. In September, Zirx rolled out a subscription program for companies that alleviated the stress employees had when finding parking near their office. Zirx Enterprise, as it was known as, primarily benefited the drivers, not the company. Behr said that the service is still available, but it’s available on a time and usage pricing model, no longer as a fixed fee.

There aren’t any upfront costs to using Zirx’s mobility services, and they are available as of today.

ZIRX is focused on the last mile of a driver’s journey. We are powering an awesome customer experience backed by smart technology that allows field operations to hum. Through an on-demand model a ZIRX agent is intelligently queued to...

New! Track ZIRX's Landscape to stay on top of the industry in 3 minutes a day. Understand the entire ecosystem, monitor innovation, and track deal flows.

Mr. Sean Behr served as Senior Vice President of Global Operations at Adap.tv, Inc and served as its Vice President of Market Operations. Mr. Behr served as Vice President of Product Management of Adap.tv, Inc. Mr. Behr has held variou...

New! Track Sean Behr's Landscape to stay on top of the industry in 3 minutes a day. Understand the entire ecosystem, monitor innovation, and track deal flows.
Source link

Overstock CEO Patrick Byrne takes indefinite leave of absence over Hepatitis C complications

0

patrick byrne overstock

Patrick Byrne, the mercurial CEO of Overstock.com, says that he is taking a leave of absence. It's unclear when -- or if -- he'll return.

Byrne said he contracted Hepatitis C in 1984 in Xinjiang, an autonomous region of China, "when a barefoot doctor sewed up a head wound under less-than-ideal conditions." He says he finished treatment and thinks he can beat the disease, "but only time will tell."

Hepatitis C can lead to long-term health problems, including liver cancer.

In his statement about his leave of absence, Byrne quoted the character Chief Dan George in the Clint Eastwood movie "Outlaw Josey Wales": "I myself never surrendered. But they got my horse, and it surrendered."

Byrne is no stranger to health problems. When he was 22, he was diagnosed with testicular cancer that had metastasized throughout his body. He has had multiple recurrences and complications.

Despite those challenges, Byrne built Overstock.com (OSTK) into a sizable e-commerce power player. Overstock is perpetually profitable, bringing in $1.7 billion in sales in 2015. This year, the company anticipates $40 million in profit, before taxes.

Byrne has made news less for his acumen as a business leader and more for his quirky interests and passions.

In 2013, Overstock became the first major U.S. retailer to accept the digital currency Bitcoin. Byrne said that he was concerned about the possibility of "bad currency wars" in the future. He said the U.S. dollar is being undermined by the Federal Reserve's money policies and by overspending by politicians in Washington. He said he prefers gold to dollars.

Byrne also has gone on a decades-long rampage against naked short-selling, a controversial tactic used by Wall Street investors to place bets against a company's stock. Naked short selling takes place when a trader never actually borrows the stock he or she is shorting.

On its website, Overstock describes Byrne as "a leading voice in a growing movement convinced that powerful interests on Wall Street are destroying American companies for profit -- robbing investors and destabilizing our financial system in the process.

Byrne helped Overstock shareholders file two lawsuits in 2006 and 2007 against naked short-sellers.

Taking over for Byrne as acting CEO will be Mitch Edwards, former CEO of BitTorrent and Skullcandy. Edwards has served as general counsel of Overstock.com for the past six months.

"Mitch is an outstanding full-spectrum entrepreneur who has serving as our general counsel for six months and has learned our business, and understands our efforts to revolutionize the capital markets," Byrne said.

Source link

Gartner: Global PC shipments fell 9.6% in Q1 2016, the first quarter below 65 million units since 2007

0


No surprise here: The PC market started 2016 off poorly. Both Gartner and IDC have noted PC shipments were down globally, again.

Gartner estimates worldwide PC shipments fell 9.6 percent to 64.8 million units in Q1 2016. In fact, the firm notes that this is the first quarter to see below 65 million units since 2007. In other words, Q1 2016 PC shipments were almost a decade-low.

The top five vendors were Lenovo, HP, Dell, Asus, and Apple. As you can see in the chart below, Gartner found that Apple and Asus were the only companies among the top vendors that experienced an increase in PC shipments. Leaders Lenovo and HP saw particularly poor results, though the declines weren’t quite in the double digits.

gartner_pc_shipments_q1_2016

The strength of the U.S. dollar was one of the reasons given for these declines.

“The deterioration of local currencies against the U.S. collar continued to play a major role in PC shipment declines,” Mikako Kitagawa, principal analyst at Gartner, said in a statement. “Our early results also show there was an inventory buildup from holiday sales in the fourth quarter of 2015.”

And as always, the same trends were brought up: PCs are not being adopted in new households like they used to, especially in emerging markets where smartphones rule.

2016 will be the first full year that we’ll see whether Windows 10 can help reverse the PC market’s decline. So far, it doesn’t look good.

Gartner, for example, expects that businesses will start to adopt Windows 10 toward the end of the year.

Source link

Average gas prices still lower here than nationally

0

Average retail gasoline prices in Louisiana have fallen 2.1 cents per gallon in the past week, averaging $1.83/g yesterday, according to GasBuddyLouisiana, LA, April 11- (Gasbuddy.com) - Average retail gasoline prices in Louisiana have fallen 2.1 cents per gallon in the past week, averaging $1.83/g yesterday, according to GasBuddy's daily survey of 2,436 gas outlets in Louisiana.

This compares with the national average that has fallen 1.2 cents per gallon in the last week to $2.04/g, according to gasoline price website GasBuddy.com.

Including the change in gas prices in Louisiana during the past week, prices yesterday were 34.9 cents per gallon lower than the same day one year ago and are 16.0 cents per gallon higher than a month ago.

The national average has increased 15.6 cents per gallon during the last month and stands 34.9 cents per gallon lower than this day one year ago.

According to GasBuddy historical data, gasoline prices on April 11 in Louisiana have ranged widely over the last five years:
$2.18/g in 2015, $3.41/g in 2014, $3.38/g in 2013, $3.81/g in 2012 and $3.63/g in 2011.

Areas nearby Louisiana and their current gas price climate:
Baton Rouge- $1.80/g, down 2.8 cents per gallon from last week's $1.83/g.

Jackson- $1.80/g, down 1.7 cents per gallon from last week's $1.82/g.
New Orleans- $1.82/g, down 1.2 cents per gallon from last week's $1.83/g.

“It’s especially rare in April to see the average price of gasoline dead even or slightly lower in some places than where it was in the prior week… and as encouraging as that news certainly is for U.S. motorists, unfortunately, it’s more of an anomaly than a trend. But it’s still a very good harbinger of the savings 2016 is expected to bring,” said Gregg Laskoski, senior petroleum analyst for GasBuddy.

“What caused it? We've been fortunate that 2016 delivered a successful and largely uneventful transition by refineries to the ‘summer blend’ fuel formulation which has been completed in California and is nearing completion almost everywhere else.

Concurrent output through March and early April matches levels not seen since 2005,” Laskoski added. “So the healthy inventory in advance of demand has helped flatten prices, but we don’t expect that to last when summer travel kicks into high gear.”
Source link

Gas prices flat in RI, up 2 cents in MA – WPRI 12 Eyewitness News

0

istock generic gas pump

PROVIDENCE, R.I. (AP) — The cost of a gallon of gasoline in Rhode Island is holding steady.

The price had increased over the last five weeks. AAA Northeast found in its weekly survey that self-serve, regular gasoline is selling for an average of $2.04 per gallon, the same as last week.

That price is 32 cents lower than the same time a year ago, when a gallon sold for $2.36. Rhode Island’s price is the same as the national average.

AAA found self-serve, regular gas selling for as low as $1.95 per gallon and as high as $2.10 in Rhode Island.

In Massachusetts,  AAA Northeast announced Monday that self-serve, regular has risen 2 cents per gallon in the past week to an average of to $2. It’s the sixth consecutive week of higher prices in Massachusetts.

The Massachusetts price is still 4 cents per gallon lower than the national average and 34 cents lower than it was a year ago. AAA found self-serve, regular selling for as low as $1.89 per gallon and as high as $2.19.

Source link

Alamos Gold, Inc (AGI) Stock Price Will Hit $5.26: Analysts

0

Analysts are weighing in on how Alamos Gold, Inc. (AGI), might perform in the near term. Wall Street analysts have favorable assessment of of the stock, with a mean rating of 2.3. The stock is rated as buy by 3 analysts, with 8 outperform and 4 hold rating. The rating score is on a scale of 1 to 5 where 1 stands for strong buy and 5 stands for strong sell.

For the current quarter, the 10 analysts offering adjusted EPS forecast have a consensus estimate of $-0.03 a share, which would compare with $-0.01 in the same quarter last year. They have a high estimate of $-0.01 and a low estimate of $-0.08. Revenue for the period is expected to total nearly $113.35M from $44.73M the year-ago period.

For the full year, 14 Wall Street analysts forecast this company would deliver earnings of $-0.1 per share, with a high estimate of $-0.03 and a low estimate of $-0.25. It had reported earnings per share of $-0.1 in the corresponding quarter of the previous year. Revenue for the period is expected to total nearly $472.75M versus 355.10M in the preceding year.

The analysts project the company to maintain annual growth of around -28.51 percent over the next five years as compared to an average growth rate of 17.53 percent expected for its competitors in the same industry.

Among the 9 analysts Thomson/First Call tracks, the 12-month average price target for AGI is $5.26 but some analysts are projecting the price to go as high as $7. If the optimistic analysts are correct, that represents a 22 percent upside potential from the recent closing price of $5.74. Some sell-side analysts, particularly the bearish ones, have called for $3.5 price targets on shares of Alamos Gold, Inc..

In the last reported results, the company reported earnings of $-0.08 per share, while analysts were calling for share earnings of $-0.03. It was an earnings surprise of -166.7 percent. In the matter of earnings surprises, the term Cockroach Effect is often implied. Cockroach Effect is a market theory that suggests that when a company reveals bad news to the public, there may be many more related negative events that have yet to be revealed. In the case of earnings surprises, if a company is suggesting a negative earnings surprise it means there are more to come.

Alamos Gold Inc. explores for, mines, develops, and produces gold deposits in the United States and Canada. The company also explores for silver and precious metals. Its principal assets include the Young-Davidson mine, which includes mineral leases and claims totaling 11,000 acres located in Northern Ontario, Canada; the Mulatos mine in the Salamandra concessions; and the El Chanate mine that comprises 22 mineral concessions covering 4,618 hectares situated in the State of Sonora, Mexico. The company also holds interest in a portfolio of development stage projects in Mexico, Turkey, Canada, and the United States. The company was formerly known as AuRico Gold Inc. and changed its name to Alamos Gold, Inc. in July 2015. Alamos Gold, Inc. is headquartered in Toronto, Canada.
Source link

Death toll hits 106 from fireworks blast at India

0

An unidentified man weeps as bodies of victims lie outside a morgue at the Kollam district hospital after a massive fire broke out during a fireworks display at the Puttingal temple complex in Paravoor village, Kollam district, southern Kerala state, India, Sunday, April 10, 2016. Dozens were killed and many more were injured when a spark from an unauthorized fireworks show ignited a separate batch of fireworks that were being stored at the temple complex, officials said. (Jyothiraj. N.S/Associated Press)

April 10 at 10:46 PM

THIRUVANANTHAPURAM, India — Rescue officials on Monday sifted through a Hindu temple in southern India where more than 100 died when a fireworks display - an unauthorized pyrotechnic display that went horribly wrong - swept through for a religious festival packed with thousands.The official death toll so far from the pre-dawn fire on Sunday at the Puttingal temple complex in the village of Paravoor, stood at 106 people with more than 380 others hurt, officials said, but local media reports said the figure was higher.

Scores of devotees ran in panic as the massive initial blast cut off power in the complex, while other explosions sent flames and debris raining down, a witness said. Many people were trapped.

“It was complete chaos,” said Krishna Das of Paravoor. “People were screaming in the dark. Ambulance sirens went off, and in the darkness no one knew how to find their way out of the complex.”

The fire started when a spark from the fireworks show ignited a separate batch of fireworks stored in the temple complex, said Chief Minister Oommen Chandy, the top elected official in Kerala state.

Police were searching for 15 members of the temple board who fled after the accident. Police were investigating for possible charges of culpable homicide, punishable with life imprisonment, and illegally storing a cache of explosives.

Most of the 106 deaths occurred when the building where the fireworks were stored collapsed, Chandy told reporters. About 60 bodies have been identified, he said. TimesNow, an Indian television news channel, put the death toll at 112.

Das said ambulances carried the injured to hospitals in the state capital of Thiruvananthapuram, about 60 kilometers (37 miles) south of Paravoor, as well as the city of Kollam.

Villagers and police pulled many of the injured out from under slabs of concrete.

TV channels showed video of huge clouds of white smoke billowing from the temple, as fireworks were still going off in the sky.

One of the explosions sent huge chunks of concrete flying as far as a kilometer (half a mile), said Jayashree Harikrishnan, another resident.

Rescuers searched the wreckage for survivors, while backhoes cleared debris and thousands of worried relatives went to the temple to search for loved ones.

The temple holds a competitive fireworks show every year, with different groups putting on displays for thousands gathered for the end of a seven-day festival honoring the goddess Bhadrakali, a southern Indian incarnation of the Hindu goddess Kali.

This year, however, authorities in Kollam district had denied temple officials permission to hold the fireworks display, said A. Shainamol, the district’s top official.

“They were clearly told that no permission would be given for any kind of fireworks,” Shainamol told reporters.

Permission was denied over fears the competing sides would try to outdo each other with more and more fireworks and because the temple gets overcrowded during the festival, she said.

Amita Prakash, a resident, said she and some other residents have been trying since 2012 to stop the fireworks display which goes on for hours. “We petitioned state authorities this year also. Some of the organizers threatened my family with harm if I continued with my campaign,” she told reporters.

Chandy, the state’s chief minister, said he had appointed a retired judge to investigate the events leading to the fire and that action would be taken against those who had ignored rules.

Prime Minister Narendra Modi flew in from New Delhi to visit the site and met with Chandy and other Kerala leaders on measures to help the survivors.

Source link

ES Morning Update April 11th 2016

0

3d1941a9-29de-4b04-b72e-f4f79d1b2f23

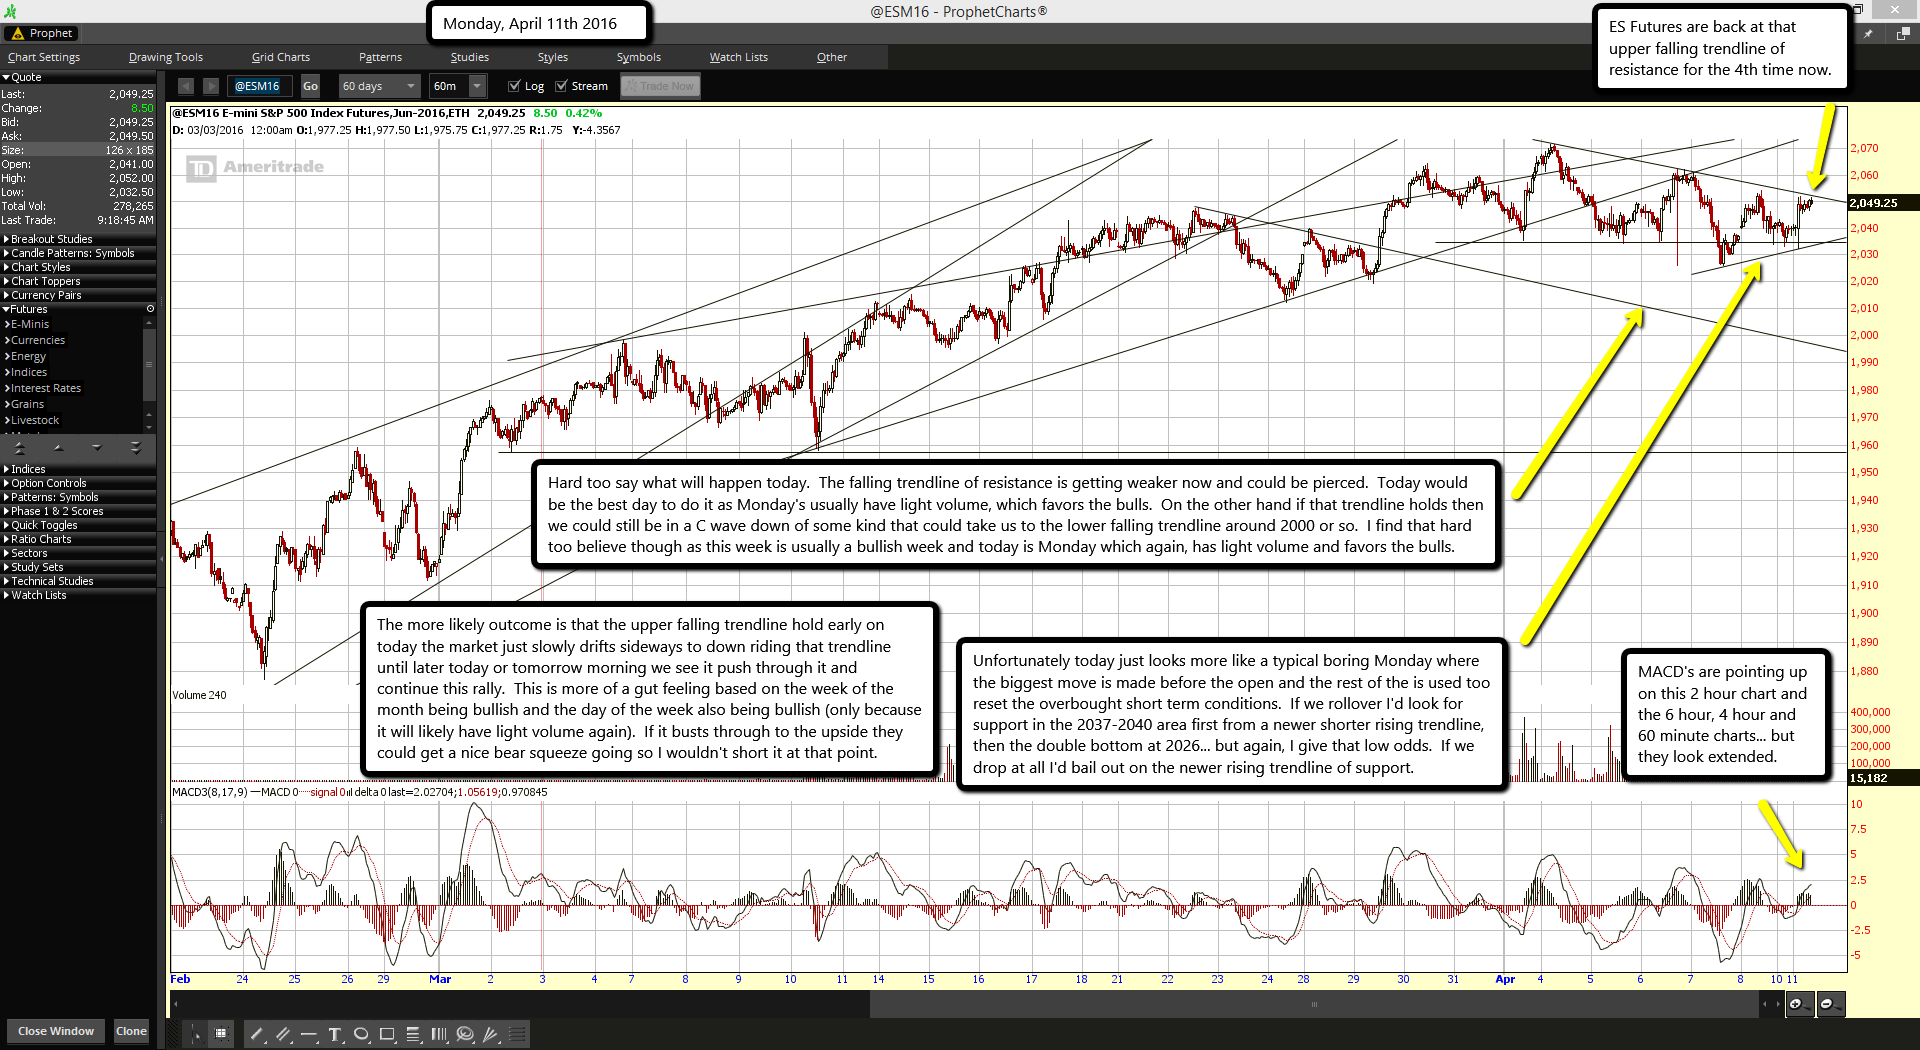
ES Futures are back at that upper falling trendline of resistance for the 4th time now.

MACD's are pointing up on this 2 hour chart and the 6 hour, 4 hour and 60 minute charts... but they look extended.

Hard too say what will happen today.  The falling trendline of resistance is getting weaker now and could be pierced.  Today would be the best day to do it as Monday's usually have light volume, which favors the bulls.  On the other hand if that trendline holds then we could still be in a C wave down of some kind that could take us to the lower falling trendline around 2000 or so.  I find that hard too believe though as this week is usually a bullish week and today is Monday which again, has light volume and favors the bulls.

The more likely outcome is that the upper falling trendline hold early on today the market just slowly drifts sideways to down riding that trendline until later today or tomorrow morning we see it push through it and continue this rally.  This is more of a gut feeling based on the week of the month being bullish and the day of the week also being bullish (only because it will likely have light volume again).  If it busts through to the upside they could get a nice bear squeeze going so I wouldn't short it at that point.

Unfortunately today just looks more like a typical boring Monday where the biggest move is made before the open and the rest of the is used too reset the overbought short term conditions.  If we rollover I'd look for support in the 2037-2040 area first from a newer shorter rising trendline, then the double bottom at 2026... but again, I give that low odds.  If we drop at all I'd bail out on the newer rising trendline of support.

ES Morning Update April 8th 2016

0

92a52a12-33db-4627-b3d7-c30f3ca39339

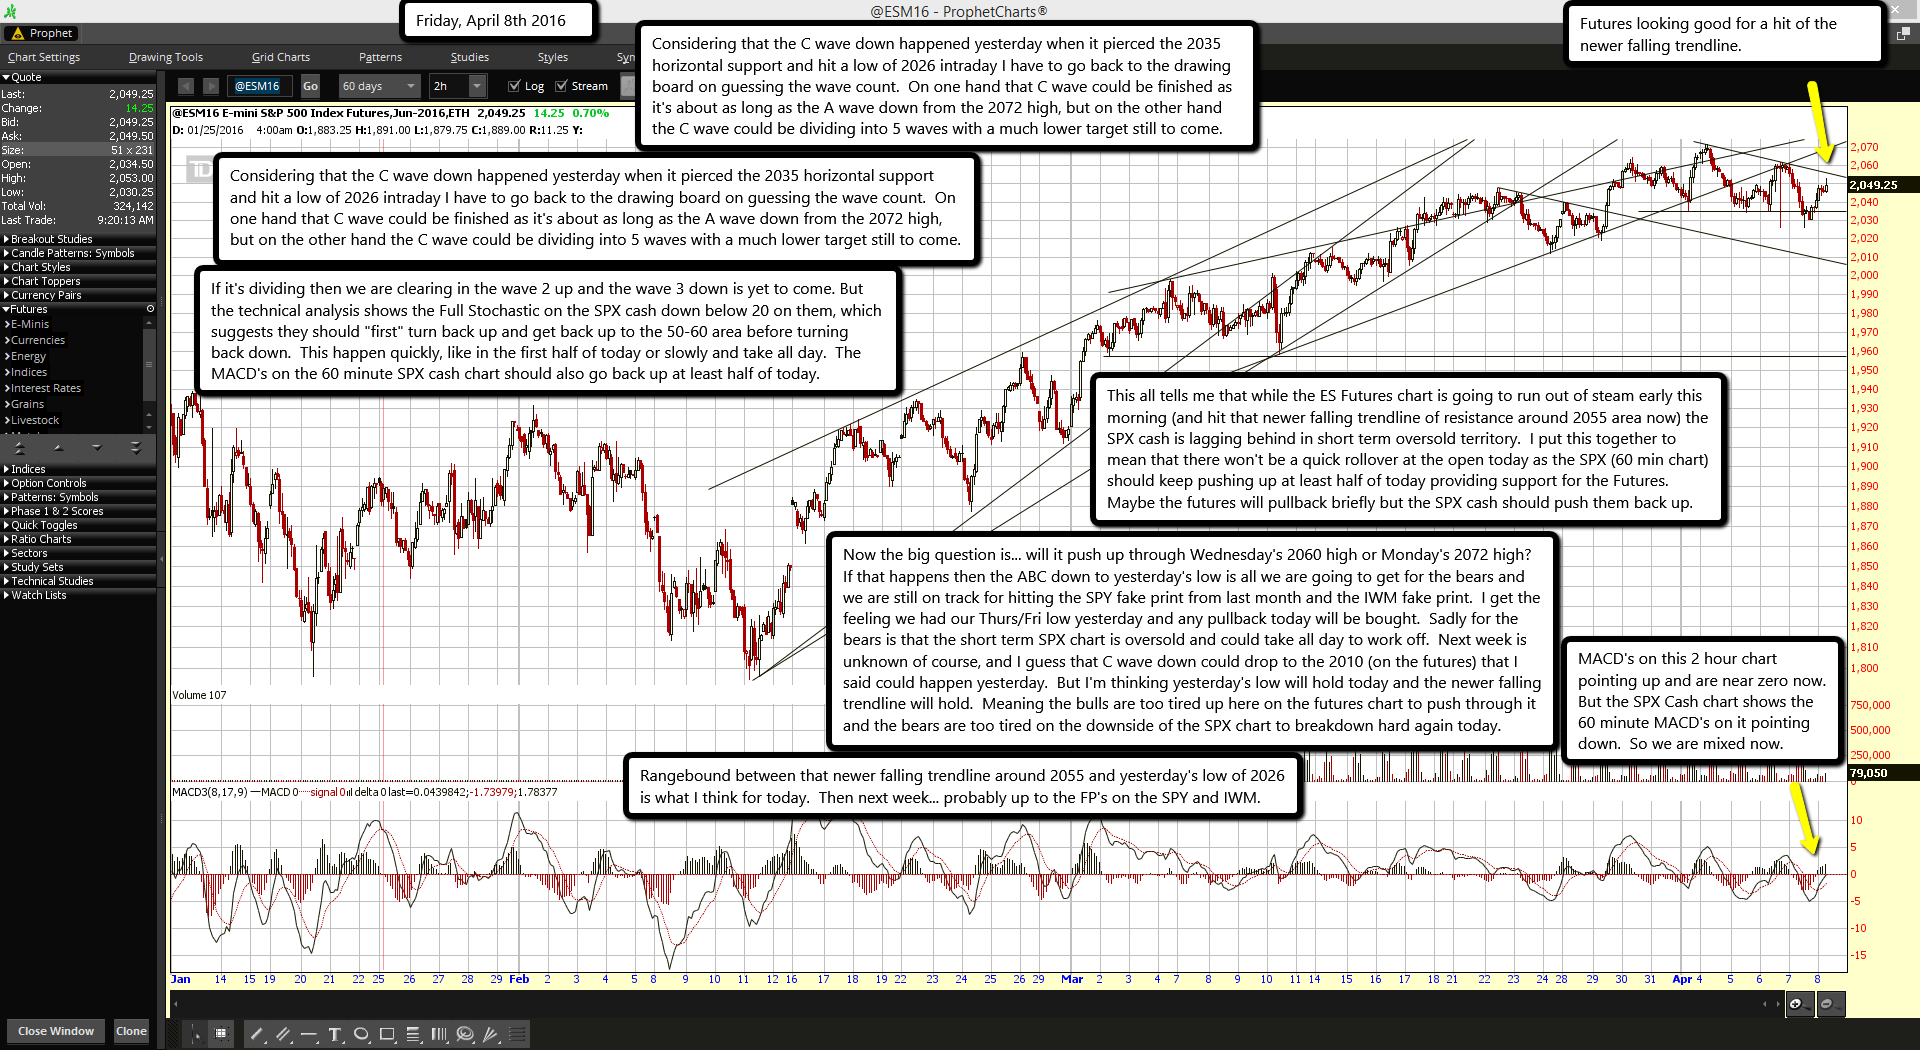
Futures looking good for a hit of the newer falling trendline.

MACD's on this 2 hour chart pointing up and are near zero now.  But the SPX Cash chart shows the 60 minute MACD's on it pointing down.  So we are mixed now.

Considering that the C wave down happened yesterday when it pierced the 2035 horizontal support and hit a low of 2026 intraday I have to go back to the drawing board on guessing the wave count.  On one hand that C wave could be finished as it's about as long as the A wave down from the 2072 high, but on the other hand the C wave could be dividing into 5 waves with a much lower target still to come.

If it's dividing then we are clearing in the wave 2 up and the wave 3 down is yet to come. But the technical analysis shows the Full Stochastic on the SPX cash down below 20 on them, which suggests they should "first" turn back up and get back up to the 50-60 area before turning back down.  This happen quickly, like in the first half of today or slowly and take all day.  The MACD's on the 60 minute SPX cash chart should also go back up at least half of today.

This all tells me that while the ES Futures chart is going to run out of steam early this morning (and hit that newer falling trendline of resistance around 2055 area now) the SPX cash is lagging behind in short term oversold territory.  I put this together to mean that there won't be a quick rollover at the open today as the SPX (60 min chart) should keep pushing up at least half of today providing support for the Futures.  Maybe the futures will pullback briefly but the SPX cash should push them back up.

Now the big question is... will it push up through Wednesday's 2060 high or Monday's 2072 high?  If that happens then the ABC down to yesterday's low is all we are going to get for the bears and we are still on track for hitting the SPY fake print from last month and the IWM fake print.  I get the feeling we had our Thurs/Fri low yesterday and any pullback today will be bought.  Sadly for the bears is that the short term SPX chart is oversold and could take all day to work off.  Next week is unknown of course, and I guess that C wave down could drop to the 2010 (on the futures) that I said could happen yesterday.  But I'm thinking yesterday's low will hold today and the newer falling trendline will hold.  Meaning the bulls are too tired up here on the futures chart to push through it and the bears are too tired on the downside of the SPX chart to breakdown hard again today.

Rangebound between that newer falling trendline around 2055 and yesterday's low of 2026 is what I think for today.  Then next week... probably up to the FP's on the SPY and IWM.

ES Morning Update April 7th 2016

0

eefada42-d92e-4534-a445-2179635175ed

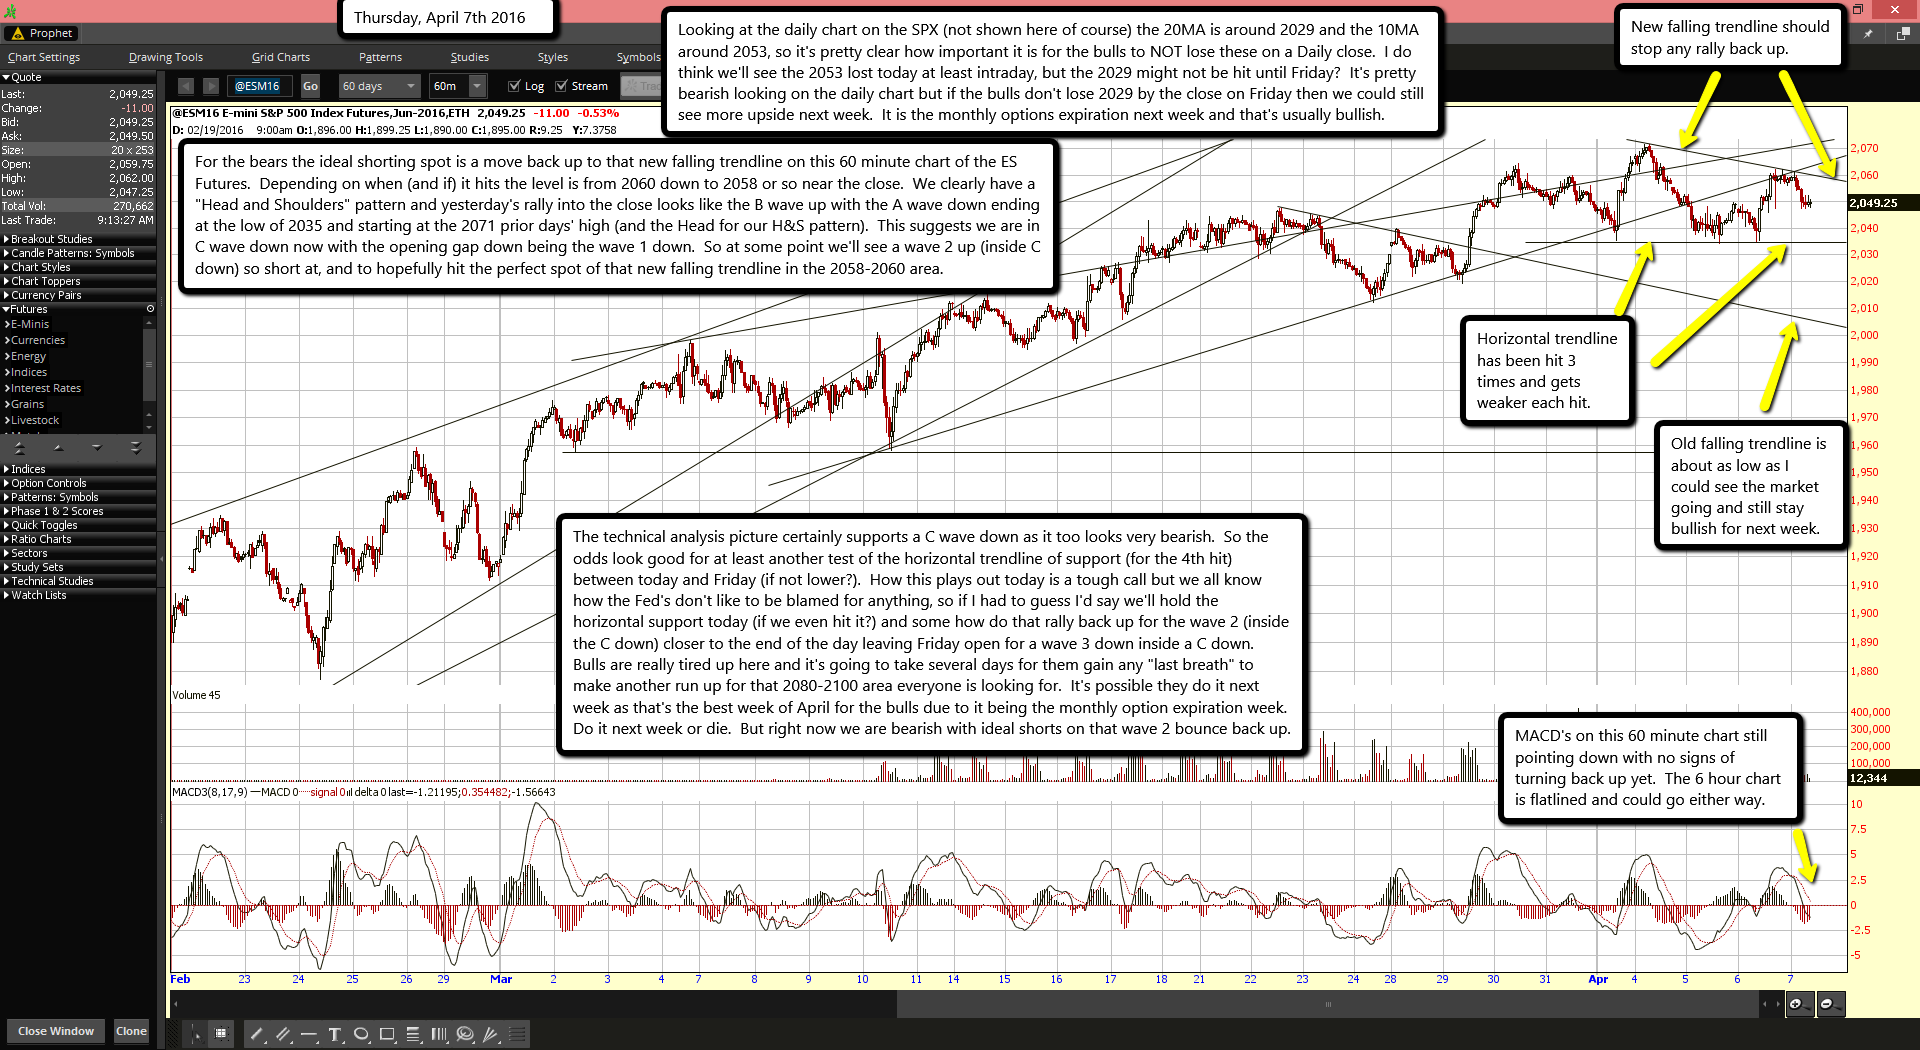
New falling trendline should stop any rally back up.

Horizontal trendline has been hit 3 times and gets weaker each hit.

Old falling trendline is about as low as I could see the market going and still stay bullish for next week.

MACD's on this 60 minute chart still pointing down with no signs of turning back up yet.  The 6 hour chart is flatlined and could go either way.

Looking at the daily chart on the SPX (not shown here of course) the 20MA is around 2029 and the 10MA around 2053, so it's pretty clear how important it is for the bulls to NOT lose these on a Daily close.  I do think we'll see the 2053 lost today at least intraday, but the 2029 might not be hit until Friday?  It's pretty bearish looking on the daily chart but if the bulls don't lose 2029 by the close on Friday then we could still see more upside next week.  It is the monthly options expiration next week and that's usually bullish.

For the bears the ideal shorting spot is a move back up to that new falling trendline on this 60 minute chart of the ES Futures.  Depending on when (and if) it hits the level is from 2060 down to 2058 or so near the close.  We clearly have a "Head and Shoulders" pattern and yesterday's rally into the close looks like the B wave up with the A wave down ending at the low of 2035 and starting at the 2071 prior days' high (and the Head for our H&S pattern).  This suggests we are in C wave down now with the opening gap down being the wave 1 down.  So at some point we'll see a wave 2 up (inside C down) so short at, and to hopefully hit the perfect spot of that new falling trendline in the 2058-2060 area.

The technical analysis picture certainly supports a C wave down as it too looks very bearish.  So the odds look good for at least another test of the horizontal trendline of support (for the 4th hit) between today and Friday (if not lower?).  How this plays out today is a tough call but we all know how the Fed's don't like to be blamed for anything, so if I had to guess I'd say we'll hold the horizontal support today (if we even hit it?) and some how do that rally back up for the wave 2 (inside the C down) closer to the end of the day leaving Friday open for a wave 3 down inside a C down.  Bulls are really tired up here and it's going to take several days for them gain any "last breath" to make another run up for that 2080-2100 area everyone is looking for.  It's possible they do it next week as that's the best week of April for the bulls due to it being the monthly option expiration week.  Do it next week or die.  But right now we are bearish with ideal shorts on that wave 2 bounce back up.

ES Morning Update April 6th 2016

0

48970f6d-0bdc-49b2-b236-250113ad6d71

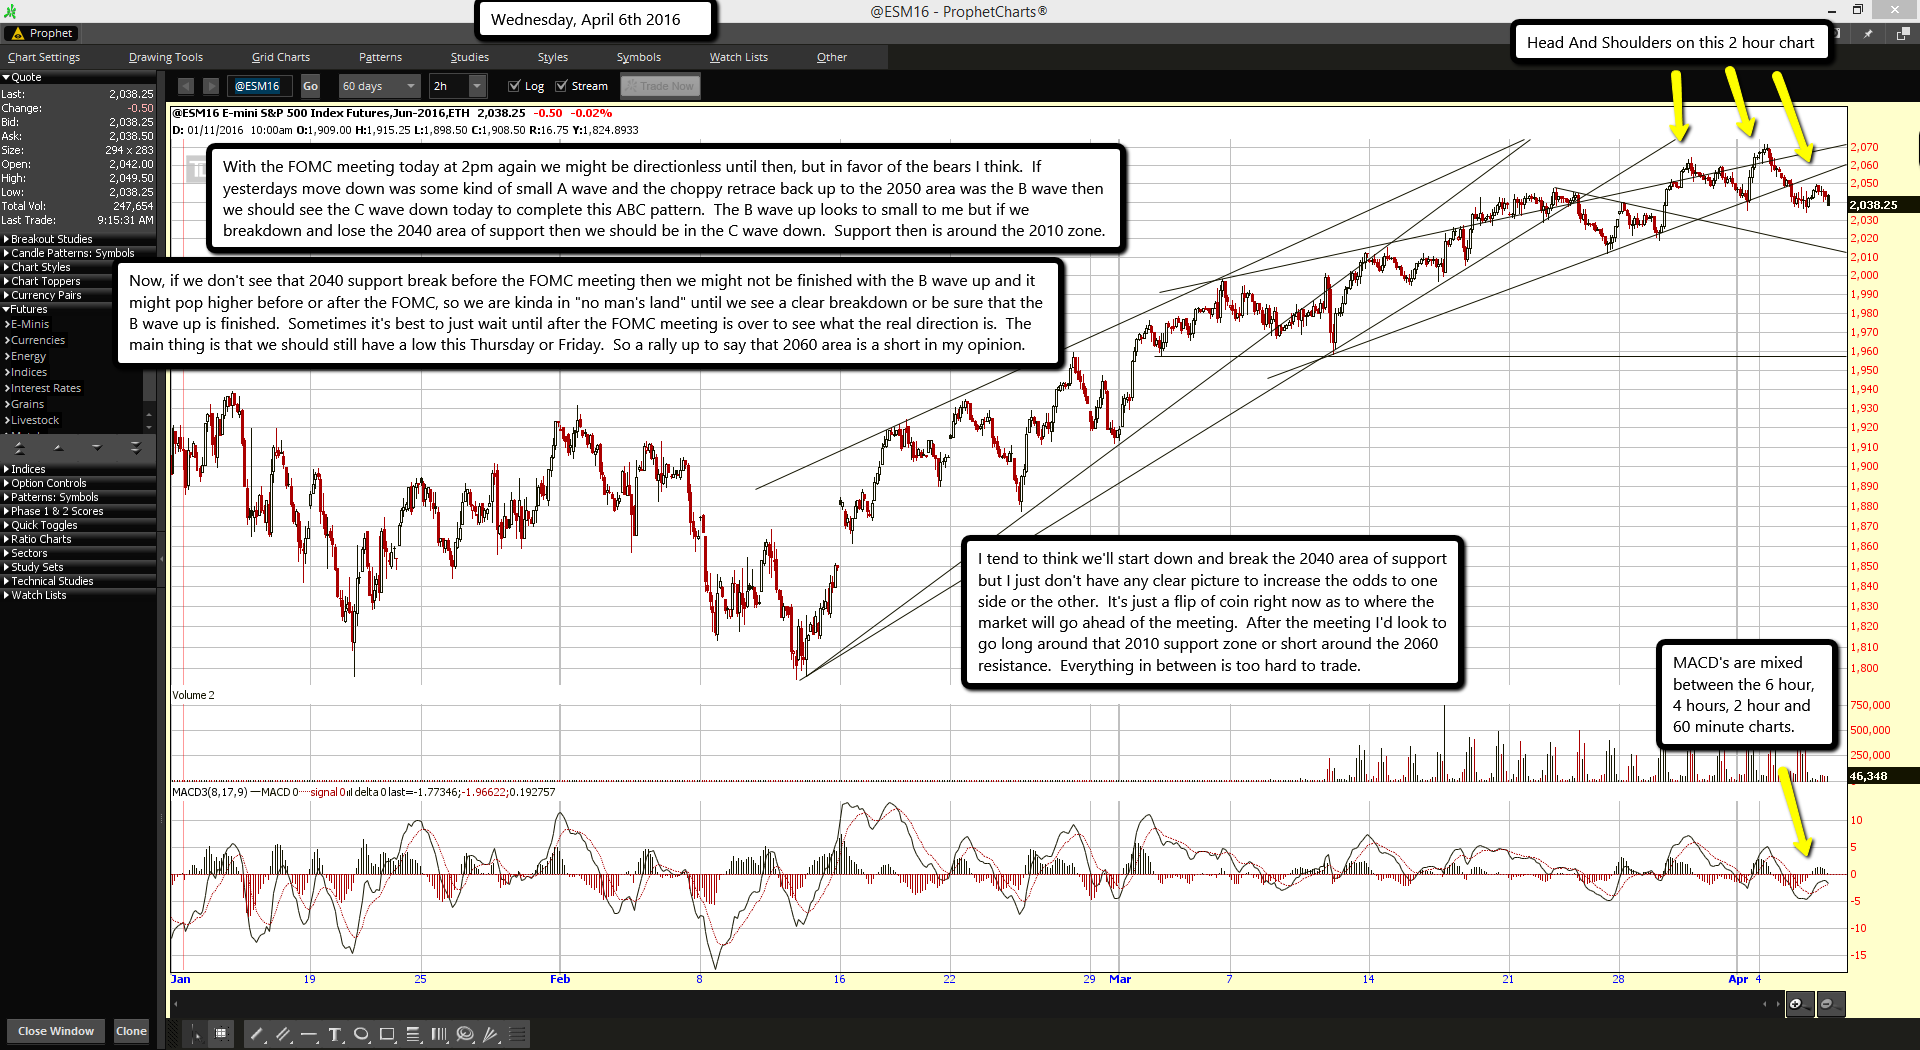
Head And Shoulders on this 2 hour chart

MACD's are mixed between the 6 hour, 4 hours, 2 hour and 60 minute charts.

With the FOMC meeting today at 2pm again we might be directionless until then, but in favor of the bears I think.  If yesterdays move down was some kind of small A wave and the choppy retrace back up to the 2050 area was the B wave then we should see the C wave down today to complete this ABC pattern.  The B wave up looks to small to me but if we breakdown and lose the 2040 area of support then we should be in the C wave down.  Support then is around the 2010 zone.

Now, if we don't see that 2040 support break before the FOMC meeting then we might not be finished with the B wave up and it might pop higher before or after the FOMC, so we are kinda in "no man's land" until we see a clear breakdown or be sure that the B wave up is finished.  Sometimes it's best to just wait until after the FOMC meeting is over to see what the real direction is.  The main thing is that we should still have a low this Thursday or Friday.  So a rally up to say that 2060 area is a short in my opinion.

I tend to think we'll start down and break the 2040 area of support but I just don't have any clear picture to increase the odds to one side or the other.  It's just a flip of coin right now as to where the market will go ahead of the meeting.  After the meeting I'd look to go long around that 2010 support zone or short around the 2060 resistance.  Everything in between is too hard to trade.

ES Morning Update April 5th 2016

0

f8950a8b-3583-4448-bb6f-e346235fbafb

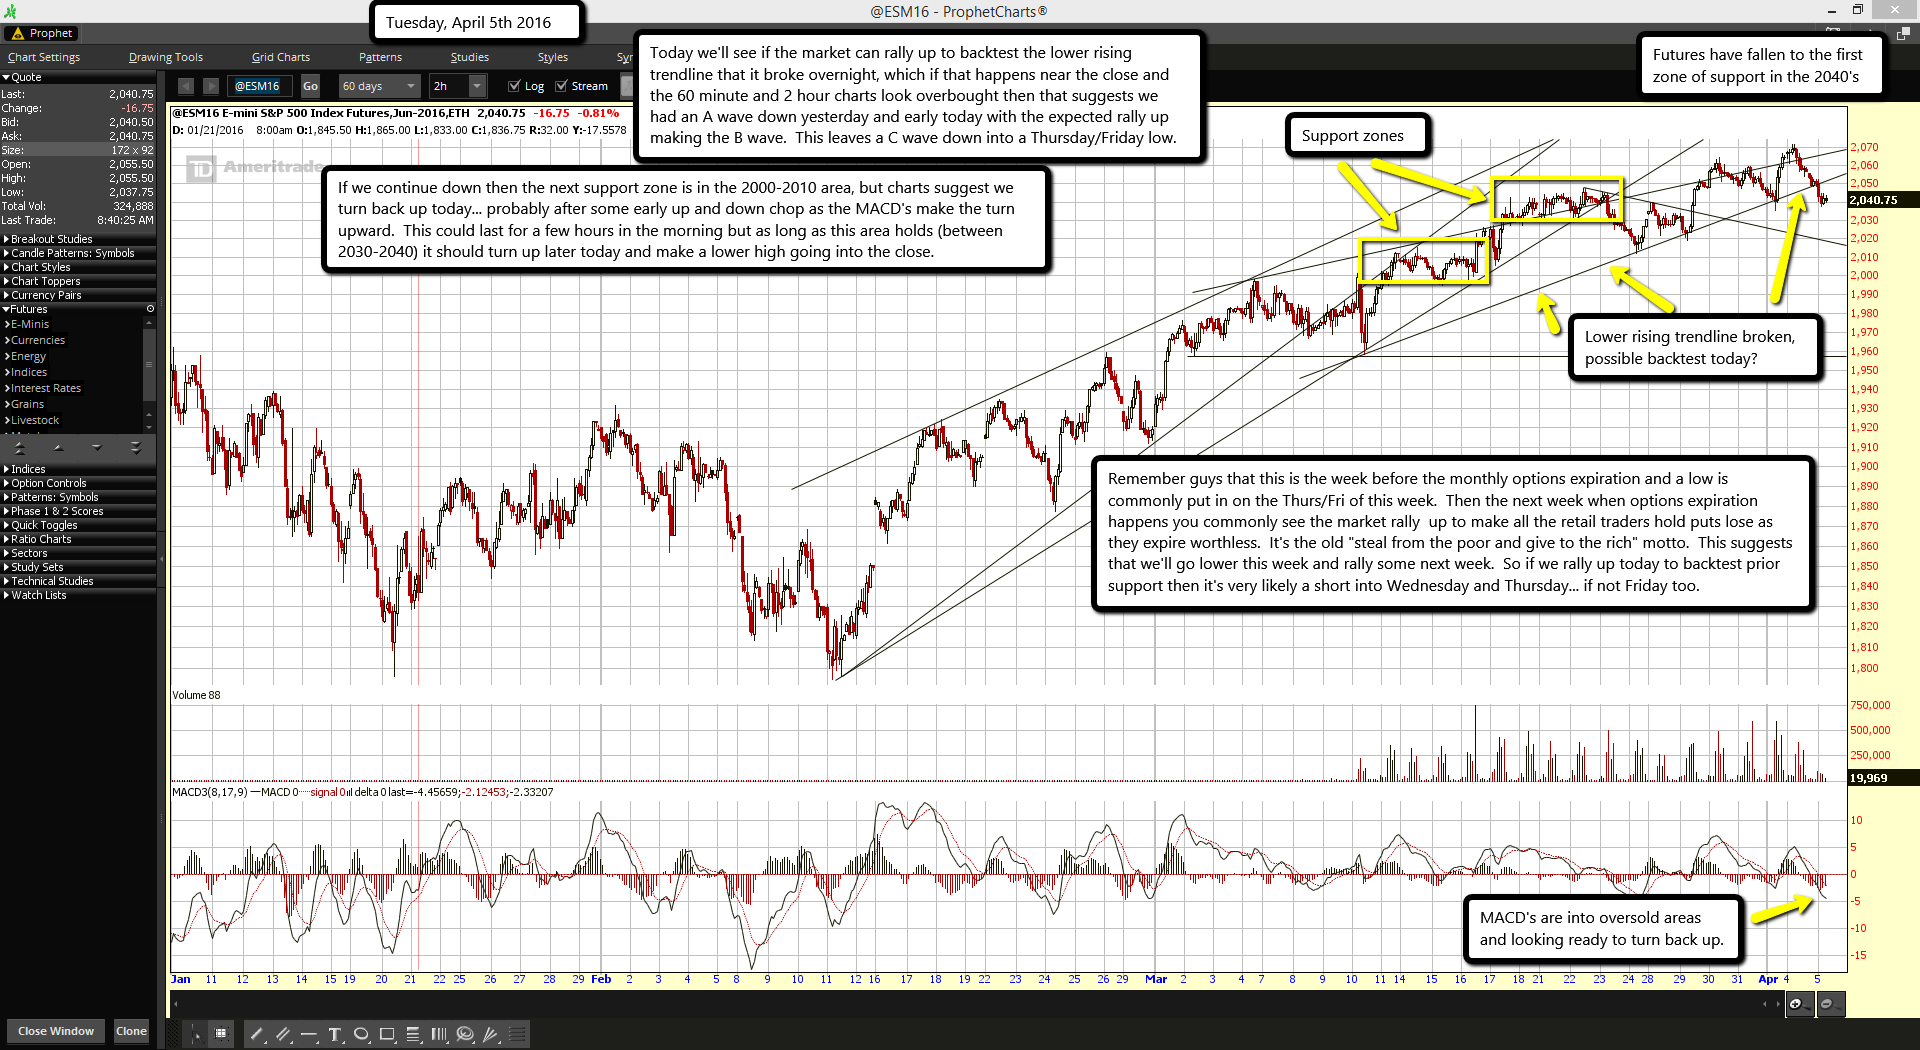
Futures have fallen to the first zone of support in the 2040's

MACD's are into oversold areas and looking ready to turn back up.

Today we'll see if the market can rally up to backtest the lower rising trendline that it broke overnight, which if that happens near the close and the 60 minute and 2 hour charts look overbought then that suggests we had an A wave down yesterday and early today with the expected rally up making the B wave.  This leaves a C wave down into a Thursday/Friday low.

If we continue down then the next support zone is in the 2000-2010 area, but charts suggest we turn back up today... probably after some early up and down chop as the MACD's make the turn upward.  This could last for a few hours in the morning but as long as this area holds (between 2030-2040) it should turn up later today and make a lower high going into the close.

Remember guys that this is the week before the monthly options expiration and a low is commonly put in on the Thurs/Fri of this week.  Then the next week when options expiration happens you commonly see the market rally  up to make all the retail traders hold puts lose as they expire worthless.  It's the old "steal from the poor and give to the rich" motto.  This suggests that we'll go lower this week and rally some next week.  So if we rally up today to backtest prior support then it's very likely a short into Wednesday and Thursday... if not Friday too.

ES Morning Update April 4th 2016

0

8382e179-20ab-4d32-9419-a894164b220f

Up again and looking ready to rollover.

MACD's on this 2 hour chart also look like they want to go down.

Well, here we are again starting a new week with a market that just doesn't want to die.  But we all know the bull is near an end... at least for a nice week or so correction, but probably much more.  Today though is another Monday where volume will probably be very light again, just like several past Mondays.  Our target on the upside is the 2080-2090 zone on the SPX (of course the 2100 level is a huge magnet but also a huge resistance).  So on this futures chart that's probably the 2075-2085 zone.

Considering how close we are to that zone I'd think we'll hit it today or Tuesday to top this market out.  Naturally the first move down will have dip buyers come in so it's likely going to be later in the week before we likely see some 30-50 point down day (or even next week?).  I do see it coming but as we all know most tops are choppy and don't fall off a cliff right off the bat.  So once we top out today or Tuesday (again, just the most likely days to top... not guaranteed of course) I'd look for the 2040 zone as first support on the first move down.  Then the 2000-2010 zone.

As for today... well, we all know how overbought the market is, so I'm not shorting it until I see if first... we hit my target zone, or second... we don't hit it but rollover to find support around 2040 and then rally back up to make a lower high, which only then will I short it.  Plus we still haven't hit the FP's on the SPY, IWM and Apple... and we are so close to the IMW and Apple one's that I just can't see some huge move down start until they are first hit and fulfilled.  Needless to say but we could be in for another boring slow day of grind.

ES Morning Update April 1st 2016

0

b6ac88aa-f76c-4335-b2e0-4cb2f971bc30

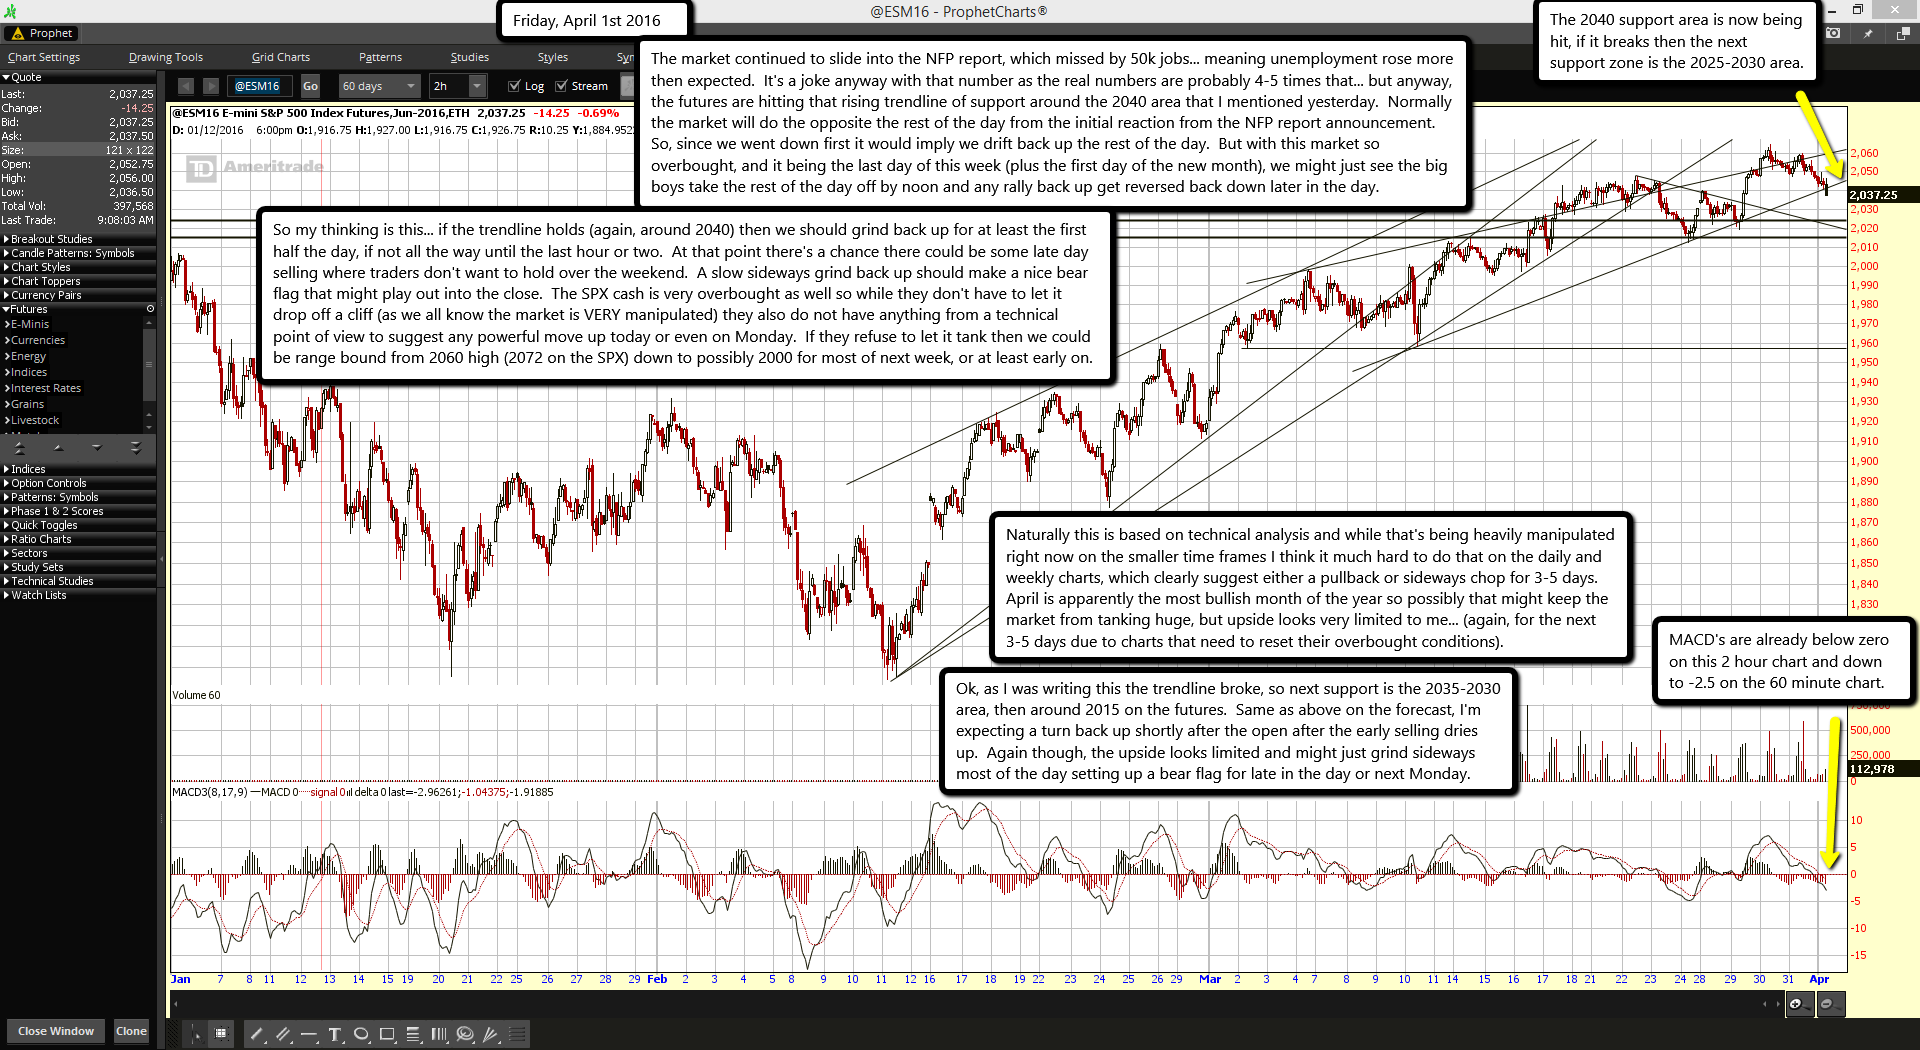
The 2040 support area is now being hit, if it breaks then the next support zone is the 2025-2030 area.

MACD's are already below zero on this 2 hour chart and down to -2.5 on the 60 minute chart.

The market continued to slide into the NFP report, which missed by 50k jobs... meaning unemployment rose more then expected.  It's a joke anyway with that number as the real numbers are probably 4-5 times that... but anyway, the futures are hitting that rising trendline of support around the 2040 area that I mentioned yesterday.  Normally the market will do the opposite the rest of the day from the initial reaction from the NFP report announcement.  So, since we went down first it would imply we drift back up the rest of the day.  But with this market so overbought, and it being the last day of this week (plus the first day of the new month), we might just see the big boys take the rest of the day off by noon and any rally back up get reversed back down later in the day.

So my thinking is this... if the trendline holds (again, around 2040) then we should grind back up for at least the first half the day, if not all the way until the last hour or two.  At that point there's a chance there could be some late day selling where traders don't want to hold over the weekend.  A slow sideways grind back up should make a nice bear flag that might play out into the close.  The SPX cash is very overbought as well so while they don't have to let it drop off a cliff (as we all know the market is VERY manipulated) they also do not have anything from a technical point of view to suggest any powerful move up today or even on Monday.  If they refuse to let it tank then we could be range bound from 2060 high (2072 on the SPX) down to possibly 2000 for most of next week, or at least early on.

Naturally this is based on technical analysis and while that's being heavily manipulated right now on the smaller time frames I think it much hard to do that on the daily and weekly charts, which clearly suggest either a pullback or sideways chop for 3-5 days.  April is apparently the most bullish month of the year so possibly that might keep the market from tanking huge, but upside looks very limited to me... (again, for the next 3-5 days due to charts that need to reset their overbought conditions).

Ok, as I was writing this the trendline broke, so next support is the 2035-2030 area, then around 2015 on the futures.  Same as above on the forecast, I'm expecting a turn back up shortly after the open after the early selling dries up.  Again though, the upside looks limited and might just grind sideways most of the day setting up a bear flag for late in the day or next Monday.

ES Morning Update March 31st 2016

0

287d9a9f-aef6-449b-97b9-766e995221bf

Support around 2040 from rising trendline

As all of you know in the chatroom I had my computer crash on me Wednesday morning and wasn't able to do a morning update chart.  It's back up now as you can see (although I do still have a bad drive that caused the crash) and it I didn't miss much.  On Tuesday I thought we'd chop around inside that triangle and then breakdown to head into a low between the 1980-2000 range by this Friday.  But the market had other plans it seems as it broke to the upside after Janet Yellen spoke and squeezed out a lot of shorts when it cleared that 20240 area of resistance.

So, where does that leave us now?  As I've mentioned before we have 3 FP's that are now getting much closer to being hit.  One on the SPY of course, then another on IMW and one on Apple.  Quite honestly those FP's are the only thing I can use for a target now as we are so overbought on technical analysis side of things that it's pointless to keep saying that we "should rollover" or "a pullback is near", because we are clearly in one of those periods where the market is just too manipulated.  I'd guess that technical analysis works about 80% of the time with the other 20% being periods like now where you just "buy the dip" until it creams you.  (Not that I'm doing that as I'm just waiting to short).

When will these FP's get hit?  I'd love to see them all hit today but it doesn't seem likely, at least not for the SPY.  Maybe Apple and IWM could squeeze up that high but the one on the SPY is still a good move away.  There's the FOMC Minutes (Meeting of March 15-16, 2016) next Wednesday, April 6th at 2:00 p.m. ET that "could" be the time we hit all the FP's, or possibly one more big squeeze tomorrow (Friday) from the Nonfarm Payrolls Report at 8:30 am (EST) that might produce that move?  As for today... overbought, overbought, overbought is all I can say!  But even if we pullback I'm not going to be too excited on a bigger trend change until those FP's on the upside are hit.  Whether that happens Friday or next week I'm not taking any big positions short until then.

ES Morning Update March 29th 2016

0

955d9504-9a2d-464c-80d0-631a1d966ae2

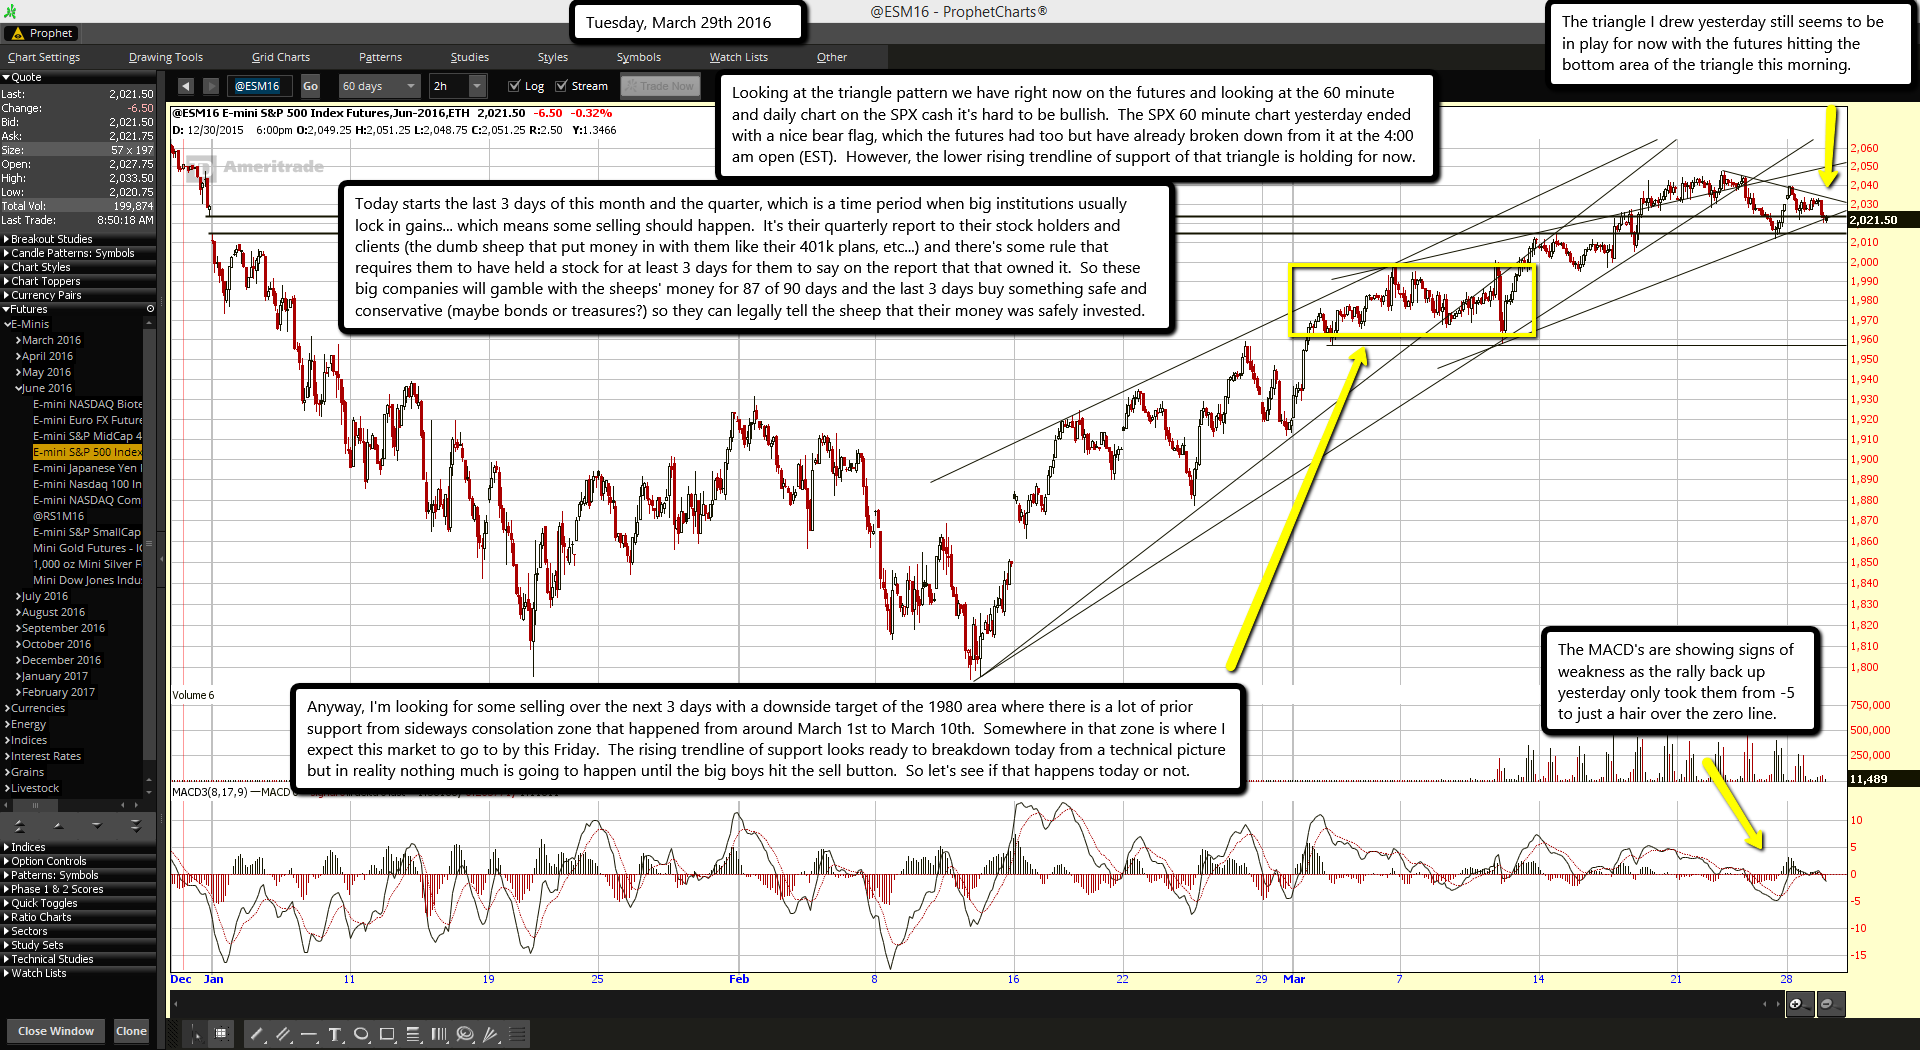
The triangle I drew yesterday still seems to be in play for now with the futures hitting the bottom area of the triangle this morning.

The MACD's are showing signs of weakness as the rally back up yesterday only took them from -5 to just a hair over the zero line.

Looking at the triangle pattern we have right now on the futures and looking at the 60 minute and daily chart on the SPX cash it's hard to be bullish.  The SPX 60 minute chart yesterday ended with a nice bear flag, which the futures had too but have already broken down from it at the 4:00 am open (EST).  However, the lower rising trendline of support of that triangle is holding for now.

Today starts the last 3 days of this month and the quarter, which is a time period when big institutions usually lock in gains... which means some selling should happen.  It's their quarterly report to their stock holders and clients (the dumb sheep that put money in with them like their 401k plans, etc...) and there's some rule that requires them to have held a stock for at least 3 days for them to say on the report that that owned it.  So these big companies will gamble with the sheeps' money for 87 of 90 days and the last 3 days buy something safe and conservative (maybe bonds or treasures?) so they can legally tell the sheep that their money was safely invested.

Anyway, I'm looking for some selling over the next 3 days with a downside target of the 1980 area where there is a lot of prior support from sideways consolation zone that happened from around March 1st to March 10th.  Somewhere in that zone is where I expect this market to go to by this Friday.  The rising trendline of support looks ready to breakdown today from a technical picture but in reality nothing much is going to happen until the big boys hit the sell button.  So let's see if that happens today or not.

How does US gender pay gap compare internationally? Pretty well, study says.

0

A new study on the gender pay gap internationally suggests that, well, it exists. And while this may not be news to economists and female employees alike, last week’s study by Glassdoor also suggests this gap shrinks when controlling for other non-gender-related factors such as occupation, industry, and experience.

The US is notorious for its sizable gender pay gap. In a 2014 report by the World Economic Forum, the US ranked 65th in wage equality among 142 countries.

But Glassdoor takes their recent analysis further, comparing the unexplained factors (presumed to be gender bias) between several developed countries. And in this comparison, the gender pay gap becomes pretty much even internationally, with the US falling in the middle of the pack.

“The ‘unexplained’ part is less than half in every country Glassdoor Research looked at, suggesting overt discrimination alone does not explain most of today’s gender pay gap,” Andrew Chamberlain, chief economist for Glassdoor, tells ABC News.

“The sorting of men and women into different occupations has emerged as one of the main drivers of the gender pay gap – a factor that has little to do with overt bias and reflects complex social pressures that divert women into some professions and away from others,” adds Dr. Chamberlain. “This points to the need for societal and public policy solutions that address these more subtle causes of gender pay differences.”

Chamberlain emphasizes that the encouraging numbers offered from the adjusted pay gap analysis does not mean that a problem doesn’t exist. For example, even though the gender pay gap shrinks when accounting for the lower proportion of women who work in a certain occupation, there are likely other entry barriers and social pressures that prohibited more women from entering a specific industry in the first place. Also noteworthy, the occupations with the biggest pay gaps are also the highest paid.

“For a whole bunch of reasons, through the education system and the workplace, women are being pushed into different kinds of roles,” Chamberlain tells Reuters. “This is the single largest factor we see contributing to today’s gender pay gap.”

But this recent study suggests that overt workplace bias may be more prominent in other countries compared to the US. Because although the gender pay gap is narrower in Australia and Germany than in the UK and the US, a larger proportion of it is unexplained in these two countries.

Sixty-seven percent of the gender pay gap in the US is ‘explained’ due to worker differences, and the remaining 33 percent is ‘unexplained,’ suggesting possible workplace gender bias. But this ratio is more prominent in other countries: 36 percent of the United Kingdom’s gender pay gap is unexplained, compared to 39 percent in Australia and 49 percent in Germany. France is the only country that has fewer unexplained sources than the US, at 29 percent.

In other words, the gender pay gap in the US is significant, but we can explain it: It stems from systemic problems in society such as educational access. Is that better than a smaller gender pay gap that can’t be economically explained? This is the question that Chamberlain, other economists, and world leaders might look to next.  

Source link

s2Member®