Sunday, July 26, 2026
Home Blog Page 56

ES Morning Update October 11th 2017

0

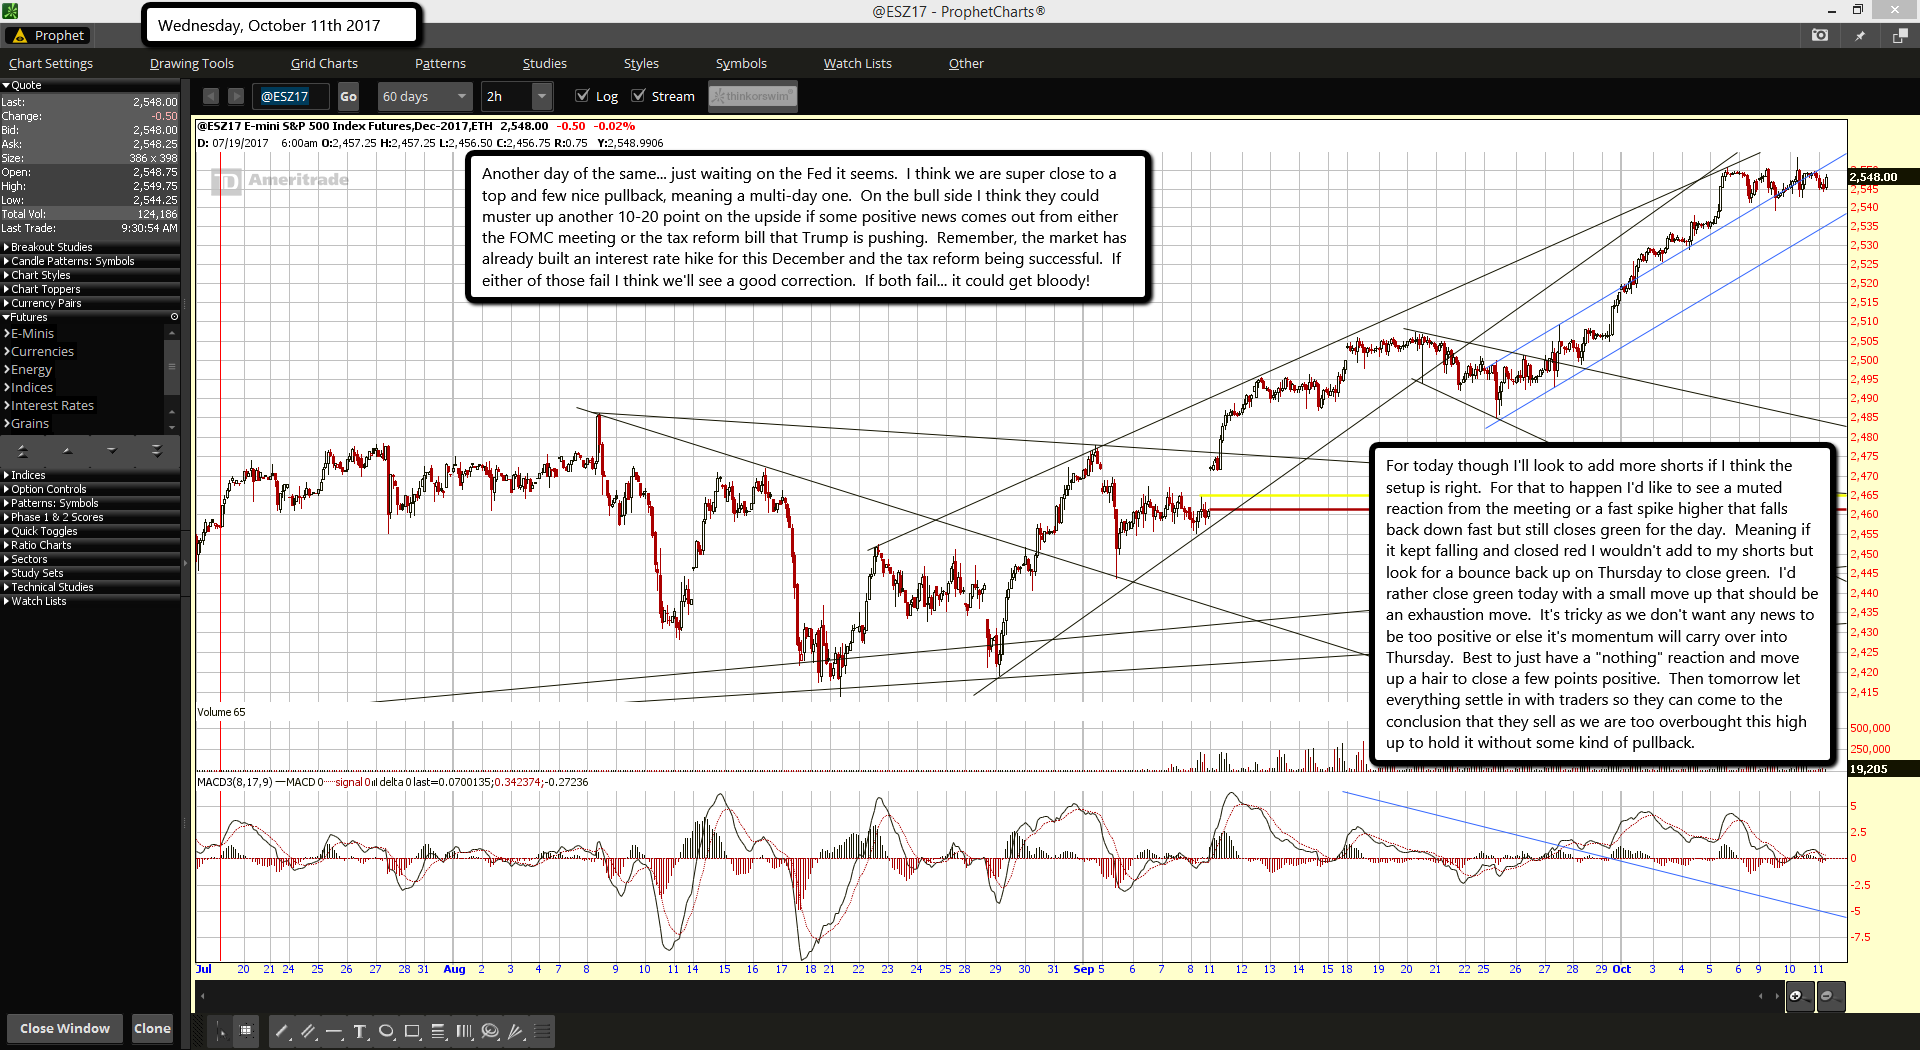
Another day of the same... just waiting on the Fed it seems.  I think we are super close to a top and few nice pullback, meaning a multi-day one.  On the bull side I think they could muster up another 10-20 point on the upside if some positive news comes out from either the FOMC meeting or the tax reform bill that Trump is pushing.  Remember, the market has already built an interest rate hike for this December and the tax reform being successful.  If either of those fail I think we'll see a good correction.  If both fail... it could get bloody!

For today though I'll look to add more shorts if I think the setup is right.  For that to happen I'd like to see a muted reaction from the meeting or a fast spike higher that falls back down fast but still closes green for the day.  Meaning if it kept falling and closed red I wouldn't add to my shorts but look for a bounce back up on Thursday to close green.  I'd rather close green today with a small move up that should be an exhaustion move.  It's tricky as we don't want any news to be too positive or else it's momentum will carry over into Thursday.  Best to just have a "nothing" reaction and move up a hair to close a few points positive.  Then tomorrow let everything settle in with traders so they can come to the conclusion that they sell as we are too overbought this high up to hold it without some kind of pullback.

ES Morning Update October 10th 2017

0

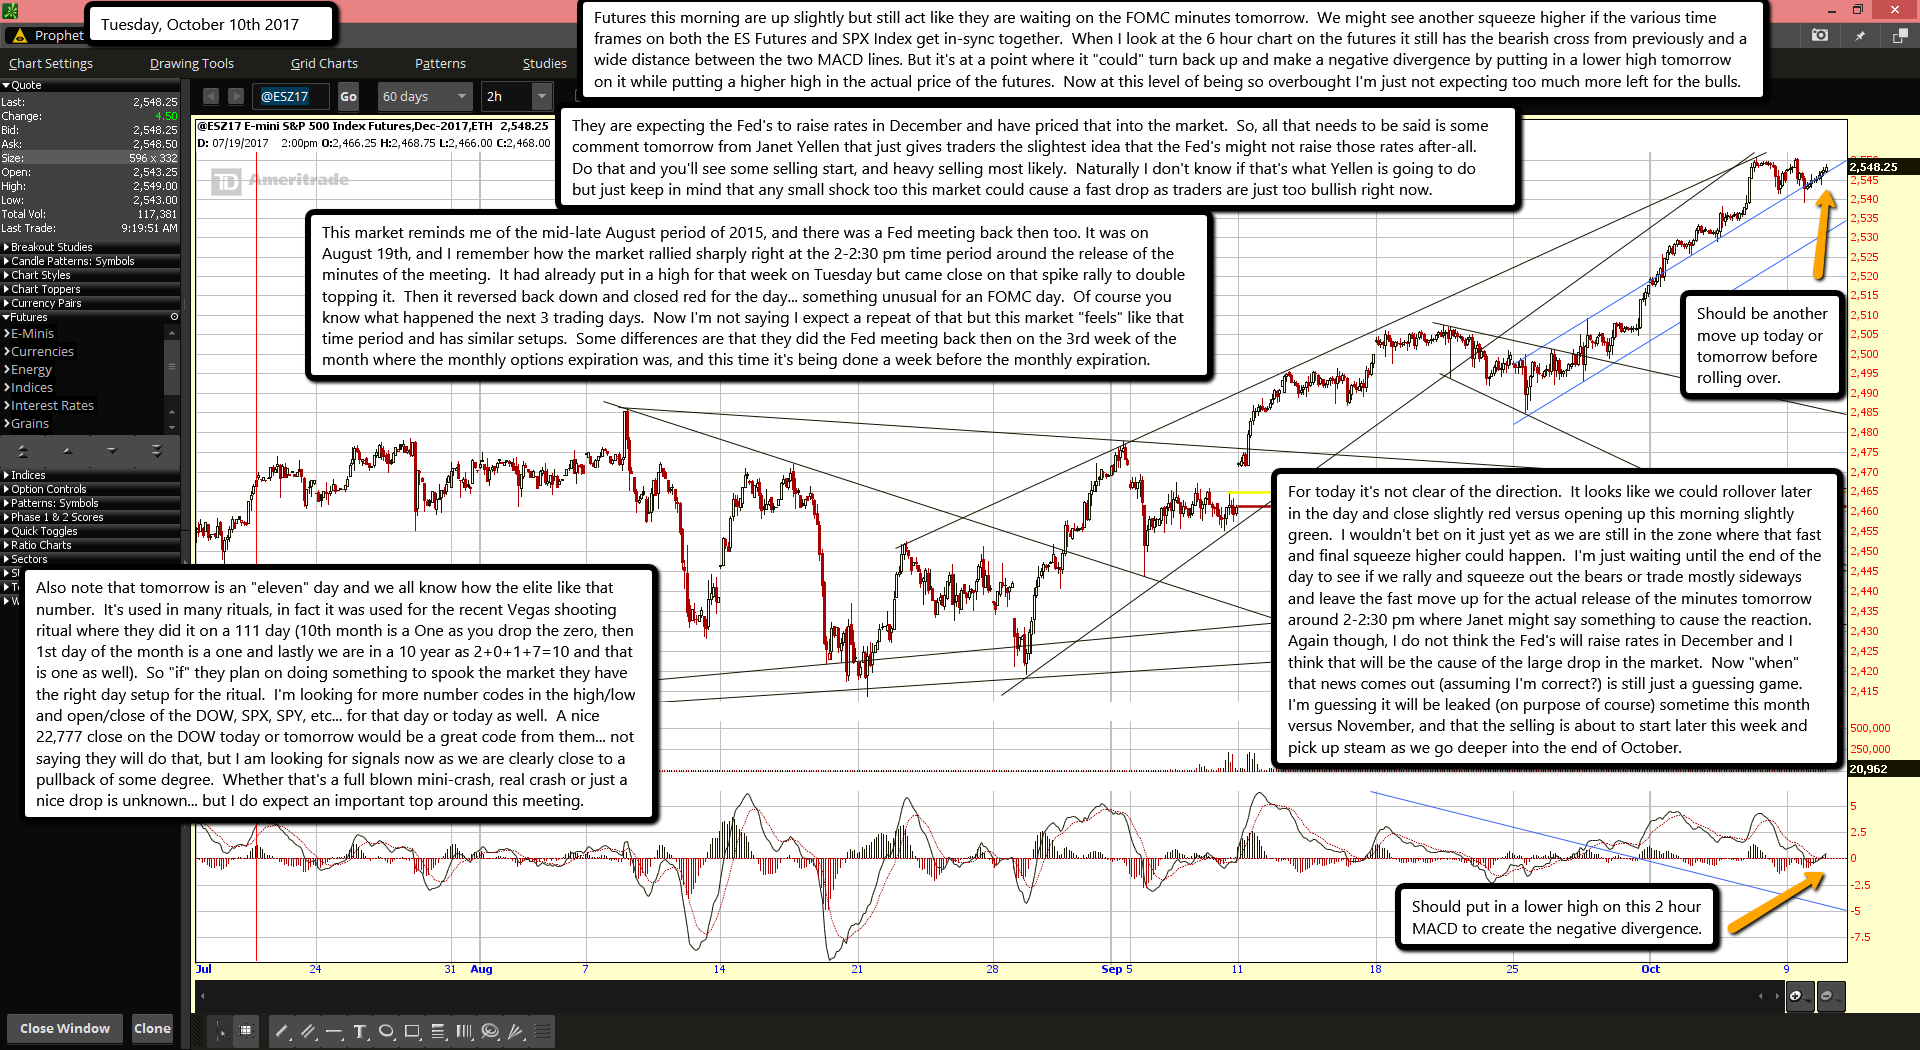
Futures this morning are up slightly but still act like they are waiting on the FOMC minutes tomorrow.  We might see another squeeze higher if the various time frames on both the ES Futures and SPX Index get in-sync together.  When I look at the 6 hour chart on the futures it still has the bearish cross from previously and a wide distance between the two MACD lines. But it's at a point where it "could" turn back up and make a negative divergence by putting in a lower high tomorrow on it while putting a higher high in the actual price of the futures.  Now at this level of being so overbought I'm just not expecting too much more left for the bulls.

They are expecting the Fed's to raise rates in December and have priced that into the market.  So, all that needs to be said is some comment tomorrow from Janet Yellen that just gives traders the slightest idea that the Fed's might not raise those rates after-all.  Do that and you'll see some selling start, and heavy selling most likely.  Naturally I don't know if that's what Yellen is going to do but just keep in mind that any small shock too this market could cause a fast drop as traders are just too bullish right now.

This market reminds me of the mid-late August period of 2015, and there was a Fed meeting back then too. It was on August 19th, and I remember how the market rallied sharply right at the 2-2:30 pm time period around the release of the minutes of the meeting.  It had already put in a high for that week on Tuesday but came close on that spike rally to double topping it.  Then it reversed back down and closed red for the day... something unusual for an FOMC day.  Of course you know what happened the next 3 trading days.  Now I'm not saying I expect a repeat of that but this market "feels" like that time period and has similar setups.  Some differences are that they did the Fed meeting back then on the 3rd week of the month where the monthly options expiration was, and this time it's being done a week before the monthly expiration.

Also note that tomorrow is an "eleven" day and we all know how the elite like that number.  It's used in many rituals, in fact it was used for the recent Vegas shooting ritual where they did it on a 111 day (10th month is a One as you drop the zero, then 1st day of the month is a one and lastly we are in a 10 year as 2+0+1+7=10 and that is one as well).  So "if" they plan on doing something to spook the market they have the right day setup for the ritual.  I'm looking for more number codes in the high/low and open/close of the DOW, SPX, SPY, etc... for that day or today as well.  A nice 22,777 close on the DOW today or tomorrow would be a great code from them... not saying they will do that, but I am looking for signals now as we are clearly close to a pullback of some degree.  Whether that's a full blown mini-crash, real crash or just a nice drop is unknown... but I do expect an important top around this meeting.

For today it's not clear of the direction.  It looks like we could rollover later in the day and close slightly red versus opening up this morning slightly green.  I wouldn't bet on it just yet as we are still in the zone where that fast and final squeeze higher could happen.  I'm just waiting until the end of the day to see if we rally and squeeze out the bears or trade mostly sideways and leave the fast move up for the actual release of the minutes tomorrow around 2-2:30 pm where Janet might say something to cause the reaction.  Again though, I do not think the Fed's will raise rates in December and I think that will be the cause of the large drop in the market.  Now "when" that news comes out (assuming I'm correct?) is still just a guessing game.  I'm guessing it will be leaked (on purpose of course) sometime this month versus November, and that the selling is about to start later this week and pick up steam as we go deeper into the end of October.

ES Morning Update October 9th 2017

0

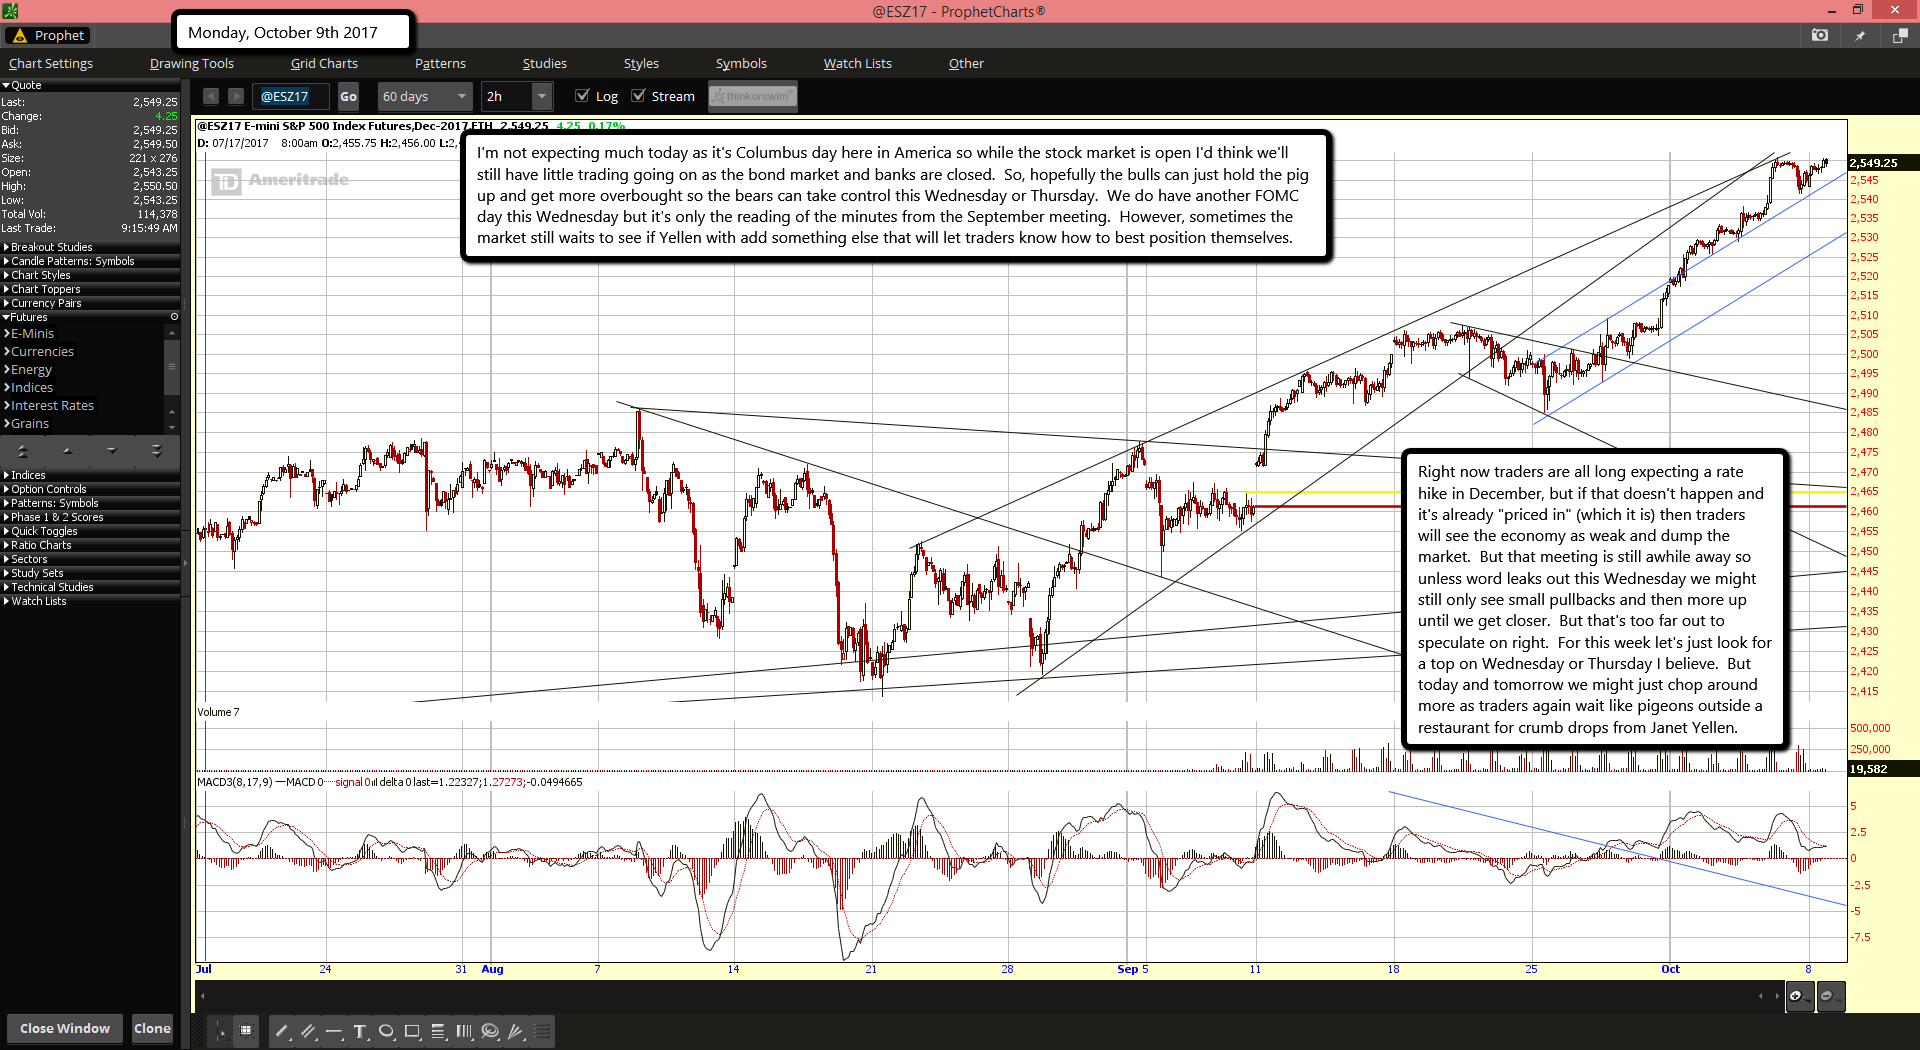
I'm not expecting much today as it's Columbus day here in America so while the stock market is open I'd think we'll still have little trading going on as the bond market and banks are closed.  So, hopefully the bulls can just hold the pig up and get more overbought so the bears can take control this Wednesday or Thursday.  We do have another FOMC day this Wednesday but it's only the reading of the minutes from the September meeting.  However, sometimes the market still waits to see if Yellen with add something else that will let traders know how to best position themselves.

Right now traders are all long expecting a rate hike in December, but if that doesn't happen and it's already "priced in" (which it is) then traders will see the economy as weak and dump the market.  But that meeting is still awhile away so unless word leaks out this Wednesday we might still only see small pullbacks and then more up until we get closer.  But that's too far out to speculate on right.  For this week let's just look for a top on Wednesday or Thursday I believe.  But today and tomorrow we might just chop around more as traders again wait like pigeons outside a restaurant for crumb drops from Janet Yellen.

ES Morning Update October 6th 2017

0

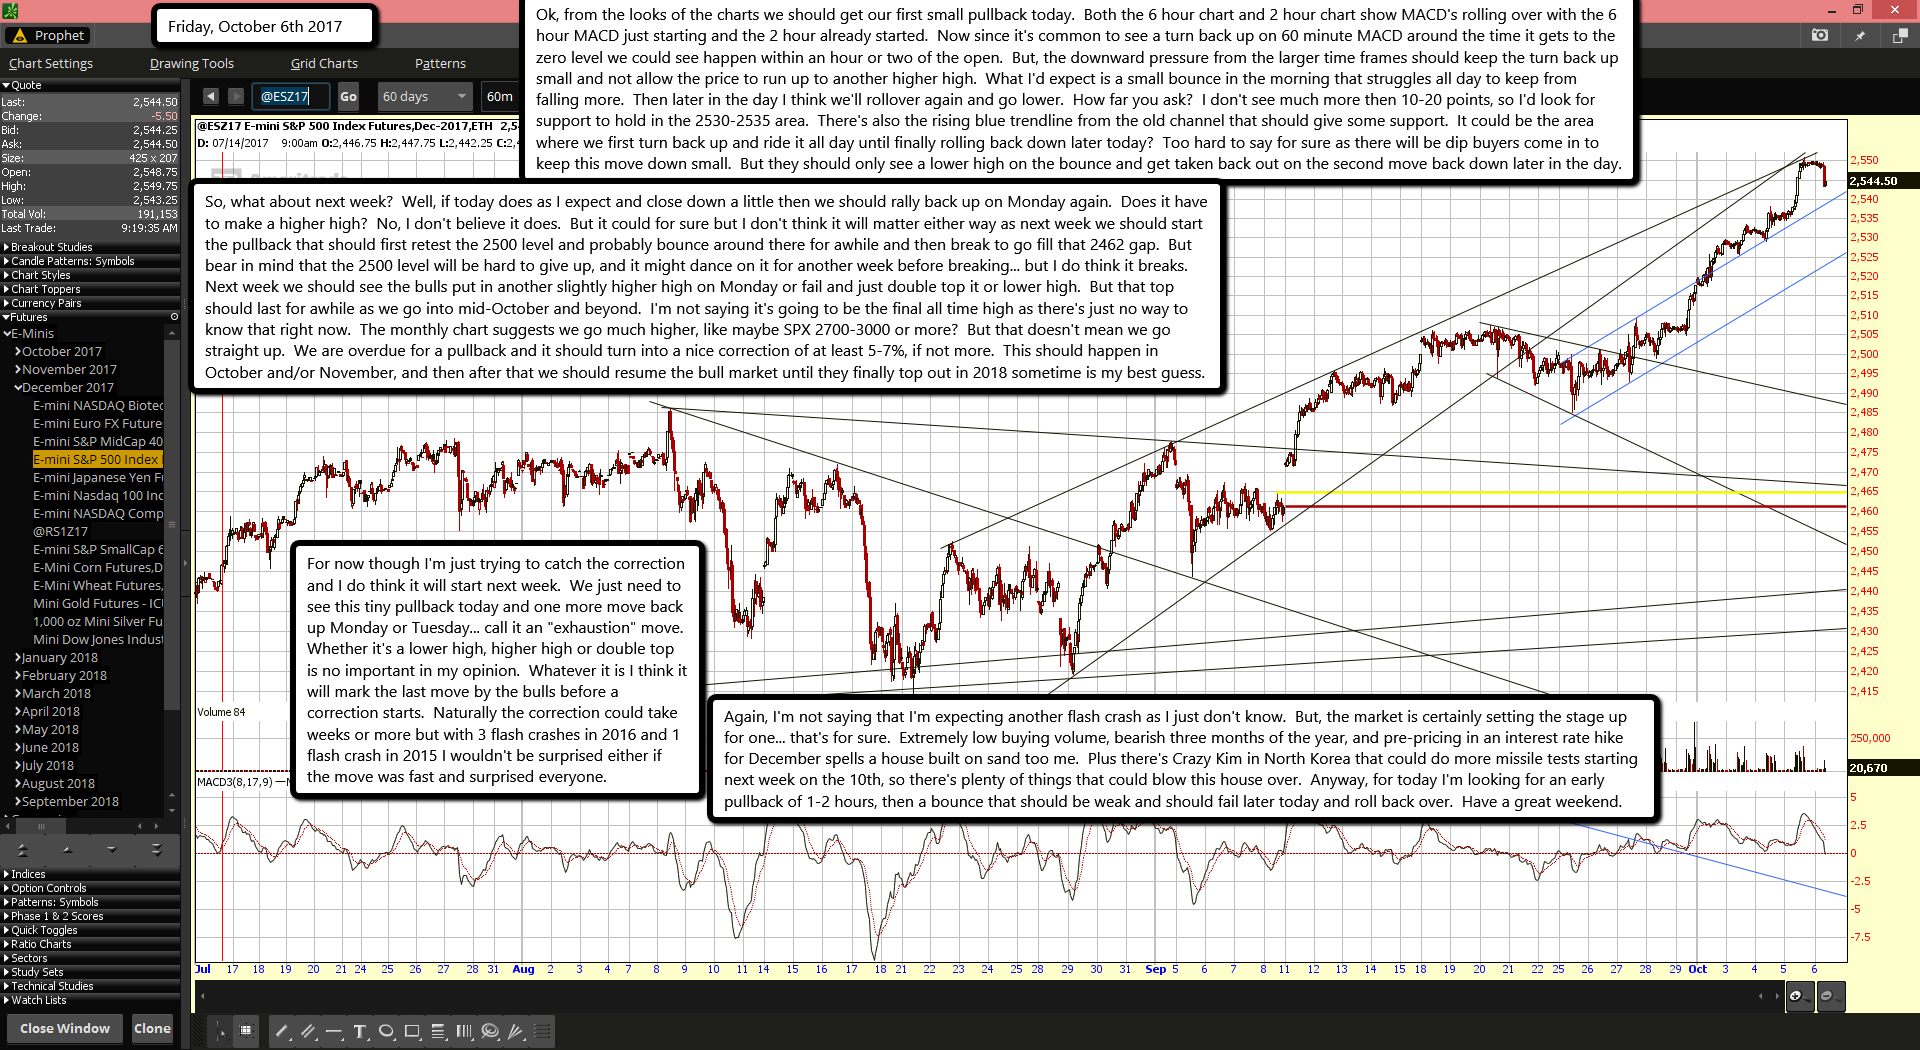
Ok, from the looks of the charts we should get our first small pullback today.  Both the 6 hour chart and 2 hour chart show MACD's rolling over with the 6 hour MACD just starting and the 2 hour already started.  Now since it's common to see a turn back up on 60 minute MACD around the time it gets to the zero level we could see happen within an hour or two of the open.  But, the downward pressure from the larger time frames should keep the turn back up small and not allow the price to run up to another higher high.  What I'd expect is a small bounce in the morning that struggles all day to keep from falling more.  Then later in the day I think we'll rollover again and go lower.  How far you ask?  I don't see much more then 10-20 points, so I'd look for support to hold in the 2530-2535 area.  There's also the rising blue trendline from the old channel that should give some support.  It could be the area where we first turn back up and ride it all day until finally rolling back down later today?  Too hard to say for sure as there will be dip buyers come in to keep this move down small.  But they should only see a lower high on the bounce and get taken back out on the second move back down later in the day.

So, what about next week?  Well, if today does as I expect and close down a little then we should rally back up on Monday again.  Does it have to make a higher high?  No, I don't believe it does.  But it could for sure but I don't think it will matter either way as next week we should start the pullback that should first retest the 2500 level and probably bounce around there for awhile and then break to go fill that 2462 gap.  But bear in mind that the 2500 level will be hard to give up, and it might dance on it for another week before breaking... but I do think it breaks.  Next week we should see the bulls put in another slightly higher high on Monday or fail and just double top it or lower high.  But that top should last for awhile as we go into mid-October and beyond.  I'm not saying it's going to be the final all time high as there's just no way to know that right now.  The monthly chart suggests we go much higher, like maybe SPX 2700-3000 or more?  But that doesn't mean we go straight up.  We are overdue for a pullback and it should turn into a nice correction of at least 5-7%, if not more.  This should happen in October and/or November, and then after that we should resume the bull market until they finally top out in 2018 sometime is my best guess.

For now though I'm just trying to catch the correction and I do think it will start next week.  We just need to see this tiny pullback today and one more move back up Monday or Tuesday... call it an "exhaustion" move.  Whether it's a lower high, higher high or double top is no important in my opinion.  Whatever it is I think it will mark the last move by the bulls before a correction starts.  Naturally the correction could take weeks or more but with 3 flash crashes in 2016 and 1 flash crash in 2015 I wouldn't be surprised either if the move was fast and surprised everyone.

Again, I'm not saying that I'm expecting another flash crash as I just don't know.  But, the market is certainly setting the stage up for one... that's for sure.  Extremely low buying volume, bearish three months of the year, and pre-pricing in an interest rate hike for December spells a house built on sand too me.  Plus there's Crazy Kim in North Korea that could do more missile tests starting next week on the 10th, so there's plenty of things that could blow this house over.  Anyway, for today I'm looking for an early pullback of 1-2 hours, then a bounce that should be weak and should fail later today and roll back over.  Have a great weekend.

ES Morning Update October 5th 2017

0

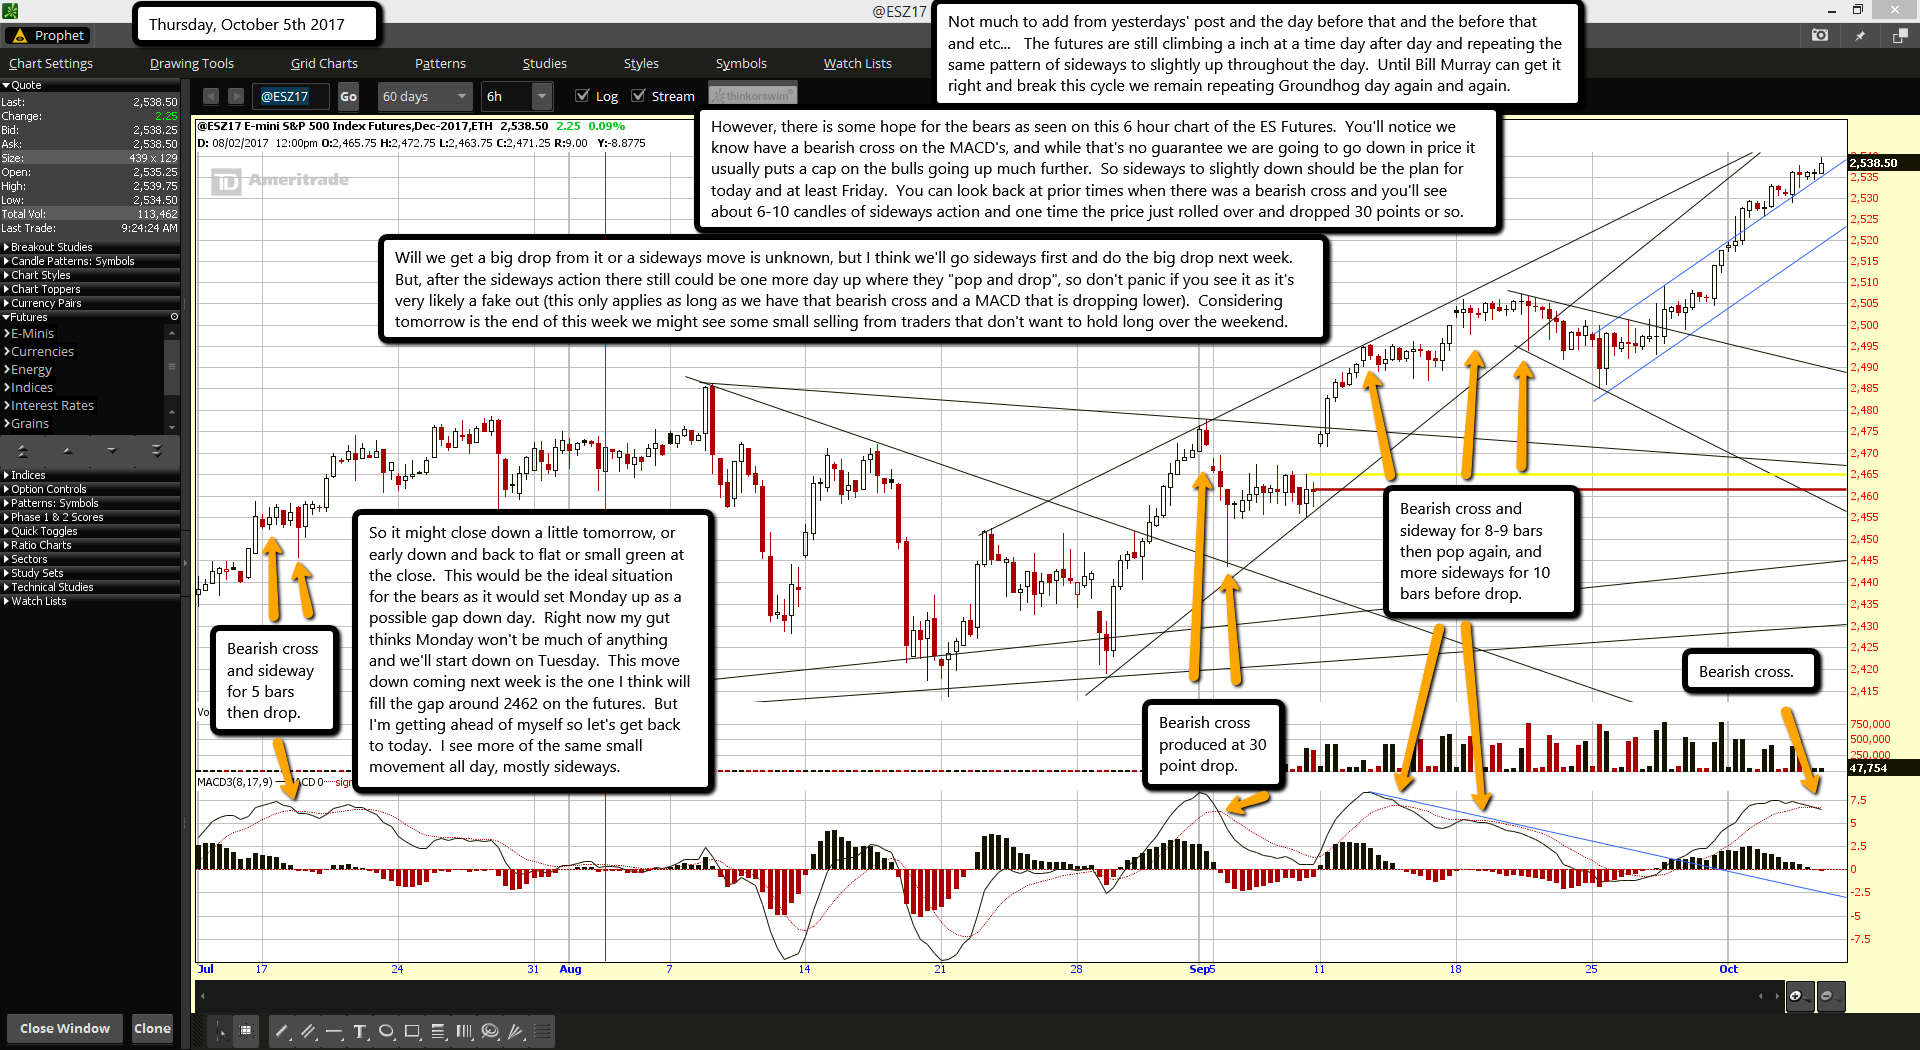
Not much to add from yesterdays' post and the day before that and the before that and etc...   The futures are still climbing a inch at a time day after day and repeating the same pattern of sideways to slightly up throughout the day.  Until Bill Murray can get it right and break this cycle we remain repeating Groundhog day again and again.

However, there is some hope for the bears as seen on this 6 hour chart of the ES Futures.  You'll notice we know have a bearish cross on the MACD's, and while that's no guarantee we are going to go down in price it usually puts a cap on the bulls going up much further.  So sideways to slightly down should be the plan for today and at least Friday.  You can look back at prior times when there was a bearish cross and you'll see about 6-10 candles of sideways action and one time the price just rolled over and dropped 30 points or so.

Will we get a big drop from it or a sideways move is unknown, but I think we'll go sideways first and do the big drop next week.  But, after the sideways action there still could be one more day up where they "pop and drop", so don't panic if you see it as it's very likely a fake out (this only applies as long as we have that bearish cross and a MACD that is dropping lower).  Considering tomorrow is the end of this week we might see some small selling from traders that don't want to hold long over the weekend.

So it might close down a little tomorrow, or early down and back to flat or small green at the close.  This would be the ideal situation for the bears as it would set Monday up as a possible gap down day.  Right now my gut thinks Monday won't be much of anything and we'll start down on Tuesday.  This move down coming next week is the one I think will fill the gap around 2462 on the futures.  But I'm getting ahead of myself so let's get back to today.  I see more of the same small movement all day, mostly sideways.

ES Morning Update October 4th 2017

0

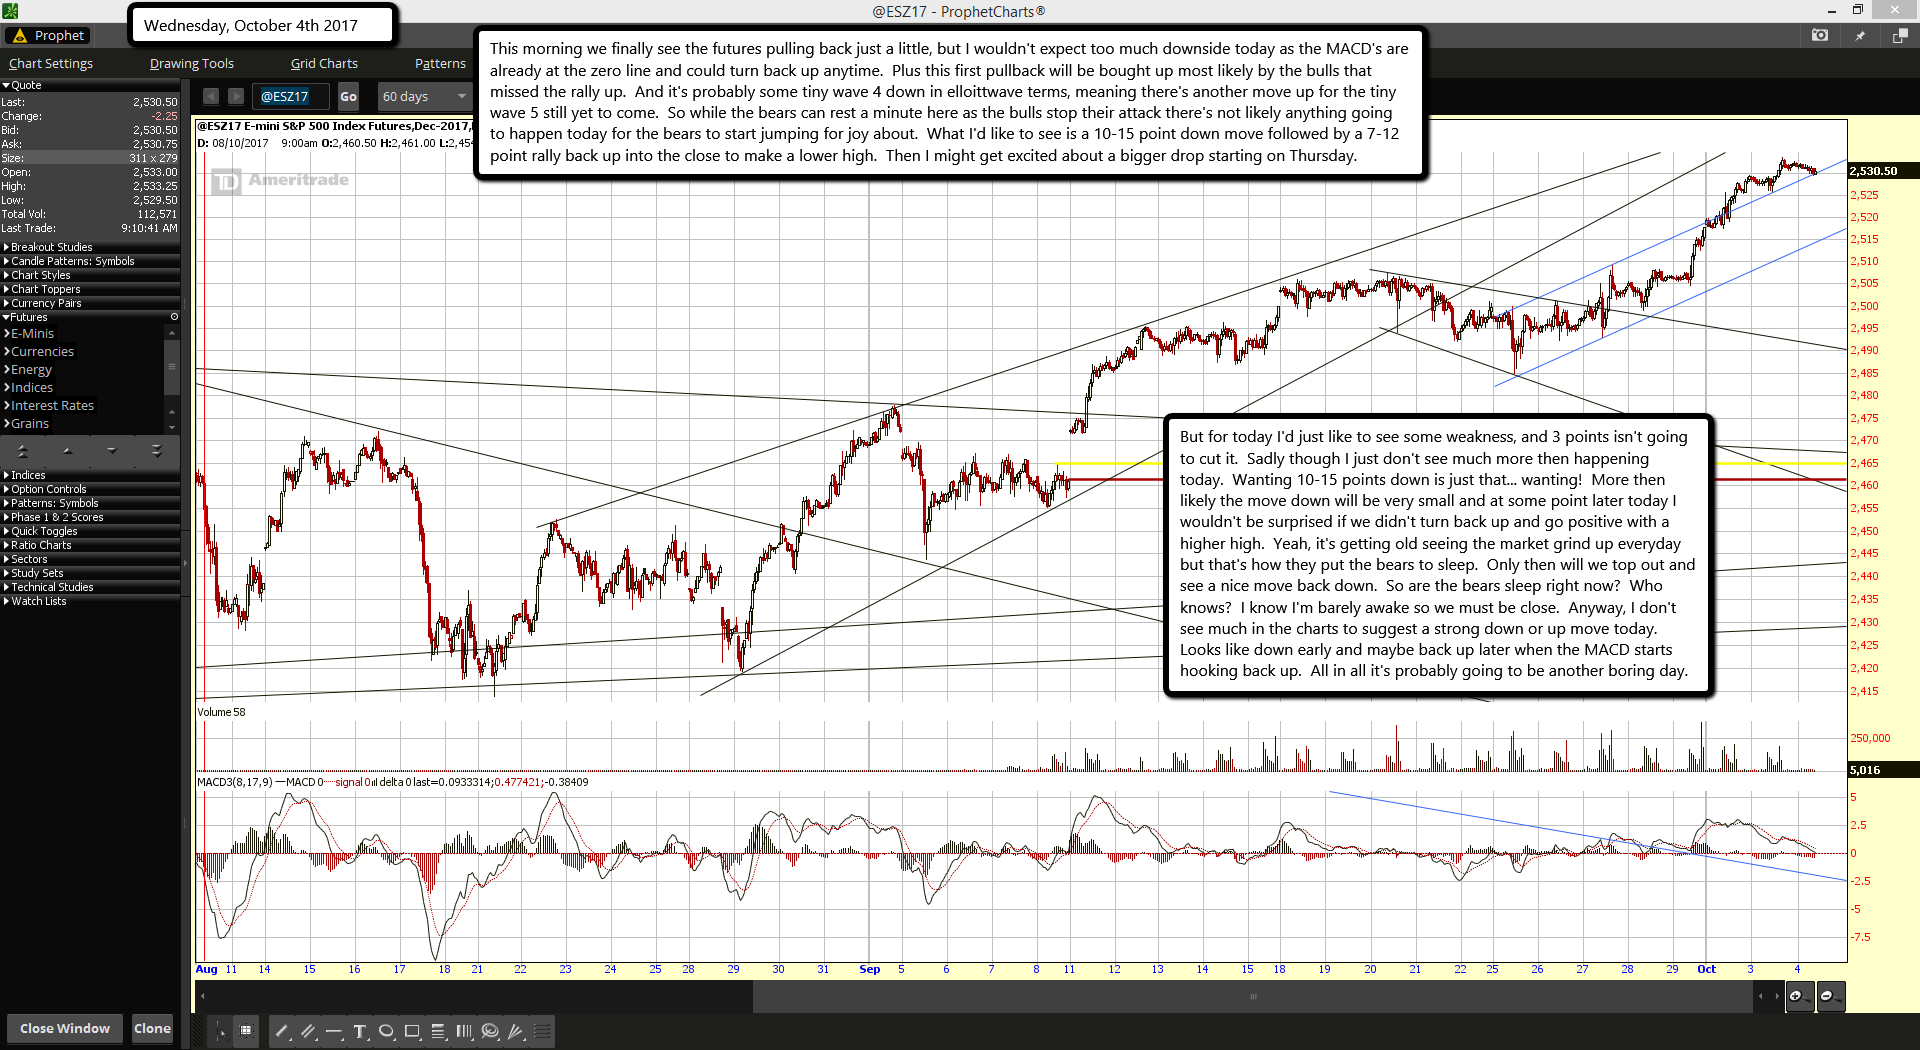
This morning we finally see the futures pulling back just a little, but I wouldn't expect too much downside today as the MACD's are already at the zero line and could turn back up anytime.  Plus this first pullback will be bought up most likely by the bulls that missed the rally up.  And it's probably some tiny wave 4 down in elloittwave terms, meaning there's another move up for the tiny wave 5 still yet to come.  So while the bears can rest a minute here as the bulls stop their attack there's not likely anything going to happen today for the bears to start jumping for joy about.  What I'd like to see is a 10-15 point down move followed by a 7-12 point rally back up into the close to make a lower high.  Then I might get excited about a bigger drop starting on Thursday.

But for today I'd just like to see some weakness, and 3 points isn't going to cut it.  Sadly though I just don't see much more then happening today.  Wanting 10-15 points down is just that... wanting!  More then likely the move down will be very small and at some point later today I wouldn't be surprised if we didn't turn back up and go positive with a higher high.  Yeah, it's getting old seeing the market grind up everyday but that's how they put the bears to sleep.  Only then will we top out and see a nice move back down.  So are the bears sleep right now?  Who knows?  I know I'm barely awake so we must be close.  Anyway, I don't see much in the charts to suggest a strong down or up move today.  Looks like down early and maybe back up later when the MACD starts hooking back up.  All in all it's probably going to be another boring day.

ES Morning Update October 3rd 2017

0

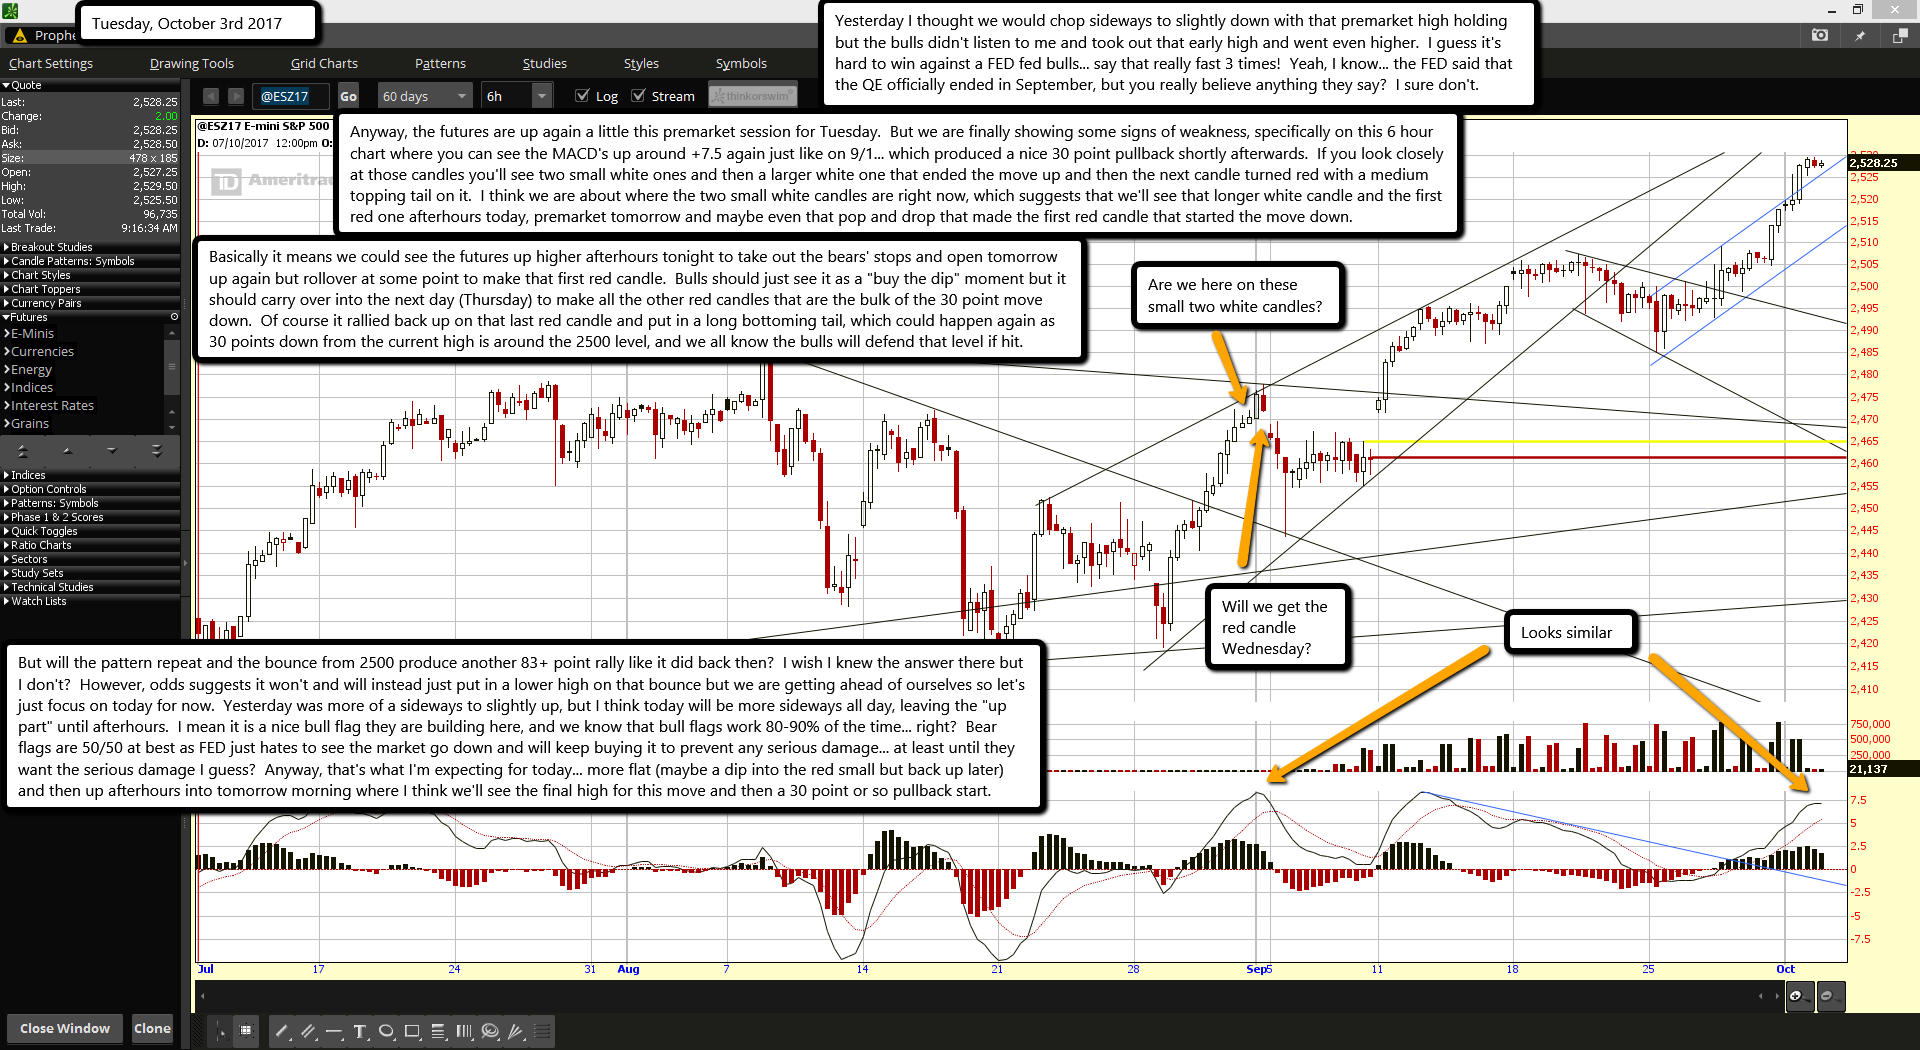
Yesterday I thought we would chop sideways to slightly down with that premarket high holding but the bulls didn't listen to me and took out that early high and went even higher.  I guess it's hard to win against a FED fed bulls... say that really fast 3 times!  Yeah, I know... the FED said that the QE officially ended in September, but you really believe anything they say?  I sure don't.

Anyway, the futures are up again a little this premarket session for Tuesday.  But we are finally showing some signs of weakness, specifically on this 6 hour chart where you can see the MACD's up around +7.5 again just like on 9/1... which produced a nice 30 point pullback shortly afterwards.  If you look closely at those candles you'll see two small white ones and then a larger white one that ended the move up and then the next candle turned red with a medium topping tail on it.  I think we are about where the two small white candles are right now, which suggests that we'll see that longer white candle and the first red one afterhours today, premarket tomorrow and maybe even that pop and drop that made the first red candle that started the move down.

Basically it means we could see the futures up higher afterhours tonight to take out the bears' stops and open tomorrow up again but rollover at some point to make that first red candle.  Bulls should just see it as a "buy the dip" moment but it should carry over into the next day (Thursday) to make all the other red candles that are the bulk of the 30 point move down.  Of course it rallied back up on that last red candle and put in a long bottoming tail, which could happen again as 30 points down from the current high is around the 2500 level, and we all know the bulls will defend that level if hit.

But will the pattern repeat and the bounce from 2500 produce another 83+ point rally like it did back then?  I wish I knew the answer there but I don't?  However, odds suggests it won't and will instead just put in a lower high on that bounce but we are getting ahead of ourselves so let's just focus on today for now.  Yesterday was more of a sideways to slightly up, but I think today will be more sideways all day, leaving the "up part" until afterhours.  I mean it is a nice bull flag they are building here, and we know that bull flags work 80-90% of the time... right?  Bear flags are 50/50 at best as FED just hates to see the market go down and will keep buying it to prevent any serious damage... at least until they want the serious damage I guess?  Anyway, that's what I'm expecting for today... more flat (maybe a dip into the red small but back up later) and then up afterhours into tomorrow morning where I think we'll see the final high for this move and then a 30 point or so pullback start.

ES Morning Update October 2nd 2017

0

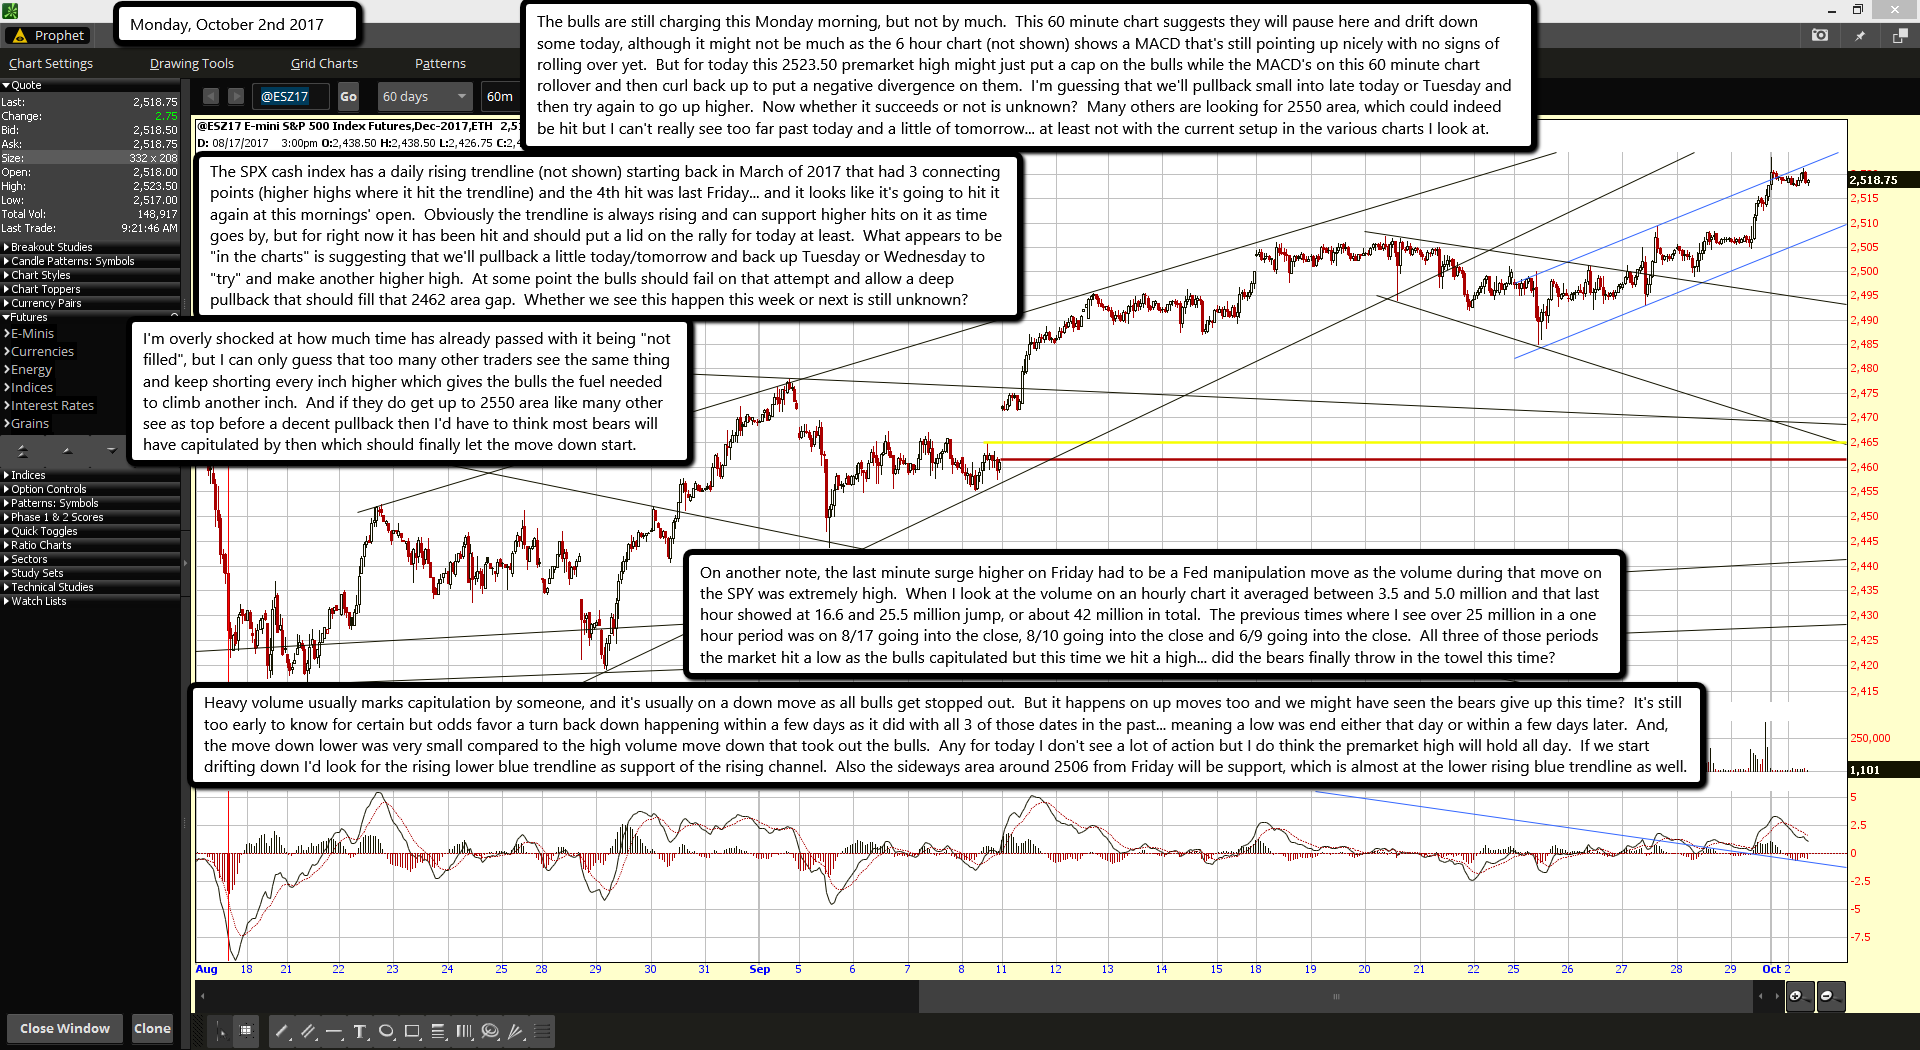
The bulls are still charging this Monday morning, but not by much.  This 60 minute chart suggests they will pause here and drift down some today, although it might not be much as the 6 hour chart (not shown) shows a MACD that's still pointing up nicely with no signs of rolling over yet.  But for today this 2523.50 premarket high might just put a cap on the bulls while the MACD's on this 60 minute chart rollover and then curl back up to put a negative divergence on them.  I'm guessing that we'll pullback small into late today or Tuesday and then try again to go up higher.  Now whether it succeeds or not is unknown?  Many others are looking for 2550 area, which could indeed be hit but I can't really see too far past today and a little of tomorrow... at least not with the current setup in the various charts I look at.

The SPX cash index has a daily rising trendline (not shown) starting back in March of 2017 that had 3 connecting points (higher highs where it hit the trendline) and the 4th hit was last Friday... and it looks like it's going to hit it again at this mornings' open.  Obviously the trendline is always rising and can support higher hits on it as time goes by, but for right now it has been hit and should put a lid on the rally for today at least.  What appears to be "in the charts" is suggesting that we'll pullback a little today/tomorrow and back up Tuesday or Wednesday to "try" and make another higher high.  At some point the bulls should fail on that attempt and allow a deep pullback that should fill that 2462 area gap.  Whether we see this happen this week or next is still unknown?

I'm overly shocked at how much time has already passed with it being "not filled", but I can only guess that too many other traders see the same thing and keep shorting every inch higher which gives the bulls the fuel needed to climb another inch.  And if they do get up to 2550 area like many other see as top before a decent pullback then I'd have to think most bears will have capitulated by then which should finally let the move down start.

On another note, the last minute surge higher on Friday had to be a Fed manipulation move as the volume during that move on the SPY was extremely high.  When I look at the volume on an hourly chart it averaged between 3.5 and 5.0 million and that last hour showed at 16.6 and 25.5 million jump, or about 42 million in total.  The previous times where I see over 25 million in a one hour period was on 8/17 going into the close, 8/10 going into the close and 6/9 going into the close.  All three of those periods the market hit a low as the bulls capitulated but this time we hit a high... did the bears finally throw in the towel this time?

Heavy volume usually marks capitulation by someone, and it's usually on a down move as all bulls get stopped out.  But it happens on up moves too and we might have seen the bears give up this time?  It's still too early to know for certain but odds favor a turn back down happening within a few days as it did with all 3 of those dates in the past... meaning a low was end either that day or within a few days later.  And, the move down lower was very small compared to the high volume move down that took out the bulls.  Any for today I don't see a lot of action but I do think the premarket high will hold all day.  If we start drifting down I'd look for the rising lower blue trendline as support of the rising channel.  Also the sideways area around 2506 from Friday will be support, which is almost at the lower rising blue trendline as well.

ES Morning Update September 29th 2017

0

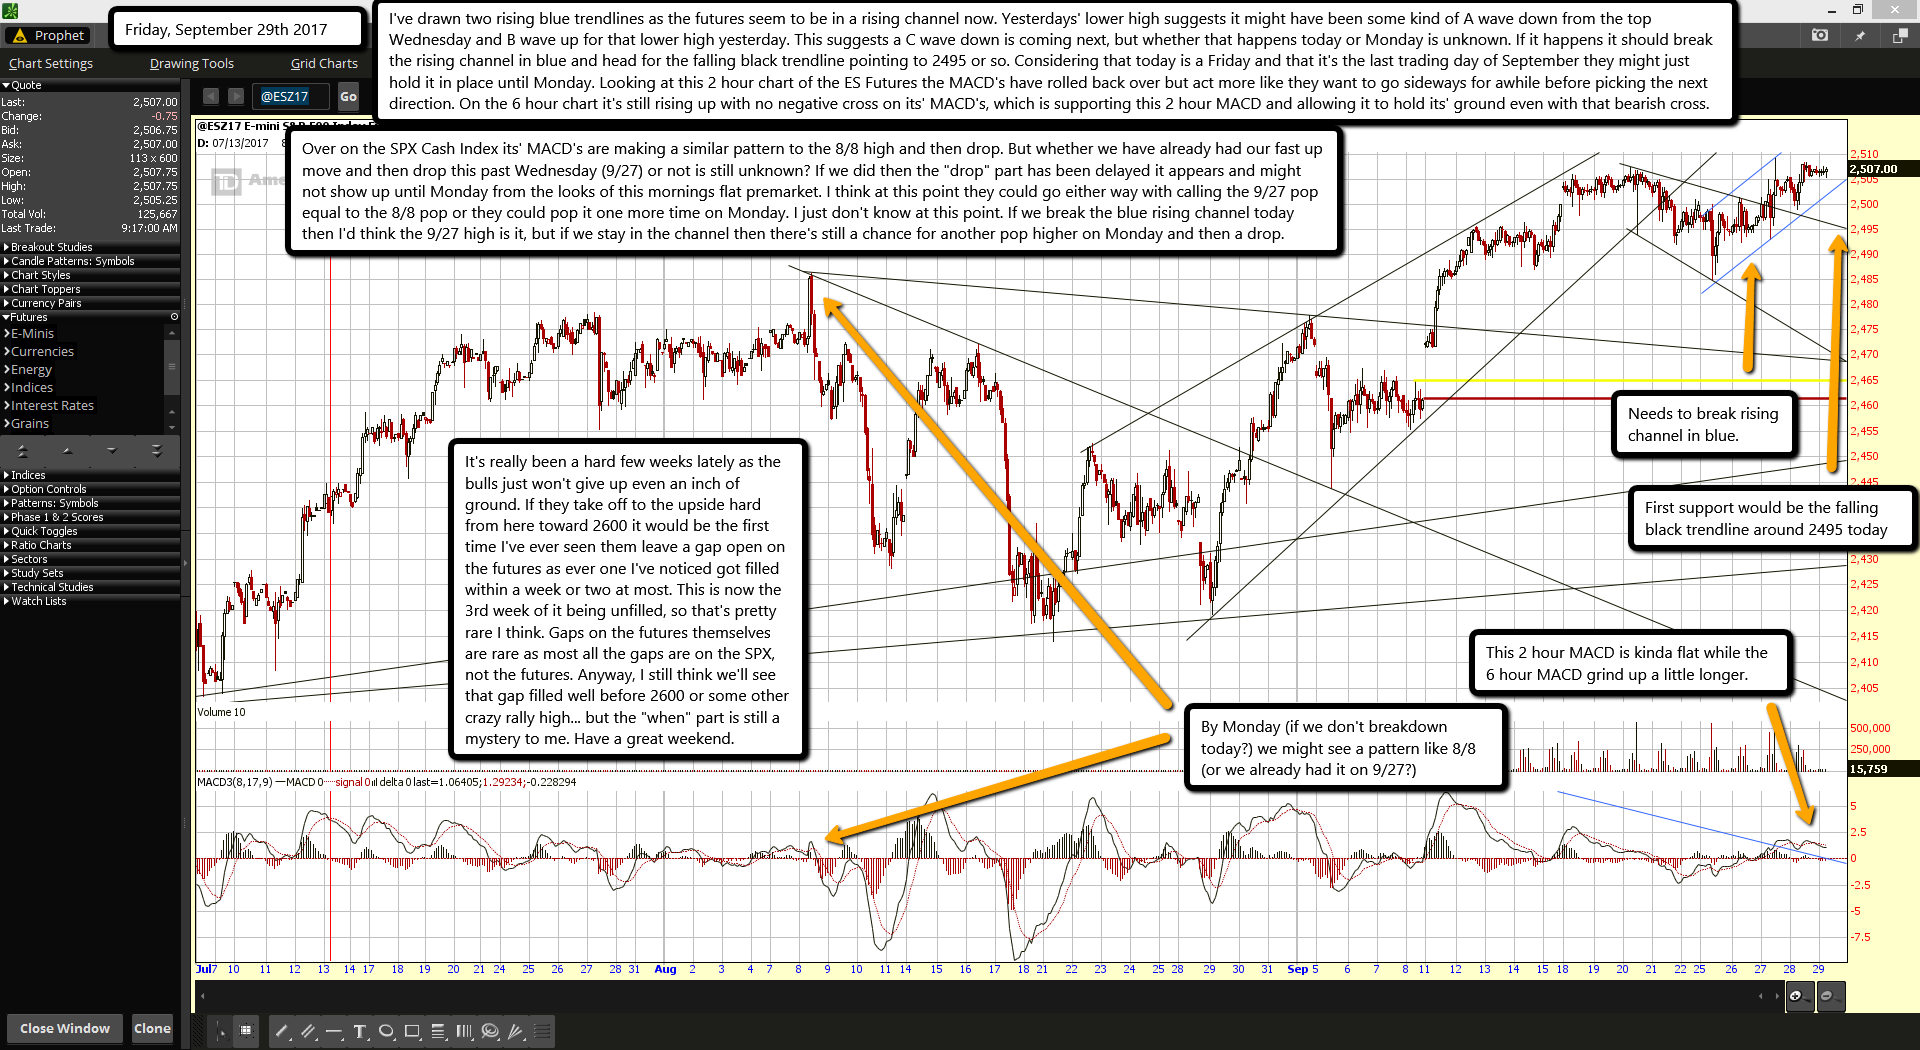
I've drawn two rising blue trendlines as the futures seem to be in a rising channel now. Yesterdays' lower high suggests it might have been some kind of A wave down from the top Wednesday and B wave up for that lower high yesterday. This suggests a C wave down is coming next, but whether that happens today or Monday is unknown. If it happens it should break the rising channel in blue and head for the falling black trendline pointing to 2495 or so. Considering that today is a Friday and that it's the last trading day of September they might just hold it in place until Monday. Looking at this 2 hour chart of the ES Futures the MACD's have rolled back over but act more like they want to go sideways for awhile before picking the next direction. On the 6 hour chart it's still rising up with no negative cross on its' MACD's, which is supporting this 2 hour MACD and allowing it to hold its' ground even with that bearish cross.

Over on the SPX Cash Index its' MACD's are making a similar pattern to the 8/8 high and then drop. But whether we have already had our fast up move and then drop this past Wednesday (9/27) or not is still unknown? If we did then the "drop" part has been delayed it appears and might not show up until Monday from the looks of this mornings flat premarket. I think at this point they could go either way with calling the 9/27 pop equal to the 8/8 pop or they could pop it one more time on Monday. I just don't know at this point. If we break the blue rising channel today then I'd think the 9/27 high is it, but if we stay in the channel then there's still a chance for another pop higher on Monday and then a drop.

It's really been a hard few weeks lately as the bulls just won't give up even an inch of ground. If they take off to the upside hard from here toward 2600 it would be the first time I've ever seen them leave a gap open on the futures as ever one I've noticed got filled within a week or two at most. This is now the 3rd week of it being unfilled, so that's pretty rare I think. Gaps on the futures themselves are rare as most all the gaps are on the SPX, not the futures. Anyway, I still think we'll see that gap filled well before 2600 or some other crazy rally high... but the "when" part is still a mystery to me. Have a great weekend.

ES Morning Update September 28th 2017

0

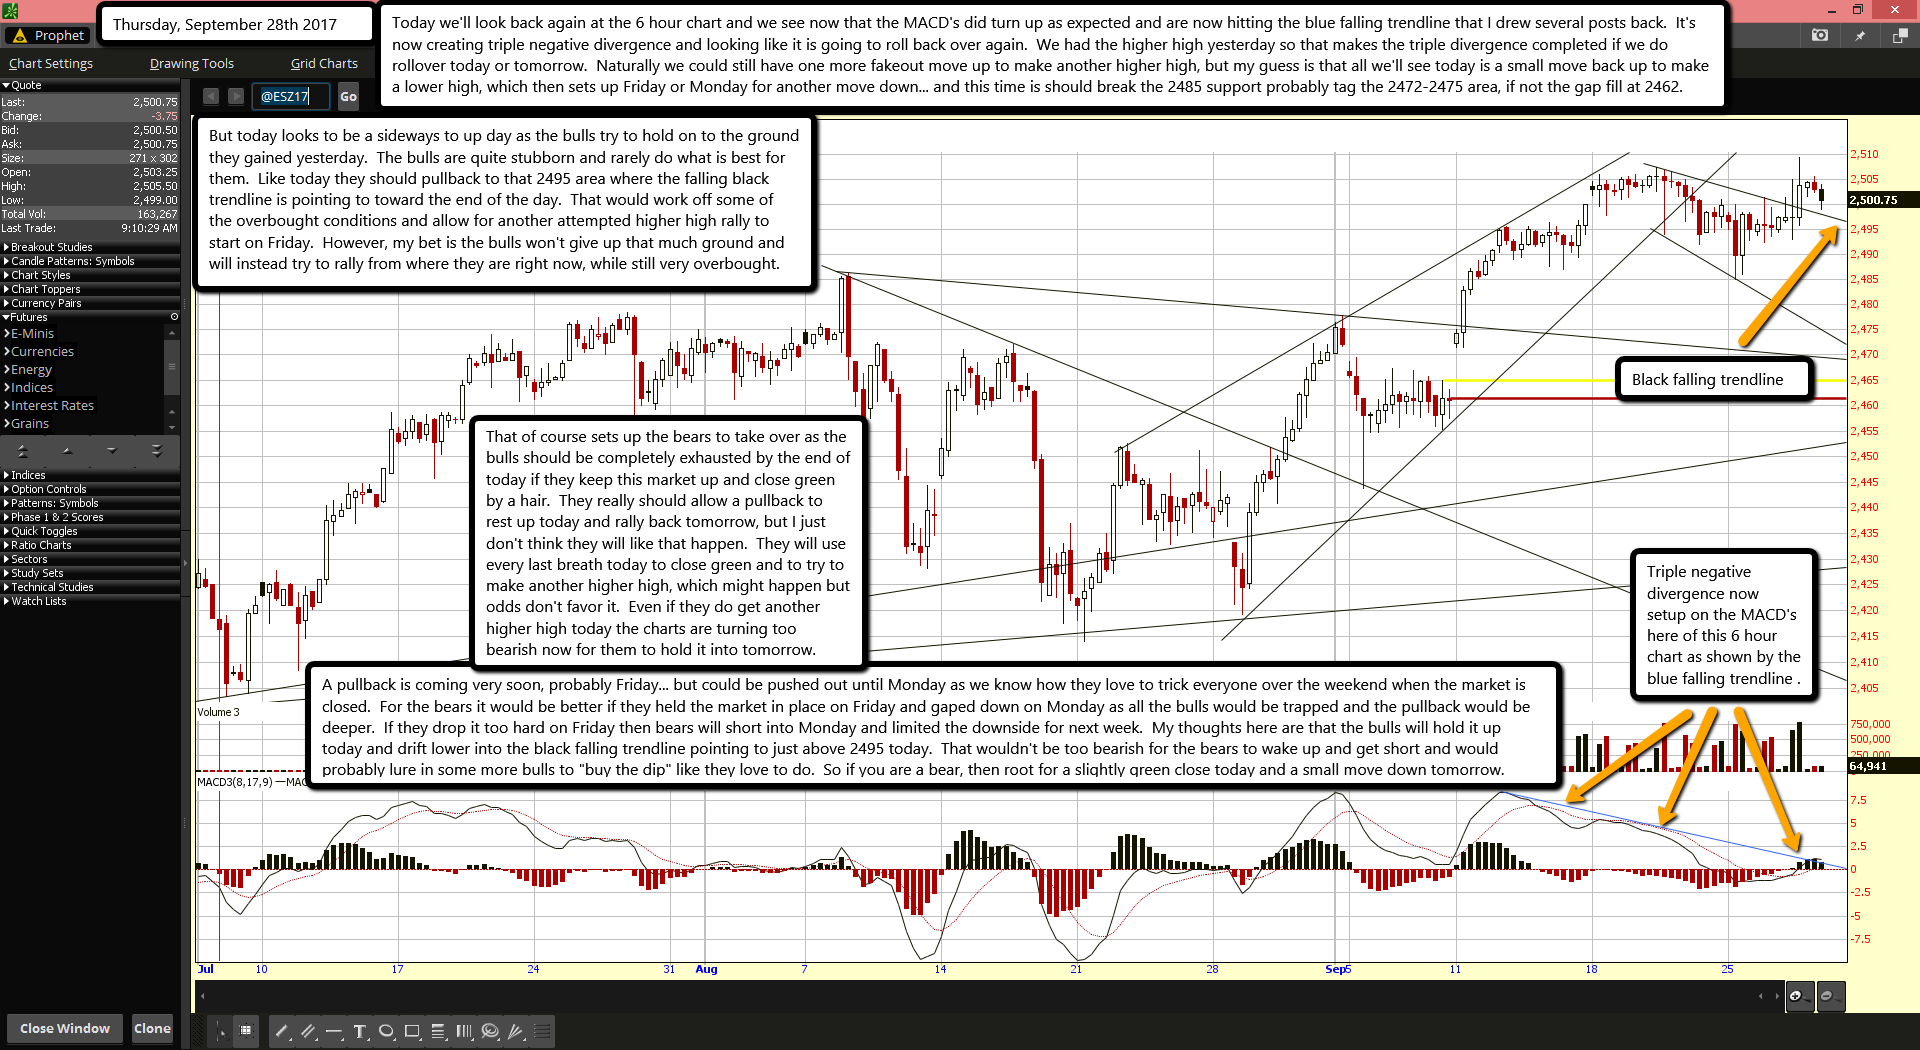
Today we'll look back again at the 6 hour chart and we see now that the MACD's did turn up as expected and are now hitting the blue falling trendline that I drew several posts back.  It's now creating triple negative divergence and looking like it is going to roll back over again.  We had the higher high yesterday so that makes the triple divergence completed if we do rollover today or tomorrow.  Naturally we could still have one more fakeout move up to make another higher high, but my guess is that all we'll see today is a small move back up to make a lower high, which then sets up Friday or Monday for another move down... and this time is should break the 2485 support probably tag the 2472-2475 area, if not the gap fill at 2462.

But today looks to be a sideways to up day as the bulls try to hold on to the ground they gained yesterday.  The bulls are quite stubborn and rarely do what is best for them.  Like today they should pullback to that 2495 area where the falling black trendline is pointing to toward the end of the day.  That would work off some of the overbought conditions and allow for another attempted higher high rally to start on Friday.  However, my bet is the bulls won't give up that much ground and will instead try to rally from where they are right now, while still very overbought.  That of course sets up the bears to take over as the bulls should be completely exhausted by the end of today if they keep this market up and close green by a hair.  They really should allow a pullback to rest up today and rally back tomorrow, but I just don't think they will like that happen.  They will use every last breath today to close green and to try to make another higher high, which might happen but odds don't favor it.  Even if they do get another higher high today the charts are turning too bearish now for them to hold it into tomorrow.

A pullback is coming very soon, probably Friday... but could be pushed out until Monday as we know how they love to trick everyone over the weekend when the market is closed.  For the bears it would be better if they held the market in place on Friday and gaped down on Monday as all the bulls would be trapped and the pullback would be deeper.  If they drop it too hard on Friday then bears will short into Monday and limited the downside for next week.  My thoughts here are that the bulls will hold it up today and drift lower into the black falling trendline pointing to just above 2495 today.  That wouldn't be too bearish for the bears to wake up and get short and would probably lure in some more bulls to "buy the dip" like they love to do.  So if you are a bear, then root for a slightly green close today and a small move down tomorrow.

ES Morning Update September 27th 2017

0

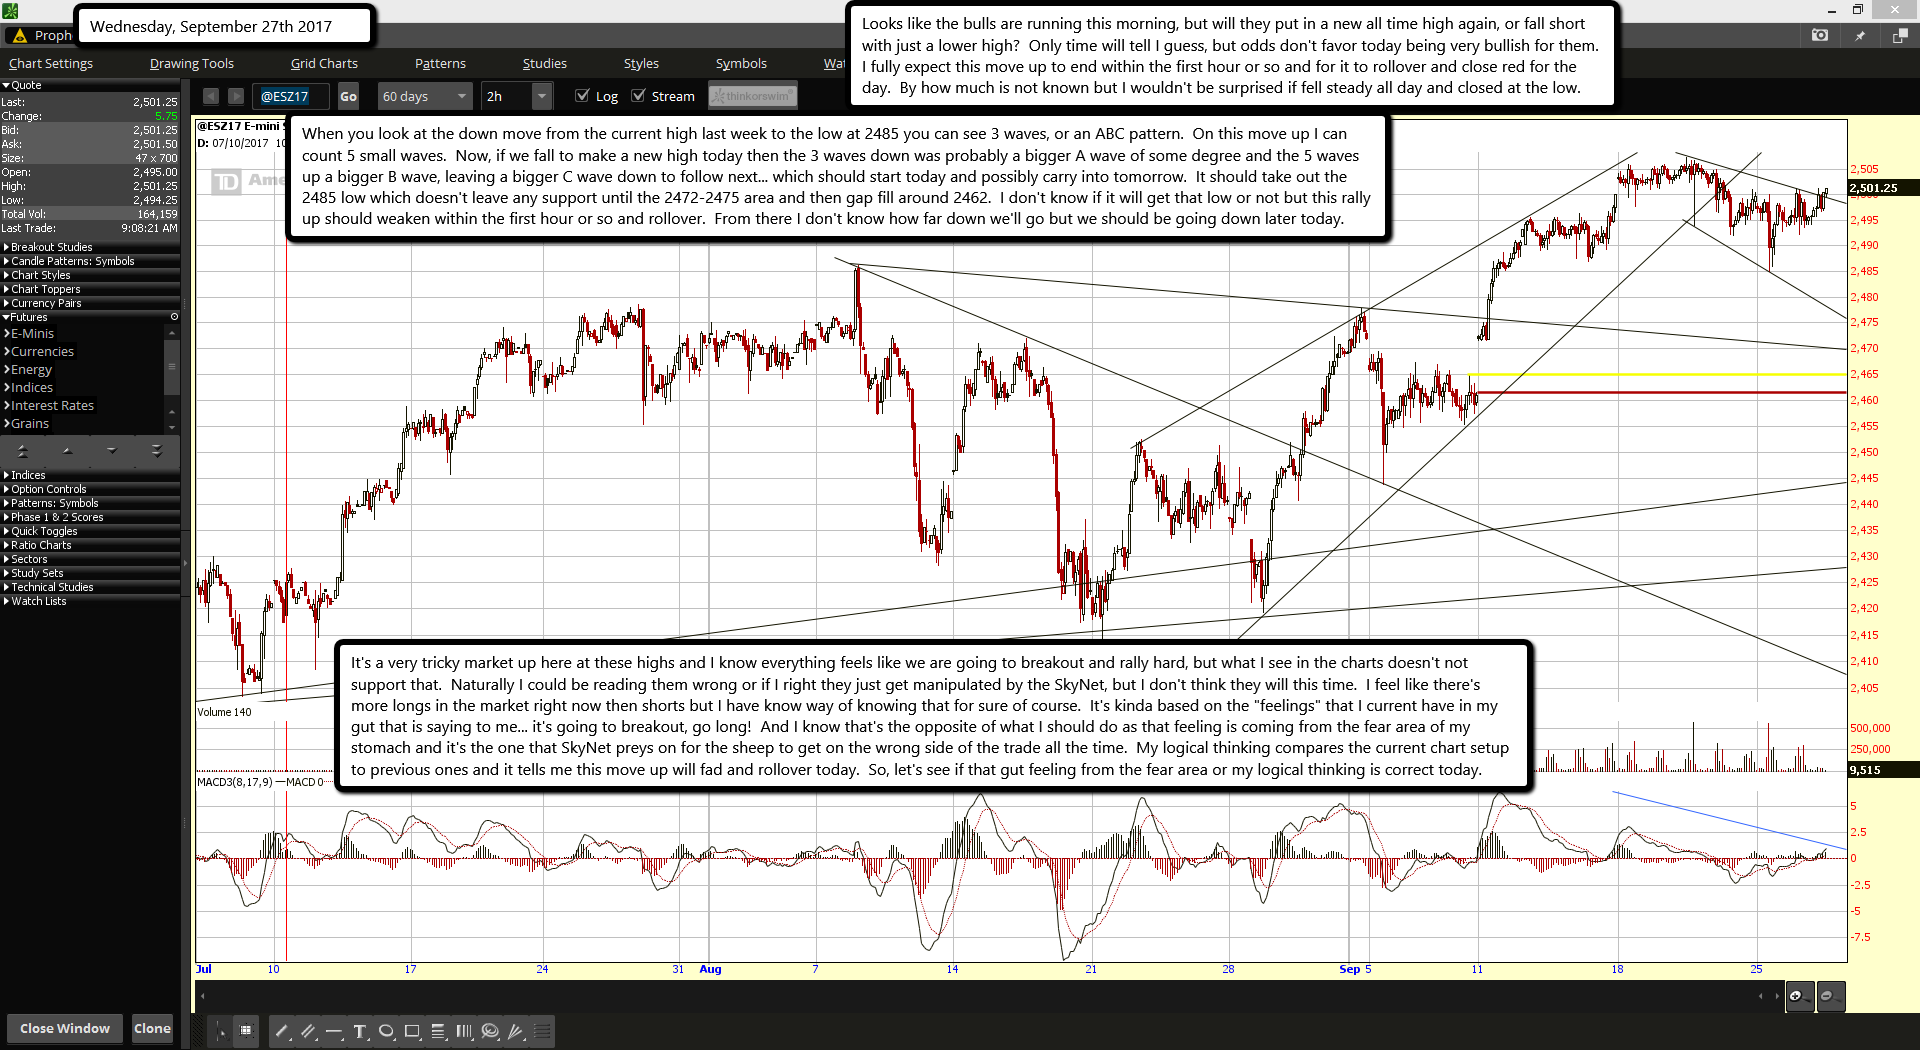
Looks like the bulls are running this morning, but will they put in a new all time high again, or fall short with just a lower high?  Only time will tell I guess, but odds don't favor today being very bullish for them.  I fully expect this move up to end within the first hour or so and for it to rollover and close red for the day.  By how much is not known but I wouldn't be surprised if fell steady all day and closed at the low.

When you look at the down move from the current high last week to the low at 2485 you can see 3 waves, or an ABC pattern.  On this move up I can count 5 small waves.  Now, if we fall to make a new high today then the 3 waves down was probably a bigger A wave of some degree and the 5 waves up a bigger B wave, leaving a bigger C wave down to follow next... which should start today and possibly carry into tomorrow.  It should take out the 2485 low which doesn't leave any support until the 2472-2475 area and then gap fill around 2462.  I don't know if it will get that low or not but this rally up should weaken within the first hour or so and rollover.  From there I don't know how far down we'll go but we should be going down later today.

It's a very tricky market up here at these highs and I know everything feels like we are going to breakout and rally hard, but what I see in the charts doesn't not support that.  Naturally I could be reading them wrong or if I right they just get manipulated by the SkyNet, but I don't think they will this time.  I feel like there's more longs in the market right now then shorts but I have know way of knowing that for sure of course.  It's kinda based on the "feelings" that I current have in my gut that is saying to me... it's going to breakout, go long!  And I know that's the opposite of what I should do as that feeling is coming from the fear area of my stomach and it's the one that SkyNet preys on for the sheep to get on the wrong side of the trade all the time.  My logical thinking compares the current chart setup to previous ones and it tells me this move up will fad and rollover today.  So, let's see if that gut feeling from the fear area or my logical thinking is correct today.

ES Morning Update September 26th 2017

0

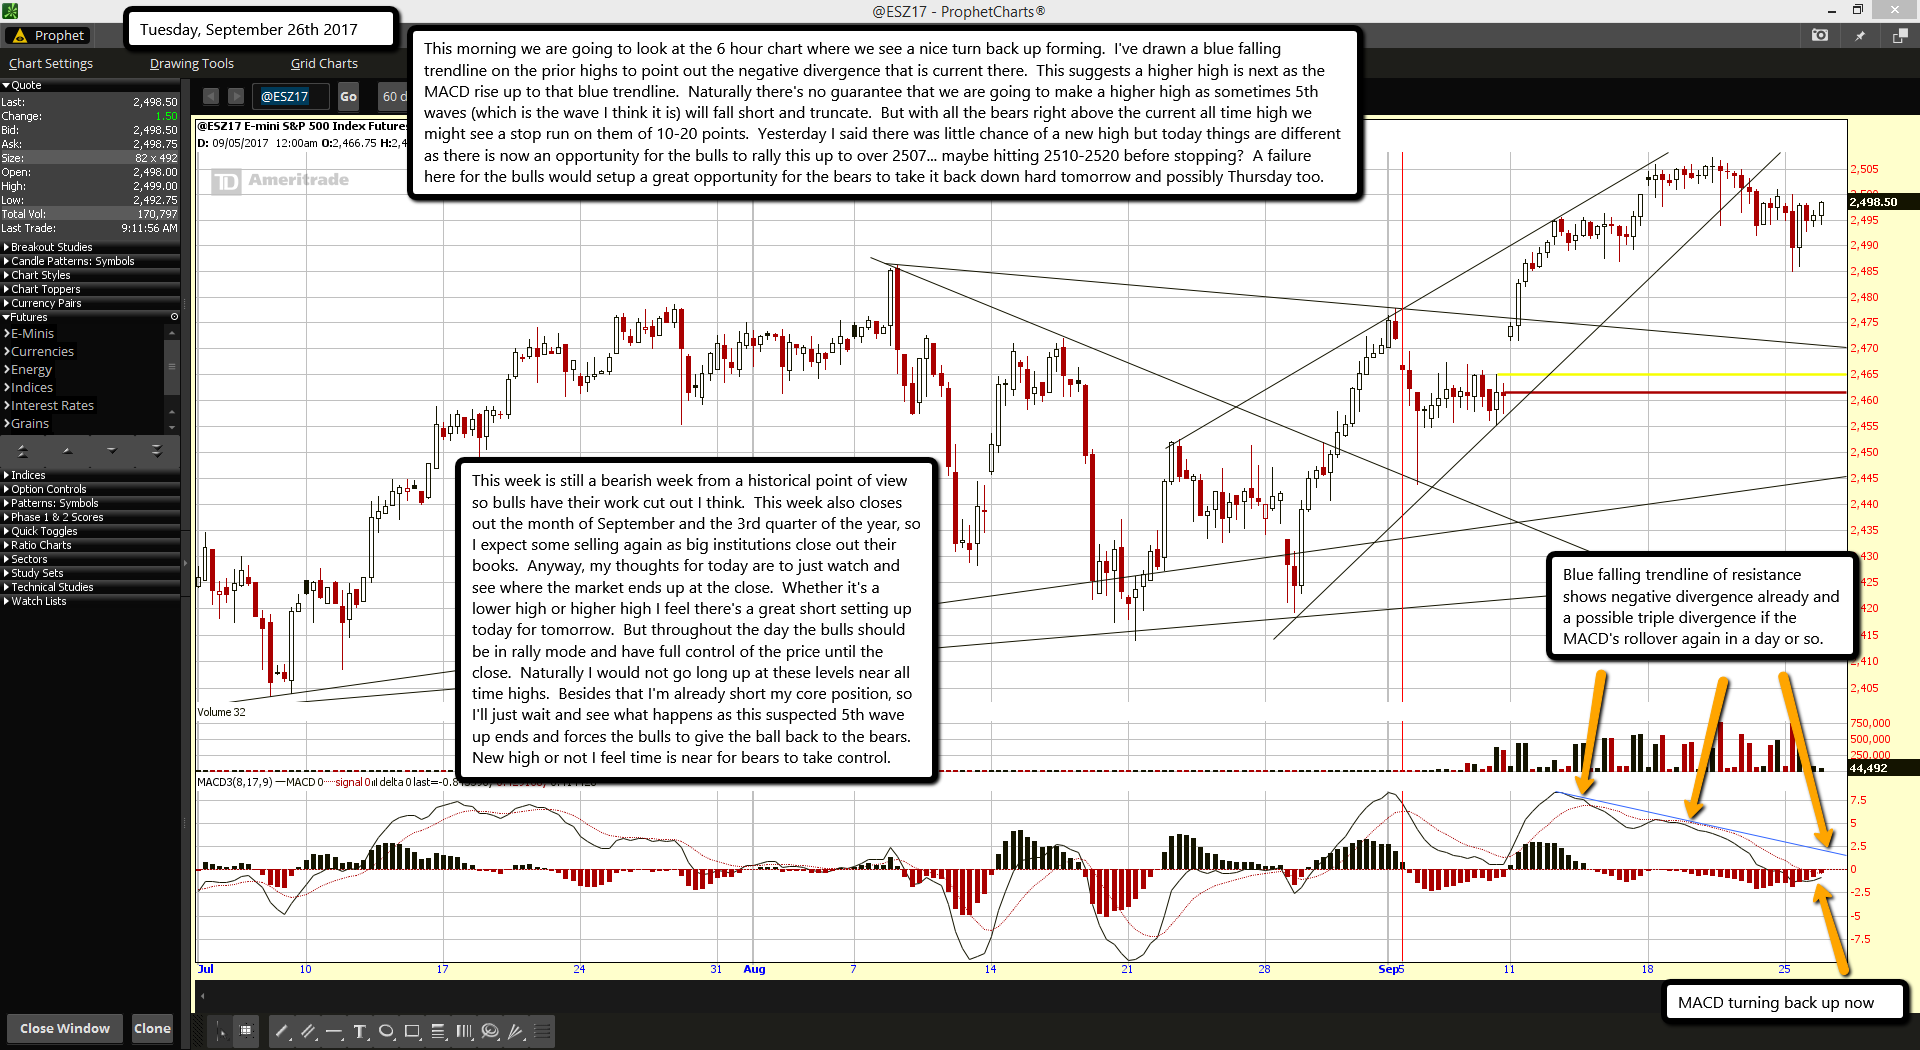
This morning we are going to look at the 6 hour chart where we see a nice turn back up forming.  I've drawn a blue falling trendline on the prior highs to point out the negative divergence that is current there.  This suggests a higher high is next as the MACD rise up to that blue trendline.  Naturally there's no guarantee that we are going to make a higher high as sometimes 5th waves (which is the wave I think it is) will fall short and truncate.  But with all the bears right above the current all time high we might see a stop run on them of 10-20 points.  Yesterday I said there was little chance of a new high but today things are different as there is now an opportunity for the bulls to rally this up to over 2507... maybe hitting 2510-2520 before stopping?  A failure here for the bulls would setup a great opportunity for the bears to take it back down hard tomorrow and possibly Thursday too.

This week is still a bearish week from a historical point of view so bulls have their work cut out I think.  This week also closes out the month of September and the 3rd quarter of the year, so I expect some selling again as big institutions close out their books.  Anyway, my thoughts for today are to just watch and see where the market ends up at the close.  Whether it's a lower high or higher high I feel there's a great short setting up today for tomorrow.  But throughout the day the bulls should be in rally mode and have full control of the price until the close.  Naturally I would not go long up at these levels near all time highs.  Besides that I'm already short my core position, so I'll just wait and see what happens as this suspected 5th wave up ends and forces the bulls to give the ball back to the bears.  New high or not I feel time is near for bears to take control.

ES Morning Update September 25th 2017

0

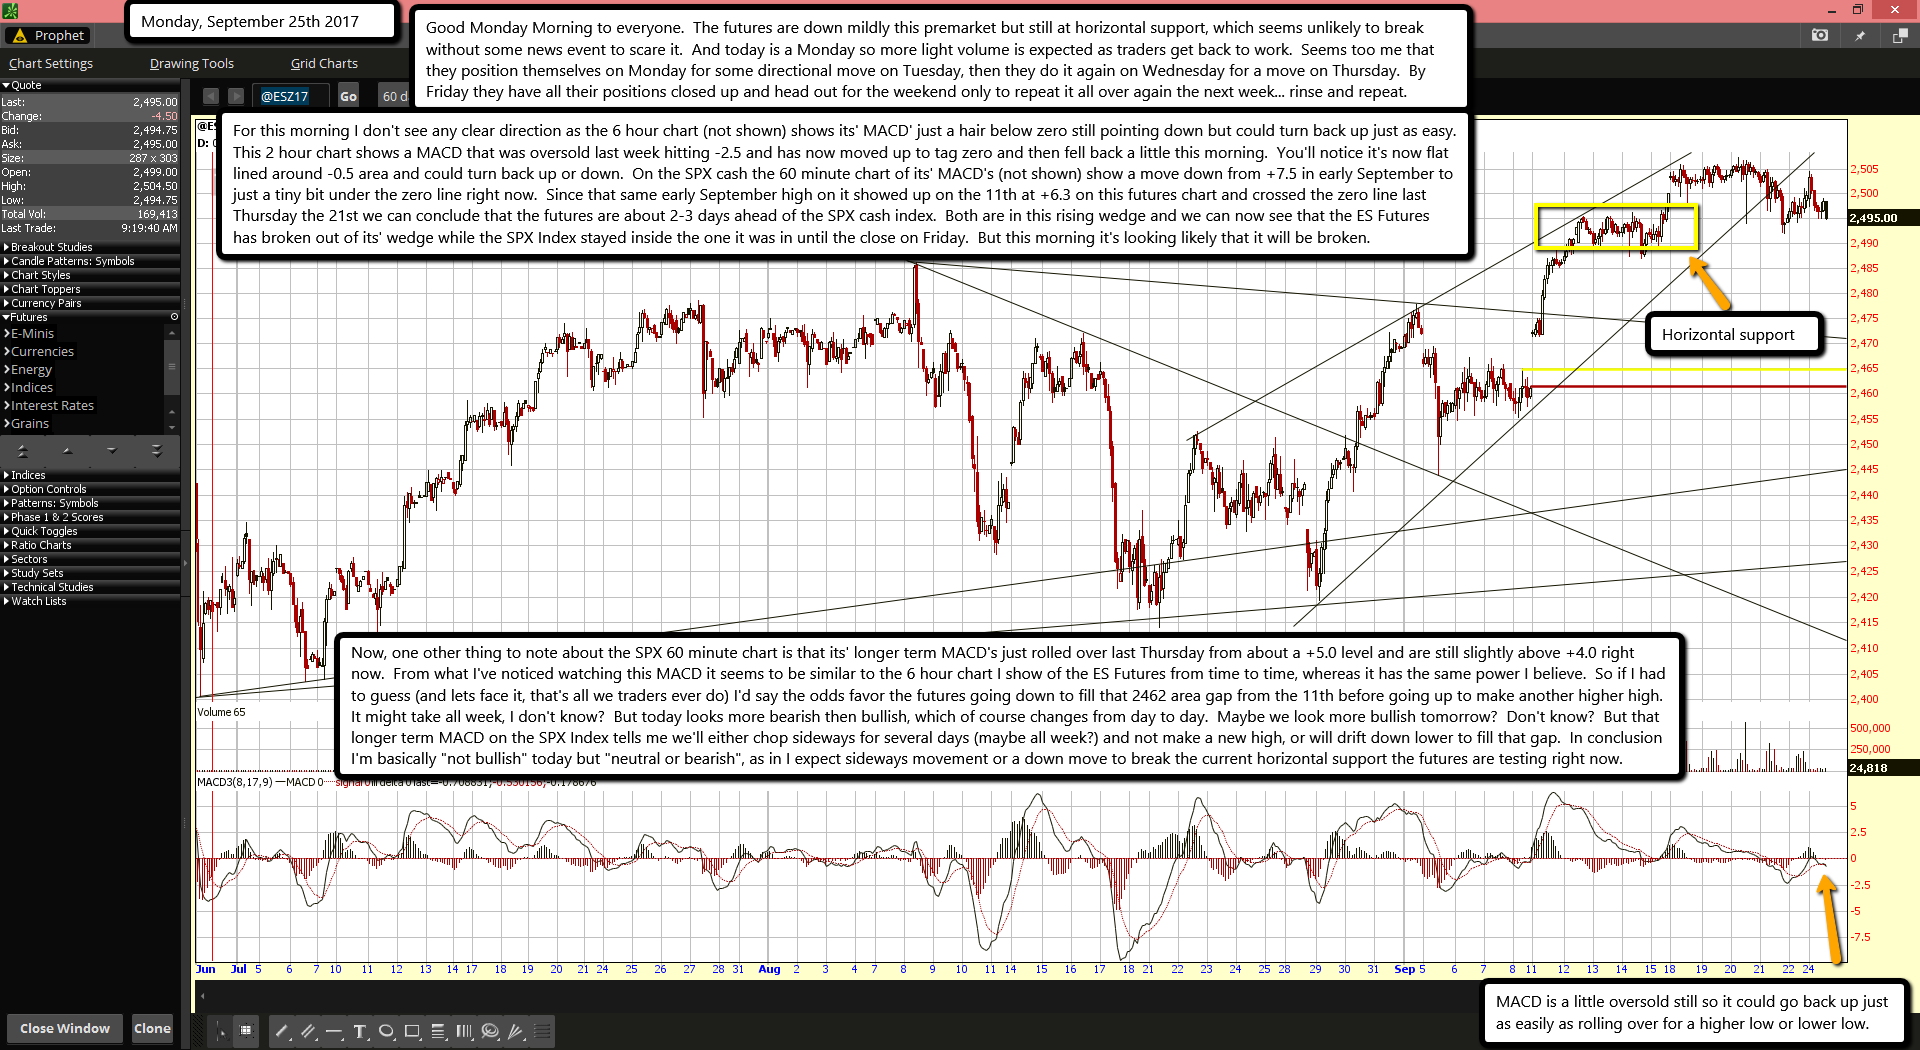
Good Monday Morning to everyone.  The futures are down mildly this premarket but still at horizontal support, which seems unlikely to break without some news event to scare it.  And today is a Monday so more light volume is expected as traders get back to work.  Seems too me that they position themselves on Monday for some directional move on Tuesday, then they do it again on Wednesday for a move on Thursday.  By Friday they have all their positions closed up and head out for the weekend only to repeat it all over again the next week... rinse and repeat.

For this morning I don't see any clear direction as the 6 hour chart (not shown) shows its' MACD' just a hair below zero still pointing down but could turn back up just as easy.  This 2 hour chart shows a MACD that was oversold last week hitting -2.5 and has now moved up to tag zero and then fell back a little this morning.  You'll notice it's now flat lined around -0.5 area and could turn back up or down.  On the SPX cash the 60 minute chart of its' MACD's (not shown) show a move down from +7.5 in early September to just a tiny bit under the zero line right now.  Since that same early September high on it showed up on the 11th at +6.3 on this futures chart and crossed the zero line last Thursday the 21st we can conclude that the futures are about 2-3 days ahead of the SPX cash index.  Both are in this rising wedge and we can now see that the ES Futures has broken out of its' wedge while the SPX Index stayed inside the one it was in until the close on Friday.  But this morning it's looking likely that it will be broken.

Now, one other thing to note about the SPX 60 minute chart is that its' longer term MACD's just rolled over last Thursday from about a +5.0 level and are still slightly above +4.0 right now.  From what I've noticed watching this MACD it seems to be similar to the 6 hour chart I show of the ES Futures from time to time, whereas it has the same power I believe.  So if I had to guess (and lets face it, that's all we traders ever do) I'd say the odds favor the futures going down to fill that 2462 area gap from the 11th before going up to make another higher high.  It might take all week, I don't know?  But today looks more bearish then bullish, which of course changes from day to day.  Maybe we look more bullish tomorrow?  Don't know?  But that longer term MACD on the SPX Index tells me we'll either chop sideways for several days (maybe all week?) and not make a new high, or will drift down lower to fill that gap.  In conclusion I'm basically "not bullish" today but "neutral or bearish", as in I expect sideways movement or a down move to break the current horizontal support the futures are testing right now.

ES Morning Update September 22nd 2017

0

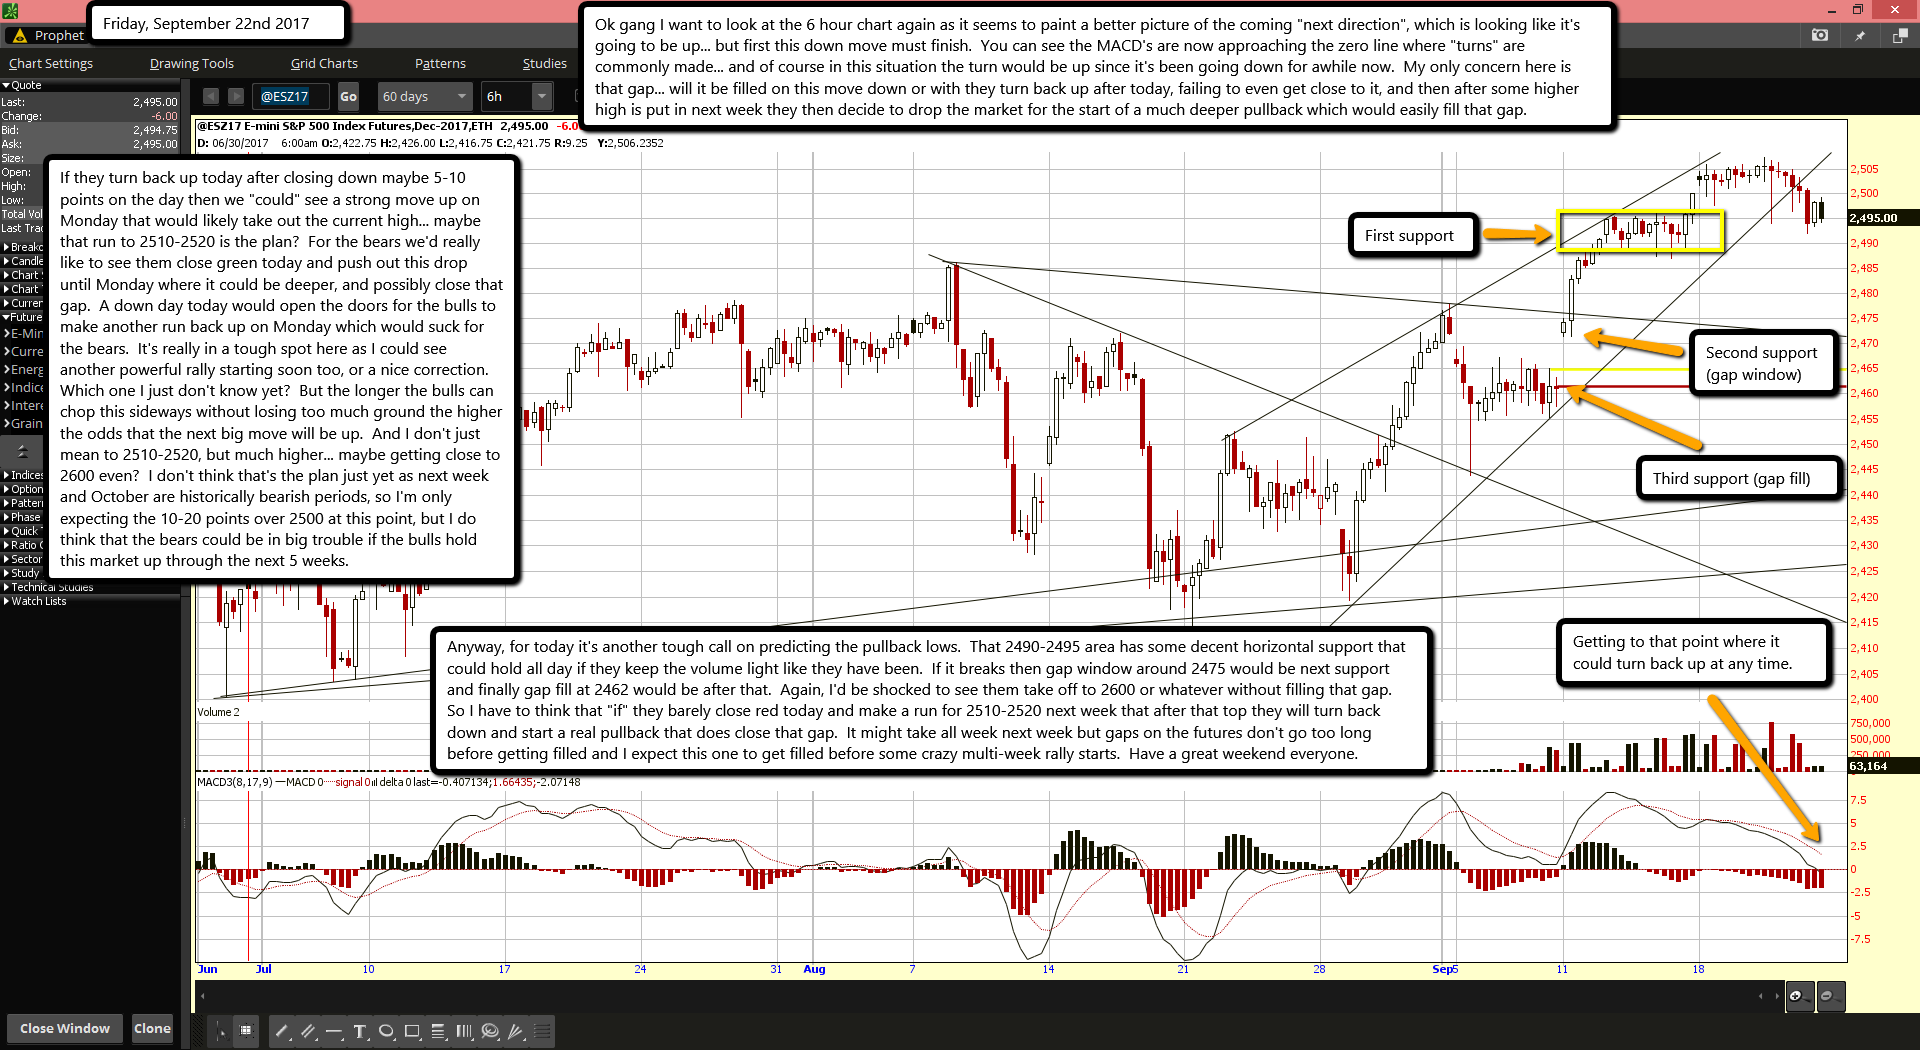
Ok gang I want to look at the 6 hour chart again as it seems to paint a better picture of the coming "next direction", which is looking like it's going to be up... but first this down move must finish.  You can see the MACD's are now approaching the zero line where "turns" are commonly made... and of course in this situation the turn would be up since it's been going down for awhile now.  My only concern here is that gap... will it be filled on this move down or with they turn back up after today, failing to even get close to it, and then after some higher high is put in next week they then decide to drop the market for the start of a much deeper pullback which would easily fill that gap.

If they turn back up today after closing down maybe 5-10 points on the day then we "could" see a strong move up on Monday that would likely take out the current high... maybe that run to 2510-2520 is the plan?  For the bears we'd really like to see them close green today and push out this drop until Monday where it could be deeper, and possibly close that gap.  A down day today would open the doors for the bulls to make another run back up on Monday which would suck for the bears.  It's really in a tough spot here as I could see another powerful rally starting soon too, or a nice correction.  Which one I just don't know yet?  But the longer the bulls can chop this sideways without losing too much ground the higher the odds that the next big move will be up.  And I don't just mean to 2510-2520, but much higher... maybe getting close to 2600 even?  I don't think that's the plan just yet as next week and October are historically bearish periods, so I'm only expecting the 10-20 points over 2500 at this point, but I do think that the bears could be in big trouble if the bulls hold this market up through the next 5 weeks.

Anyway, for today it's another tough call on predicting the pullback lows.  That 2490-2495 area has some decent horizontal support that could hold all day if they keep the volume light like they have been.  If it breaks then gap window around 2475 would be next support and finally gap fill at 2462 would be after that.  Again, I'd be shocked to see them take off to 2600 or whatever without filling that gap.  So I have to think that "if" they barely close red today and make a run for 2510-2520 next week that after that top they will turn back down and start a real pullback that does close that gap.  It might take all week next week but gaps on the futures don't go too long before getting filled and I expect this one to get filled before some crazy multi-week rally starts.  Have a great weekend everyone.

ES Morning Update September 21st 2017

0

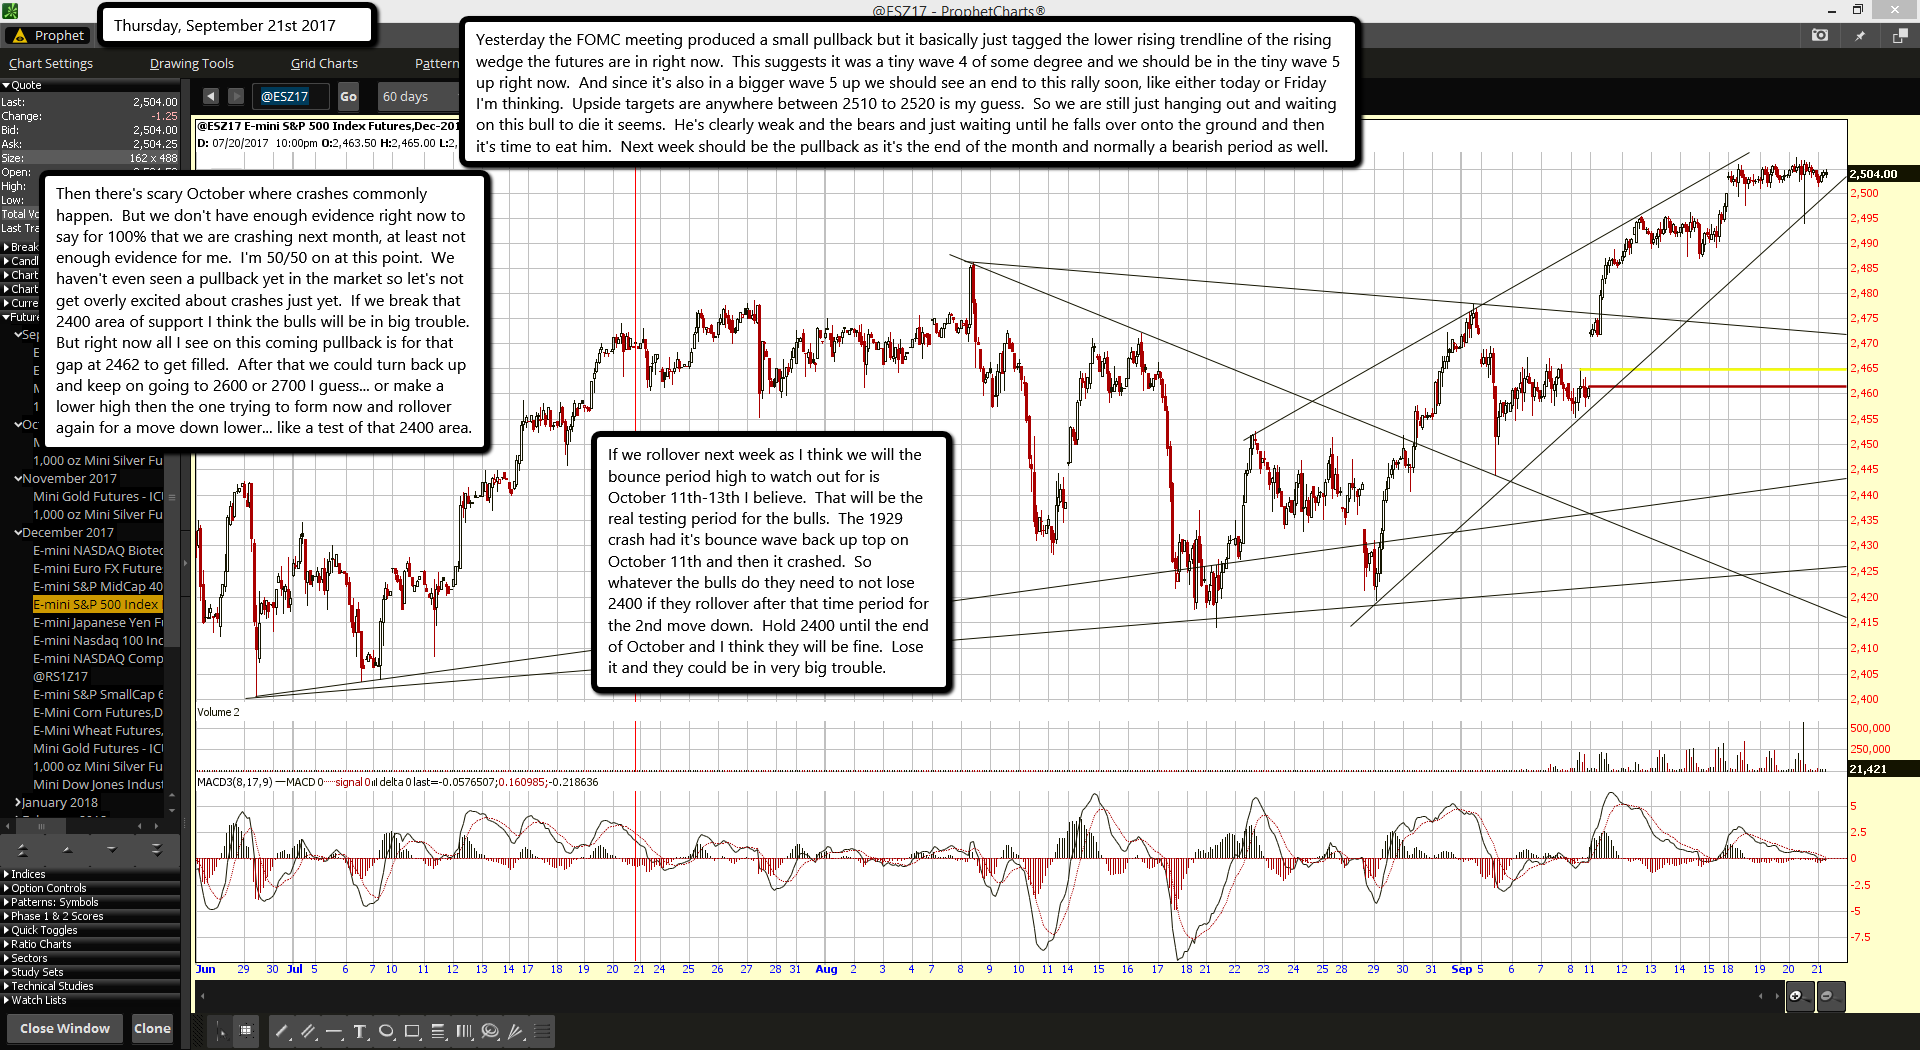
Yesterday the FOMC meeting produced a small pullback but it basically just tagged the lower rising trendline of the rising wedge the futures are in right now.  This suggests it was a tiny wave 4 of some degree and we should be in the tiny wave 5 up right now.  And since it's also in a bigger wave 5 up we should see an end to this rally soon, like either today or Friday I'm thinking.  Upside targets are anywhere between 2510 to 2520 is my guess.  So we are still just hanging out and waiting on this bull to die it seems.  He's clearly weak and the bears and just waiting until he falls over onto the ground and then it's time to eat him.  Next week should be the pullback as it's the end of the month and normally a bearish period as well.

Then there's scary October where crashes commonly happen.  But we don't have enough evidence right now to say for 100% that we are crashing next month, at least not enough evidence for me.  I'm 50/50 on at this point.  We haven't even seen a pullback yet in the market so let's not get overly excited about crashes just yet.  If we break that 2400 area of support I think the bulls will be in big trouble.  But right now all I see on this coming pullback is for that gap at 2462 to get filled.  After that we could turn back up and keep on going to 2600 or 2700 I guess... or make a lower high then the one trying to form now and rollover again for a move down lower... like a test of that 2400 area.

If we rollover next week as I think we will the bounce period high to watch out for is October 11th-13th I believe.  That will be the real testing period for the bulls.  The 1929 crash had it's bounce wave back up top on October 11th and then it crashed.  So whatever the bulls do they need to not lose 2400 if they rollover after that time period for the 2nd move down.  Hold 2400 until the end of October and I think they will be fine.  Lose it and they could be in very big trouble.

ES Morning Update September 20th 2017

0

Again gang, nothing to add that hasn't already been said. The market is waiting on the FOMC meeting today at 2 pm EST to hear what the Fed's plan to do in the future about interest rake hikes. I'd expect nothing new to come out of the meeting that the market isn't already expecting to be said. Then it's going to boil down to how many shorts there are in the market right above this 2500 level. If too many we could see a fast squeeze up higher to take them out, but I don't think it will hold past this Friday. In fact we could it see reverse intraday today like it did back on 8/8, but I'm not expecting that to happen as patterns rarely repeat exactly... especially one so recent. Now if that 8/8 move hadn't been seen for 3-4 years, then yeah it might repeat.

My thinking is we'd some "shaking and baking" today on the bulls and bears but the real move won't come until this Friday, maybe as early as Thursday. I fully expect next week to be down no matter what happens today. That gap on the futures has high odds of being filled before another multi-week rally starts that takes us to 2600 or wherever. I just can't see them getting too far away from that open gap and leaving it un-filled while the bulls push on up to wonder wonder land. Anyway, that's my thoughts for today. Might as well take a nap until 2 pm gang as more sideways movement is expected this morning.

ES Morning Update September 19th 2017

0

Nothing new to add today as we are still dancing around 2500 and will probably continue to do so until the FOMC meeting is over with tomorrow.  The market is at that critial point again where any positive news can spark another squeeze up rally on the bears or negative news can tank it.  There's no way to really know what SkyNet has planned here.  Another squeeze higher might hurt the most traders versus a move down but the charts certainly don't support some kind of wave 3 move up at this point.  At best I could see a fake out move up similar to the 8/8 move that quickly got reversed.  Nothing I see supports another several weeks of rallying.  But, I could see a fake out move higher, then a pullback and sideways chop for several weeks.  That's possible from what's in the charts.  Also possible is a pullback to work off the overbought conditions.  I don't know when but I want to point out again that gaps in the ES Futures are rare and almost always get filled.  That 2462 gap from 9/8 is still there and unfilled at this point.  While anything is possible odds don't favor another 50-100 point rally from here without first going down to fill that gap.  Maybe then a big rally can start but I'd be shocked if they don't fill that gap first.  That would also be right in the 50% Fibonacci retracement area as well.

You can see in this 6 hour chart that we are in a rising wedge with the MACD's making negative divergence from this recent breakout move up.  It's looking very tired to me up here and needs a pullback before going much higher.  Of course I don't manipulate the market, SkyNet does... so I'll just have to wait and see what good ol' Janet Yellen says on Wednesday to make the next move happen.  If up fast I think it will be a fake out and will rollover.  If down then I think we'll be heading to fill that gap before going back up to make another higher high.  It could be tricky of course but I haven't seen that happen in many FOMC days now.  Back in 2009 up to around 2014 or so I noticed that all the FOMC meeting would have these fast swings down, then up, then down, then up, etc... to shake everyone out.  But I haven't seen that in quite awhile now... probably the last couple of years I'd guess?  Maybe we are overdue for some kind of shakeout moves?  Don't know?  I'm not expecting them but do understand that they could happen.  I'll just ignore them as I believe the true direction will be known by the end of the day tomorrow.  Anyway, for today... I see nothing but more of the same crap as yesterday.

ES Morning Update September 18th 2017

0

Good Monday morning to everyone.  The SPX finally hit 2500 on the SPX so we got that out of the way... but what's next?  Tough question of course but I think it's all going to boil down to this Wednesdays FOMC meeting.  Today we appear to be following through on the strength of Fridays rally a little, and tomorrow I'd expect a small pullback just in front of the Fed's Wednesday.  I do not think the market is aligned up bullishly enough to continue straight on up another 100 points to 2600, but it's not bearish yet either.

My thoughts are that we are experiencing a "buy the rumor, sell the news" type event with this meeting coming up.  The Fed's aren't expected to raise rates or do anything stupid to scare the market.  But, there's already been a rally up into the meeting, and a squeeze on the bears last Friday.  If we had just sold off for a week or so then I would expect a rally from the meeting but rallying up into it just sets the stage for a pullback after the meeting.  For now though I'm just expecting a lot of "wait and see" chop until the the FOMC is over with.

As far as the wave count I continue to believe we are in some kind of 5th wave up with a "possible" smaller wave 3 inside it that's currently in play.  I say "possible" as we could also be in the 5th wave just as easily and any move down coming this week would then start an ABC pullback/correction, versus a tiny move down for some smaller wave 4 and then a smaller wave 5 up to put on another 10-20 points.  It's hard to read which as while I think Elloittwave is useful I find it nearly impossible to predict the market in the future on a consistent basis.  There are just too many alternate counts it seems, so I have to do my best to see what those counts are and if they match up with the technical analysis, historical data, patterns, etc... then I present those counts and use them until proven correct or incorrect.

So again, if we are still in a smaller 3rd wave up inside a 5th wave then we might drop a few points today or tomorrow and then rip back up for that smaller 5th wave to put on another 10-20 points.  It could be from something the Fed's say that get traders excited enough to buy it up even more?  I just don't know?  But if we are in the final 5th wave (meaning we are also in the smaller 5th inside that 5th) we should see a high today, then a small pullback tomorrow, followed by a move back up on Wednesday that puts in a lower high.  Then I'd think we are done on the upside for awhile and will start an ABC pullback into the rest of next week.

Downside target is unknown right now as we haven't even stopped going up yet.  But some Fibonacci level of 50% down of the entire up move from the 2414 low would be a good starting guess.  There's still a gap on the futures from 9/8 that needs filled.  It's around 2462 and it's rare to see gaps go too long without being filled.  On the SPX cash it's different as we see gaps on it all the time that never get filled, but not on the futures.  I personally think we'll see that gap filled before we see another 50 points higher.  To sum it up I'm looking for some choppy action between now and the FOMC meeting.  Ideally we top today, pullback small tomorrow, then back up for a lower high on Wednesday.  At that point I think we'll see a pullback/correction start until the end of September or so.

ES Morning Update September 15th 2017

0

Not much change since yesterday.  The bulls are holding the market sideways as the MACD on this 6 hour chart drift lower, which is bullish as it could turn back up briefly at any time and allow the bull flag that's setting up to play out.  I don't see it today, but it's possible I guess.  Most likely though we'll drift down more on this MACD and it will turn back up next week.  There's the rising trendline of support (both the black one and the green one) that will continue higher into next week and the price level might just chop sideways right into it... which should be the launch point for the next move up from the bull flag.

This might happen right on Wednesday when the Fed's have the next FOMC meeting?  Or maybe it happens a day before it or after it?  There's no way to be sure, but just based on me counting 6 hour bars I'd lean toward it happening Monday or Tuesday, before the meeting.  This all assumes the bulls hold the line here and don't pull back and lose those rising trendlines of support, which I don't see them doing today.  But keep in mind that even if the bulls make another new high next week, and even take out 2500 by 10-20 points, it's likely the last "hurray" before a nice move down starts.

Why?  Because that turn back up on the MACD's and new high on the price level will setup a negative divergence, and we also are very likely in the 5th wave up... which usually ends a move and allows a counter-trend move to start.  So while no one knows what the final high will be before a 2-3 bear market starts I will said that the odds of this thing going on up to 2600, 2700, or more are extremely low without first having that counter-trend move down... which could turn into more?  Meaning that, considering we are going into the second half of September the high next week could mark the high for several months as it's very likely we'll see a nice correction happen before the next "even number" target even comes into view.  So a move over 2500 by a few points should end a long rally up and allow at minimum a retest of 2400, if not lower?

There's still 50/50 odds that we'll see a crash in October in my opinion. But after this crash, or correction we should still start back up into the end of this year and most of 2018 to make another higher high.  I'm still thinking that the top for the entire rally up from the 2009 lows of 666 on the SPX will end by summer of 2018 and that's when we'll start another 2-3 bear market.  However, it doesn't rule out another flash crash this October or even a regular crash (which usually end up being 18-20 calendar days long from the start of the water fall move).  I know I'm getting ahead of myself but I just want to "put out there" what I see that might happen.

I think it's important for traders not to get lured into thinking 2600 is next if we pop over 2500 next week by that 10-20 points I think is possible.  Instead I'd point you back in time to look at 09/19/2014 when the SPX finally did its' squeeze higher move to 2019 to shake out all the bears and get the bulls into thinking 2100 was next.  You see what happened afterwards, a drop down to 1820 by 10/15/2014.  Well, don't be surprised if we don't follow a similar pattern after some fake out move higher next week.  If it happens before the FOMC meeting I'd be worried about something they say... like another interest rate hike.  Otherwise it might happen the day of the meeting as they say nothing to spook the market but nothing good either.  Now, as you know, I'm already short.  I maybe exit today and reload next week on a move up to that magical 2500 level... or I may stay short?  I've have to see what today does first.  If we drop to the rising trendline of support then I'd most likely exit as I'll expect a bounce there into Monday.  My thoughts about today... sideways to down slightly.  Have a great weekend and remember that everyone is welcome in the chatroom.  It's fun, free and informative.

‘False Peace’ for Markets? A Trader Is Betting Millions on It

0
Christopher Cole, the chief of Artemis Capital, a $200 million hedge fund, in his office in Austin, Tex. “Optically, volatility is still very low, but fear is increasing,” he said. Credit Sarah Lim for The New York Times

AUSTIN, Tex. — Last Wednesday was another good day to make money on Wall Street: Stocks pushed up, interest rates were at rock bottom and the VIX gauge of investor unease was again trending downward.

But as investors celebrated yet another bounce-back from a market slip, Christopher Cole, a trader who runs a hedge fund here that makes bets on various forms of financial apocalypse, spotted something amid the sprawl of data and code that decorated the wall of screens before him.

“Optically, volatility is still very low, but fear is increasing,” Mr. Cole said, pulling up a chart on one of his six trading windows. It showed that in the months beyond the 30-day period measured by the Chicago Board Options Exchange’s VIX index, investors were expecting some violent moves to come in the stock market.

Mr. Cole, who opened Artemis Capital to outside investors in 2012, is taking the opposite side, arguing with the passionate intensity of the true believer that this market calm cannot last.

In doing so, he draws parallels to the stock market crash of 1987, when investors were similarly lulled into believing that volatility would not erupt.

So far, those betting against chaos have carried the day.

From day traders perched in front of their living room laptops to sophisticated institutional investors the world over, many have made piles of money betting that the VIX will keep moving lower.

The volatility index known as the VIX has been hovering at a fraction of what it was during the peak of the financial crisis.

After peaking at close to 90 at the time of the financial crisis, the VIX recently sank to a multidecade low of just below 9, the occasional sharp spike upward notwithstanding. (As of Wednesday afternoon, it was 10.5.)

Several factors have helped along the way, analysts say. They include aggressive money printing and bond purchasing by global central banks and the profusion of exchange traded investments, which make it cheap and easy for professionals and amateurs alike to bet on a falling VIX.

Now, just a month ahead of the 30th anniversary of Black Monday, when the Standard & Poor’s 500 stock index plunged 20 percent, Mr. Cole is wagering on a similar calamity, underpinned by a vicious spike in the VIX and a steep sell-off in stocks.

“The fact that everyone has been incentivized to be short volatility has set up this reflexive stability — a false peace,” he said. “But if we have some sort of shock to the system, all these self-reflexive elements reverse in the other direction and become destabilizing as opposed to stabilizing.”

Calling an end to the second-longest bull market in modern financial history has, understandably, become quite fashionable. Not just on the perma bear fringes, either. Wall Street houses talk regularly about overvalued stock markets, and establishment voices like Lloyd C. Blankfein, the chief executive of Goldman Sachs, have mused openly that “things have been going up for too long.”

A little-known British investment firm, Ruffer Capital, has caused a stir by predicting a shattering denouement, and many hedge funds are buying up cheap VIX options, which will pay off handsomely if the index shoots up.

Artemis Capital is of a slightly different stripe. It is, as Mr. Cole likes to say, a hedge fund with a capital H. That means, in times of bull market fever, the fund will bet on a reversal, offering downside protection for cautious investors by finding creative ways to purchase exposure to financial chaos. These trades entail purchasing a variety of derivative instruments that pay off if there is a dramatic upward spike in the VIX, which can cause stocks to fall precipitously.

Of late, money managers seeking such a hedge have grown markedly. Mr. Cole, who started with $1 million in 2012, is now sitting on $200 million, and demand has been so strong recently that he expects to hit $300 million soon, at which point he will restrict further access.

Mr. Cole, 38, has the bouncy enthusiasm of a young child, and he spends each waking day reading, coding and free associating about what it will be that marks the bull market’s end.

Like many dyed-in-the-wool market skeptics, he has his quirks. To remind himself to make full use of each day, he wears a watch that counts off the time he has left to live — 50 years and 4 months.

At the moment, Mr. Cole calculates that as much as $1.5 trillion in investor money is betting the markets will remain as they more or less have been since 2009: volatility free.

This sum, he says, includes about $60 billion in funds that are explicitly short volatility in its many forms. The bulk of this amount is in funds that deploy strategies where volatility is a critical input for allocating exposure to the stock market. So the lower volatility is, the more these funds load up on stocks.

Piling on to the low volatility trade have been corporations, which this year may buy back close to $1 trillion worth of stock, analysts estimate.

In 1987, portfolio insurance transformed a market decline into a historic rout when computer driven programs sold stock market futures into a panicked marketplace absent of willing buyers. Mr. Cole says this $1.5 trillion in short volatility money can play a similar role today if the fear gauge index spikes sharply.

All of a sudden VIX sellers will become VIX buyers, which will send the index soaring and stocks plummeting.

As he sees it, the formulaic strategies that sold stock market futures into a falling market in 1987 and the short volatility money of today are akin to barrels of petroleum that can turn a mere fire into a seismic conflagration.

“In 1987, we were in a bull market, and the Fed was behind the curve with regard to inflation and interest rates,” Mr. Cole said. “What could cause a crisis now is if rates suddenly spike higher, share buybacks seize up and then the volatility sellers turn into volatility buyers all at once.”

It is, in many ways, a moral argument for him.

Volatility sellers reap cheap and fleeting gains, which he compares to speeding, obesity and marrying for money. Those willing to suffer the immediate pain of being long volatility — before the reward of calamity comes — Mr. Cole sees as being more virtuous.

To say that Mr. Cole is obsessed with volatility — as both a financial and a philosophical construct — would be an understatement. In his investor letters and papers, he cites the poems of Goethe, the movies of William Friedkin and George Lucas, and Joseph Campbell’s works on mythology as teaching tools for interpreting the whims of sudden change.

Ultimately, though, he believes that those who have held volatility in abeyance for so long — from risk parity funds to global central banks — will face a reckoning.

“Volatility is an instrument of truth, and the more you deny the truth, the more the truth will find you through volatility,” Mr. Cole said. “If central banks want to keep saving the day, that is fine. But volatility will then be transmuted through other forms like populism and identity politics and threaten the fabric of democracy. And that is something that my hedge fund will never be able to protect against.”


More information here:

https://www.broadbandsearch.net/blog/what-facebook-knows-about-me

s2Member®