Sunday, July 26, 2026
Home Blog Page 57

ES Morning Update September 14th 2017

0

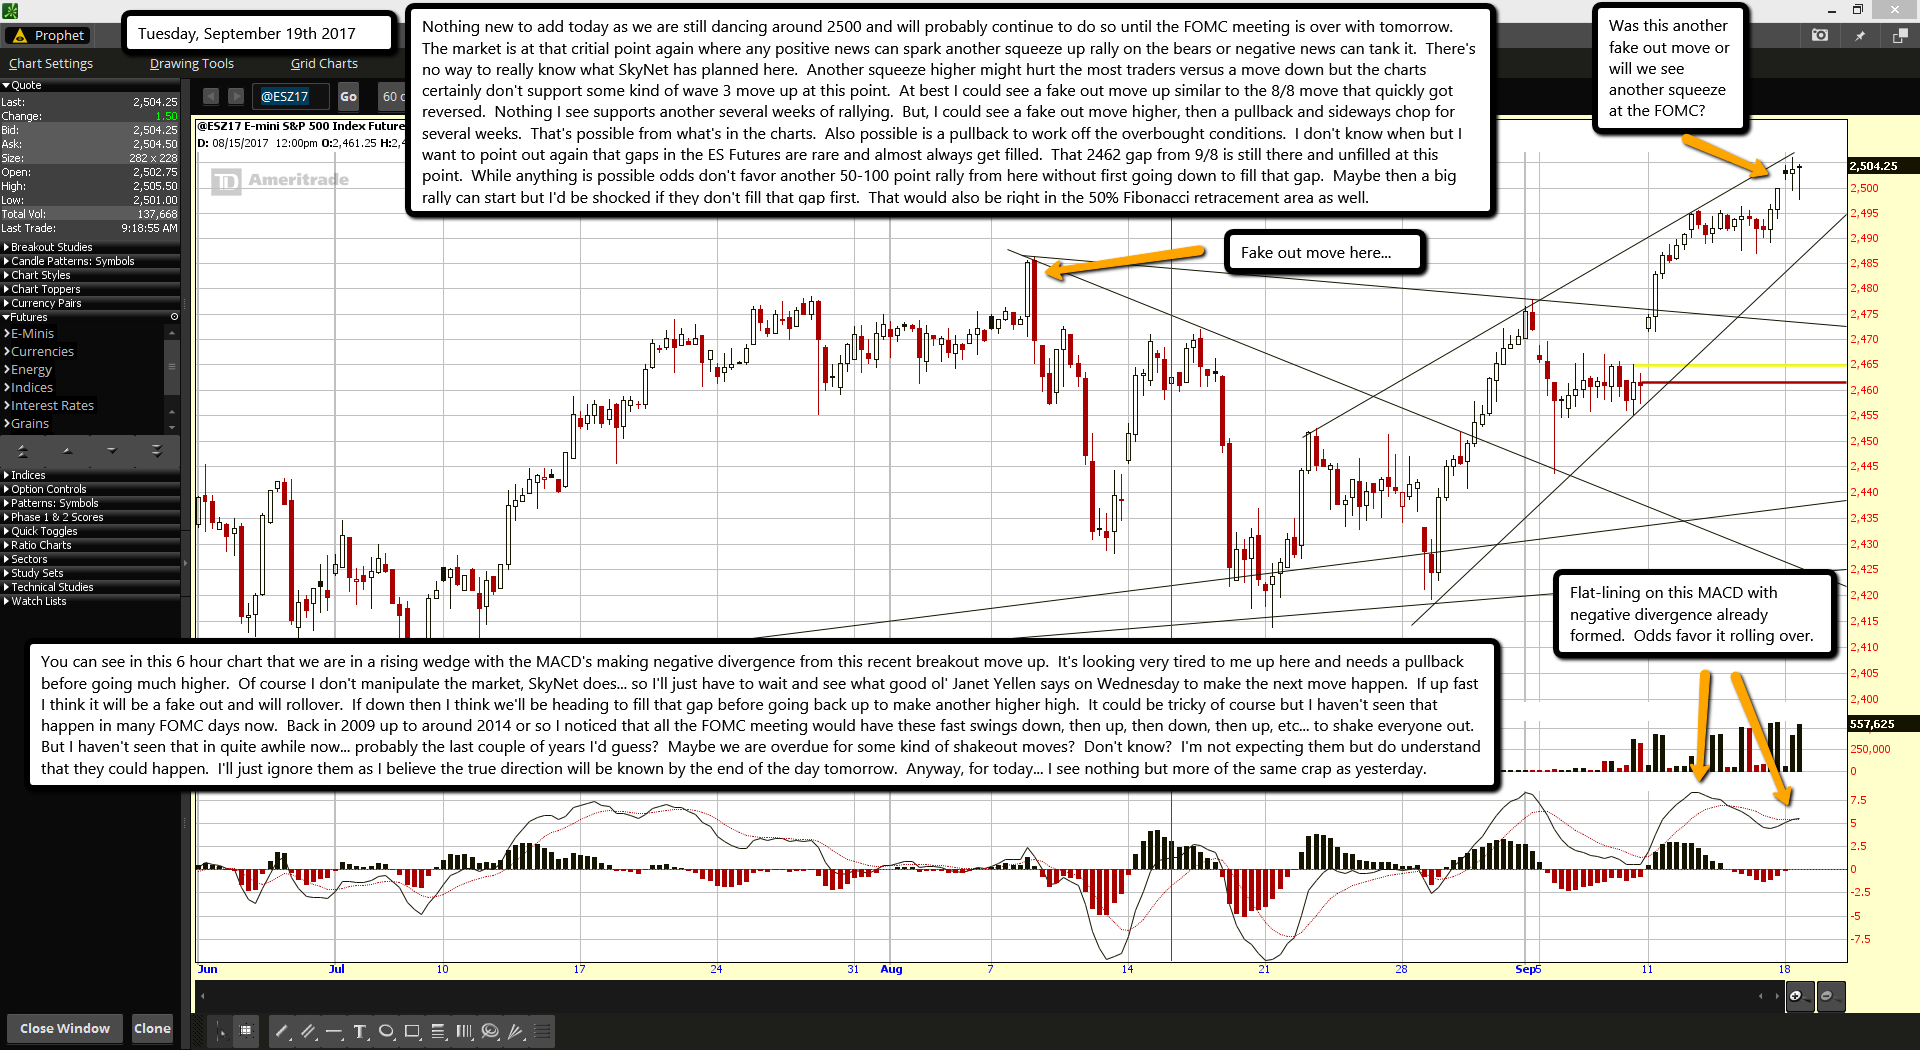
Today we'll look at the 6 hour chart as it shows clearly how overbought the market is up at this level.  We can see this morning that the futures did rollover and the MACD's have now put in a bearish cross.  While we might not see it today I do think the futures will test that rising trendline of support coming in around 2480 or so right now.  Naturally we'll see some dip buyers come in at the open so it's possible this gap down gets filled, but I do not see any move higher this morning as this MACD just does not support that.  We should drift down into Friday if this move goes slow.  If it's fast then we could bottom today, but today has nothing bullish in it.

The best the bulls can hope for is to limit the move down and hold it in place, but that would setup a bear flag and just make the move down carry into tomorrow.  It would be better if the bulls just let it drop hard to that rising support line and then they could rally up tomorrow. But even then I still don't see any new high coming this week.  The current all time will likely stay until this week ends.  Could it be pierced next week?  Sure, but this chart needs time to reset back to neutral from overbought and that could take several days... which this week will be over with in two.  Next week is the monthly options expiration week and we also have the FOMC meeting on Wednesday.

So it's a bullish week and will give the bulls the best shot at 2500 or more.  I do think it's possible for them to hit it, but in doing so they will likely go through it by 10-20 points just like they have done so many times in the past when hitting that magical "even number" level.  If you look back at 9/16 to 9/19/2014 you'll see a 3 day strong move up into the 19th where the SPX topped at 2019 and then started a nice correction.  We could see something similar where we drop today and maybe tomorrow a litte, then rally up early next week into a top on Wednesday or Thursday with a high of 10-20 points over 2500... and then we start our nice correction down.

Today's market seems more compressed in time then back then, so moves up or down as seen back then might take half the amount of days now then back then.  It's hard to know for sure where we are in looking at past moves that go into an even number level but that's one possibility.  The other would be the 12/29/2014 high of 2093 SPX, which produced a nice correction down first before eventually going back up to break the 2100 even number level in mid-February 2015.  I don't think that will be the pattern here because of the month we are in right now will more then likely follow a similar pattern to prior years in the past with the same month.  And we have next week as normally bullish, whereas selling the first week of a new year after a strong Santa rally is also common and not similar to what month we are in now.  So, for today I'm looking for all rallies to fail to reach yesterdays' high... "maybe" a gap fill but I wouldn't count on it.  The move down though is likely to be full of dip buyers so it could be choppy today and have a hard time going down.  But today or tomorrow I do think we'll test that rising trendline of support currently around 2480, and if that holds then we could (should) see more up next week.

ES Morning Update September 13th 2017

0

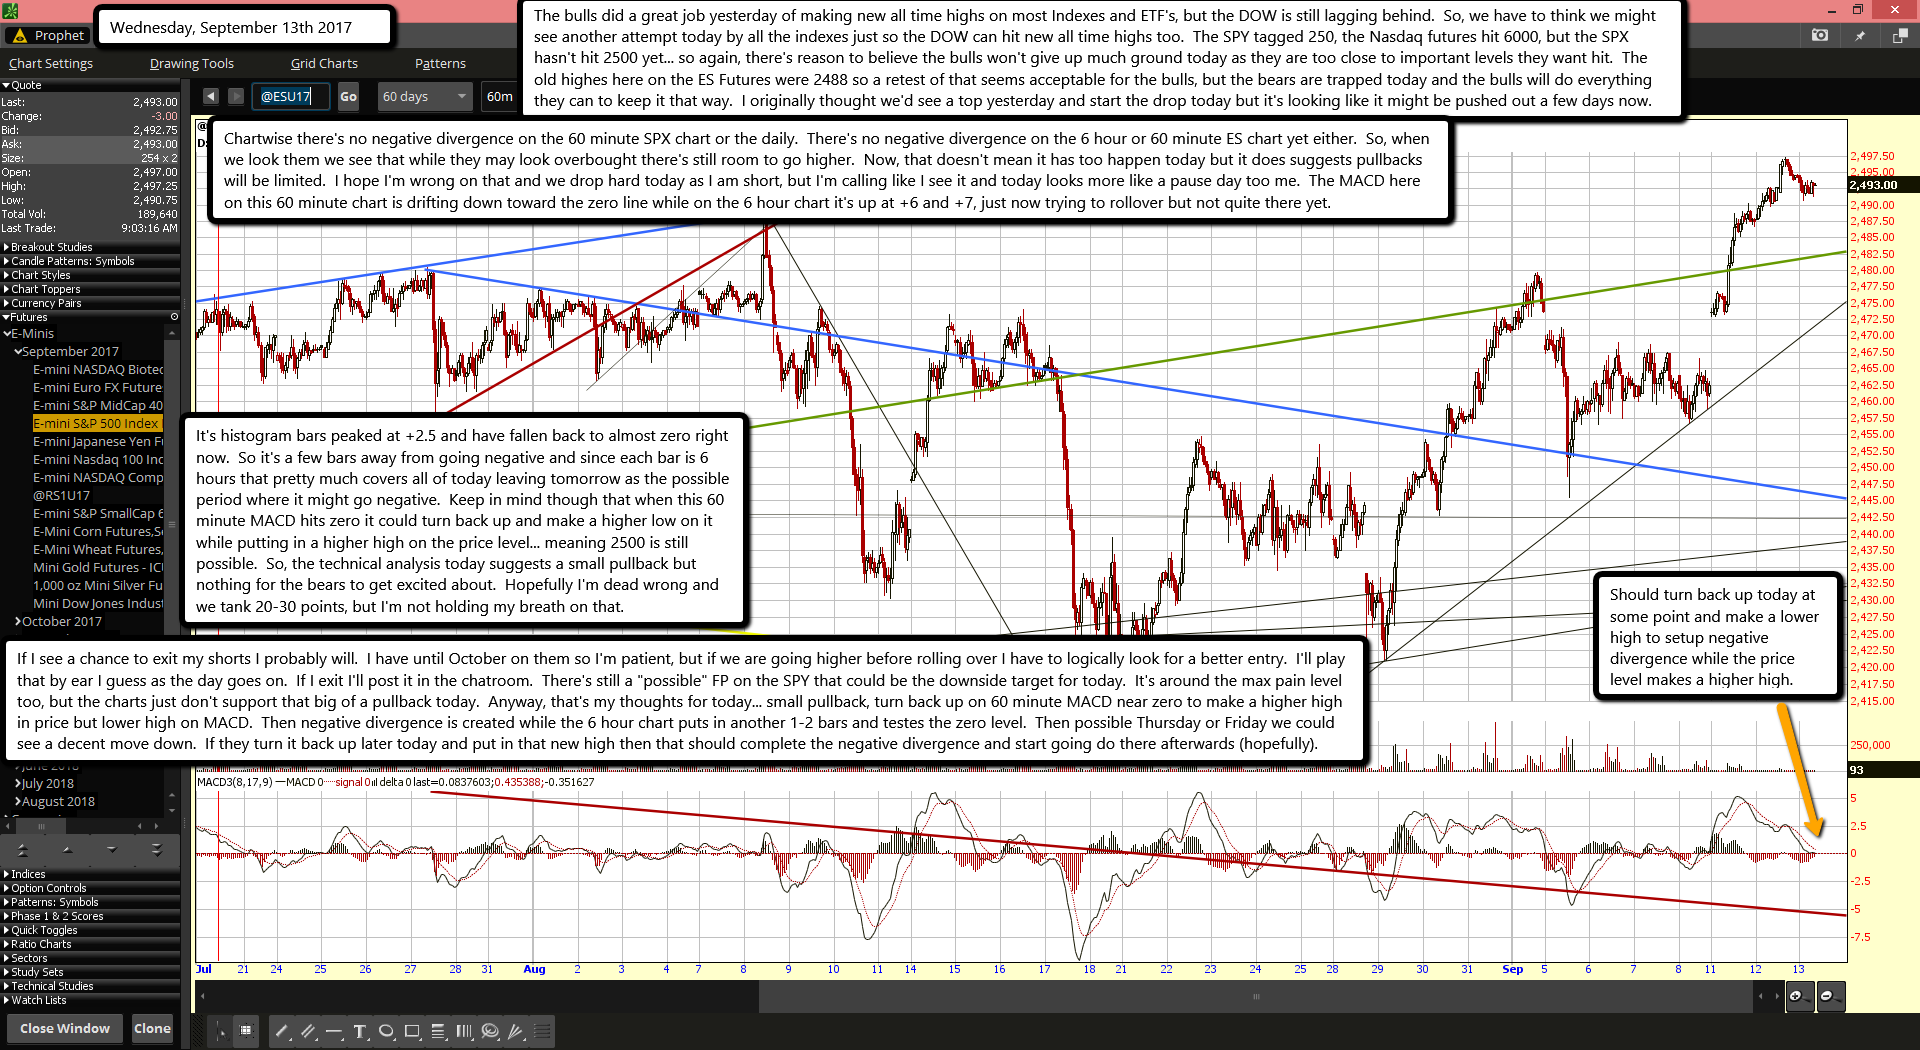
The bulls did a great job yesterday of making new all time highs on most Indexes and ETF's, but the DOW is still lagging behind.  So, we have to think we might see another attempt today by all the indexes just so the DOW can hit new all time highs too.  The SPY tagged 250, the Nasdaq futures hit 6000, but the SPX hasn't hit 2500 yet... so again, there's reason to believe the bulls won't give up much ground today as they are too close to important levels they want hit.  The old highes here on the ES Futures were 2488 so a retest of that seems acceptable for the bulls, but the bears are trapped today and the bulls will do everything they can to keep it that way.  I originally thought we'd see a top yesterday and start the drop today but it's looking like it might be pushed out a few days now.

Chartwise there's no negative divergence on the 60 minute SPX chart or the daily.  There's no negative divergence on the 6 hour or 60 minute ES chart yet either.  So, when we look them we see that while they may look overbought there's still room to go higher.  Now, that doesn't mean it has too happen today but it does suggests pullbacks will be limited.  I hope I'm wrong on that and we drop hard today as I am short, but I'm calling like I see it and today looks more like a pause day too me.  The MACD here on this 60 minute chart is drifting down toward the zero line while on the 6 hour chart it's up at +6 and +7, just now trying to rollover but not quite there yet.

It's histogram bars peaked at +2.5 and have fallen back to almost zero right now.  So it's a few bars away from going negative and since each bar is 6 hours that pretty much covers all of today leaving tomorrow as the possible period where it might go negative.  Keep in mind though that when this 60 minute MACD hits zero it could turn back up and make a higher low on it while putting in a higher high on the price level... meaning 2500 is still possible.  So, the technical analysis today suggests a small pullback but nothing for the bears to get excited about.  Hopefully I'm dead wrong and we tank 20-30 points, but I'm not holding my breath on that.

If I see a chance to exit my shorts I probably will.  I have until October on them so I'm patient, but if we are going higher before rolling over I have to logically look for a better entry.  I'll play that by ear I guess as the day goes on.  If I exit I'll post it in the chatroom.  There's still a "possible" FP on the SPY that could be the downside target for today.  It's around the max pain level too, but the charts just don't support that big of a pullback today.  Anyway, that's my thoughts for today... small pullback, turn back up on 60 minute MACD near zero to make a higher high in price but lower high on MACD.  Then negative divergence is created while the 6 hour chart puts in another 1-2 bars and testes the zero level.  Then possible Thursday or Friday we could see a decent move down.  If they turn it back up later today and put in that new high then that should complete the negative divergence and start going do there afterwards (hopefully).

ES Morning Update September 12th 2017

0

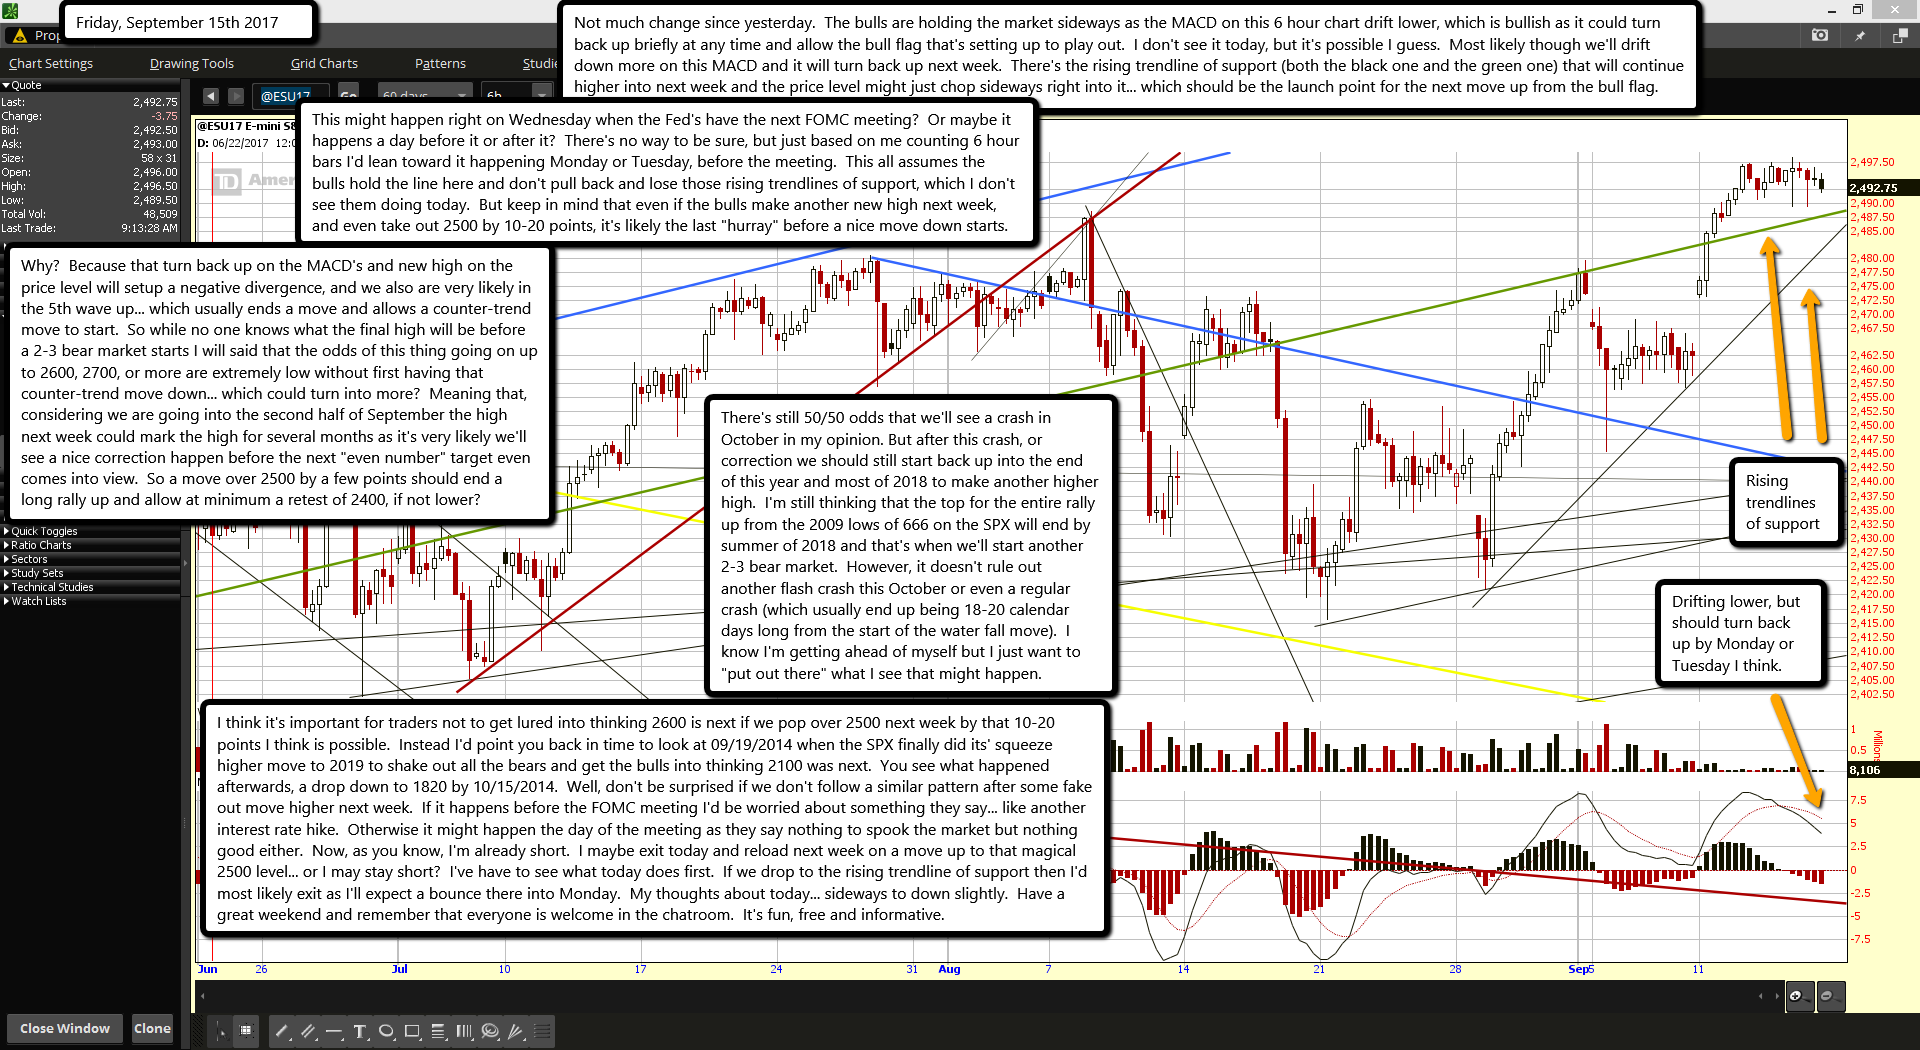
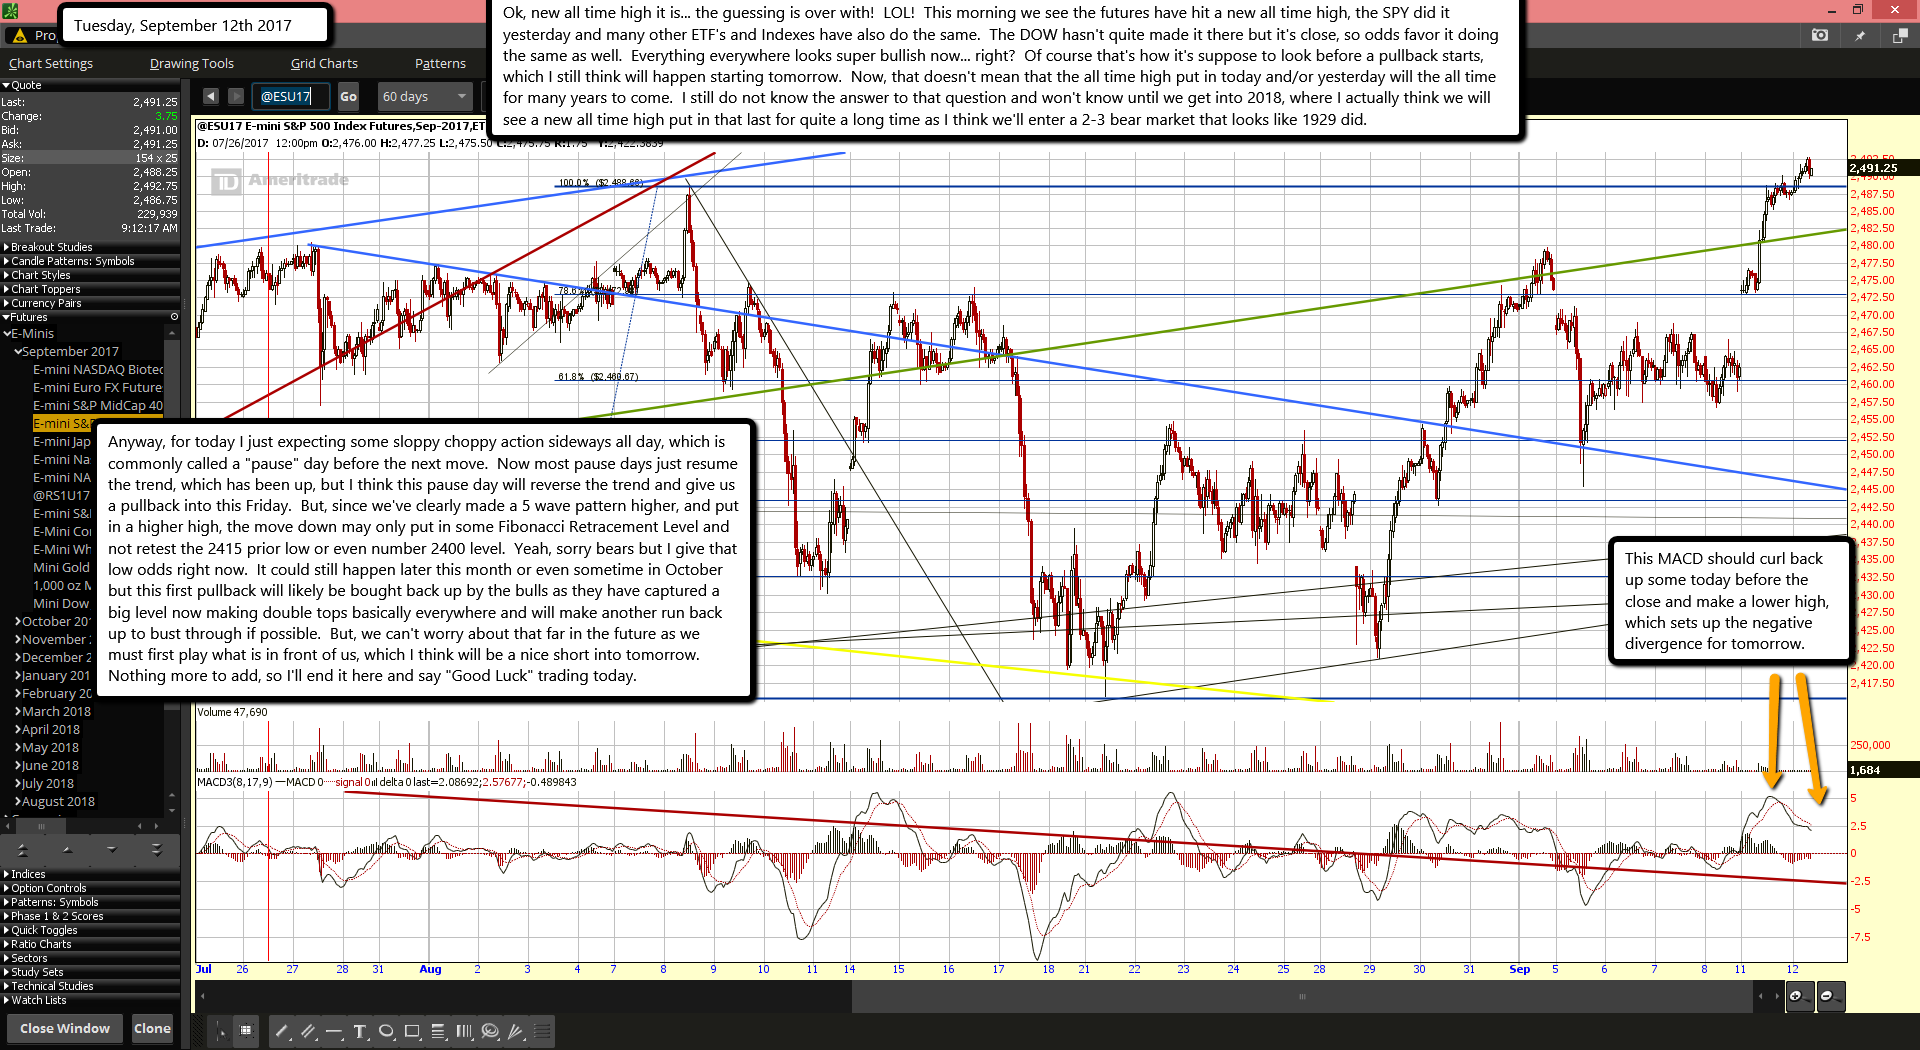
Ok, new all time high it is... the guessing is over with!  LOL!  This morning we see the futures have hit a new all time high, the SPY did it yesterday and many other ETF's and Indexes have also do the same.  The DOW hasn't quite made it there but it's close, so odds favor it doing the same as well.  Everything everywhere looks super bullish now... right?  Of course that's how it's suppose to look before a pullback starts, which I still think will happen starting tomorrow.  Now, that doesn't mean that the all time high put in today and/or yesterday will the all time for many years to come.  I still do not know the answer to that question and won't know until we get into 2018, where I actually think we will see a new all time high put in that last for quite a long time as I think we'll enter a 2-3 bear market that looks like 1929 did.

Anyway, for today I just expecting some sloppy choppy action sideways all day, which is commonly called a "pause" day before the next move.  Now most pause days just resume the trend, which has been up, but I think this pause day will reverse the trend and give us a pullback into this Friday.  But, since we've clearly made a 5 wave pattern higher, and put in a higher high, the move down may only put in some Fibonacci Retracement Level and not retest the 2415 prior low or even number 2400 level.  Yeah, sorry bears but I give that low odds right now.  It could still happen later this month or even sometime in October but this first pullback will likely be bought back up by the bulls as they have captured a big level now making double tops basically everywhere and will make another run back up to bust through if possible.  But, we can't worry about that far in the future as we must first play what is in front of us, which I think will be a nice short into tomorrow.  Nothing more to add, so I'll end it here and say "Good Luck" trading today.

ES Morning Update September 11th 2017

0

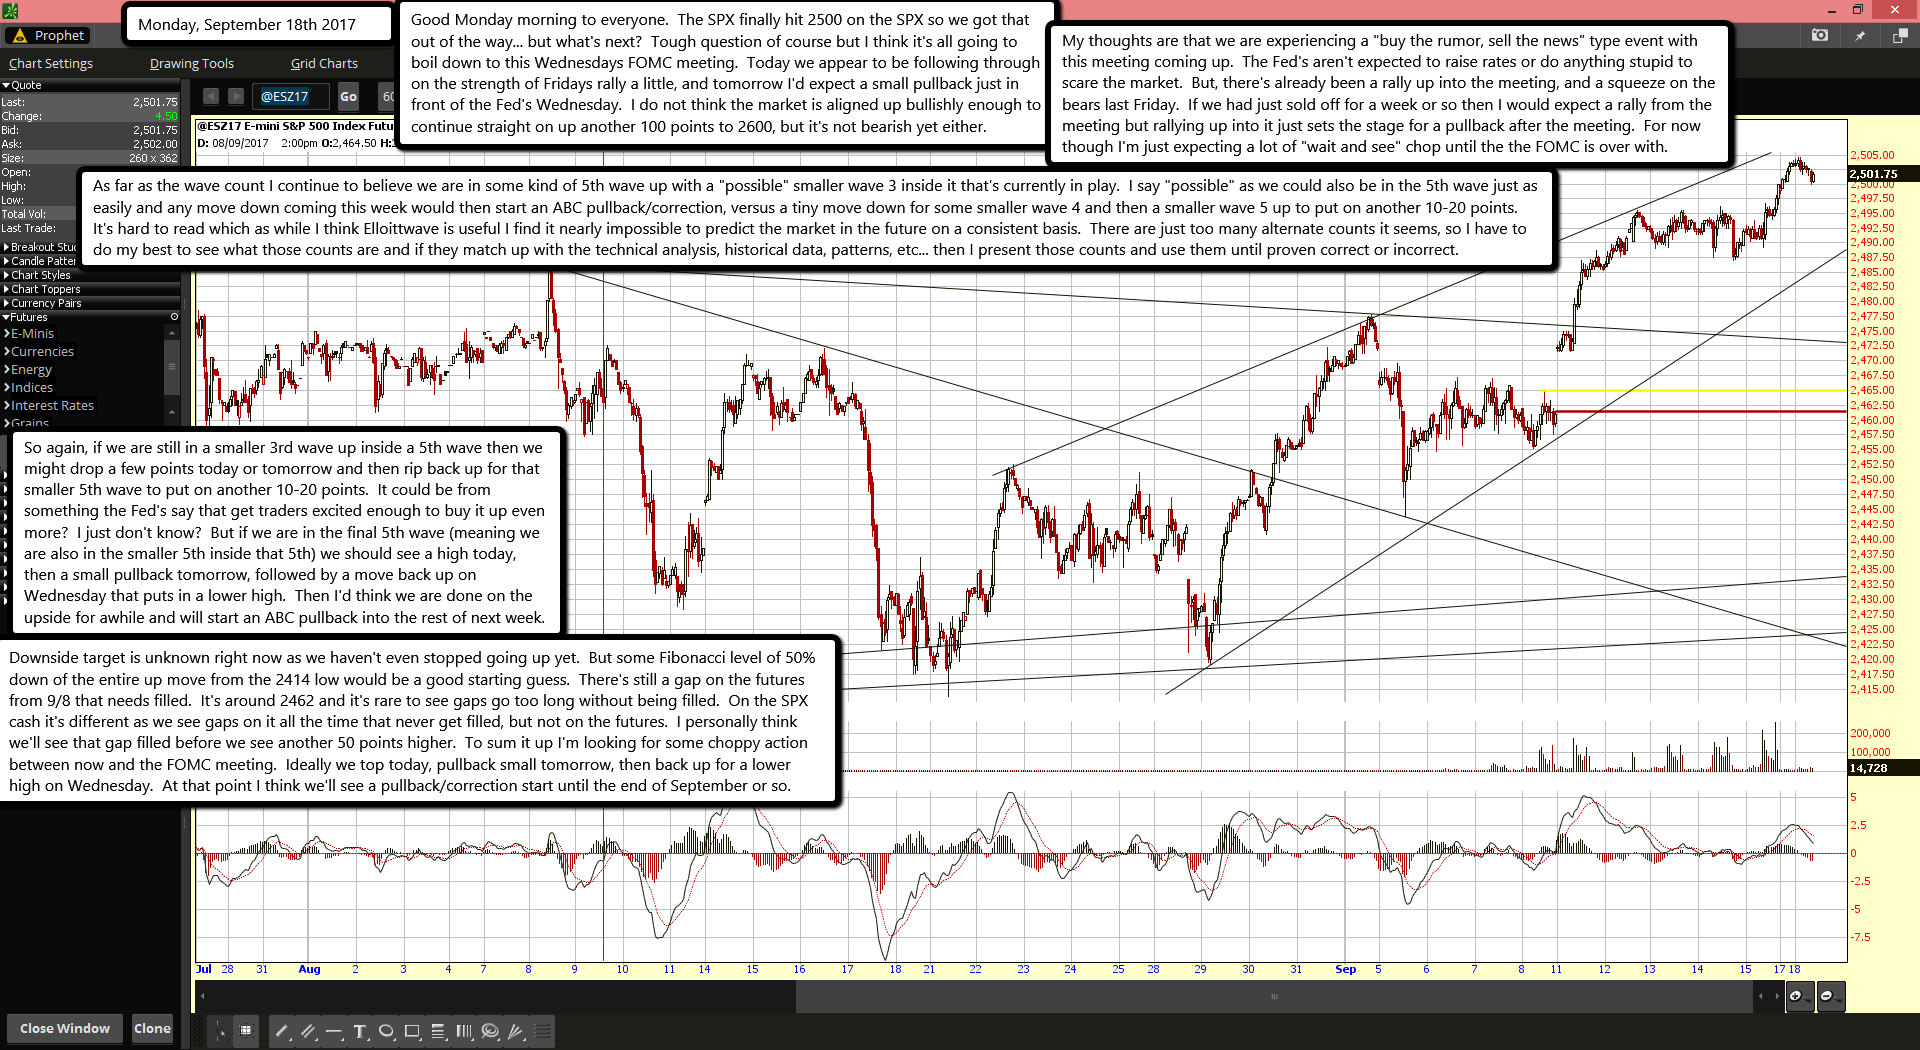
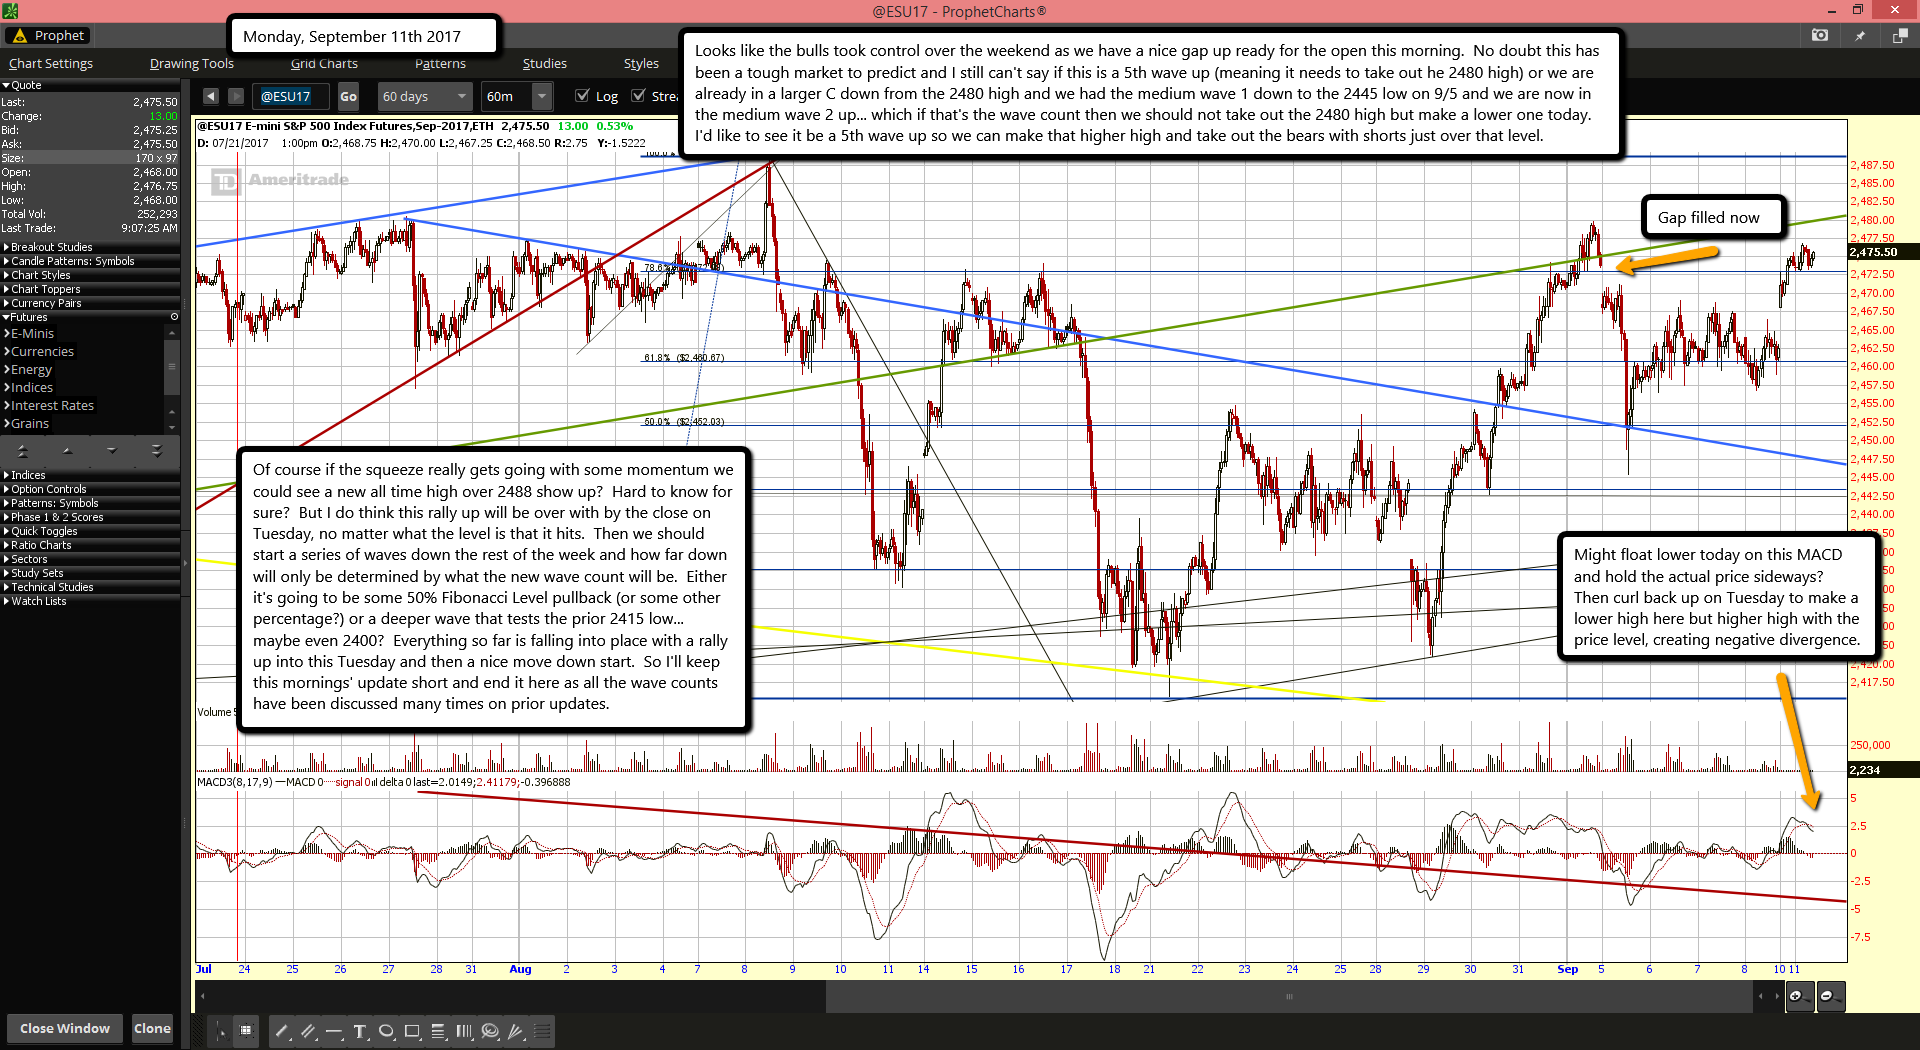
Looks like the bulls took control over the weekend as we have a nice gap up ready for the open this morning.  No doubt this has been a tough market to predict and I still can't say if this is a 5th wave up (meaning it needs to take out he 2480 high) or we are already in a larger C down from the 2480 high and we had the medium wave 1 down to the 2445 low on 9/5 and we are now in the medium wave 2 up... which if that's the wave count then we should not take out the 2480 high but make a lower one today.  I'd like to see it be a 5th wave up so we can make that higher high and take out the bears with shorts just over that level.

Of course if the squeeze really gets going with some momentum we could see a new all time high over 2488 show up?  Hard to know for sure?  But I do think this rally up will be over with by the close on Tuesday, no matter what the level is that it hits.  Then we should start a series of waves down the rest of the week and how far down will only be determined by what the new wave count will be.  Either it's going to be some 50% Fibonacci Level pullback (or some other percentage?) or a deeper wave that tests the prior 2415 low... maybe even 2400?  Everything so far is falling into place with a rally up into this Tuesday and then a nice move down start.  So I'll keep this mornings' update short and end it here as all the wave counts have been discussed many times on prior updates.

ES Morning Update September 8th 2017

0

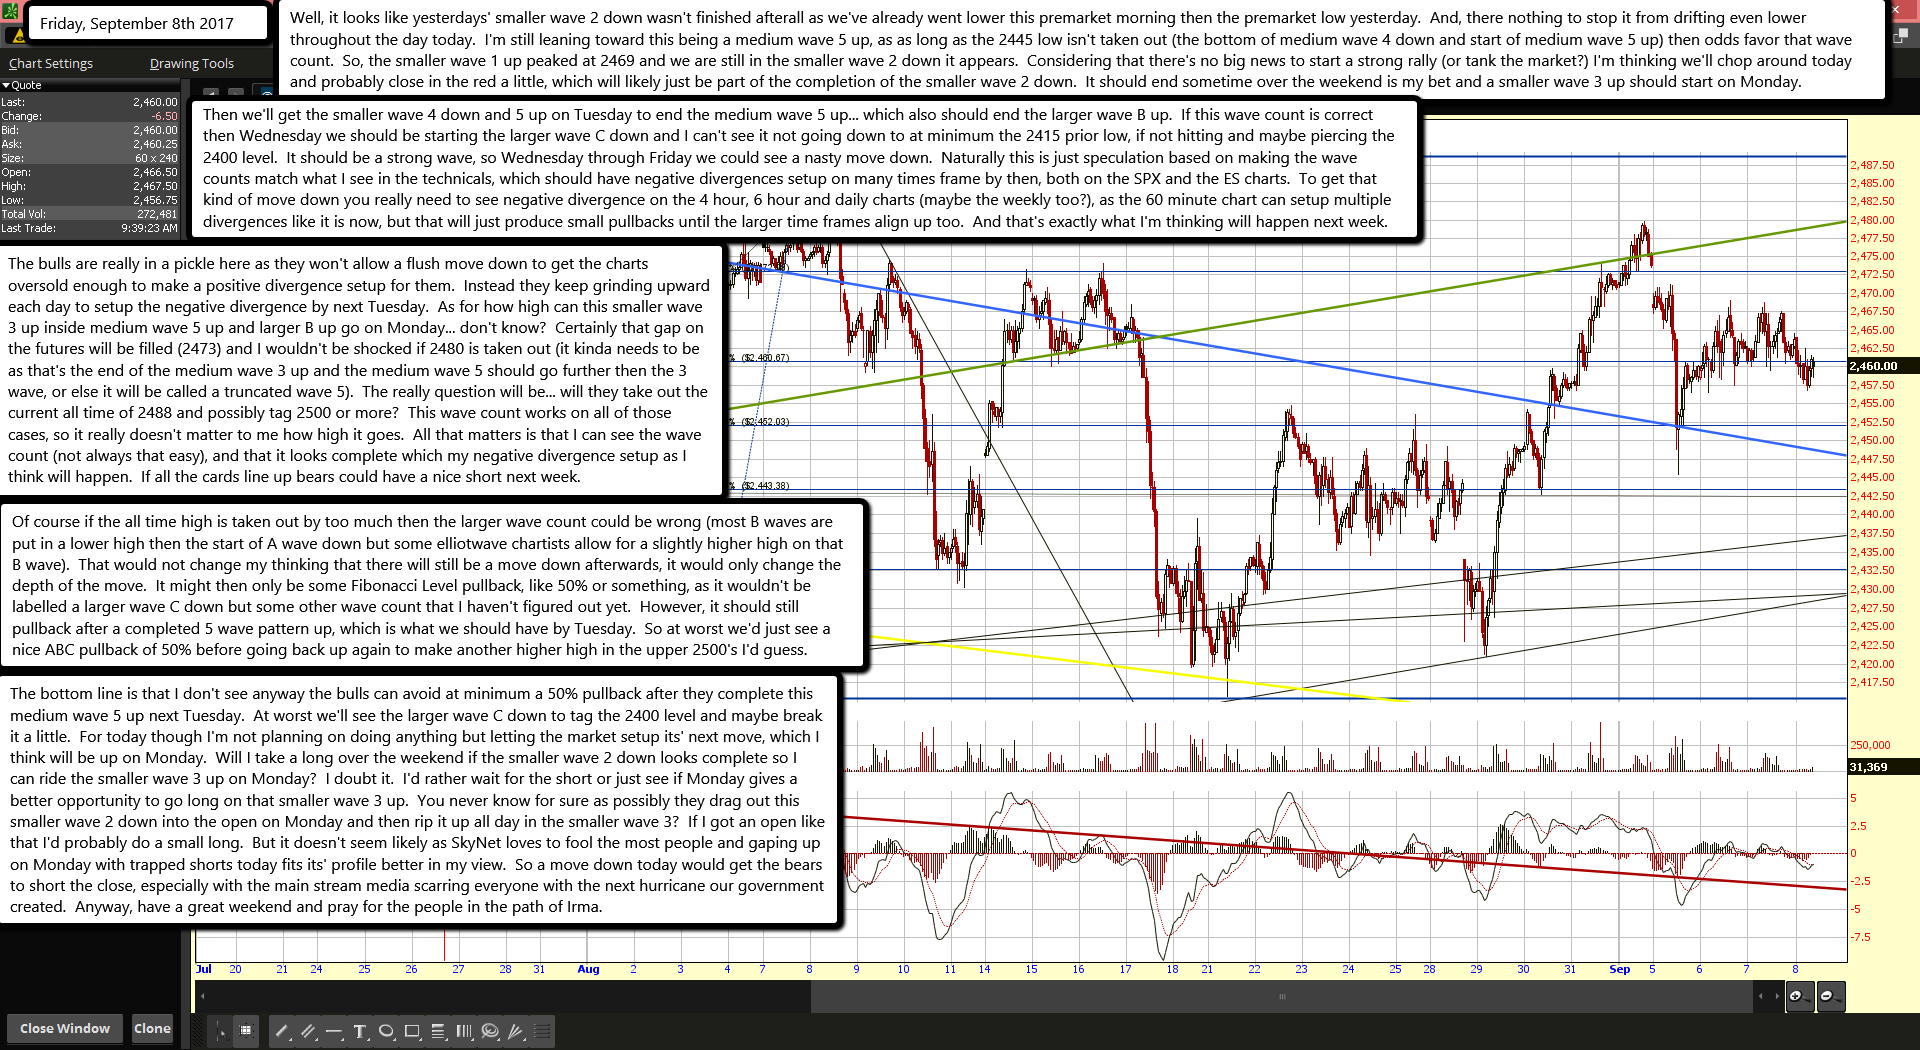
Well, it looks like yesterdays' smaller wave 2 down wasn't finished afterall as we've already went lower this premarket morning then the premarket low yesterday.  And, there nothing to stop it from drifting even lower throughout the day today.  I'm still leaning toward this being a medium wave 5 up, as as long as the 2445 low isn't taken out (the bottom of medium wave 4 down and start of medium wave 5 up) then odds favor that wave count.  So, the smaller wave 1 up peaked at 2469 and we are still in the smaller wave 2 down it appears.  Considering that there's no big news to start a strong rally (or tank the market?) I'm thinking we'll chop around today and probably close in the red a little, which will likely just be part of the completion of the smaller wave 2 down.  It should end sometime over the weekend is my bet and a smaller wave 3 up should start on Monday.

Then we'll get the smaller wave 4 down and 5 up on Tuesday to end the medium wave 5 up... which also should end the larger wave B up.  If this wave count is correct then Wednesday we should be starting the larger wave C down and I can't see it not going down to at minimum the 2415 prior low, if not hitting and maybe piercing the 2400 level.  It should be a strong wave, so Wednesday through Friday we could see a nasty move down.  Naturally this is just speculation based on making the wave counts match what I see in the technicals, which should have negative divergences setup on many times frame by then, both on the SPX and the ES charts.  To get that kind of move down you really need to see negative divergence on the 4 hour, 6 hour and daily charts (maybe the weekly too?), as the 60 minute chart can setup multiple divergences like it is now, but that will just produce small pullbacks until the larger time frames align up too.  And that's exactly what I'm thinking will happen next week.

The bulls are really in a pickle here as they won't allow a flush move down to get the charts oversold enough to make a positive divergence setup for them.  Instead they keep grinding upward each day to setup the negative divergence by next Tuesday.  As for how high can this smaller wave 3 up inside medium wave 5 up and larger B up go on Monday... don't know?  Certainly that gap on the futures will be filled (2473) and I wouldn't be shocked if 2480 is taken out (it kinda needs to be as that's the end of the medium wave 3 up and the medium wave 5 should go further then the 3 wave, or else it will be called a truncated wave 5).  The really question will be... will they take out the current all time of 2488 and possibly tag 2500 or more?  This wave count works on all of those cases, so it really doesn't matter to me how high it goes.  All that matters is that I can see the wave count (not always that easy), and that it looks complete which my negative divergence setup as I think will happen.  If all the cards line up bears could have a nice short next week.

Of course if the all time high is taken out by too much then the larger wave count could be wrong (most B waves are put in a lower high then the start of A wave down but some elliotwave chartists allow for a slightly higher high on that B wave).  That would not change my thinking that there will still be a move down afterwards, it would only change the depth of the move.  It might then only be some Fibonacci Level pullback, like 50% or something, as it wouldn't be labelled a larger wave C down but some other wave count that I haven't figured out yet.  However, it should still pullback after a completed 5 wave pattern up, which is what we should have by Tuesday.  So at worst we'd just see a nice ABC pullback of 50% before going back up again to make another higher high in the upper 2500's I'd guess.

The bottom line is that I don't see anyway the bulls can avoid at minimum a 50% pullback after they complete this medium wave 5 up next Tuesday.  At worst we'll see the larger wave C down to tag the 2400 level and maybe break it a little.  For today though I'm not planning on doing anything but letting the market setup its' next move, which I think will be up on Monday.  Will I take a long over the weekend if the smaller wave 2 down looks complete so I can ride the smaller wave 3 up on Monday?  I doubt it.  I'd rather wait for the short or just see if Monday gives a better opportunity to go long on that smaller wave 3 up.  You never know for sure as possibly they drag out this smaller wave 2 down into the open on Monday and then rip it up all day in the smaller wave 3?  If I got an open like that I'd probably do a small long.  But it doesn't seem likely as SkyNet loves to fool the most people and gaping up on Monday with trapped shorts today fits its' profile better in my view.  So a move down today would get the bears to short the close, especially with the main stream media scarring everyone with the next hurricane our government created.  Anyway, have a great weekend and pray for the people in the path of Irma.

Rush Limbaugh’s dangerous suggestion that Hurricane Irma is fake news

0


Rush Limbaugh didn't say the magic words, but on Tuesday he basically accused the media of creating fake news about Hurricane Irma, which is threatening Florida after hitting Barbuda and Antigua. The storm's 185-mile-per-hour winds tied the record high for any Atlantic hurricane making landfall.

“These storms, once they actually hit, are never as strong as they're reported,” Limbaugh claimed on his syndicated radio show. He added that “the graphics have been created to make it look like the ocean's having an exorcism, just getting rid of the devil here in the form of this hurricane, this bright red stuff.”

Why would the media exaggerate the threat of a hurricane? Here's Limbaugh's theory:

There is symbiotic relationship between retailers and local media, and it’s related to money. It revolves around money. You have major, major industries and businesses which prosper during times of crisis and panic, such as a hurricane, which could destroy or greatly damage people’s homes, and it could interrupt the flow of water and electricity. So what happens?

Well, the TV stations begin reporting this and the panic begins to increase. And then people end up going to various stores to stock up on water and whatever they might need for home repairs and batteries and all this that they’re advised to get, and a vicious circle is created. You have these various retail outlets who spend a lot of advertising dollars with the local media.

The local media, in turn, reports in such a way as to create the panic way far out, which sends people into these stores to fill up with water and to fill up with batteries, and it becomes a never-ending repeated cycle. And the two coexist. So the media benefits with the panic with increased eyeballs, and the retailers benefit from the panic with increased sales, and the TV companies benefit because they’re getting advertising dollars from the businesses that are seeing all this attention from customers.


To state the obvious, these are potentially dangerous comments from Limbaugh, who is based in Palm Beach, Fla. He is encouraging listeners who might be in Irma's path not to take seriously the official guidance disseminated through the media.

“I wish that not everything that involved news had become corrupted and politicized, but it just has,” he said.

More broadly, Limbaugh's bad advice reveals the metastasizing nature of “fake news” attacks on the press, which have been led by President Trump. How did we get from Trump's claim that he has “never seen more dishonest media than, frankly, the political media” to the idea that weather reports are phony, too?

Alex Jones might have something to do with it. The Infowars founder — who has an “amazing” reputation, according to Trump — has for years promoted the notion that the U.S. government possesses the power to conjure and control weather events. Just last week, as Hurricane Harvey battered Texas, Jones devoted part of his show to questioning why the government didn't “use the technologies to kill [the storm] out in the gulf.”

“It is weird how these storms go,” he said, suggesting Harvey might have been manufactured or manipulated. “They just sit over a city.”

Jones's contention is that the government — or, more precisely, the “deep state,” now that Trump is president — uses its “weather weapon” to stoke fear of climate change and promote a liberal agenda.


Limbaugh, a fellow Trump booster, didn't say the deep state causes storms, but he did say “you have people in all of these government areas who believe man is causing climate change, and they’re hellbent on proving it, they’re hellbent on demonstrating it, they’re hellbent on persuading people of it.”

Limbaugh didn't say the deep state directs storms toward major cities, but he did say “hurricanes are always forecast to hit major population centers because, after all, major population centers is where the major damage will take place and where we can demonstrate that these things are getting bigger and they’re getting more frequent and they’re getting worse — all because of climate change.”

Thus we have two of the president's biggest promoters in the media telling people that news about a storm — or perhaps even the storm itself — is fake. There could be serious consequences to Trump's ceaseless effort to lower trust in institutions such as the government and the press — consequences that the president and his team might not have fully considered.

On the morning before Harvey hit Texas, CNN's Jim Acosta tweeted that a moment when “millions will be relying on national and local news outlets to stay safe during hurricane” is “not a good time to take shots at 'fake news.'”

Brad Parscale, the digital media director of Trump's campaign, scoffed at Acosta's warning, tweeting that “nobody said the weather is fake.”

Actually, whether Parscale and Trump realize it or not, somebody does say the weather is fake.


My thoughts on it... the Weather is 100% controlled by the elite and used to create Weather Weapons.

Hurricane Harvey & the Weather Terrorists from Land, Sea and Air

Red

ES Morning Update September 7th 2017

0

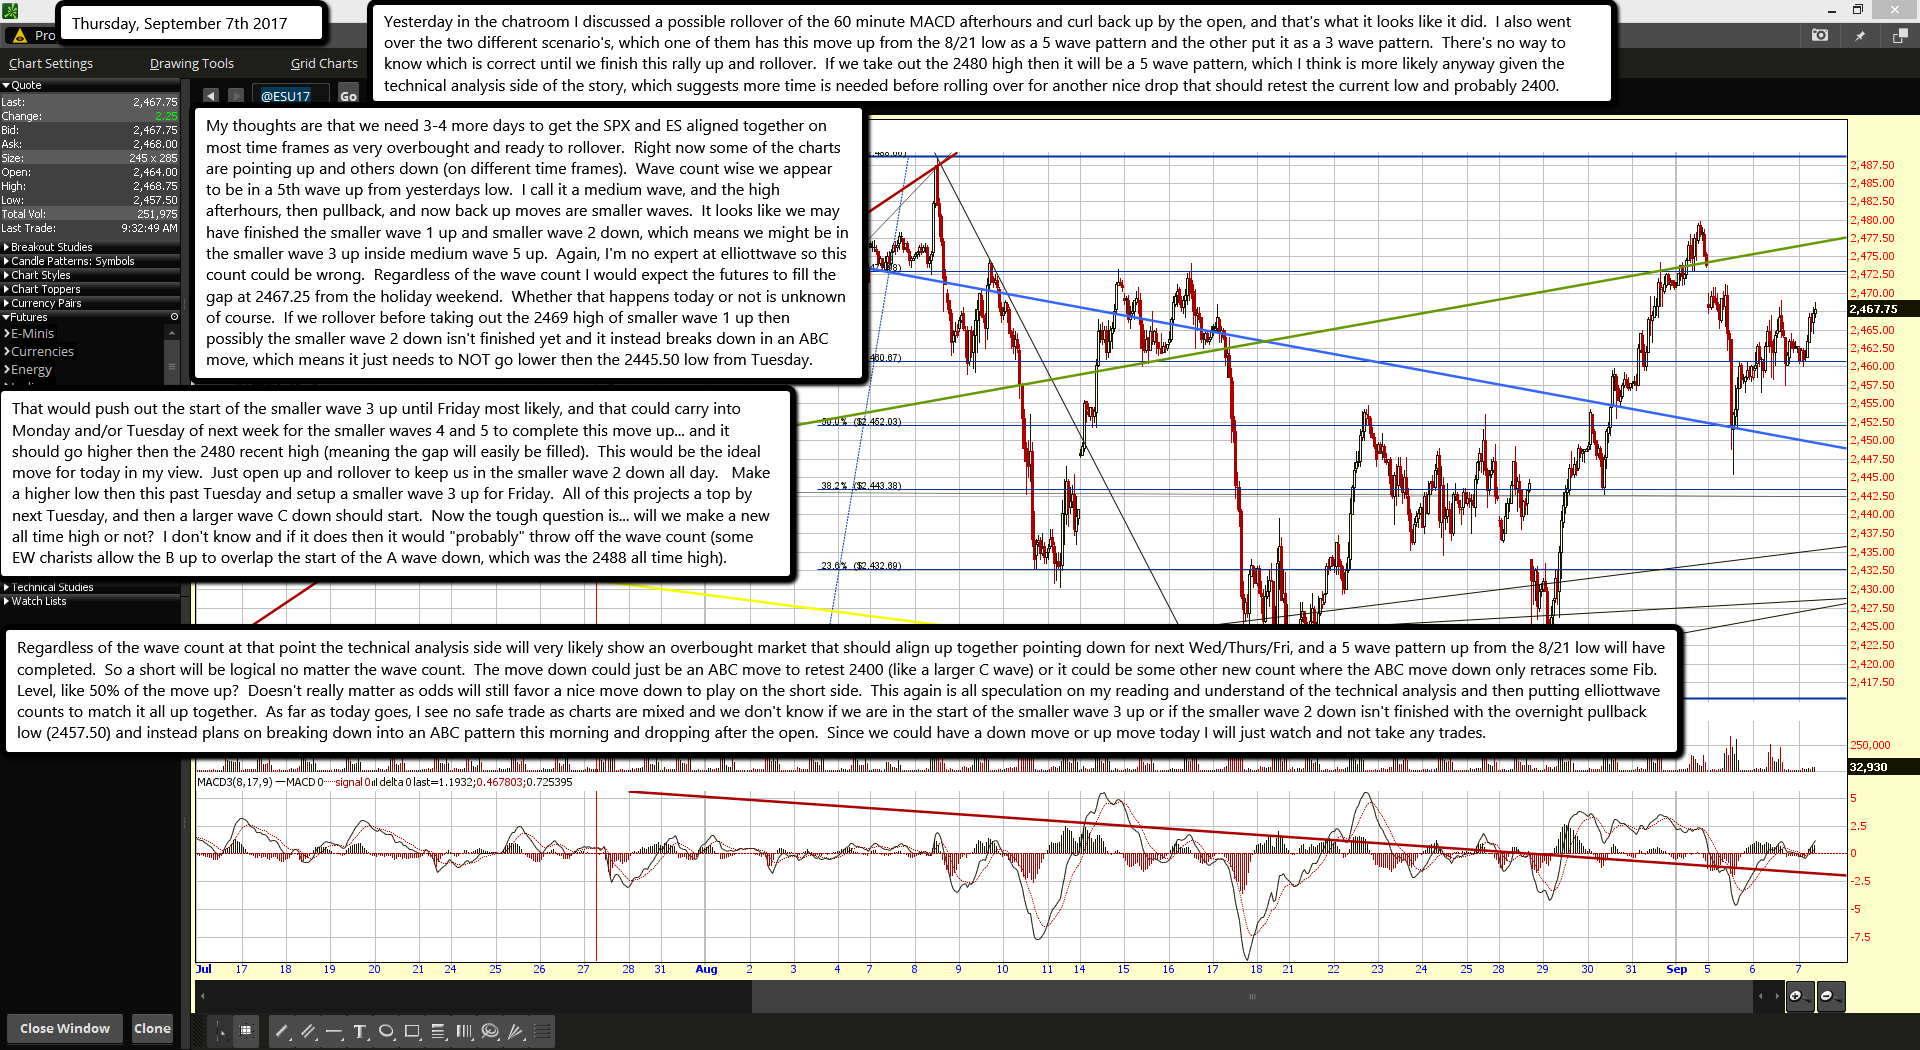
Yesterday in the chatroom I discussed a possible rollover of the 60 minute MACD afterhours and curl back up by the open, and that's what it looks like it did.  I also went over the two different scenario's, which one of them has this move up from the 8/21 low as a 5 wave pattern and the other put it as a 3 wave pattern.  There's no way to know which is correct until we finish this rally up and rollover.  If we take out the 2480 high then it will be a 5 wave pattern, which I think is more likely anyway given the technical analysis side of the story, which suggests more time is needed before rolling over for another nice drop that should retest the current low and probably 2400.

My thoughts are that we need 3-4 more days to get the SPX and ES aligned together on most time frames as very overbought and ready to rollover.  Right now some of the charts are pointing up and others down (on different time frames).  Wave count wise we appear to be in a 5th wave up from yesterdays low.  I call it a medium wave, and the high afterhours, then pullback, and now back up moves are smaller waves.  It looks like we may have finished the smaller wave 1 up and smaller wave 2 down, which means we might be in the smaller wave 3 up inside medium wave 5 up.  Again, I'm no expert at elliottwave so this count could be wrong.  Regardless of the wave count I would expect the futures to fill the gap at 2467.25 from the holiday weekend.  Whether that happens today or not is unknown of course.  If we rollover before taking out the 2469 high of smaller wave 1 up then possibly the smaller wave 2 down isn't finished yet and it instead breaks down in an ABC move, which means it just needs to NOT go lower then the 2445.50 low from Tuesday.

That would push out the start of the smaller wave 3 up until Friday most likely, and that could carry into Monday and/or Tuesday of next week for the smaller waves 4 and 5 to complete this move up... and it should go higher then the 2480 recent high (meaning the gap will easily be filled).  This would be the ideal move for today in my view.  Just open up and rollover to keep us in the smaller wave 2 down all day.   Make a higher low then this past Tuesday and setup a smaller wave 3 up for Friday.  All of this projects a top by next Tuesday, and then a larger wave C down should start.  Now the tough question is... will we make a new all time high or not?  I don't know and if it does then it would "probably" throw off the wave count (some EW charists allow the B up to overlap the start of the A wave down, which was the 2488 all time high).

Regardless of the wave count at that point the technical analysis side will very likely show an overbought market that should align up together pointing down for next Wed/Thurs/Fri, and a 5 wave pattern up from the 8/21 low will have completed.  So a short will be logical no matter the wave count.  The move down could just be an ABC move to retest 2400 (like a larger C wave) or it could be some other new count where the ABC move down only retraces some Fib. Level, like 50% of the move up?  Doesn't really matter as odds will still favor a nice move down to play on the short side.  This again is all speculation on my reading and understand of the technical analysis and then putting elliottwave counts to match it all up together.  As far as today goes, I see no safe trade as charts are mixed and we don't know if we are in the start of the smaller wave 3 up or if the smaller wave 2 down isn't finished with the overnight pullback low (2457.50) and instead plans on breaking down into an ABC pattern this morning and dropping after the open.  Since we could have a down move or up move today I will just watch and not take any trades.

ES Morning Update September 6th 2017

0

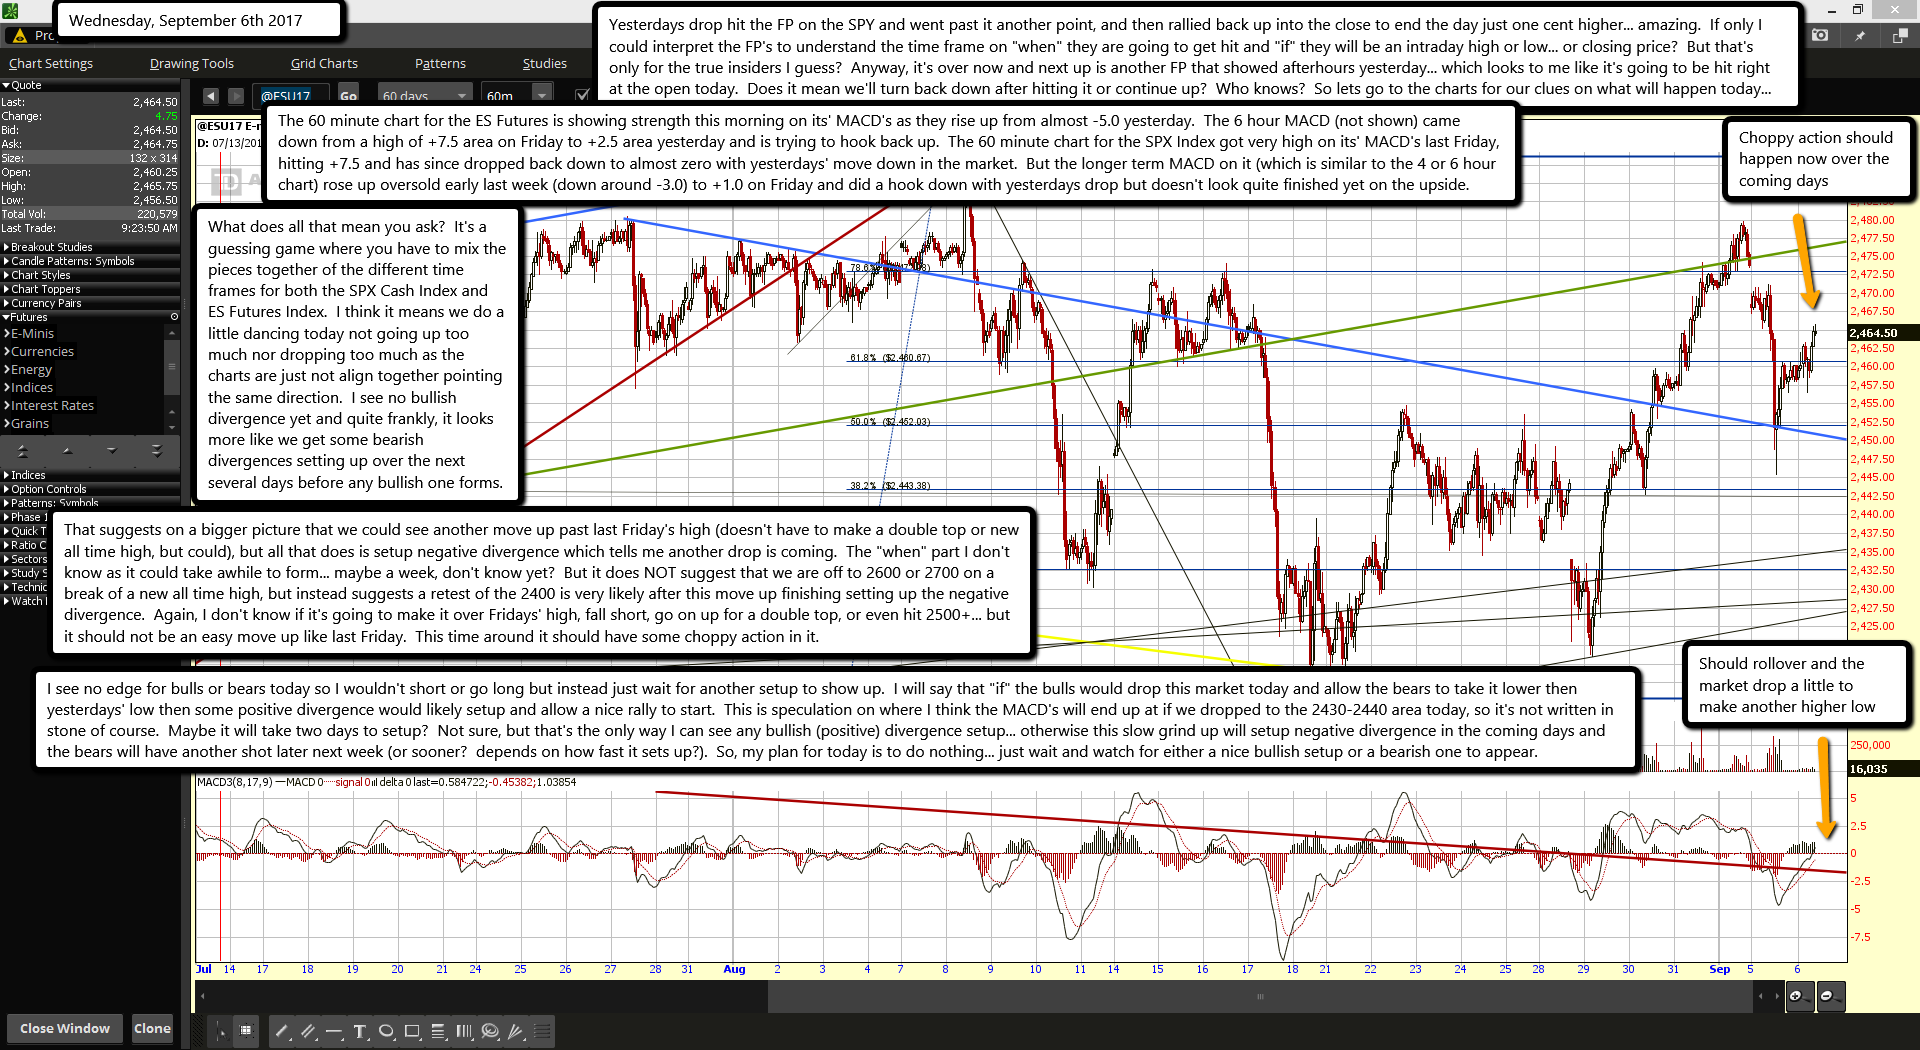
Yesterdays drop hit the FP on the SPY and went past it another point, and then rallied back up into the close to end the day just one cent higher... amazing.  If only I could interpret the FP's to understand the time frame on "when" they are going to get hit and "if" they will be an intraday high or low... or closing price?  But that's only for the true insiders I guess?  Anyway, it's over now and next up is another FP that showed afterhours yesterday... which looks to me like it's going to be hit right at the open today.  Does it mean we'll turn back down after hitting it or continue up?  Who knows?  So lets go to the charts for our clues on what will happen today...

The 60 minute chart for the ES Futures is showing strength this morning on its' MACD's as they rise up from almost -5.0 yesterday.  The 6 hour MACD (not shown) came down from a high of +7.5 area on Friday to +2.5 area yesterday and is trying to hook back up.  The 60 minute chart for the SPX Index got very high on its' MACD's last Friday, hitting +7.5 and has since dropped back down to almost zero with yesterdays' move down in the market.  But the longer term MACD on it (which is similar to the 4 or 6 hour chart) rose up oversold early last week (down around -3.0) to +1.0 on Friday and did a hook down with yesterdays drop but doesn't look quite finished yet on the upside.

What does all that mean you ask?  It's a guessing game where you have to mix the pieces together of the different time frames for both the SPX Cash Index and ES Futures Index.  I think it means we do a little dancing today not going up too much nor dropping too much as the charts are just not align together pointing the same direction.  I see no bullish divergence yet and quite frankly, it looks more like we get some bearish divergences setting up over the next several days before any bullish one forms.

That suggests on a bigger picture that we could see another move up past last Friday's high (doesn't have to make a double top or new all time high, but could), but all that does is setup negative divergence which tells me another drop is coming.  The "when" part I don't know as it could take awhile to form... maybe a week, don't know yet?  But it does NOT suggest that we are off to 2600 or 2700 on a break of a new all time high, but instead suggests a retest of the 2400 is very likely after this move up finishing setting up the negative divergence.  Again, I don't know if it's going to make it over Fridays' high, fall short, go on up for a double top, or even hit 2500+... but it should not be an easy move up like last Friday.  This time around it should have some choppy action in it.

I see no edge for bulls or bears today so I wouldn't short or go long but instead just wait for another setup to show up.  I will say that "if" the bulls would drop this market today and allow the bears to take it lower then yesterdays' low then some positive divergence would likely setup and allow a nice rally to start.  This is speculation on where I think the MACD's will end up at if we dropped to the 2430-2440 area today, so it's not written in stone of course.  Maybe it will take two days to setup?  Not sure, but that's the only way I can see any bullish (positive) divergence setup... otherwise this slow grind up will setup negative divergence in the coming days and the bears will have another shot later next week (or sooner?  depends on how fast it sets up?).  So, my plan for today is to do nothing... just wait and watch for either a nice bullish setup or a bearish one to appear.

ES Morning Update September 5th 2017

0

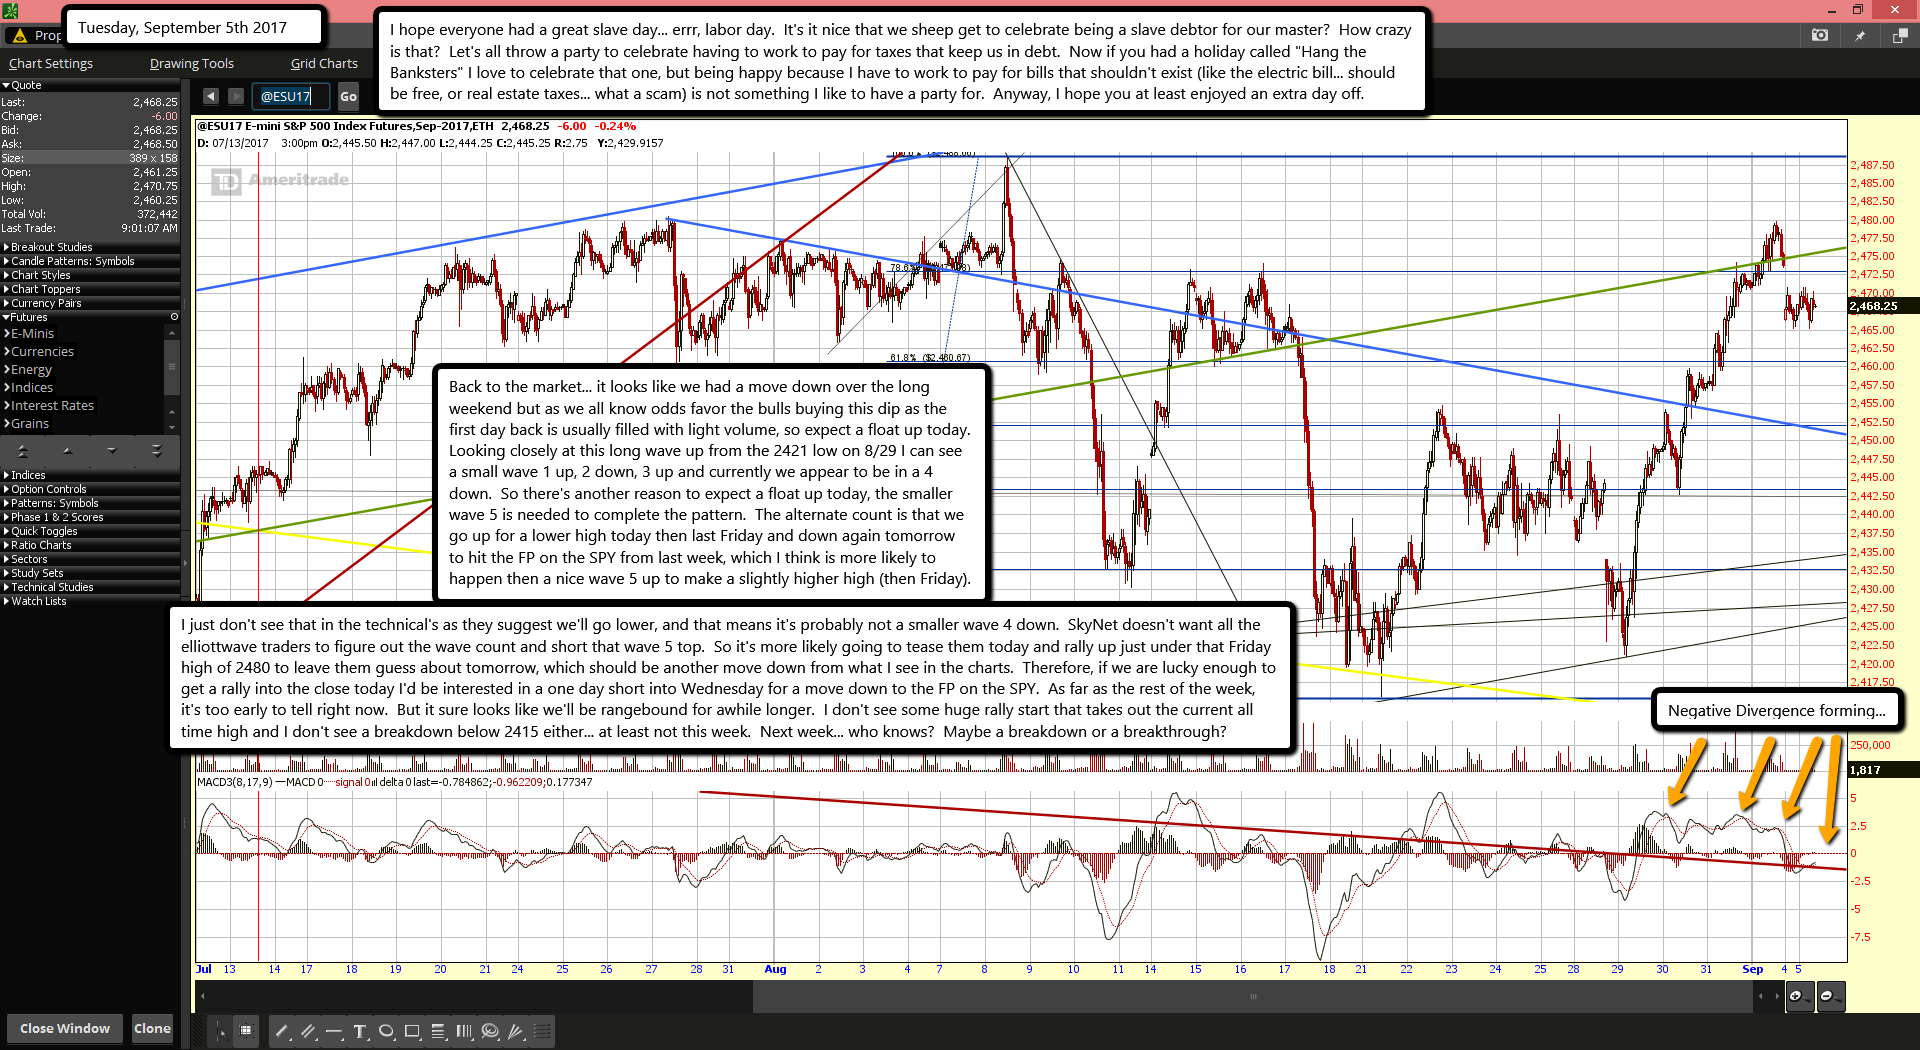
I hope everyone had a great slave day... errr, labor day.  It's it nice that we sheep get to celebrate being a slave debtor for our master?  How crazy is that?  Let's all throw a party to celebrate having to work to pay for taxes that keep us in debt.  Now if you had a holiday called "Hang the Banksters" I love to celebrate that one, but being happy because I have to work to pay for bills that shouldn't exist (like the electric bill... should be free, or real estate taxes... what a scam) is not something I like to have a party for.  Anyway, I hope you at least enjoyed an extra day off.

Back to the market... it looks like we had a move down over the long weekend but as we all know odds favor the bulls buying this dip as the first day back is usually filled with light volume, so expect a float up today.  Looking closely at this long wave up from the 2421 low on 8/29 I can see a small wave 1 up, 2 down, 3 up and currently we appear to be in a 4 down.  So there's another reason to expect a float up today, the smaller wave 5 is needed to complete the pattern.  The alternate count is that we go up for a lower high today then last Friday and down again tomorrow to hit the FP on the SPY from last week, which I think is more likely to happen then a nice wave 5 up to make a slightly higher high (then Friday).

I just don't see that in the technical's as they suggest we'll go lower, and that means it's probably not a smaller wave 4 down.  SkyNet doesn't want all the elliottwave traders to figure out the wave count and short that wave 5 top.  So it's more likely going to tease them today and rally up just under that Friday high of 2480 to leave them guess about tomorrow, which should be another move down from what I see in the charts.  Therefore, if we are lucky enough to get a rally into the close today I'd be interested in a one day short into Wednesday for a move down to the FP on the SPY.  As far as the rest of the week, it's too early to tell right now.  But it sure looks like we'll be rangebound for awhile longer.  I don't see some huge rally start that takes out the current all time high and I don't see a breakdown below 2415 either... at least not this week.  Next week... who knows?  Maybe a breakdown or a breakthrough?

ES Morning Update September 1st 2017

0

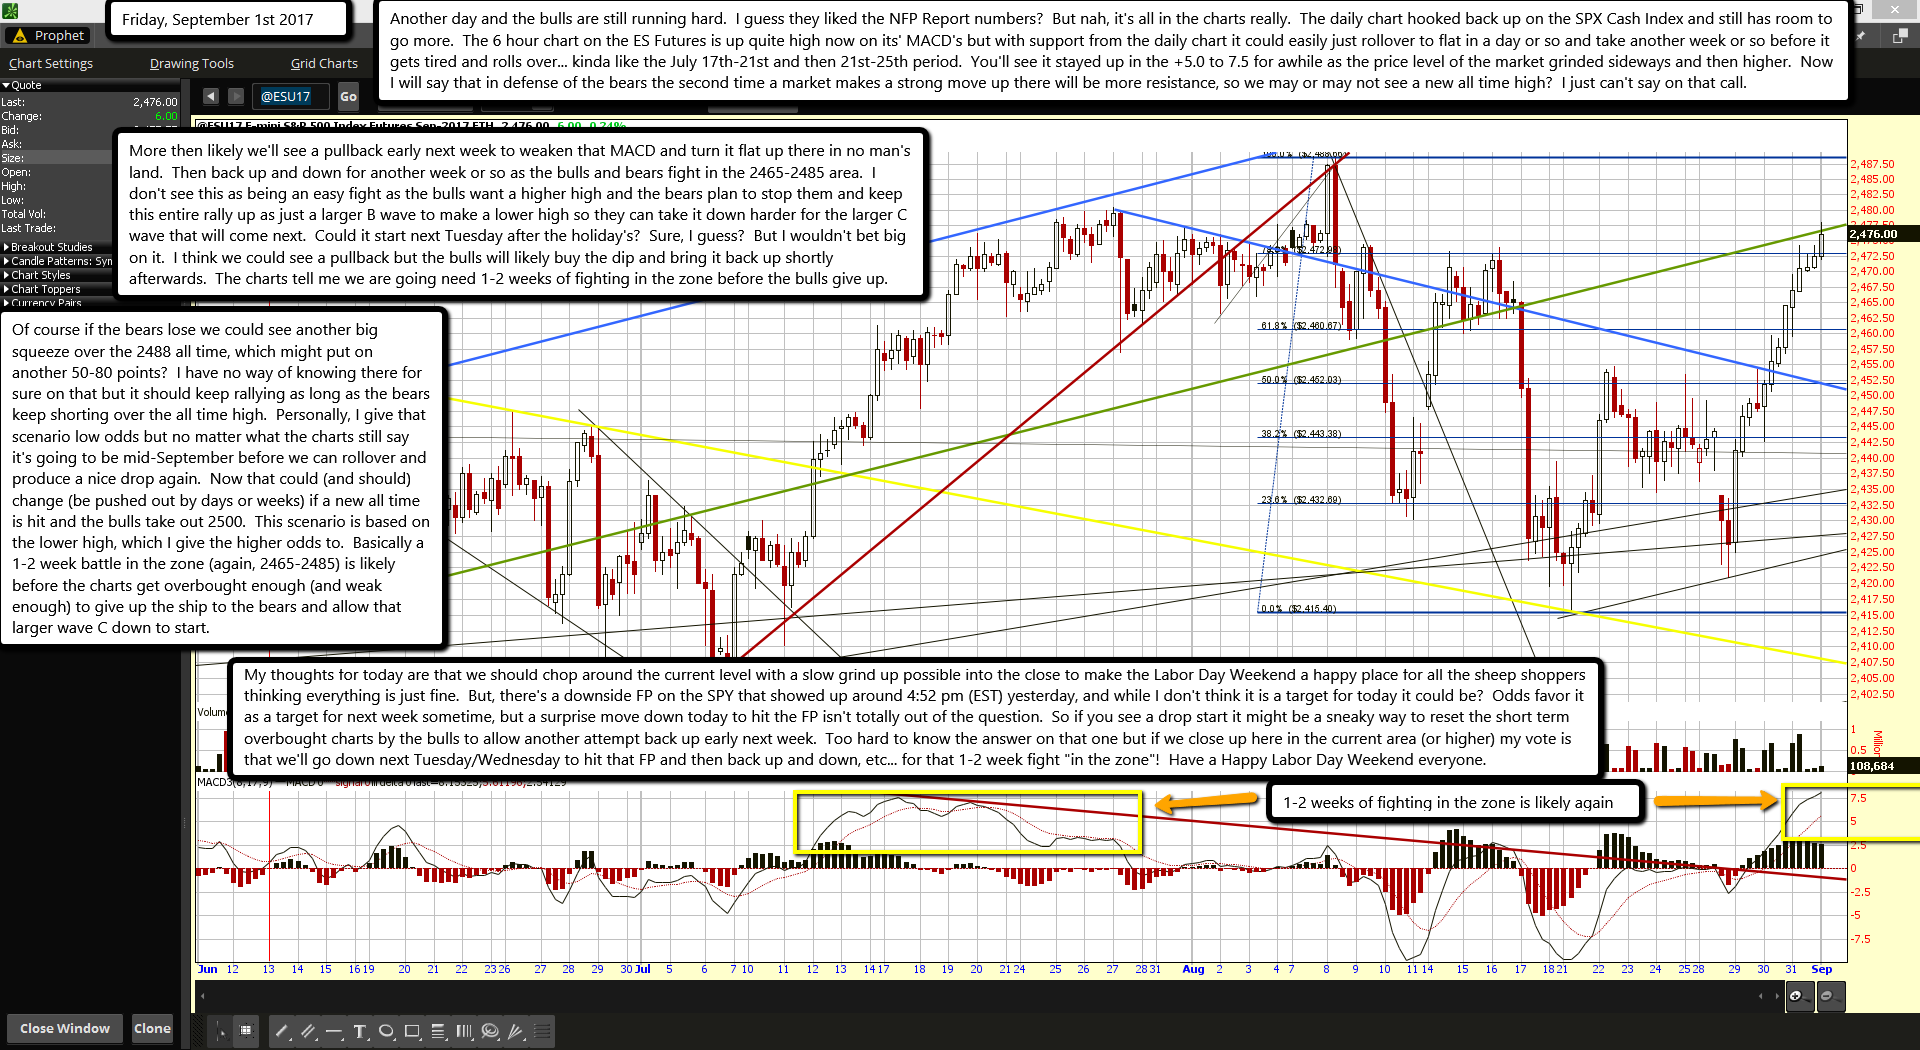
Another day and the bulls are still running hard.  I guess they liked the NFP Report numbers?  But nah, it's all in the charts really.  The daily chart hooked back up on the SPX Cash Index and still has room to go more.  The 6 hour chart on the ES Futures is up quite high now on its' MACD's but with support from the daily chart it could easily just rollover to flat in a day or so and take another week or so before it gets tired and rolls over... kinda like the July 17th-21st and then 21st-25th period.  You'll see it stayed up in the +5.0 to 7.5 for awhile as the price level of the market grinded sideways and then higher.  Now I will say that in defense of the bears the second time a market makes a strong move up there will be more resistance, so we may or may not see a new all time high?  I just can't say on that call.

More then likely we'll see a pullback early next week to weaken that MACD and turn it flat up there in no man's land.  Then back up and down for another week or so as the bulls and bears fight in the 2465-2485 area.  I don't see this as being an easy fight as the bulls want a higher high and the bears plan to stop them and keep this entire rally up as just a larger B wave to make a lower high so they can take it down harder for the larger C wave that will come next.  Could it start next Tuesday after the holiday's?  Sure, I guess?  But I wouldn't bet big on it.  I think we could see a pullback but the bulls will likely buy the dip and bring it back up shortly afterwards.  The charts tell me we are going need 1-2 weeks of fighting in the zone before the bulls give up.

Of course if the bears lose we could see another big squeeze over the 2488 all time, which might put on another 50-80 points?  I have no way of knowing there for sure on that but it should keep rallying as long as the bears keep shorting over the all time high.  Personally, I give that scenario low odds but no matter what the charts still say it's going to be mid-September before we can rollover and produce a nice drop again.  Now that could (and should) change (be pushed out by days or weeks) if a new all time is hit and the bulls take out 2500.  This scenario is based on the lower high, which I give the higher odds to.  Basically a 1-2 week battle in the zone (again, 2465-2485) is likely before the charts get overbought enough (and weak enough) to give up the ship to the bears and allow that larger wave C down to start.

My thoughts for today are that we should chop around the current level with a slow grind up possible into the close to make the Labor Day Weekend a happy place for all the sheep shoppers thinking everything is just fine.  But, there's a downside FP on the SPY that showed up around 4:52 pm (EST) yesterday, and while I don't think it is a target for today it could be?  Odds favor it as a target for next week sometime, but a surprise move down today to hit the FP isn't totally out of the question.  So if you see a drop start it might be a sneaky way to reset the short term overbought charts by the bulls to allow another attempt back up early next week.  Too hard to know the answer on that one but if we close up here in the current area (or higher) my vote is that we'll go down next Tuesday/Wednesday to hit that FP and then back up and down, etc... for that 1-2 week fight "in the zone"!  Have a Happy Labor Day Weekend everyone.

ES Morning Update August 31st 2017

0

Looks like the futures are grinding up again this morning, which is to be expected for a C wave (or wave 3?) up.  The small pullback before the open yesterday was some smaller degree wave 2 I'd guess, and that leaves us in the "squeeze" wave this morning.  The good ol' "smaller wave 3 up" inside "medium wave C up", and that should shake out some bears!  Naturally this wave counting is again subjective and simply my thoughts on how they align up with the technicals in the charts.  I said yesterday that the SPX and Futures just needed to align up together and we'd see a strong rally... well, they certainly did as the daily now (on the SPX) has hooked back up on its' MACD's and its' Histogram bars have went from -5.0 to just a hair under zero.  But, there's NO Positive Divergence yet on them and that suggests another move down will come at some point before they start making positive histogram bars like the prior +4.0 high in mid-July.

What does all that mean you ask?  It "suggests" to me (never really know for sure) that we will only make a lower high on this rally up and have another series of waves down that should take out the 2415 low.  It's basically supporting the medium ABC down for the larger A wave still being the move from the 8/8 high (2488) to the 8/21 low (2415), and the market now being in the medium ABC up to make the larger B wave.  So, a larger C wave down still looks to be setting up from what I currently see in the technical picture.  The weekly chart still has a bearish cross on its' MACD's too and negative divergence.  Considering we are in the spooky period of August to October where the bears wake up, I'd have to think the bulls will need positive divergence on the daily chart to move much higher.  This larger C wave is going to be hard too time but somewhere in the next week or so I'd think we'd top out on this medium C wave, thus ending the larger B... so somewhere in September we should start the next series of waves down.

Ok, for today what do I see? Probably a whole lot of nothing... meaning the bulls look tired up here but aren't ready to give up the new level they just aquired.  The 6 hour MACD looks strong still with no signs of rolling over.  In fact it might be next week before we see it give up some ground, which should then allow a pullback in the price level.  It's looking a lot like the time period between 7/11 and 7/27 where it kept grinding higher day after day before having a fast one day drop on 7/27, which was bought up just as fast and lead to the 8/8 high.  The bottom line here is that the bears are still not out of the woods thinking that this current all time high will hold.  There's no doubt that SkyNet will dance around that high in the coming days to lure in all the bulls expecting a new one and shake out the bears shorting.

It will boil down to SkyNet figuring out the number of bears short versus bulls long to determine if a new higher high will be needed or just a lower one.  I can only go with the current thoughts that based on the seasonality of the months we are going into that there will only be a lower high and a larger C wave is still coming.  If this were earlier summer, when the market is still bullish seasonality wise, I'd expect that wave count to be wrong and a new all time to be put in.  Whether we put in that new all time high on this trip up or not after the C wave down ends and November/December starts I do expect another higher high (a blow off top) in 2018 as I just don't see enough evidence to support the current high being the "all time high" that marks the start of the bear market.  I think another huge rally is needed to suck in the retail traders, but I'll save those thoughts for another time.

ES Morning Update August 30th 2017

0

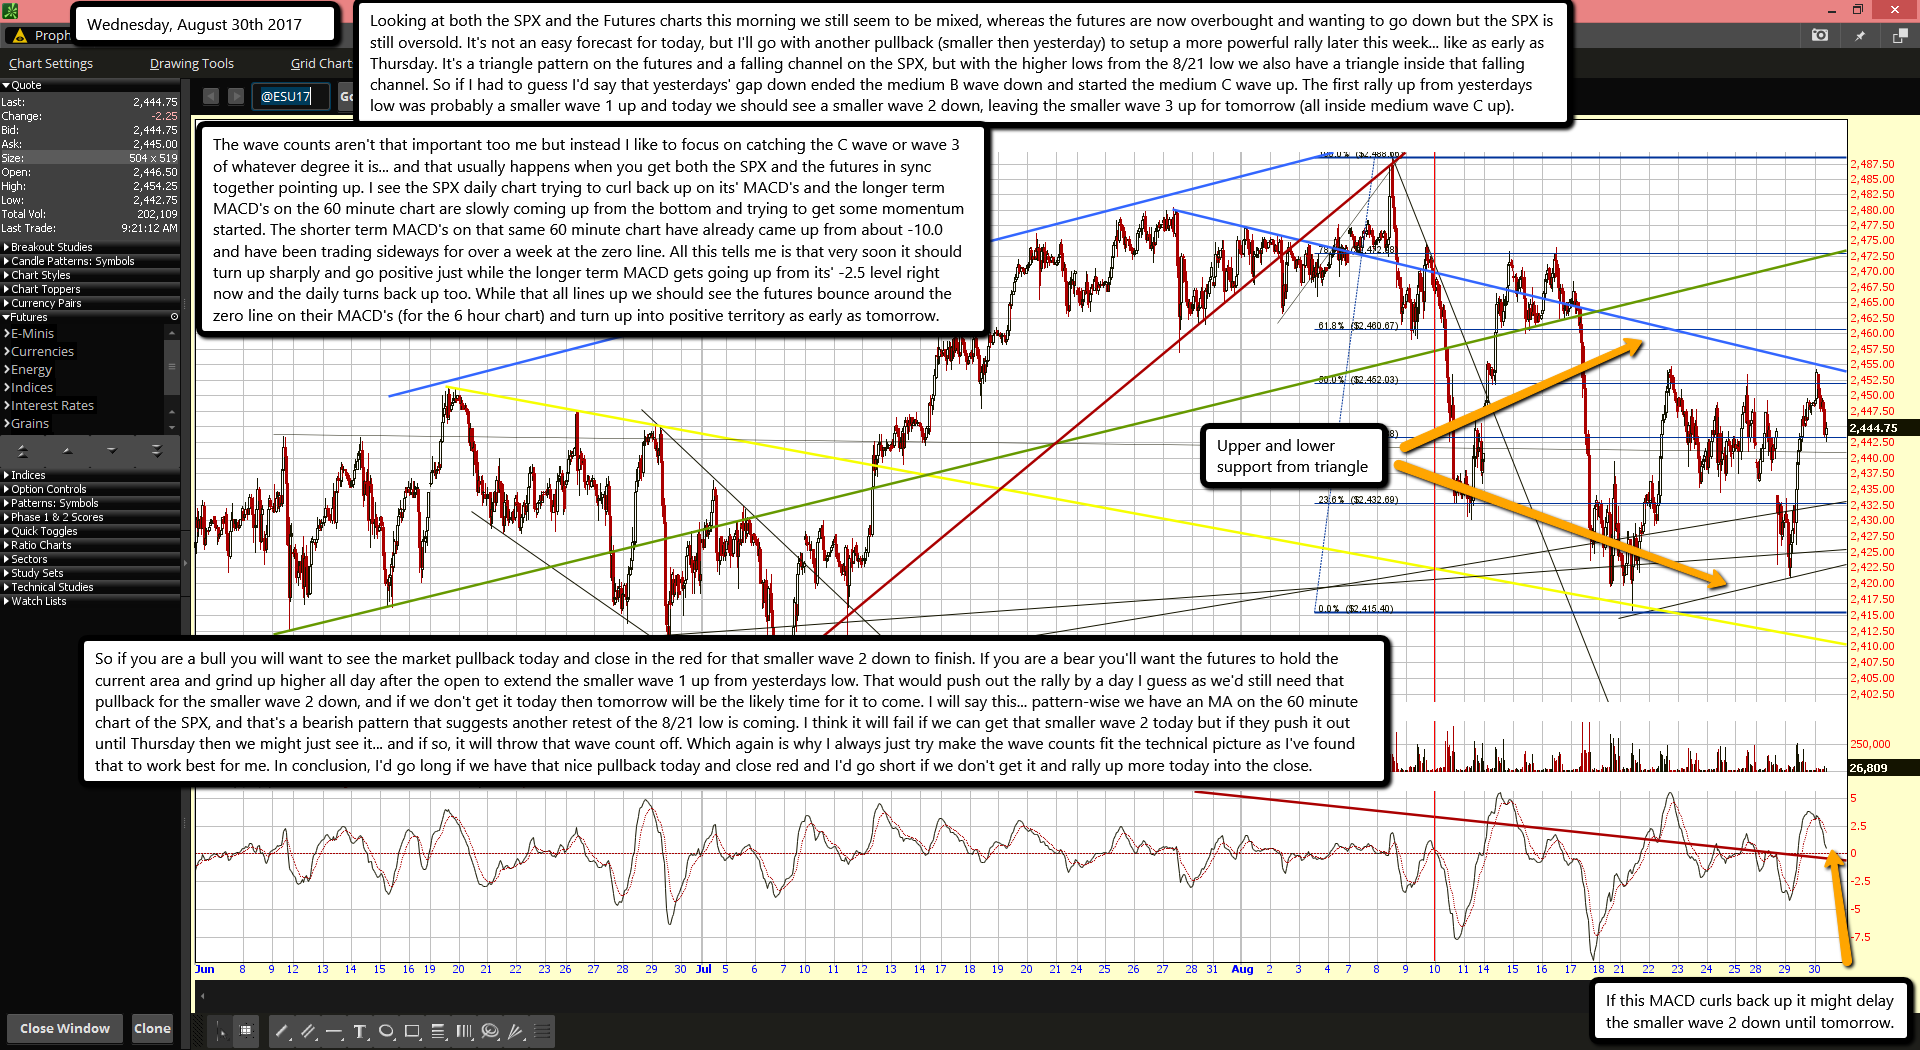
Looking at both the SPX and the Futures charts this morning we still seem to be mixed, whereas the futures are now overbought and wanting to go down but the SPX is still oversold. It's not an easy forecast for today, but I'll go with another pullback (smaller then yesterday) to setup a more powerful rally later this week... like as early as Thursday. It's a triangle pattern on the futures and a falling channel on the SPX, but with the higher lows from the 8/21 low we also have a triangle inside that falling channel. So if I had to guess I'd say that yesterdays' gap down ended the medium B wave down and started the medium C wave up. The first rally up from yesterdays low was probably a smaller wave 1 up and today we should see a smaller wave 2 down, leaving the smaller wave 3 up for tomorrow (all inside medium wave C up).

The wave counts aren't that important too me but instead I like to focus on catching the C wave or wave 3 of whatever degree it is... and that usually happens when you get both the SPX and the futures in sync together pointing up. I see the SPX daily chart trying to curl back up on its' MACD's and the longer term MACD's on the 60 minute chart are slowly coming up from the bottom and trying to get some momentum started. The shorter term MACD's on that same 60 minute chart have already came up from about -10.0 and have been trading sideways for over a week at the zero line. All this tells me is that very soon it should turn up sharply and go positive just while the longer term MACD gets going up from its' -2.5 level right now and the daily turns back up too. While that all lines up we should see the futures bounce around the zero line on their MACD's (for the 6 hour chart) and turn up into positive territory as early as tomorrow.

So if you are a bull you will want to see the market pullback today and close in the red for that smaller wave 2 down to finish. If you are a bear you'll want the futures to hold the current area and grind up higher all day after the open to extend the smaller wave 1 up from yesterdays low. That would push out the rally by a day I guess as we'd still need that pullback for the smaller wave 2 down, and if we don't get it today then tomorrow will be the likely time for it to come. I will say this... pattern-wise we have an MA on the 60 minute chart of the SPX, and that's a bearish pattern that suggests another retest of the 8/21 low is coming. I think it will fail if we can get that smaller wave 2 today but if they push it out until Thursday then we might just see it... and if so, it will throw that wave count off. Which again is why I always just try make the wave counts fit the technical picture as I've found that to work best for me. In conclusion, I'd go long if we have that nice pullback today and close red and I'd go short if we don't get it and rally up more today into the close.

ES Morning Update August 29th 2017

0

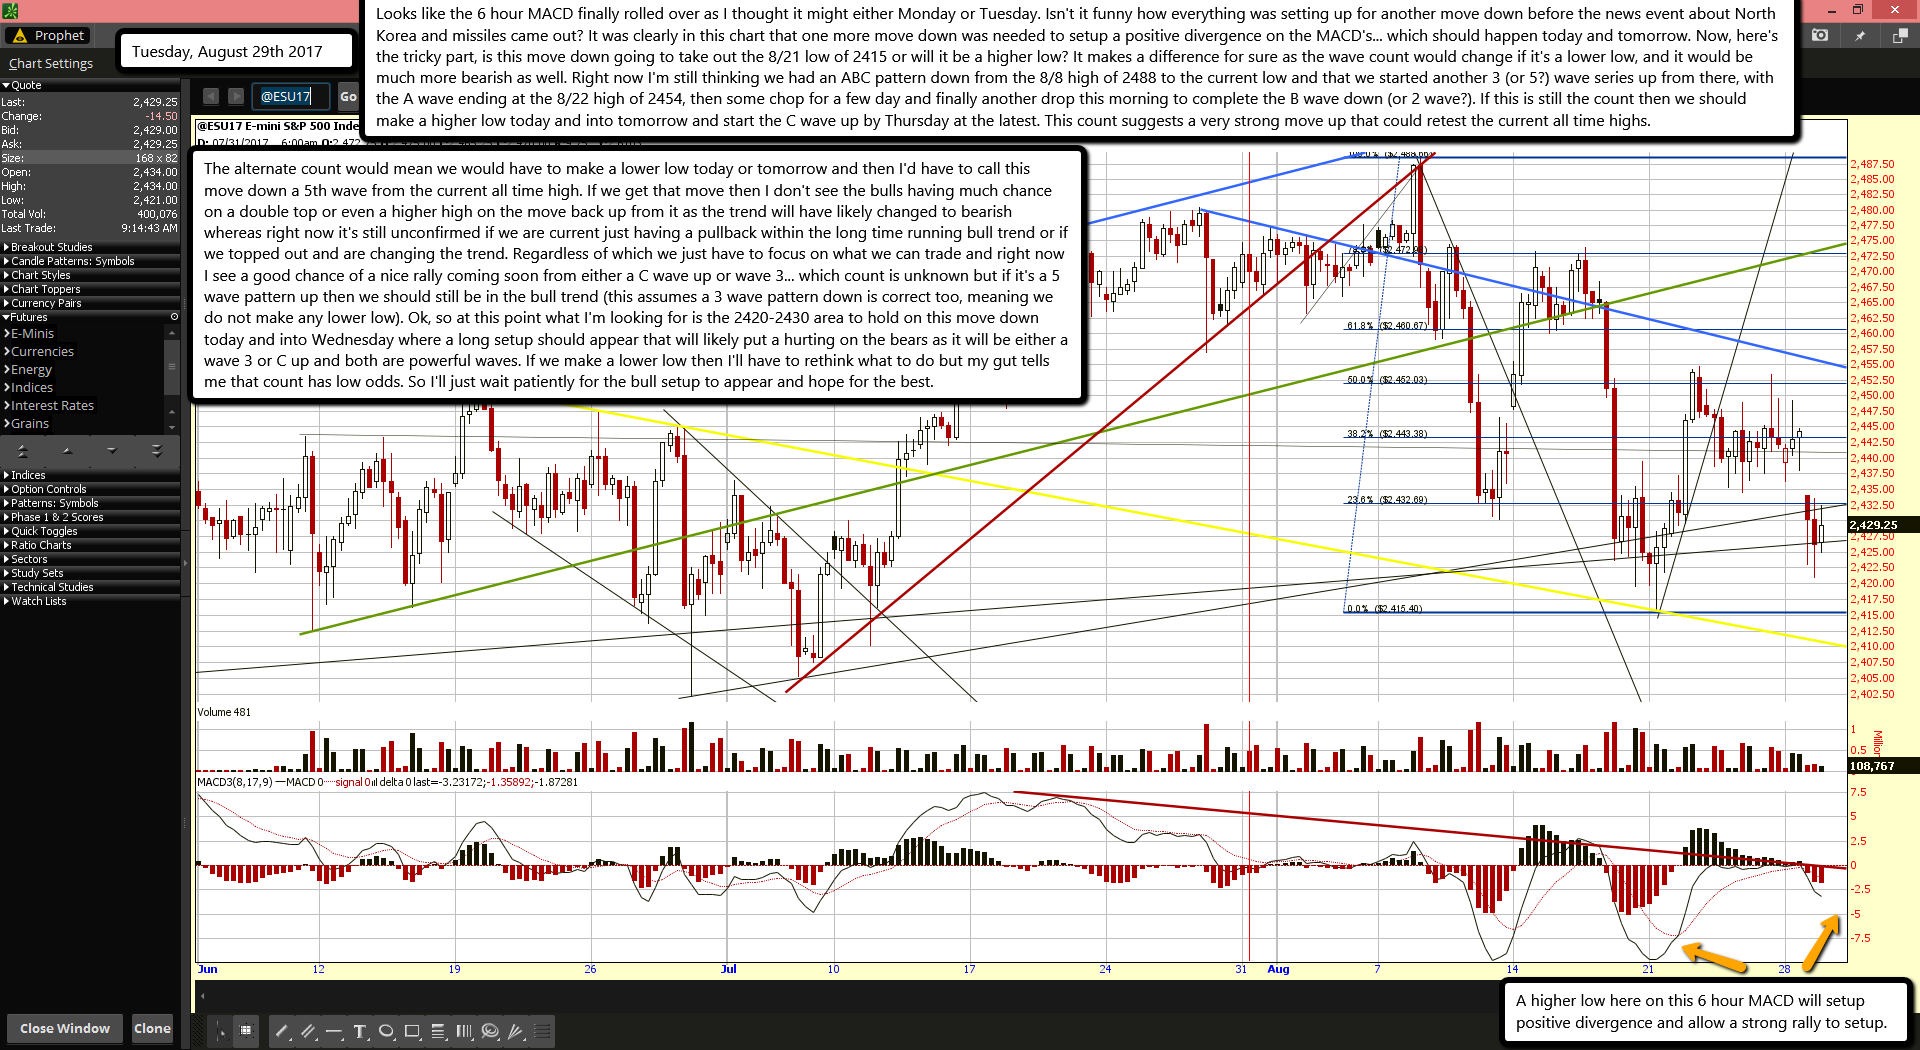
Looks like the 6 hour MACD finally rolled over as I thought it might either Monday or Tuesday. Isn't it funny how everything was setting up for another move down before the news event about North Korea and missiles came out? It was clearly in this chart that one more move down was needed to setup a positive divergence on the MACD's... which should happen today and tomorrow. Now, here's the tricky part, is this move down going to take out the 8/21 low of 2415 or will it be a higher low? It makes a difference for sure as the wave count would change if it's a lower low, and it would be much more bearish as well. Right now I'm still thinking we had an ABC pattern down from the 8/8 high of 2488 to the current low and that we started another 3 (or 5?) wave series up from there, with the A wave ending at the 8/22 high of 2454, then some chop for a few day and finally another drop this morning to complete the B wave down (or 2 wave?). If this is still the count then we should make a higher low today and into tomorrow and start the C wave up by Thursday at the latest. This count suggests a very strong move up that could retest the current all time highs.

The alternate count would mean we would have to make a lower low today or tomorrow and then I'd have to call this move down a 5th wave from the current all time high. If we get that move then I don't see the bulls having much chance on a double top or even a higher high on the move back up from it as the trend will have likely changed to bearish whereas right now it's still unconfirmed if we are current just having a pullback within the long time running bull trend or if we topped out and are changing the trend. Regardless of which we just have to focus on what we can trade and right now I see a good chance of a nice rally coming soon from either a C wave up or wave 3... which count is unknown but if it's a 5 wave pattern up then we should still be in the bull trend (this assumes a 3 wave pattern down is correct too, meaning we do not make any lower low). Ok, so at this point what I'm looking for is the 2420-2430 area to hold on this move down today and into Wednesday where a long setup should appear that will likely put a hurting on the bears as it will be either a wave 3 or C up and both are powerful waves. If we make a lower low then I'll have to rethink what to do but my gut tells me that count has low odds. So I'll just wait patiently for the bull setup to appear and hope for the best.

ES Morning Update August 25th 2017

0

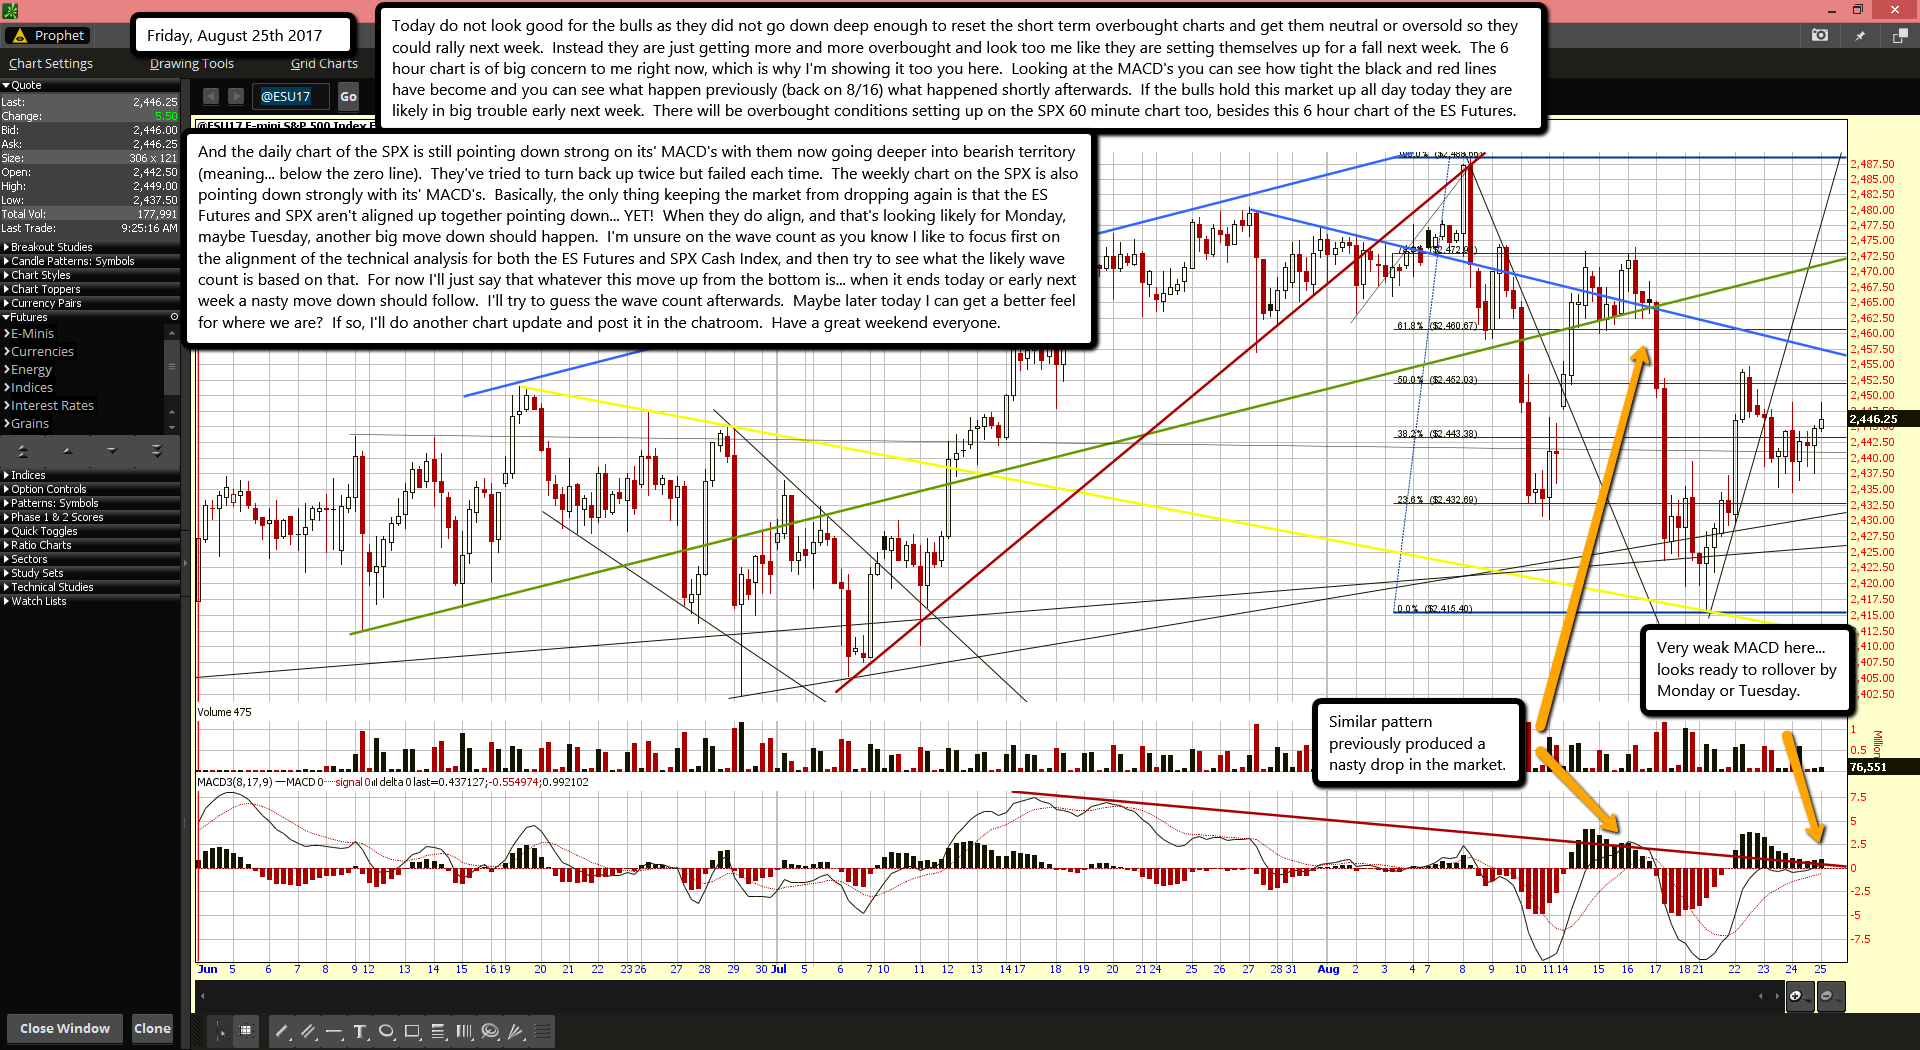
Today do not look good for the bulls as they did not go down deep enough to reset the short term overbought charts and get them neutral or oversold so they could rally next week.  Instead they are just getting more and more overbought and look too me like they are setting themselves up for a fall next week.  The 6 hour chart is of big concern to me right now, which is why I'm showing it too you here.  Looking at the MACD's you can see how tight the black and red lines have become and you can see what happen previously (back on 8/16) what happened shortly afterwards.  If the bulls hold this market up all day today they are likely in big trouble early next week.  There will be overbought conditions setting up on the SPX 60 minute chart too, besides this 6 hour chart of the ES Futures.

And the daily chart of the SPX is still pointing down strong on its' MACD's with them now going deeper into bearish territory (meaning... below the zero line).  They've tried to turn back up twice but failed each time.  The weekly chart on the SPX is also pointing down strongly with its' MACD's.  Basically, the only thing keeping the market from dropping again is that the ES Futures and SPX aren't aligned up together pointing down... YET!  When they do align, and that's looking likely for Monday, maybe Tuesday, another big move down should happen.  I'm unsure on the wave count as you know I like to focus first on the alignment of the technical analysis for both the ES Futures and SPX Cash Index, and then try to see what the likely wave count is based on that.  For now I'll just say that whatever this move up from the bottom is... when it ends today or early next week a nasty move down should follow.  I'll try to guess the wave count afterwards.  Maybe later today I can get a better feel for where we are?  If so, I'll do another chart update and post it in the chatroom.  Have a great weekend everyone.

ES Morning Update August 24th 2017

0

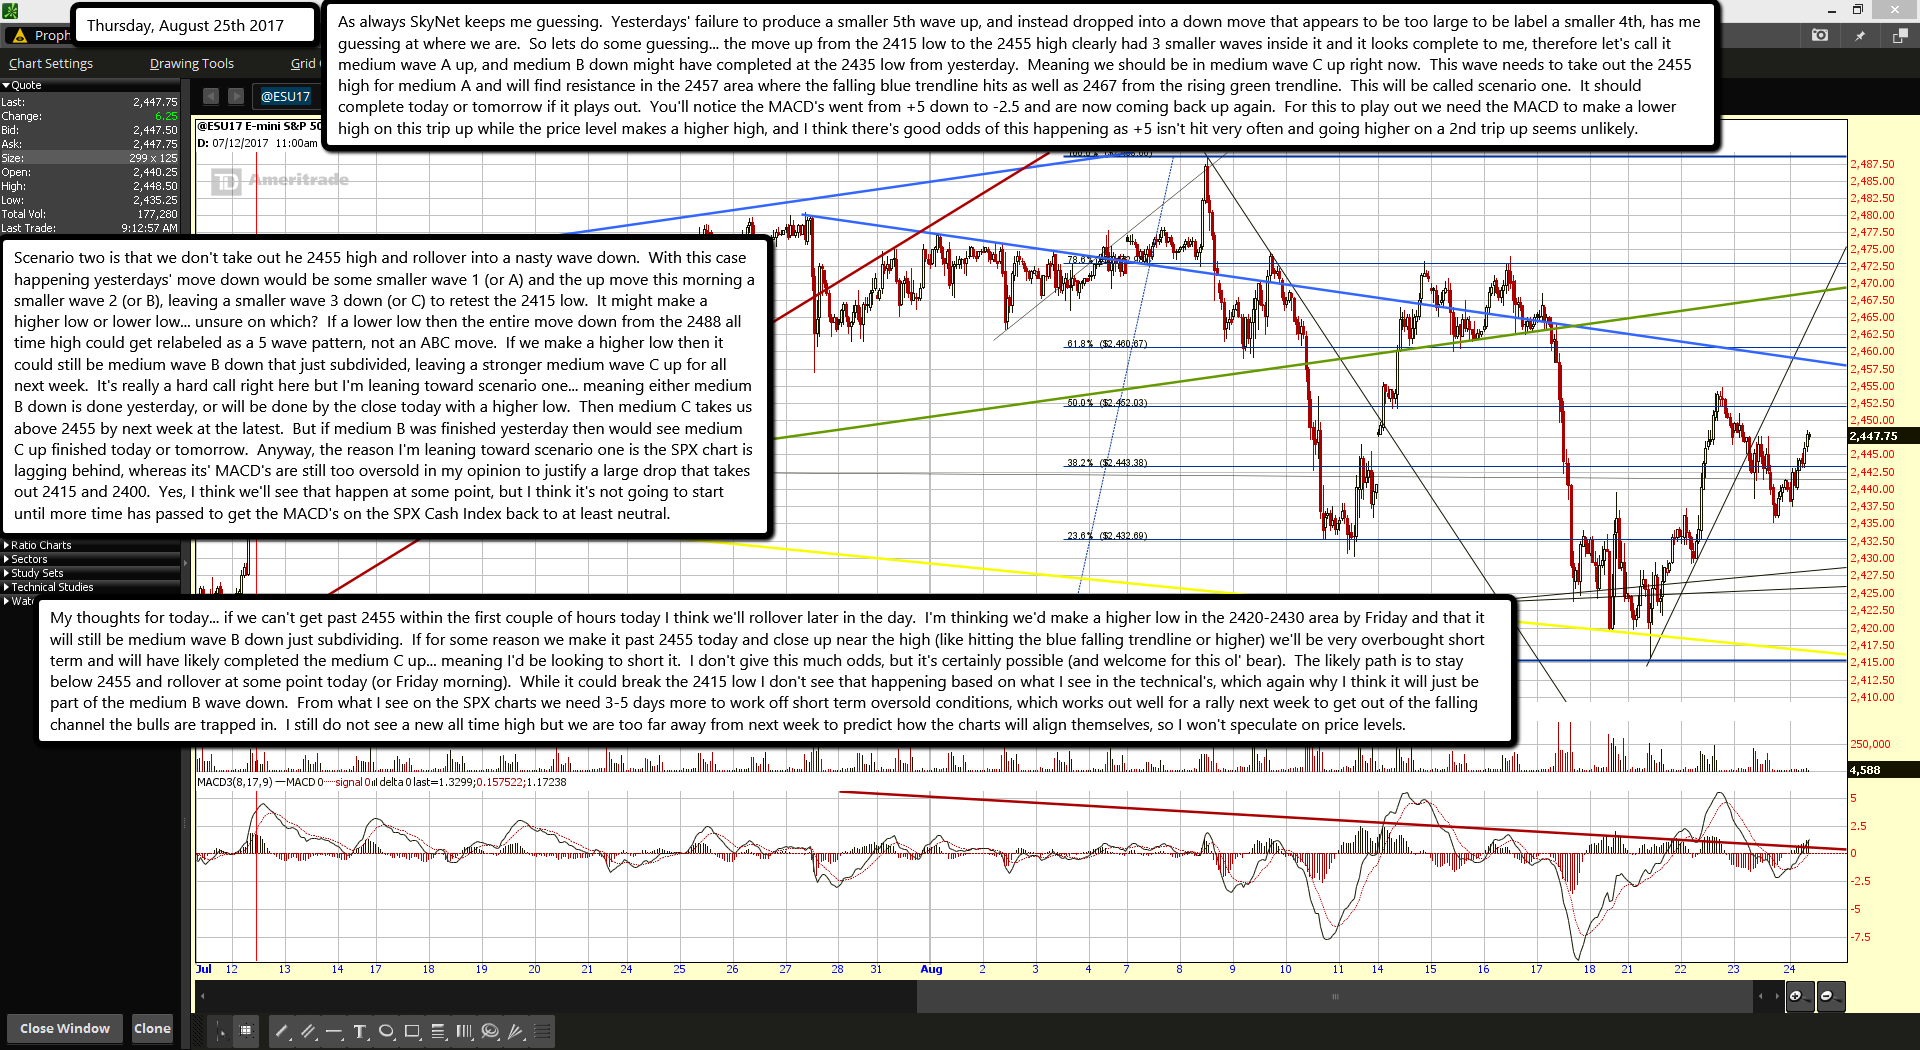
As always SkyNet keeps me guessing.  Yesterdays' failure to produce a smaller 5th wave up, and instead dropped into a down move that appears to be too large to be label a smaller 4th, has me guessing at where we are.  So lets do some guessing... the move up from the 2415 low to the 2455 high clearly had 3 smaller waves inside it and it looks complete to me, therefore let's call it medium wave A up, and medium B down might have completed at the 2435 low from yesterday.  Meaning we should be in medium wave C up right now.  This wave needs to take out the 2455 high for medium A and will find resistance in the 2457 area where the falling blue trendline hits as well as 2467 from the rising green trendline.  This will be called scenario one.  It should complete today or tomorrow if it plays out.  You'll notice the MACD's went from +5 down to -2.5 and are now coming back up again.  For this to play out we need the MACD to make a lower high on this trip up while the price level makes a higher high, and I think there's good odds of this happening as +5 isn't hit very often and going higher on a 2nd trip up seems unlikely.

Scenario two is that we don't take out he 2455 high and rollover into a nasty wave down.  With this case happening yesterdays' move down would be some smaller wave 1 (or A) and the up move this morning a smaller wave 2 (or B), leaving a smaller wave 3 down (or C) to retest the 2415 low.  It might make a higher low or lower low... unsure on which?  If a lower low then the entire move down from the 2488 all time high could get relabeled as a 5 wave pattern, not an ABC move.  If we make a higher low then it could still be medium wave B down that just subdivided, leaving a stronger medium wave C up for all next week.  It's really a hard call right here but I'm leaning toward scenario one... meaning either medium B down is done yesterday, or will be done by the close today with a higher low.  Then medium C takes us above 2455 by next week at the latest.  But if medium B was finished yesterday then would see medium C up finished today or tomorrow.  Anyway, the reason I'm leaning toward scenario one is the SPX chart is lagging behind, whereas its' MACD's are still too oversold in my opinion to justify a large drop that takes out 2415 and 2400.  Yes, I think we'll see that happen at some point, but I think it's not going to start until more time has passed to get the MACD's on the SPX Cash Index back to at least neutral.

My thoughts for today... if we can't get past 2455 within the first couple of hours today I think we'll rollover later in the day.  I'm thinking we'd make a higher low in the 2420-2430 area by Friday and that it will still be medium wave B down just subdividing.  If for some reason we make it past 2455 today and close up near the high (like hitting the blue falling trendline or higher) we'll be very overbought short term and will have likely completed the medium C up... meaning I'd be looking to short it.  I don't give this much odds, but it's certainly possible (and welcome for this ol' bear).  The likely path is to stay below 2455 and rollover at some point today (or Friday morning).  While it could break the 2415 low I don't see that happening based on what I see in the technical's, which again why I think it will just be part of the medium B wave down.  From what I see on the SPX charts we need 3-5 days more to work off short term oversold conditions, which works out well for a rally next week to get out of the falling channel the bulls are trapped in.  I still do not see a new all time high but we are too far away from next week to predict how the charts will align themselves, so I won't speculate on price levels.

ES Morning Update August 23rd 2017

0

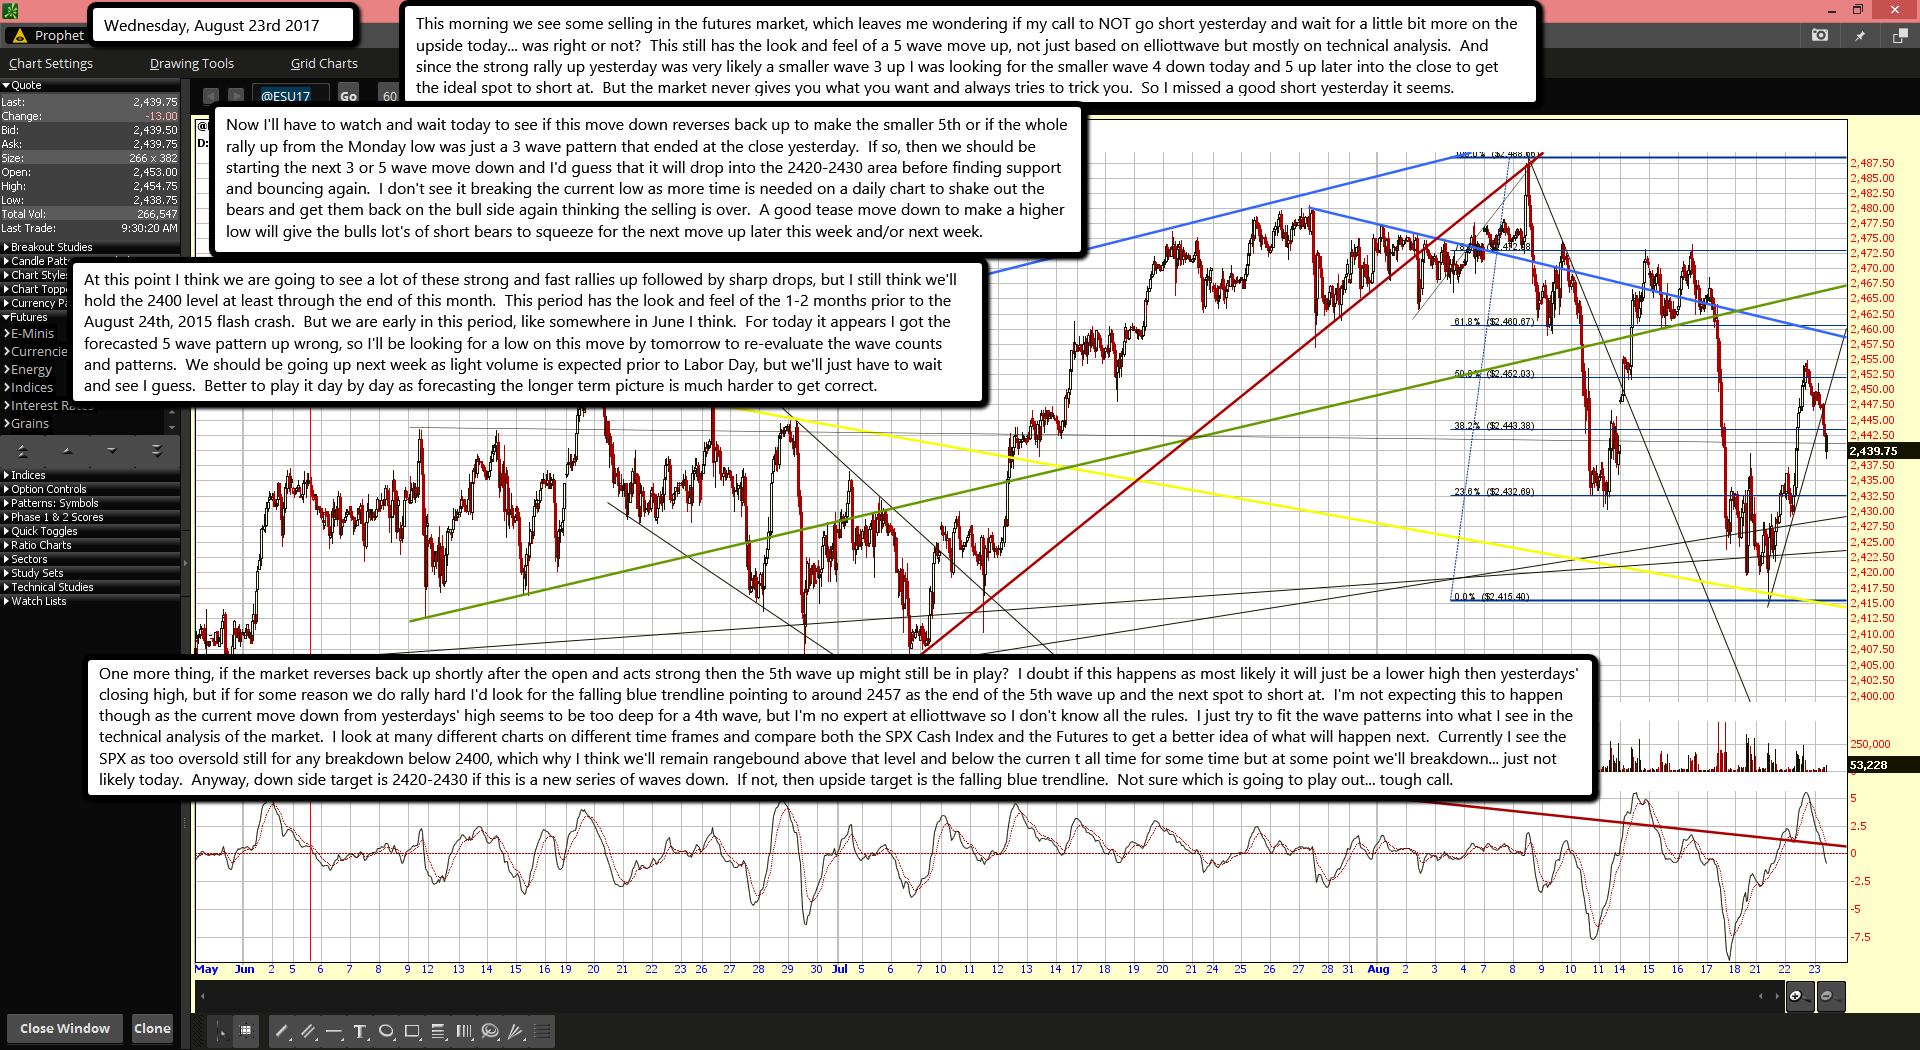
This morning we see some selling in the futures market, which leaves me wondering if my call to NOT go short yesterday and wait for a little bit more on the upside today... was right or not?  This still has the look and feel of a 5 wave move up, not just based on elliottwave but mostly on technical analysis.  And since the strong rally up yesterday was very likely a smaller wave 3 up I was looking for the smaller wave 4 down today and 5 up later into the close to get the ideal spot to short at.  But the market never gives you what you want and always tries to trick you.  So I missed a good short yesterday it seems.

Now I'll have to watch and wait today to see if this move down reverses back up to make the smaller 5th or if the whole rally up from the Monday low was just a 3 wave pattern that ended at the close yesterday.  If so, then we should be starting the next 3 or 5 wave move down and I'd guess that it will drop into the 2420-2430 area before finding support and bouncing again.  I don't see it breaking the current low as more time is needed on a daily chart to shake out the bears and get them back on the bull side again thinking the selling is over.  A good tease move down to make a higher low will give the bulls lot's of short bears to squeeze for the next move up later this week and/or next week.

At this point I think we are going to see a lot of these strong and fast rallies up followed by sharp drops, but I still think we'll hold the 2400 level at least through the end of this month.  This period has the look and feel of the 1-2 months prior to the August 24th, 2015 flash crash.  But we are early in this period, like somewhere in June I think.  For today it appears I got the forecasted 5 wave pattern up wrong, so I'll be looking for a low on this move by tomorrow to re-evaluate the wave counts and patterns.  We should be going up next week as light volume is expected prior to Labor Day, but we'll just have to wait and see I guess.  Better to play it day by day as forecasting the longer term picture is much harder to get correct.

One more thing, if the market reverses back up shortly after the open and acts strong then the 5th wave up might still be in play?  I doubt if this happens as most likely it will just be a lower high then yesterdays' closing high, but if for some reason we do rally hard I'd look for the falling blue trendline pointing to around 2457 as the end of the 5th wave up and the next spot to short at.  I'm not expecting this to happen though as the current move down from yesterdays' high seems to be too deep for a 4th wave, but I'm no expert at elliottwave so I don't know all the rules.  I just try to fit the wave patterns into what I see in the technical analysis of the market.  I look at many different charts on different time frames and compare both the SPX Cash Index and the Futures to get a better idea of what will happen next.  Currently I see the SPX as too oversold still for any breakdown below 2400, which why I think we'll remain rangebound above that level and below the curren t all time for some time but at some point we'll breakdown... just not likely today.  Anyway, down side target is 2420-2430 if this is a new series of waves down.  If not, then upside target is the falling blue trendline.  Not sure which is going to play out... tough call.

ES Morning Update August 22nd 2017

0

Yesterdays' dip down to make another lower low now appears to me like it completed the tiny 5th wave, meaning todays' move up is likely a new series of "up" wave as the "down" waves appear done for awhile.  Now the BIG Picture:  We had a big A wave (which I'm going to label "medium") from the 2488 high to the 2430 low, then the medium B up ended at 2473, with the medium C down "likely" ending at yesterday's low 2416.  That whole ABC down is of course some larger wave... whether it's a A or wave 1 down, I don't know, and it's not important.  But we'll call it a large A as most bear moves (the big ones) happen in 3 waves versus 5 for the bulls.  Now if we are starting the large B wave up then it should also breakdown into smaller waves too.

The first medium wave A up could break down into 5 smaller waves and we just can't count them accurately until it's over with.  Guessing at the wave count is just that... guessing.  The medium C up (when it comes later this week or more likely... later next week, will probably take us up to retest the 2473 high and end the ABC wave series to make the larger B wave up.  That suggests that the next series of waves down will break the 2400 support as it should be a large C wave.  When that move ends we will have completed a large ABC down to make some even bigger A wave down.  We'll call that a giant A, which suggests a giant B up into early October.  After that we'll see a giant C wave down, which could also be a crash wave if this all sets up as I think it might.

Back in 2015 a few months before the August 24th crash I was counting the wave patterns and this series of waves is eerily the same.  The difference of back then versus now was that the flash crash produced a Primary Wave 4 down only, so the bull market still had the Primary Wave 5 up yet to come.  This time around the Primary Wave 5 appears to have ended at the most recent highs this year.  That further suggests that we are about to enter a 2-3 year bear market should this play out as all the bull "Primary Waves" up will be completed leaving a set of three "Primary Waves" down for the bears.  Now no one really knows for sure any of this and while I find Elliottwave (EW) helpful in forecasting "possible" moves in the future, by NO means is it something that you can expect to be perfect.  There are just too many different wave counts that happen after the current one fails.  So this count is just speculation based on many factors not related to EW, one is technical analysis, with historical pattern for the fall season, as well as presidential cycles.  So don't hold my feet to the fire on this call but right now it does look like we are setting up for a crash in October.

For the short term I don't see today as starting any really strong move up as at most it's just a small wave 1 in a medium A up, so I wouldn't touch it on the long side until at least the smaller wave 2 down is complete.  Then maybe one could ride up the smaller wave 3 up in the medium A as that should be a nice move.  I could see it setting up by the close today and starting Wednesday morning.  Then the smaller 4 and 5 would complete that medium A up on Wednesday or possibly Thursday.  A pullback into Friday for the medium B down would be expected next, followed by the medium C up next week going into the Labor day weekend.  Perfect setup for the following week to start the next big move down.  That's the short term forecast.  I'll give updates in the chatroom and the next daily morning update as I see things change.

PS:  Here's the image of the wave count I did right before the August 24th, 2015 flash crash

You'll notice that I only forecasted a move down to about 2002.11 for the C wave (aka, the "crash" wave), which was obviously too conservative as the actually low that followed was 1867 SPX.

Back then I also had "passport codes" pointing to August 24th, 2015... which I only talk about now in the chatroom.  And yes, I have another code for this October.

Soros continues betting against US stock market despite mounting losses

0

US regulatory filings show George Soros is still investing in options that will profit him only if the stock market they are linked to declines in value.

Soros Fund Management held put options on PowerShares QQQ Trust, SPDR S&P 500 ETF, iShares Russell 2000 ETF as of June 30. Each is an exchange-traded fund that tracks a broad US stock market index. The bet is worth $1.8 billion. Soros stands to profit only if the stock market falls.

Michael Vachon, a spokesman for Soros Fund Management, said the company would not comment on the filing.

Soros continues betting against US stock market despite mounting losses

In January, Soros said "it's impossible to predict" US President Donald Trump's actions, but he was nonetheless sure the market would plunge.

Soon after the election, Soros lost over $1 billion by taking a short position on the market. While Soros called Trump a "would-be dictator," and predicted uncertainty and a sell-off after his win, the markets have rallied significantly.

The US S&P500 index is up over 10 percent this year, the Nasdaq is up 18 percent, and Dow Jones is up over 11 percent.

Soros is best known for making a fortune on his short play against the British pound. On 16 September 1992, Soros' $10 billion short position on the pound forced the Bank of England to withdraw Sterling from the European Exchange Rate Mechanism (ERM) after it was unable to keep the currency above its agreed lower limit in the ERM.

ES Morning Update August 21st 2017

0

Another weekend gone by and almost another month.  It's hard to believe sometimes that's it August... time just passes by so quickly these days.  Anyway, we have pretty much a flat open today.  Looking at the charts, especially the 6 hour, they look just about ready to rally.  But, the first attempt might not hold so I'm not jumping on the bull train just yet.  In fact, the move down from 2473 (which is likely a larger C wave) appears to have 5 waves in it already, so we might start the first wave up today in a series of waves, and the low could be in?  I say that with caution as I'm not 100% sure the wave 4 and 5 of the larger C down are complete yet.  If the wave 4 up ended at 2439 then the 5 down has hit 2419 so far and may or may not be finished?  That 5th wave down might subdivide into smaller waves for all I know?  There's great support around the even number of 2400 and possibly the market wants to get a little closer to it so it can lure in the most bears before a strong bounce starts.

So today and tomorrow might be choppy around this area and actually go a bit lower.  But by the middle of the week I do expect a rally to start that should be a powerful squeeze.  In fact I could see another attempt for a higher high, but I don't think it will happen.  More likely a move above the 2473 area by a little to run some stops the bears have there, but below the 2488 all time high.  It's common for "them" run the market up in front of Labor Day, which is next Monday September 4th.  The market will be closed then making it a long 3 day weekend starting this Friday after the close.  So a rally to run out the bears is very likely, and we all know how powerful these rallies are.  It's never about reality, it's always about forcing bears to cover their shorts that causes such violent and fast moves up.

But don't fall for the "bull market is back" trap as this move up is likely a trap for the bulls and should be shorted in my opinion.  So for today, I'm looking (and trying to get a feel for...) the end of the 5th wave down inside the larger wave C down.  A rally looks really close now and should start today or tomorrow I think.  I also think it will take out the 2473 area to clean out the bears.  It might take all week but by Friday I expect higher prices and today or early tomorrow I can only see another 10-15 points on the downside as possible... maybe none?  Have fun staring at the moon tonight...

ES Morning Update August 18th 2017

0

Ok gang, we finally got our C wave down it seems.  I was hoping for a little higher but didn't get it.  Today I have no clue as to what will happen.  Generally speaking, after a large down day, if the market wants to continue down there will be a "pause" day where it trades mostly sideways.  But when it wants to end the down move we tend to see a big squeeze up on the bears.  Probably is, I think most bears missed this whole move.  And I think that even if have a strong move up the larger time frame charts (like the weekly and daily) are still putting downward pressure on the market... along with the historical data for the month of August, September and October.

So even if they do have a strong rally today and maybe into Monday or Tuesday I still think the trend has changed and that it will just be a bounce before another large drop happens.  For now, the high looks to be put in for at least the next few months.  Maybe we have a Christmas Rally to put in a new higher high again but that's too far away to speculate on at this point. For today I'll just sit on my hands and hope for a rally to short.  I won't risk a long here and it's too "short term" oversold to short.  Plus I saw a "possible" target via a FP on the SPY afterhours yesterday and I'd love to see it rally up to that level by the close.

But to be more realistic I half to think we'll just have a "pause" day where there's small rallies and small moves down but at the end of the day we'll still be about flat from yesterdays' close.  I'm rooting for the bulls here as I think next week is going to be bear heaven and I'd like a great spot to short at.  Unfortunately, SkyNet rarely gives the bears anything they want.  Good luck to us all and lets bunker down for a possible crash next week.  I hope it doesn't happen but you never know for sure.  Have a great weekend everyone and if you have any information you'd like to share please stop by the chatroom.  It's still free.  And of course if you just want to get the latest thoughts I have throughout the day it's all posted in the chatroom.

s2Member®