Saturday, July 25, 2026
Home Blog Page 55

ES Morning Update November 2nd 2017

0

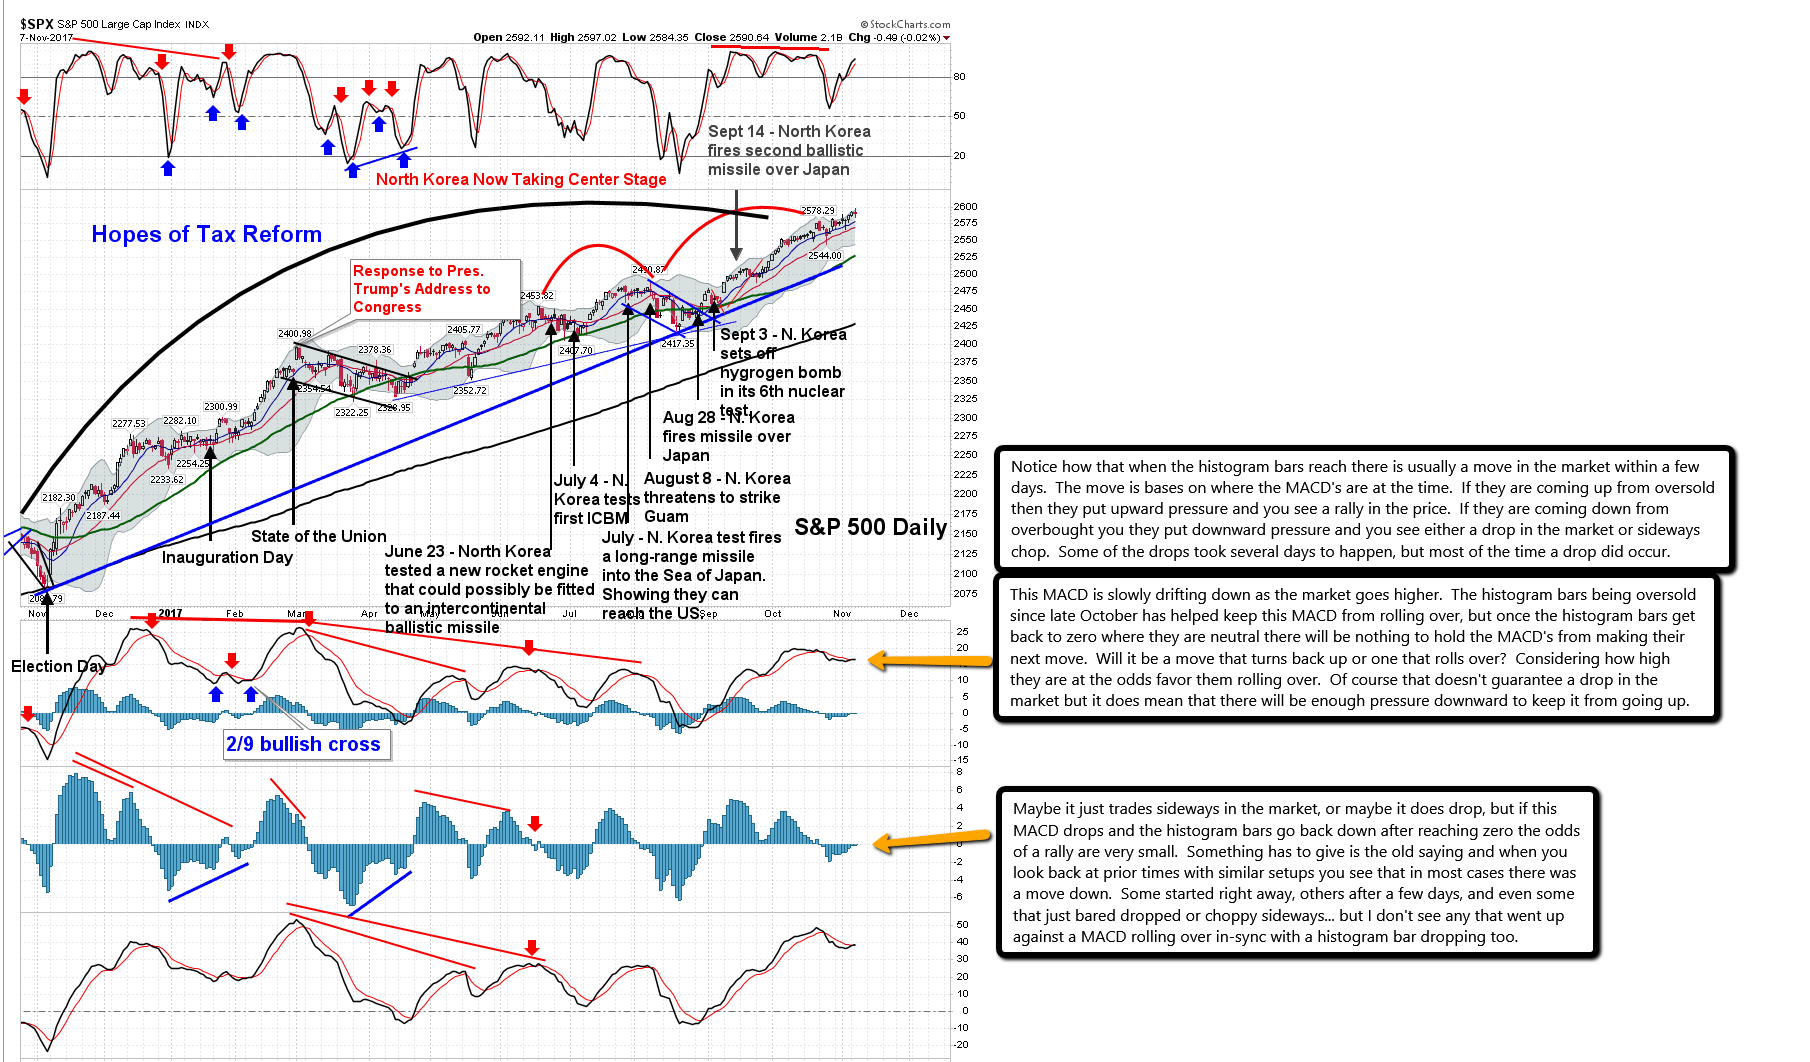
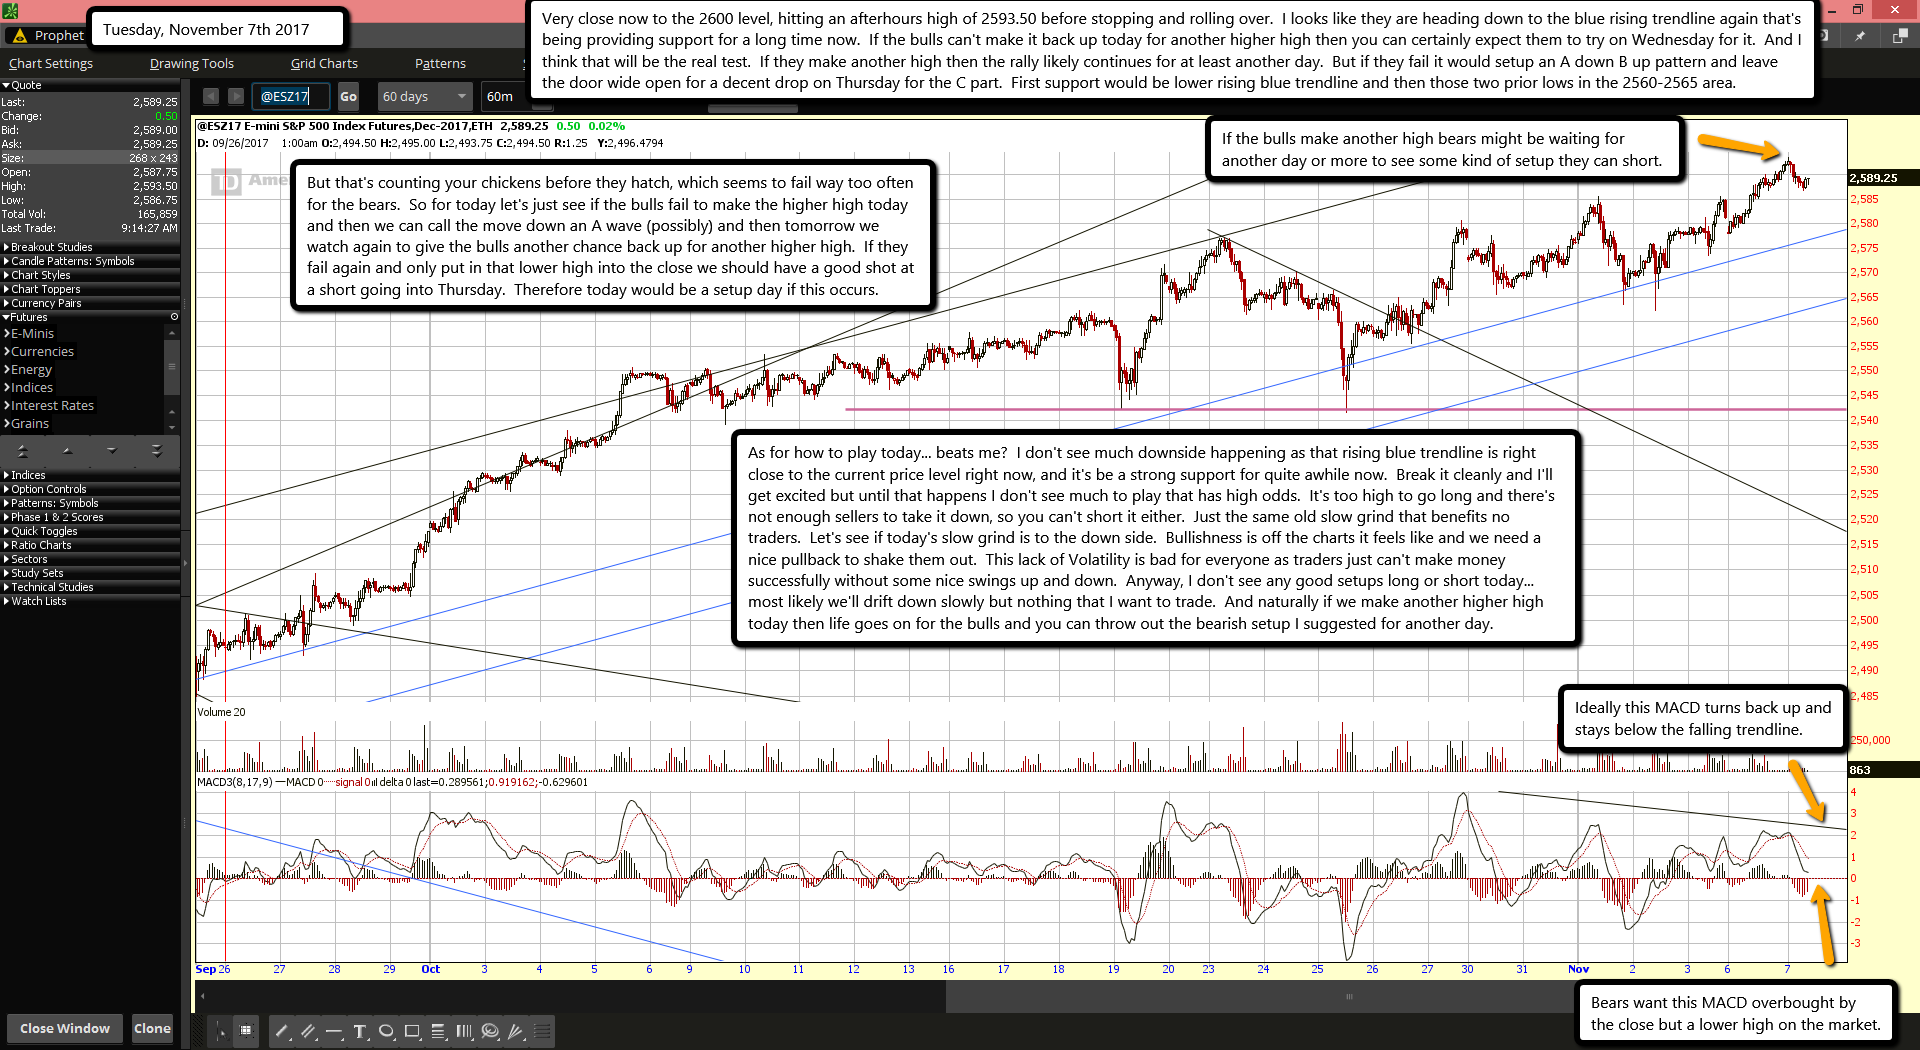
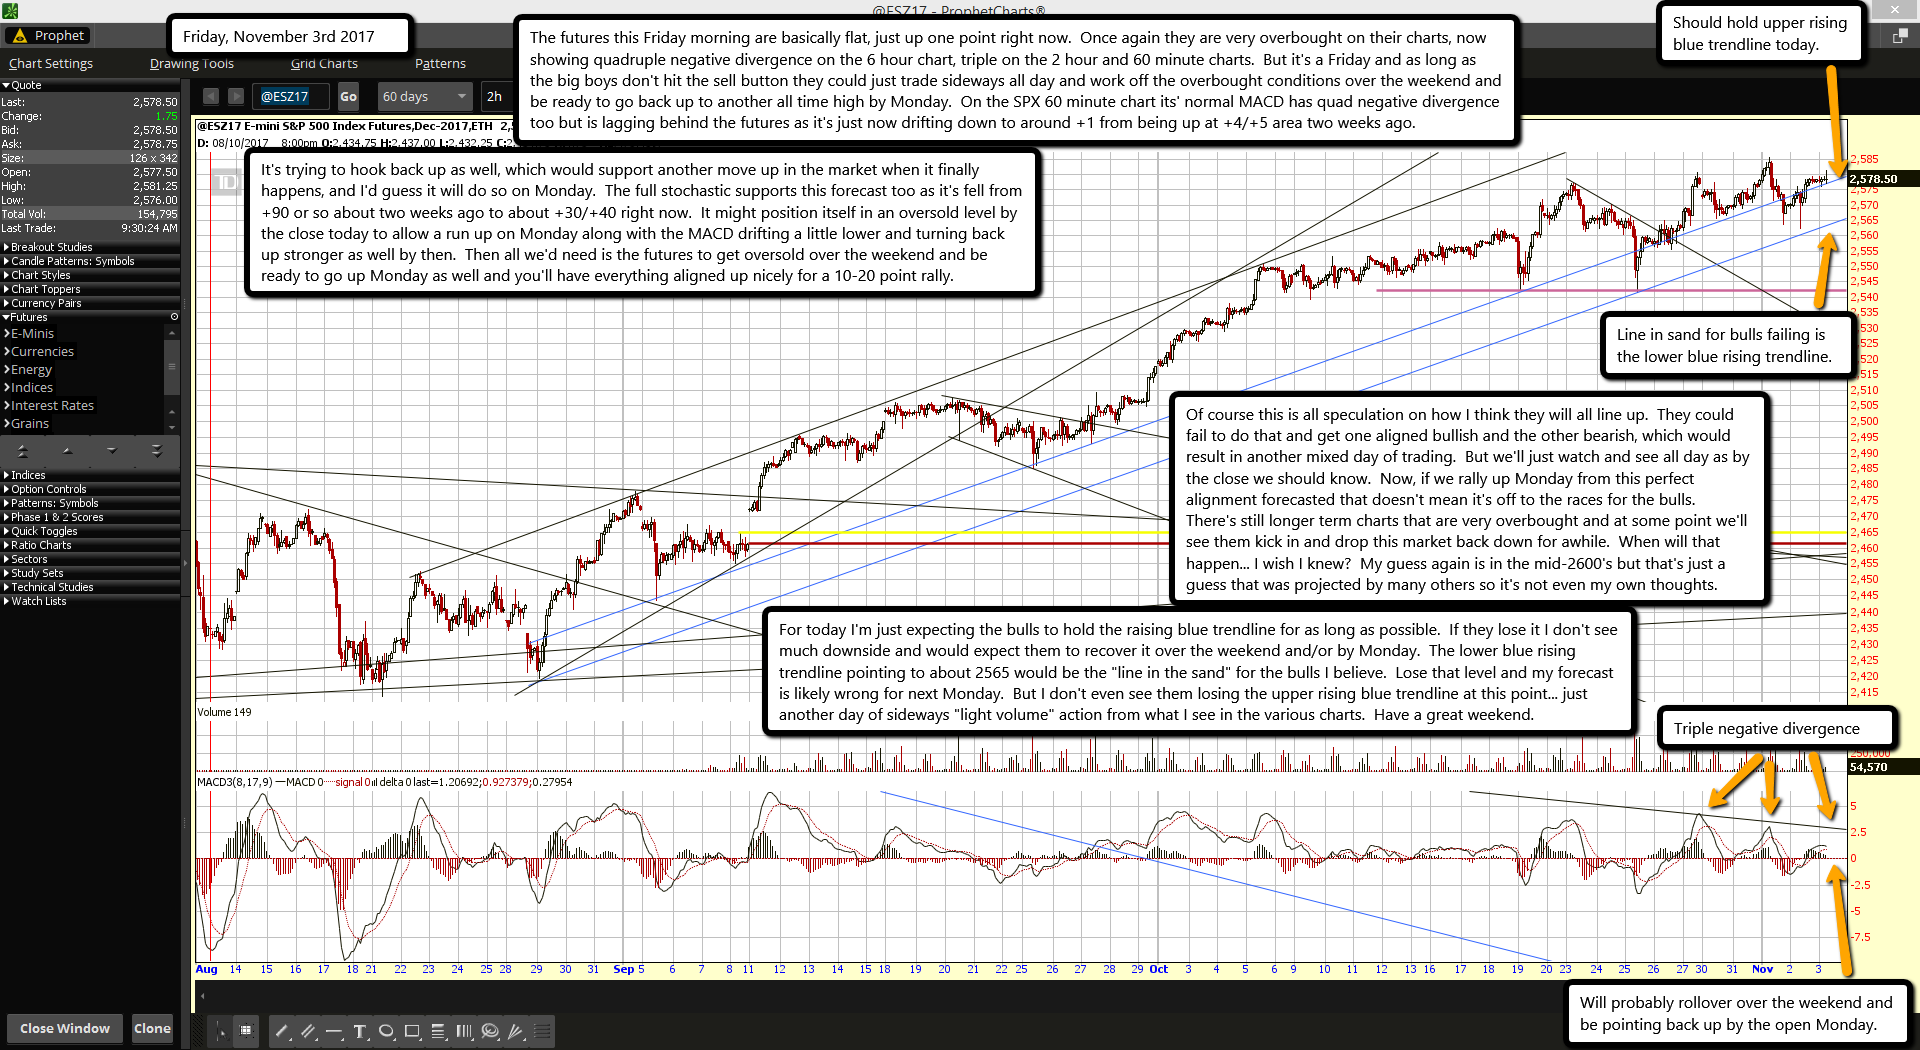
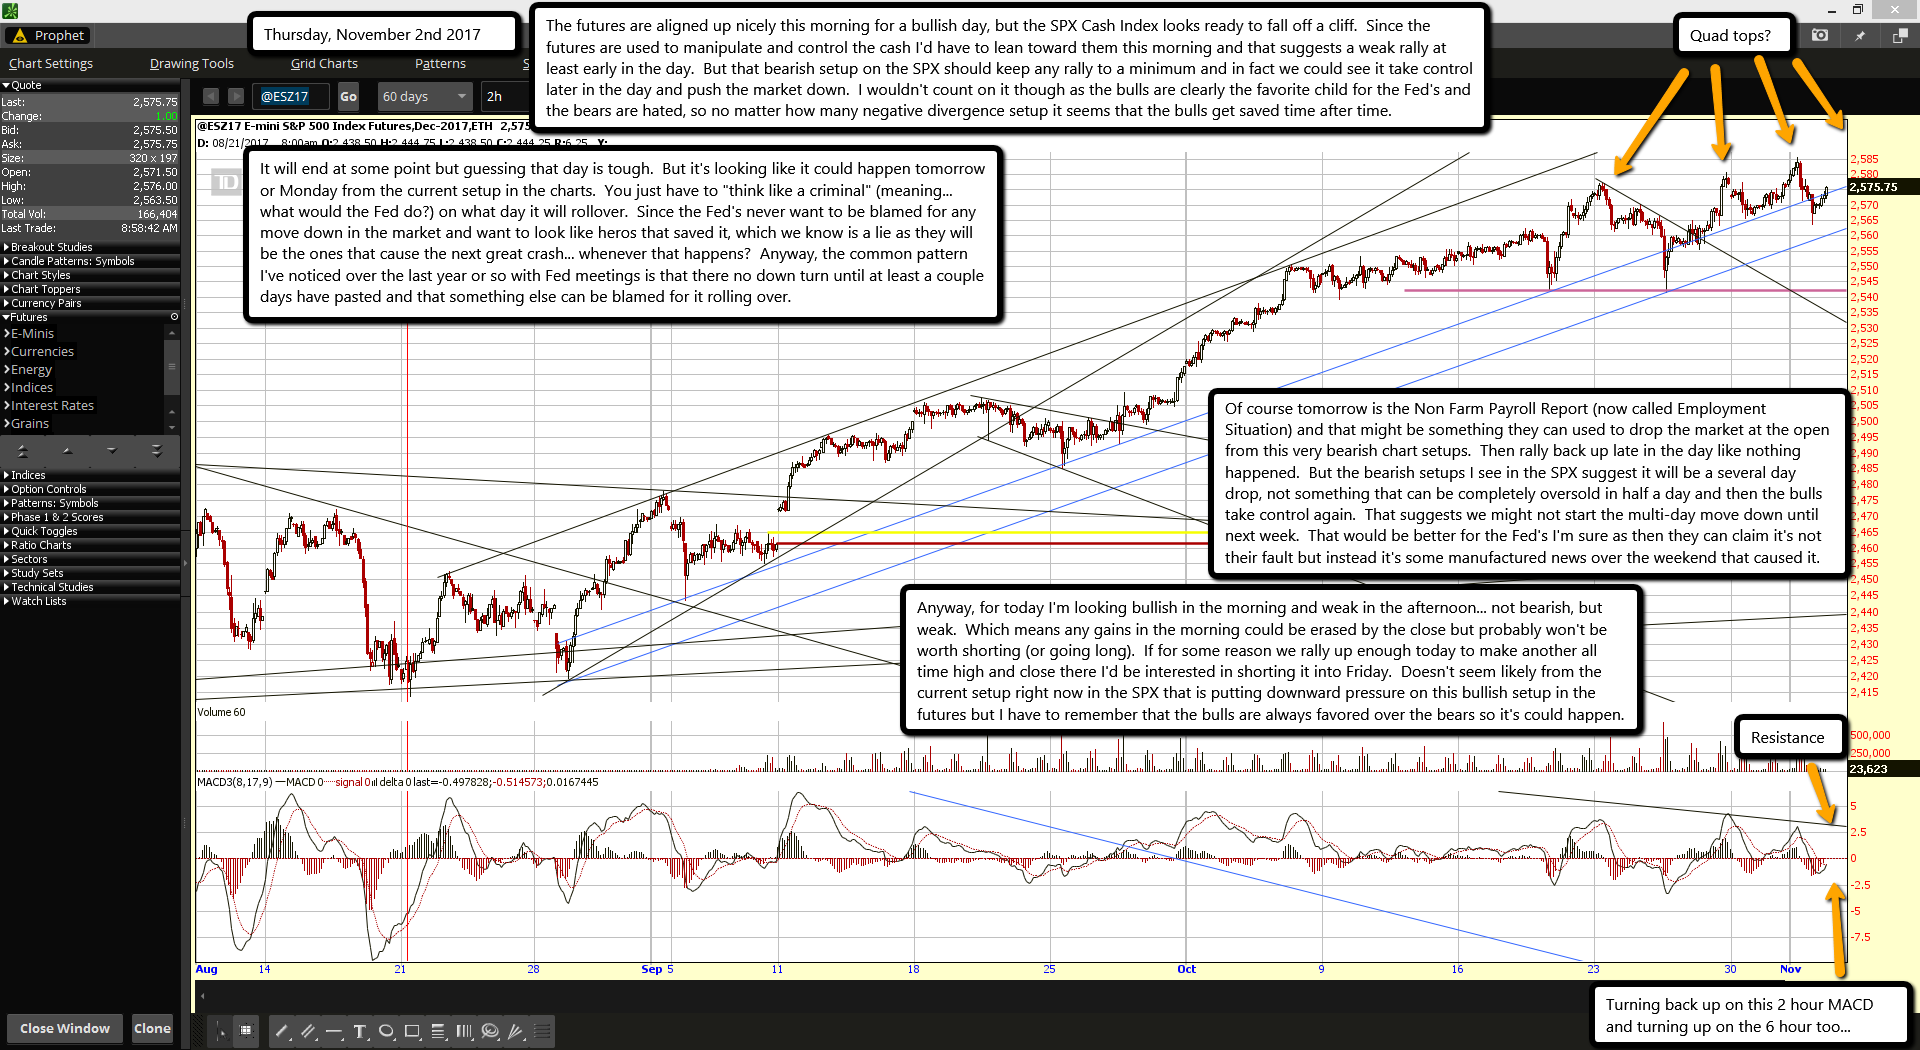
The futures are aligned up nicely this morning for a bullish day, but the SPX Cash Index looks ready to fall off a cliff.  Since the futures are used to manipulate and control the cash I'd have to lean toward them this morning and that suggests a weak rally at least early in the day.  But that bearish setup on the SPX should keep any rally to a minimum and in fact we could see it take control later in the day and push the market down.  I wouldn't count on it though as the bulls are clearly the favorite child for the Fed's and the bears are hated, so no matter how many negative divergence setup it seems that the bulls get saved time after time.

It will end at some point but guessing that day is tough.  But it's looking like it could happen tomorrow or Monday from the current setup in the charts.  You just have to "think like a criminal" (meaning... what would the Fed do?) on what day it will rollover.  Since the Fed's never want to be blamed for any move down in the market and want to look like heros that saved it, which we know is a lie as they will be the ones that cause the next great crash... whenever that happens?  Anyway, the common pattern I've noticed over the last year or so with Fed meetings is that there no down turn until at least a couple days have pasted and that something else can be blamed for it rolling over.

Of course tomorrow is the Non Farm Payroll Report (now called Employment Situation) and that might be something they can used to drop the market at the open from this very bearish chart setups.  Then rally back up late in the day like nothing happened.  But the bearish setups I see in the SPX suggest it will be a several day drop, not something that can be completely oversold in half a day and then the bulls take control again.  That suggests we might not start the multi-day move down until next week.  That would be better for the Fed's I'm sure as then they can claim it's not their fault but instead it's some manufactured news over the weekend that caused it.

Anyway, for today I'm looking bullish in the morning and weak in the afternoon... not bearish, but weak.  Which means any gains in the morning could be erased by the close but probably won't be worth shorting (or going long).  If for some reason we rally up enough today to make another all time high and close there I'd be interested in shorting it into Friday.  Doesn't seem likely from the current setup right now in the SPX that is putting downward pressure on this bullish setup in the futures but I have to remember that the bulls are always favored over the bears so it's could happen.

ES Morning Update November 1st 2017

0

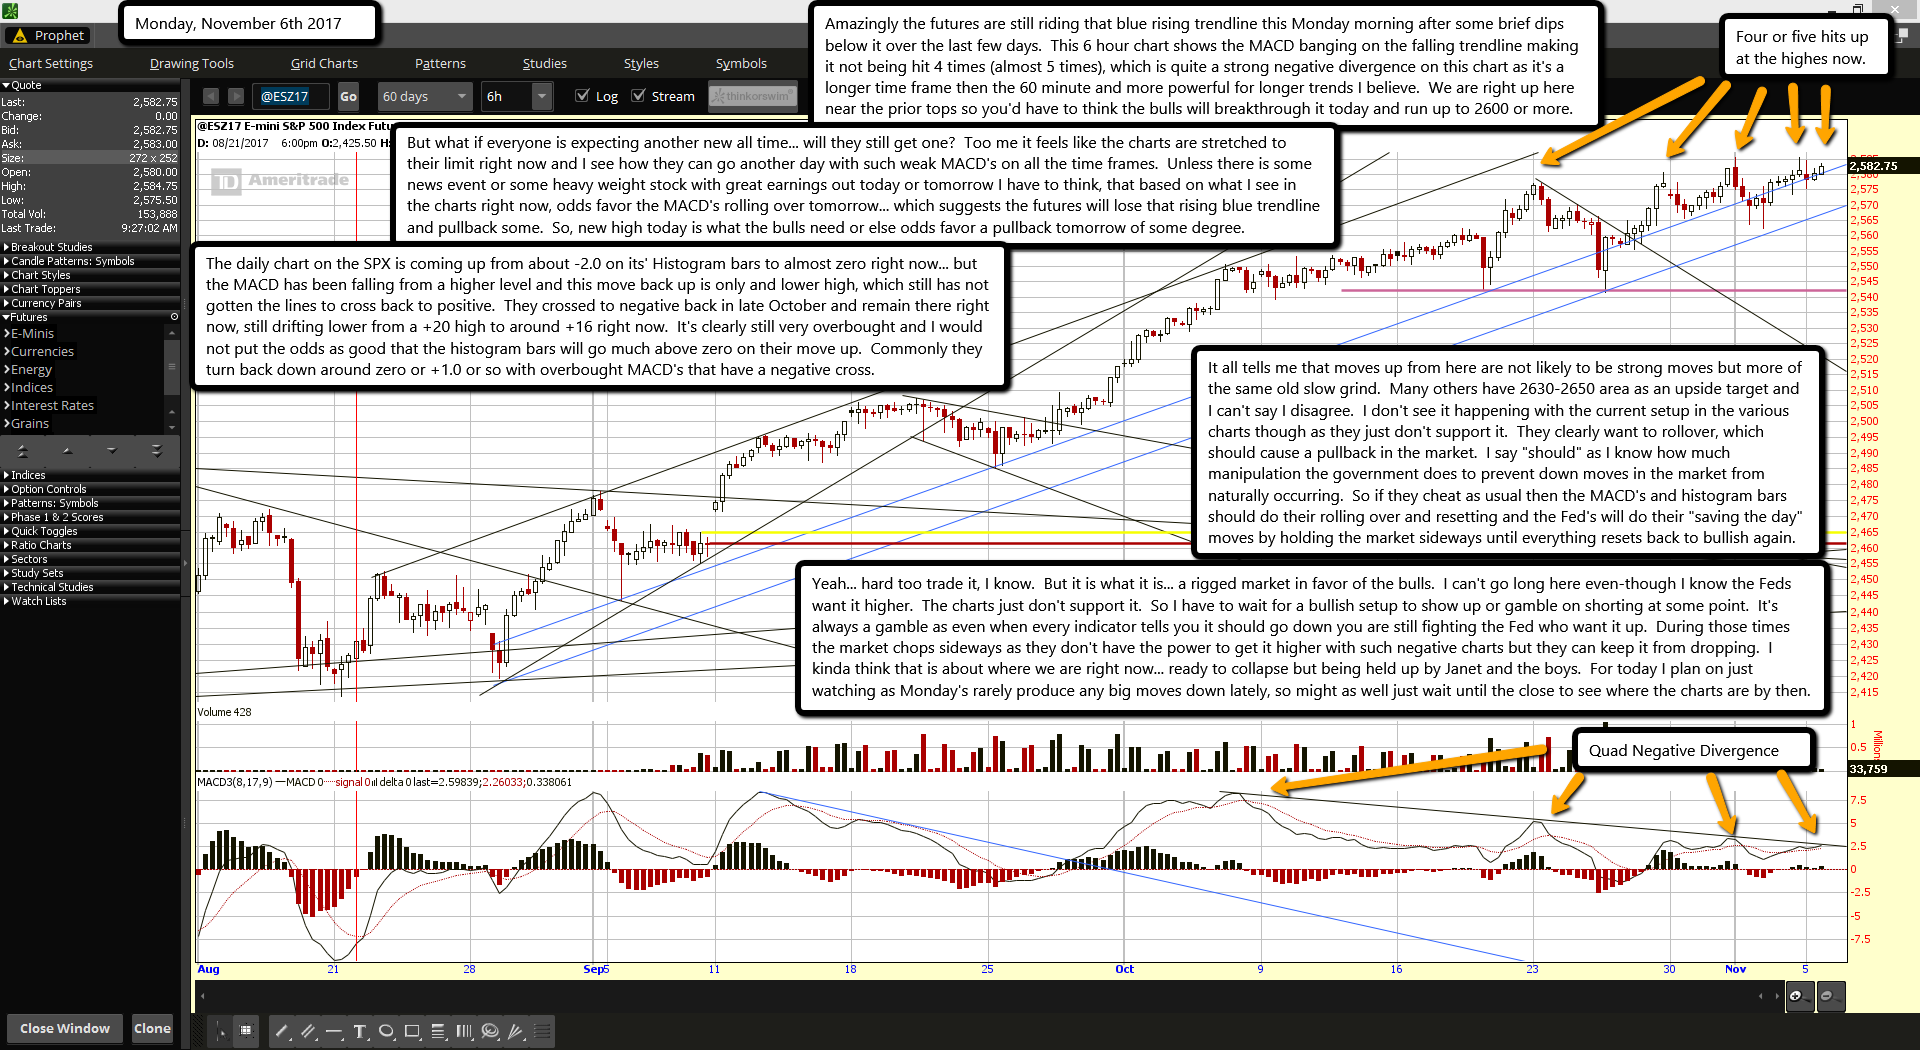
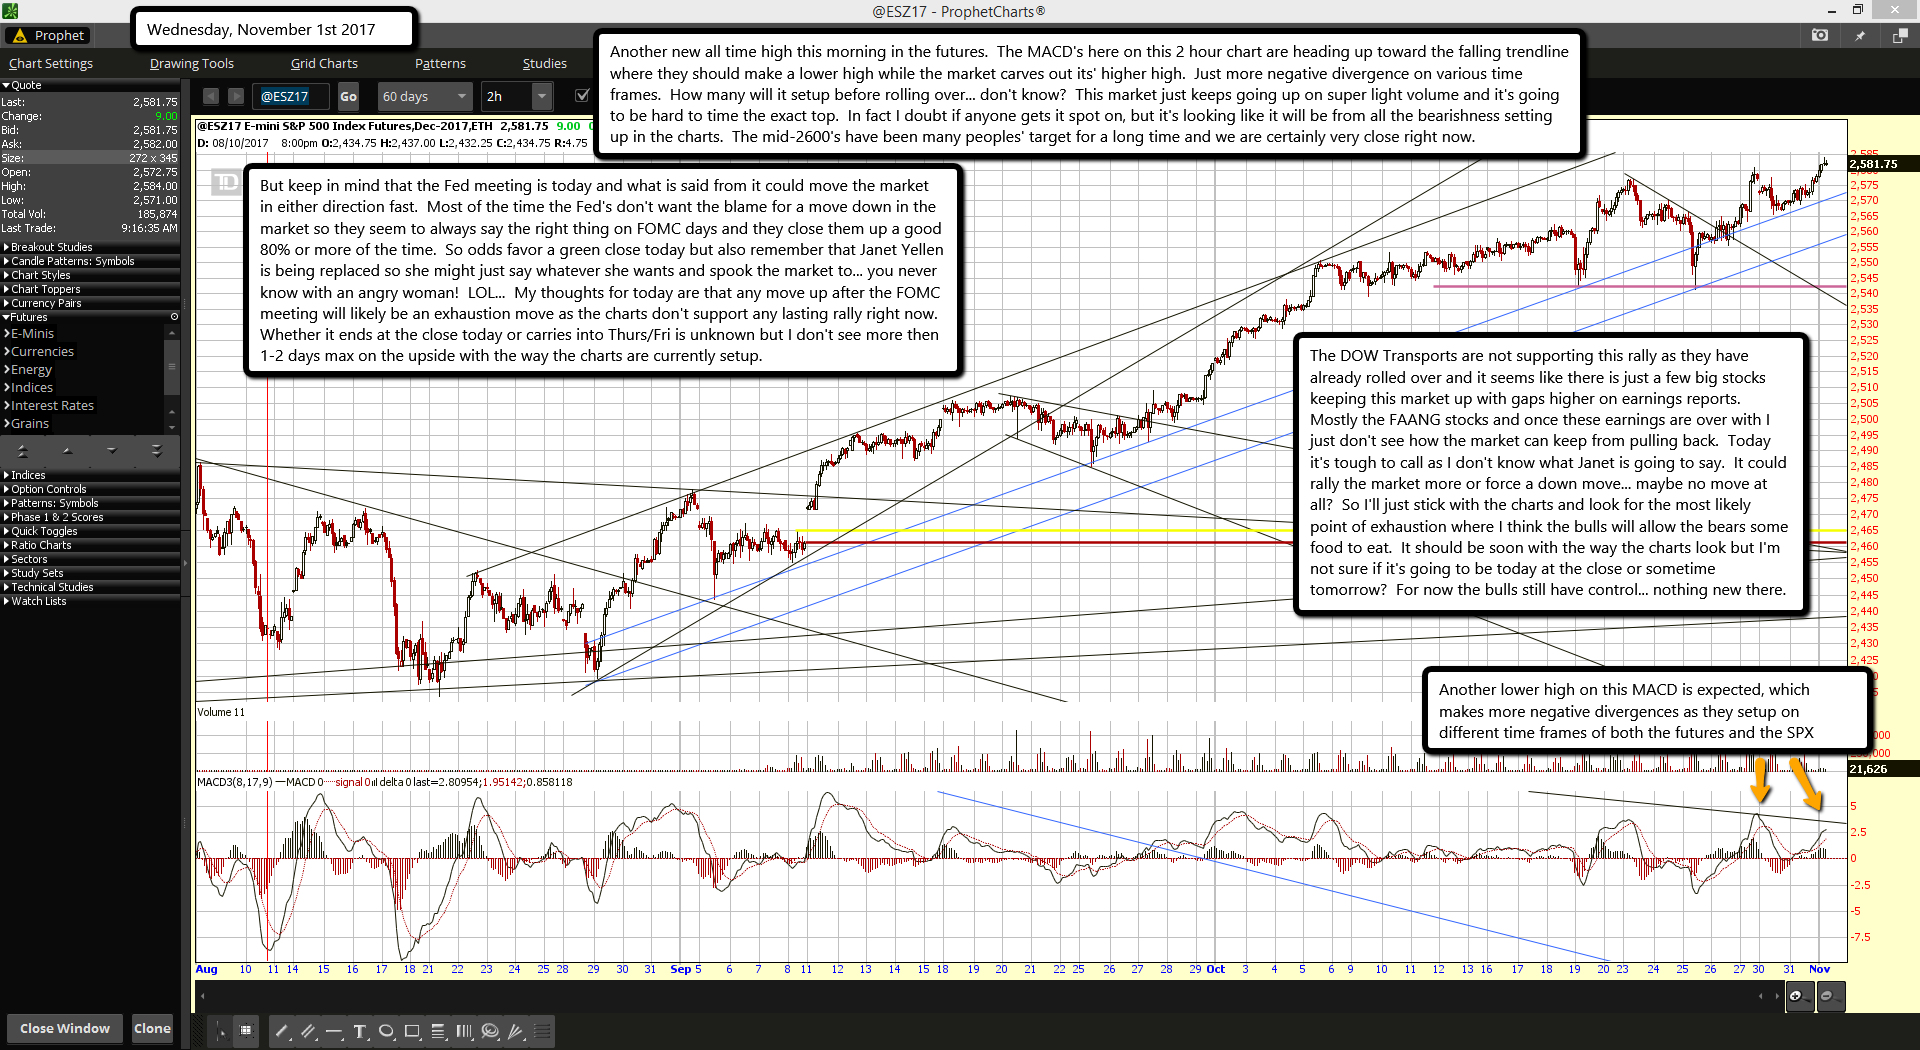
Another new all time high this morning in the futures.  The MACD's here on this 2 hour chart are heading up toward the falling trendline where they should make a lower high while the market carves out its' higher high.  Just more negative divergence on various time frames.  How many will it setup before rolling over... don't know?  This market just keeps going up on super light volume and it's going to be hard to time the exact top.  In fact I doubt if anyone gets it spot on, but it's looking like it will be from all the bearishness setting up in the charts.  The mid-2600's have been many peoples' target for a long time and we are certainly very close right now.

But keep in mind that the Fed meeting is today and what is said from it could move the market in either direction fast.  Most of the time the Fed's don't want the blame for a move down in the market so they seem to always say the right thing on FOMC days and they close them up a good 80% or more of the time.  So odds favor a green close today but also remember that Janet Yellen is being replaced so she might just say whatever she wants and spook the market to... you never know with an angry woman!  LOL...  My thoughts for today are that any move up after the FOMC meeting will likely be an exhaustion move as the charts don't support any lasting rally right now.  Whether it ends at the close today or carries into Thurs/Fri is unknown but I don't see more then 1-2 days max on the upside with the way the charts are currently setup.

The DOW Transports are not supporting this rally as they have already rolled over and it seems like there is just a few big stocks keeping this market up with gaps higher on earnings reports.  Mostly the FAANG stocks and once these earnings are over with I just don't see how the market can keep from pulling back.  Today it's tough to call as I don't know what Janet is going to say.  It could rally the market more or force a down move... maybe no move at all?  So I'll just stick with the charts and look for the most likely point of exhaustion where I think the bulls will allow the bears some food to eat.  It should be soon with the way the charts look but I'm not sure if it's going to be today at the close or sometime tomorrow?  For now the bulls still have control... nothing new there.

US DOD will conduct a “communications interoperability” training exercise November 4-6..simulating a “very bad day” scenario

0

Elements of the US Department of Defense (DOD) will conduct a “communications interoperability” training exercise November 4-6, once again simulating a “very bad day” scenario. Amateur Radio and MARS organizations will take part.

“This exercise will begin with a national massive coronal mass ejection event which will impact the national power grid as well as all forms of traditional communication, including landline telephone, cellphone, satellite, and Internet connectivity,” Army MARS Program Manager Paul English, WD8DBY, explained in an announcement.

During the exercise, a designated DOD Headquarters entity will request county-by-county status reports for the 3,143 US counties and county equivalents, in order to gain situational awareness and to determine the extent of impact of the scenario. Army and Air Force MARS organizations will work in conjunction with the Amateur Radio community, primarily on the 60-meter interoperability channels as well as on HF NVIS frequencies and local VHF and UHF, non-Internet linked Amateur Radio repeaters.

Again this year, a military station on the east coast and the Fort Huachuca, Arizona, HF station will conduct a high-power broadcast on 60-meter channel 1 (5330.5 kHz) on Saturday from 0300 to 0315 UTC. New this year will be an informational broadcast on Sunday, on 13,483.5 kHz USB from 1600 to 1615 UTC. Amateur Radio operators should monitor these broadcasts for more information about the exercise and how they can participate in this communications exercise, English said.

“We want to continue building on the outstanding cooperative working relationship with the ARRL and the Amateur Radio community,” English said. “We want to expand the use of the 60-meter interop channels between the military and amateur community for emergency communications, and we hope the Amateur Radio community will give us some good feedback on the use of both the 5-MHz interop and the new 13-MHz broadcast channels as a means of information dissemination during a very bad day scenario.


Seems too me that ever false flag event we've had (like Las Vegas, Sandy Hook, Boston Bombing, etc...) all had one thing it common... a training exercise before the event.

Is this exercise foretelling of another false flag that's coming?

Was the movie called "The Crash" an actual sign of what is really going to happen?  A power grid going down certainly wouldn't make the stock market very happy.

Red

ES Morning Update October 31st 2017

0

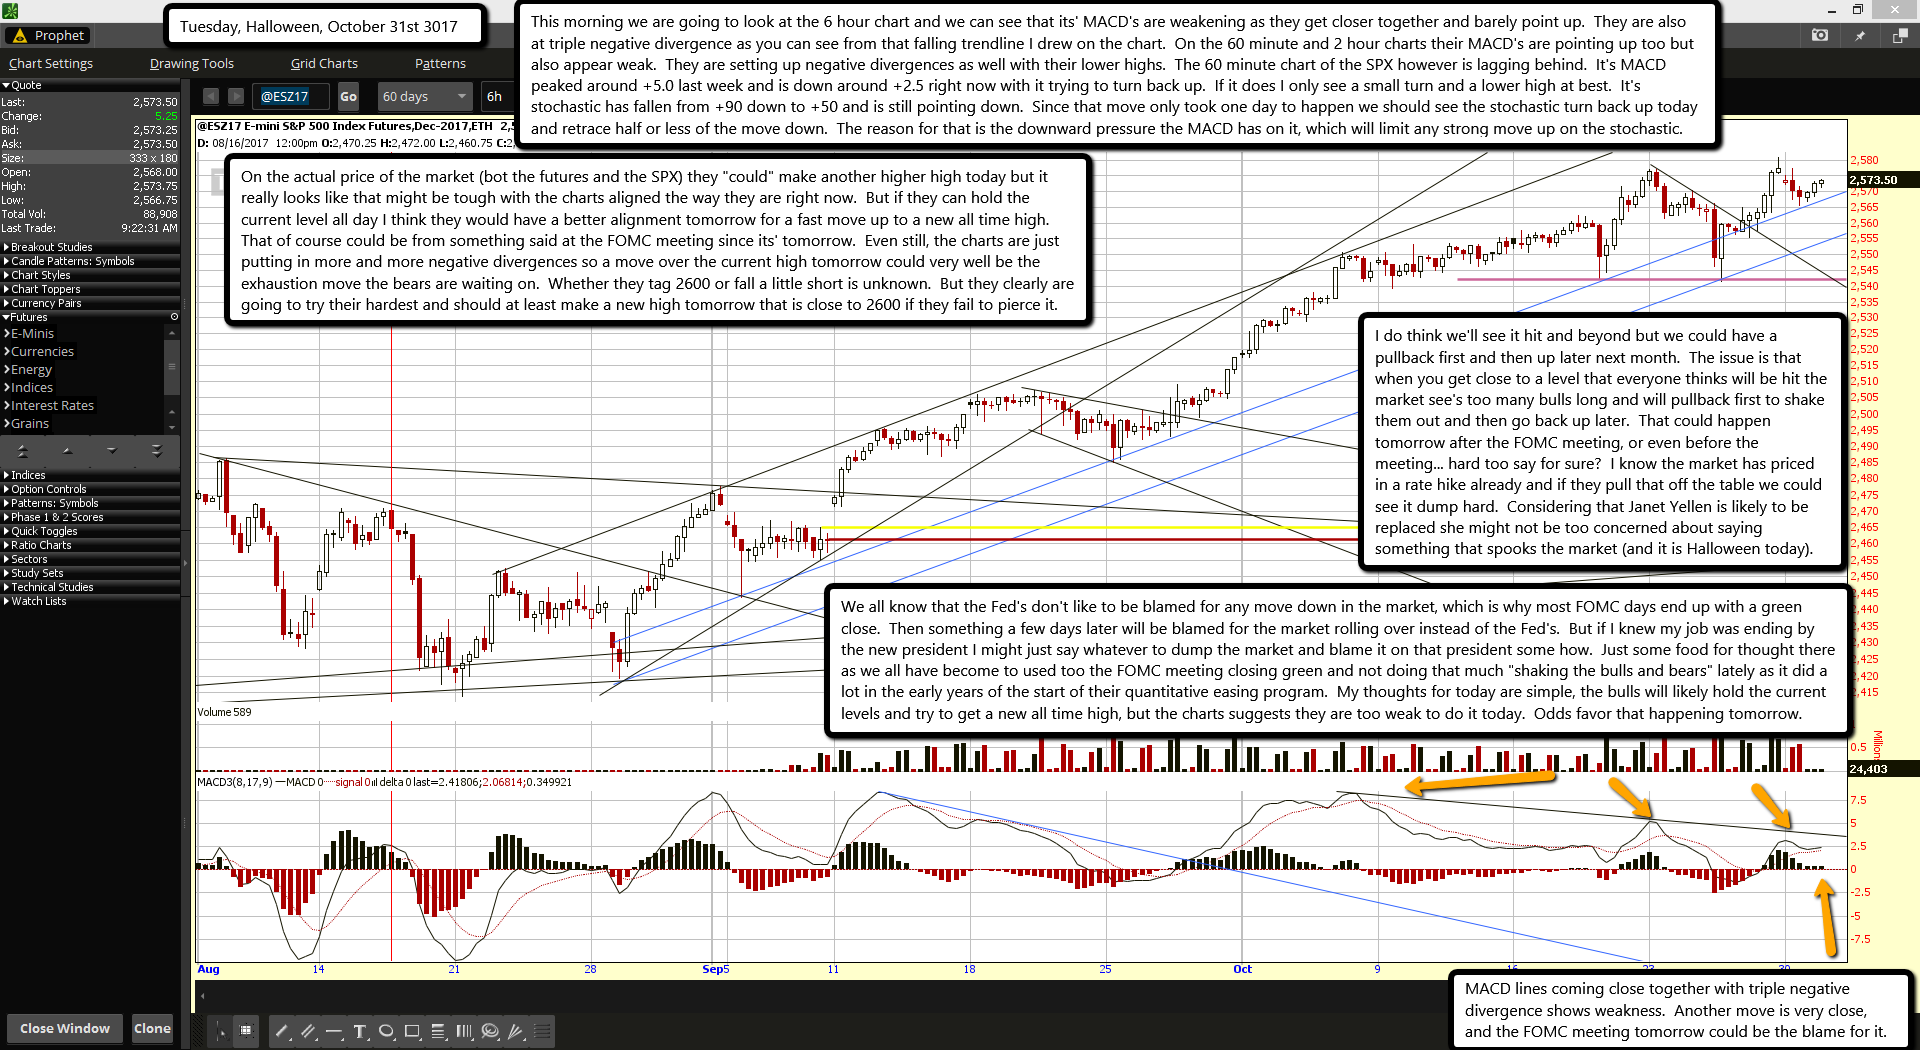
This morning we are going to look at the 6 hour chart and we can see that its' MACD's are weakening as they get closer together and barely point up.  They are also at triple negative divergence as you can see from that falling trendline I drew on the chart.  On the 60 minute and 2 hour charts their MACD's are pointing up too but also appear weak.  They are setting up negative divergences as well with their lower highs.  The 60 minute chart of the SPX however is lagging behind.  It's MACD peaked around +5.0 last week and is down around +2.5 right now with it trying to turn back up.  If it does I only see a small turn and a lower high at best.  It's stochastic has fallen from +90 down to +50 and is still pointing down.  Since that move only took one day to happen we should see the stochastic turn back up today and retrace half or less of the move down.  The reason for that is the downward pressure the MACD has on it, which will limit any strong move up on the stochastic.

On the actual price of the market (bot the futures and the SPX) they "could" make another higher high today but it really looks like that might be tough with the charts aligned the way they are right now.  But if they can hold the current level all day I think they would have a better alignment tomorrow for a fast move up to a new all time high.  That of course could be from something said at the FOMC meeting since its' tomorrow.  Even still, the charts are just putting in more and more negative divergences so a move over the current high tomorrow could very well be the exhaustion move the bears are waiting on.  Whether they tag 2600 or fall a little short is unknown.  But they clearly are going to try their hardest and should at least make a new high tomorrow that is close to 2600 if they fail to pierce it.

I do think we'll see it hit and beyond but we could have a pullback first and then up later next month.  The issue is that when you get close to a level that everyone thinks will be hit the market see's too many bulls long and will pullback first to shake them out and then go back up later.  That could happen tomorrow after the FOMC meeting, or even before the meeting... hard too say for sure?  I know the market has priced in a rate hike already and if they pull that off the table we could see it dump hard.  Considering that Janet Yellen is likely to be replaced she might not be too concerned about saying something that spooks the market (and it is Halloween today).

We all know that the Fed's don't like to be blamed for any move down in the market, which is why most FOMC days end up with a green close.  Then something a few days later will be blamed for the market rolling over instead of the Fed's.  But if I knew my job was ending by the new president I might just say whatever to dump the market and blame it on that president some how.  Just some food for thought there as we all have become to used too the FOMC meeting closing green and not doing that much "shaking the bulls and bears" lately as it did a lot in the early years of the start of their quantitative easing program.  My thoughts for today are simple, the bulls will likely hold the current levels and try to get a new all time high, but the charts suggests they are too weak to do it today.  Odds favor that happening tomorrow.

ES Morning Update October 30th 2017

0

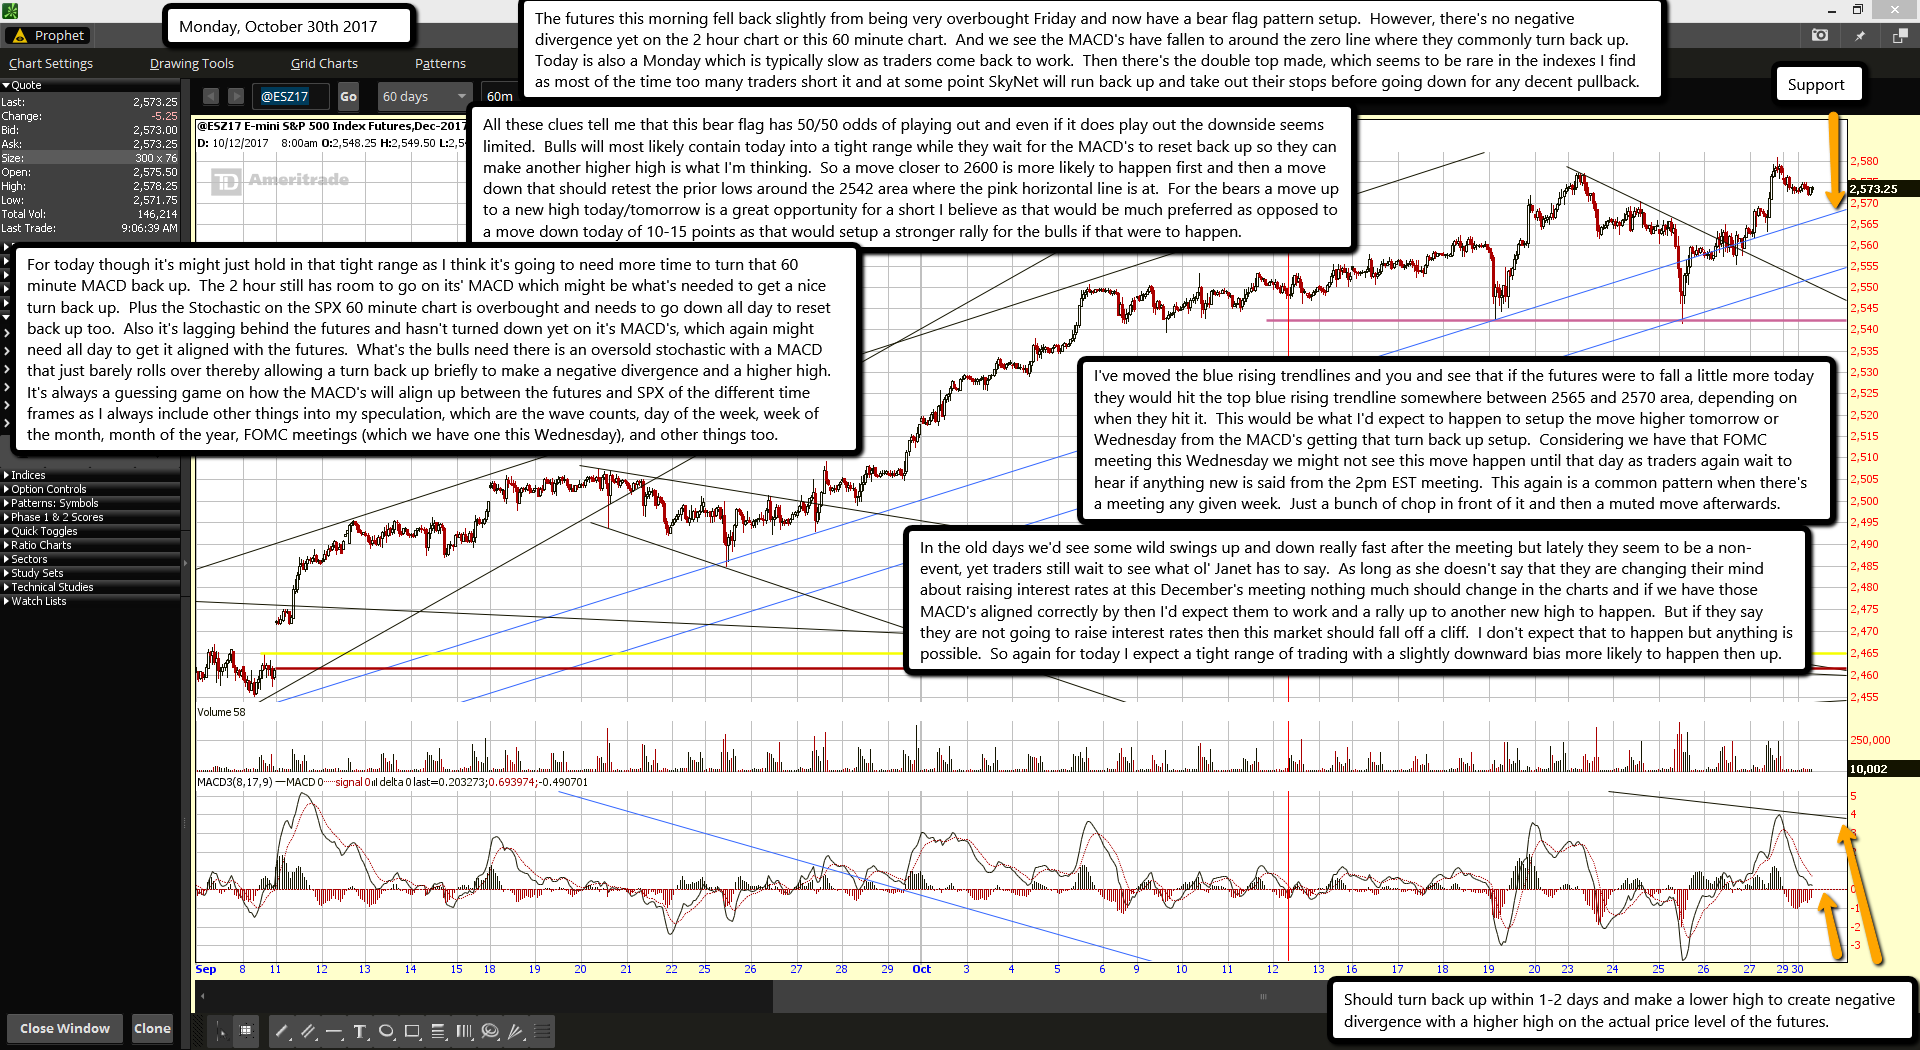
The futures this morning fell back slightly from being very overbought Friday and now have a bear flag pattern setup.  However, there's no negative divergence yet on the 2 hour chart or this 60 minute chart.  And we see the MACD's have fallen to around the zero line where they commonly turn back up.  Today is also a Monday which is typically slow as traders come back to work.  Then there's the double top made, which seems to be rare in the indexes I find as most of the time too many traders short it and at some point SkyNet will run back up and take out their stops before going down for any decent pullback.

All these clues tell me that this bear flag has 50/50 odds of playing out and even if it does play out the downside seems limited.  Bulls will most likely contain today into a tight range while they wait for the MACD's to reset back up so they can make another higher high is what I'm thinking.  So a move closer to 2600 is more likely to happen first and then a move down that should retest the prior lows around the 2542 area where the pink horizontal line is at.  For the bears a move up to a new high today/tomorrow is a great opportunity for a short I believe as that would be much preferred as opposed to a move down today of 10-15 points as that would setup a stronger rally for the bulls if that were to happen.

For today though it's might just hold in that tight range as I think it's going to need more time to turn that 60 minute MACD back up.  The 2 hour still has room to go on its' MACD which might be what's needed to get a nice turn back up.  Plus the Stochastic on the SPX 60 minute chart is overbought and needs to go down all day to reset back up too.  Also it's lagging behind the futures and hasn't turned down yet on it's MACD's, which again might need all day to get it aligned with the futures.  What's the bulls need there is an oversold stochastic with a MACD that just barely rolls over thereby allowing a turn back up briefly to make a negative divergence and a higher high.  It's always a guessing game on how the MACD's will align up between the futures and SPX of the different time frames as I always include other things into my speculation, which are the wave counts, day of the week, week of the month, month of the year, FOMC meetings (which we have one this Wednesday), and other things too.

I've moved the blue rising trendlines and you and see that if the futures were to fall a little more today they would hit the top blue rising trendline somewhere between 2565 and 2570 area, depending on when they hit it.  This would be what I'd expect to happen to setup the move higher tomorrow or Wednesday from the MACD's getting that turn back up setup.  Considering we have that FOMC meeting this Wednesday we might not see this move happen until that day as traders again wait to hear if anything new is said from the 2pm EST meeting.  This again is a common pattern when there's a meeting any given week.  Just a bunch of chop in front of it and then a muted move afterwards.

In the old days we'd see some wild swings up and down really fast after the meeting but lately they seem to be a non-event, yet traders still wait to see what ol' Janet has to say.  As long as she doesn't say that they are changing their mind about raising interest rates at this December's meeting nothing much should change in the charts and if we have those MACD's aligned correctly by then I'd expect them to work and a rally up to another new high to happen.  But if they say they are not going to raise interest rates then this market should fall off a cliff.  I don't expect that to happen but anything is possible.  So again for today I expect a tight range of trading with a slightly downward bias more likely to happen then up.

ES Morning Update October 27th 2017

0

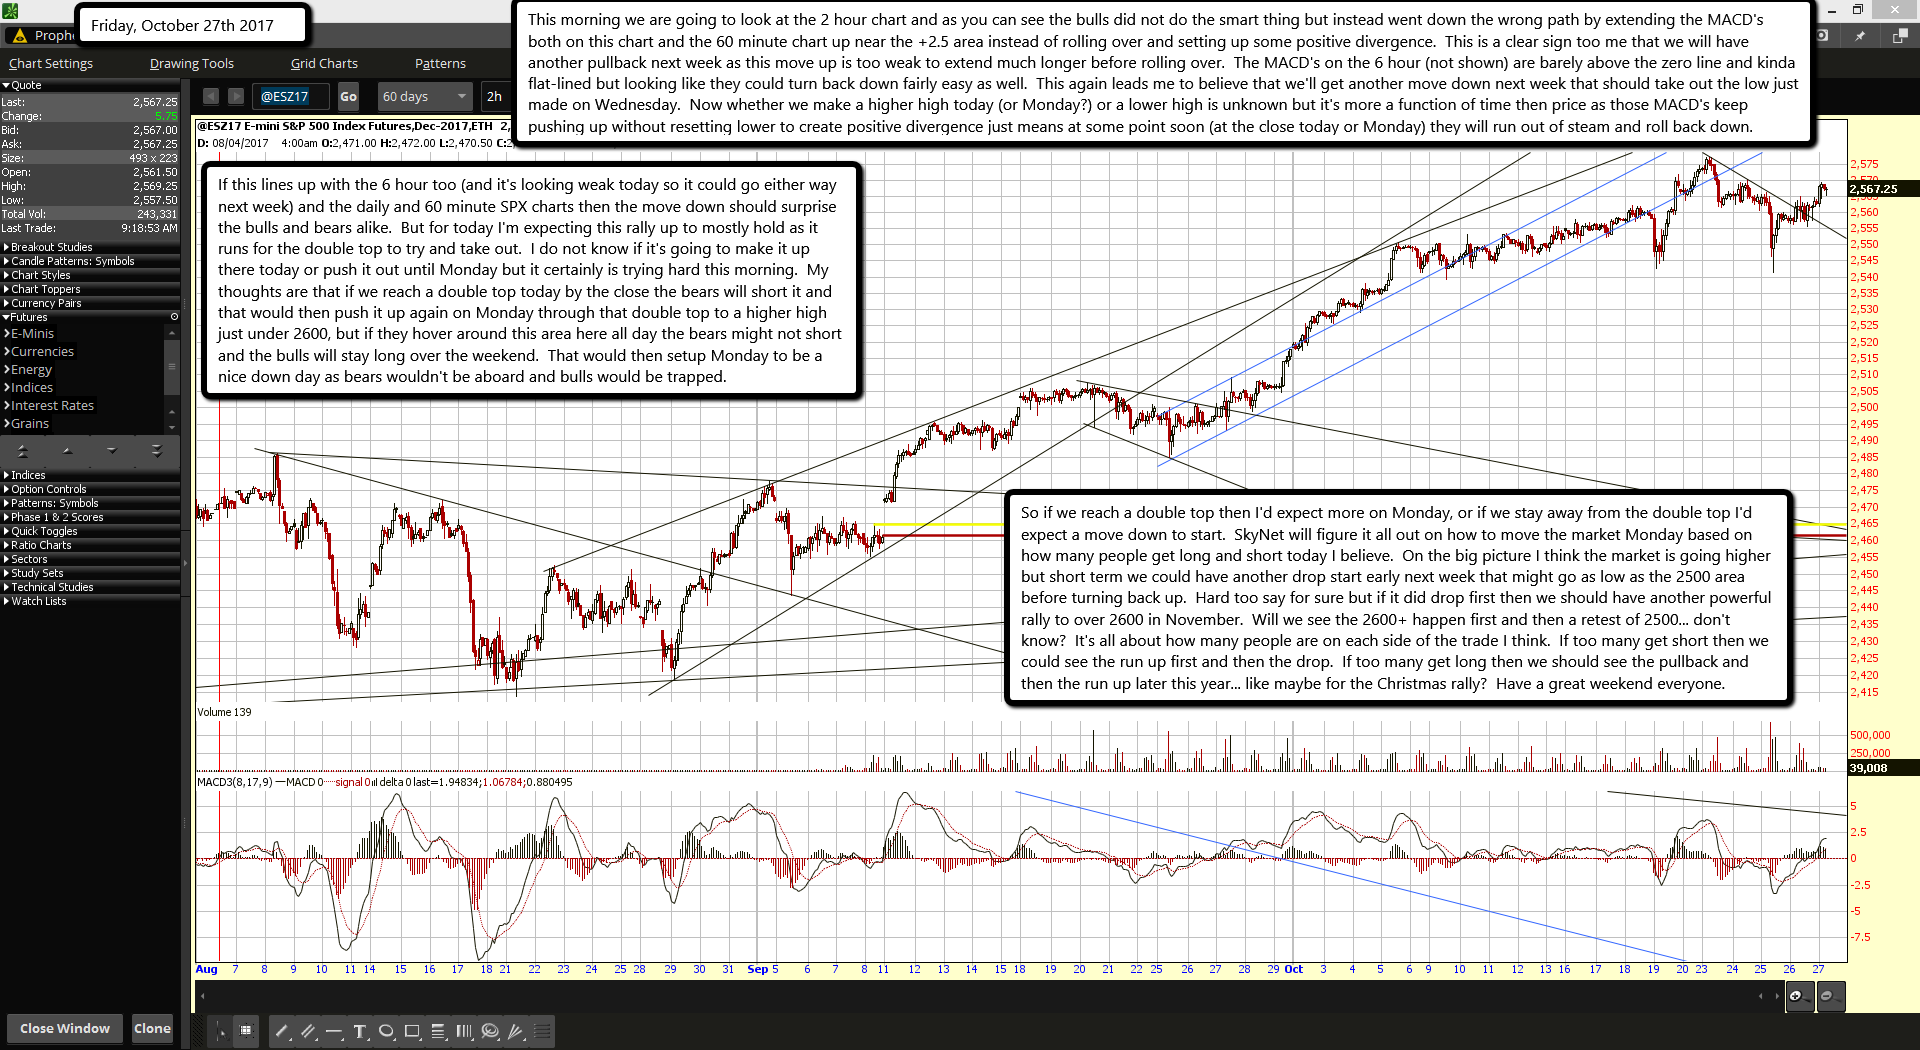
This morning we are going to look at the 2 hour chart and as you can see the bulls did not do the smart thing but instead went down the wrong path by extending the MACD's both on this chart and the 60 minute chart up near the +2.5 area instead of rolling over and setting up some positive divergence.  This is a clear sign too me that we will have another pullback next week as this move up is too weak to extend much longer before rolling over.  The MACD's on the 6 hour (not shown) are barely above the zero line and kinda flat-lined but looking like they could turn back down fairly easy as well.  This again leads me to believe that we'll get another move down next week that should take out the low just made on Wednesday.  Now whether we make a higher high today (or Monday?) or a lower high is unknown but it's more a function of time then price as those MACD's keep pushing up without resetting lower to create positive divergence just means at some point soon (at the close today or Monday) they will run out of steam and roll back down.

If this lines up with the 6 hour too (and it's looking weak today so it could go either way next week) and the daily and 60 minute SPX charts then the move down should surprise the bulls and bears alike.  But for today I'm expecting this rally up to mostly hold as it runs for the double top to try and take out.  I do not know if it's going to make it up there today or push it out until Monday but it certainly is trying hard this morning.  My thoughts are that if we reach a double top today by the close the bears will short it and that would then push it up again on Monday through that double top to a higher high just under 2600, but if they hover around this area here all day the bears might not short and the bulls will stay long over the weekend.  That would then setup Monday to be a nice down day as bears wouldn't be aboard and bulls would be trapped.

So if we reach a double top then I'd expect more on Monday, or if we stay away from the double top I'd expect a move down to start.  SkyNet will figure it all out on how to move the market Monday based on how many people get long and short today I believe.  On the big picture I think the market is going higher but short term we could have another drop start early next week that might go as low as the 2500 area before turning back up.  Hard too say for sure but if it did drop first then we should have another powerful rally to over 2600 in November.  Will we see the 2600+ happen first and then a retest of 2500... don't know?  It's all about how many people are on each side of the trade I think.  If too many get short then we could see the run up first and then the drop.  If too many get long then we should see the pullback and then the run up later this year... like maybe for the Christmas rally?  Have a great weekend everyone.

ES Morning Update October 26th 2017

0

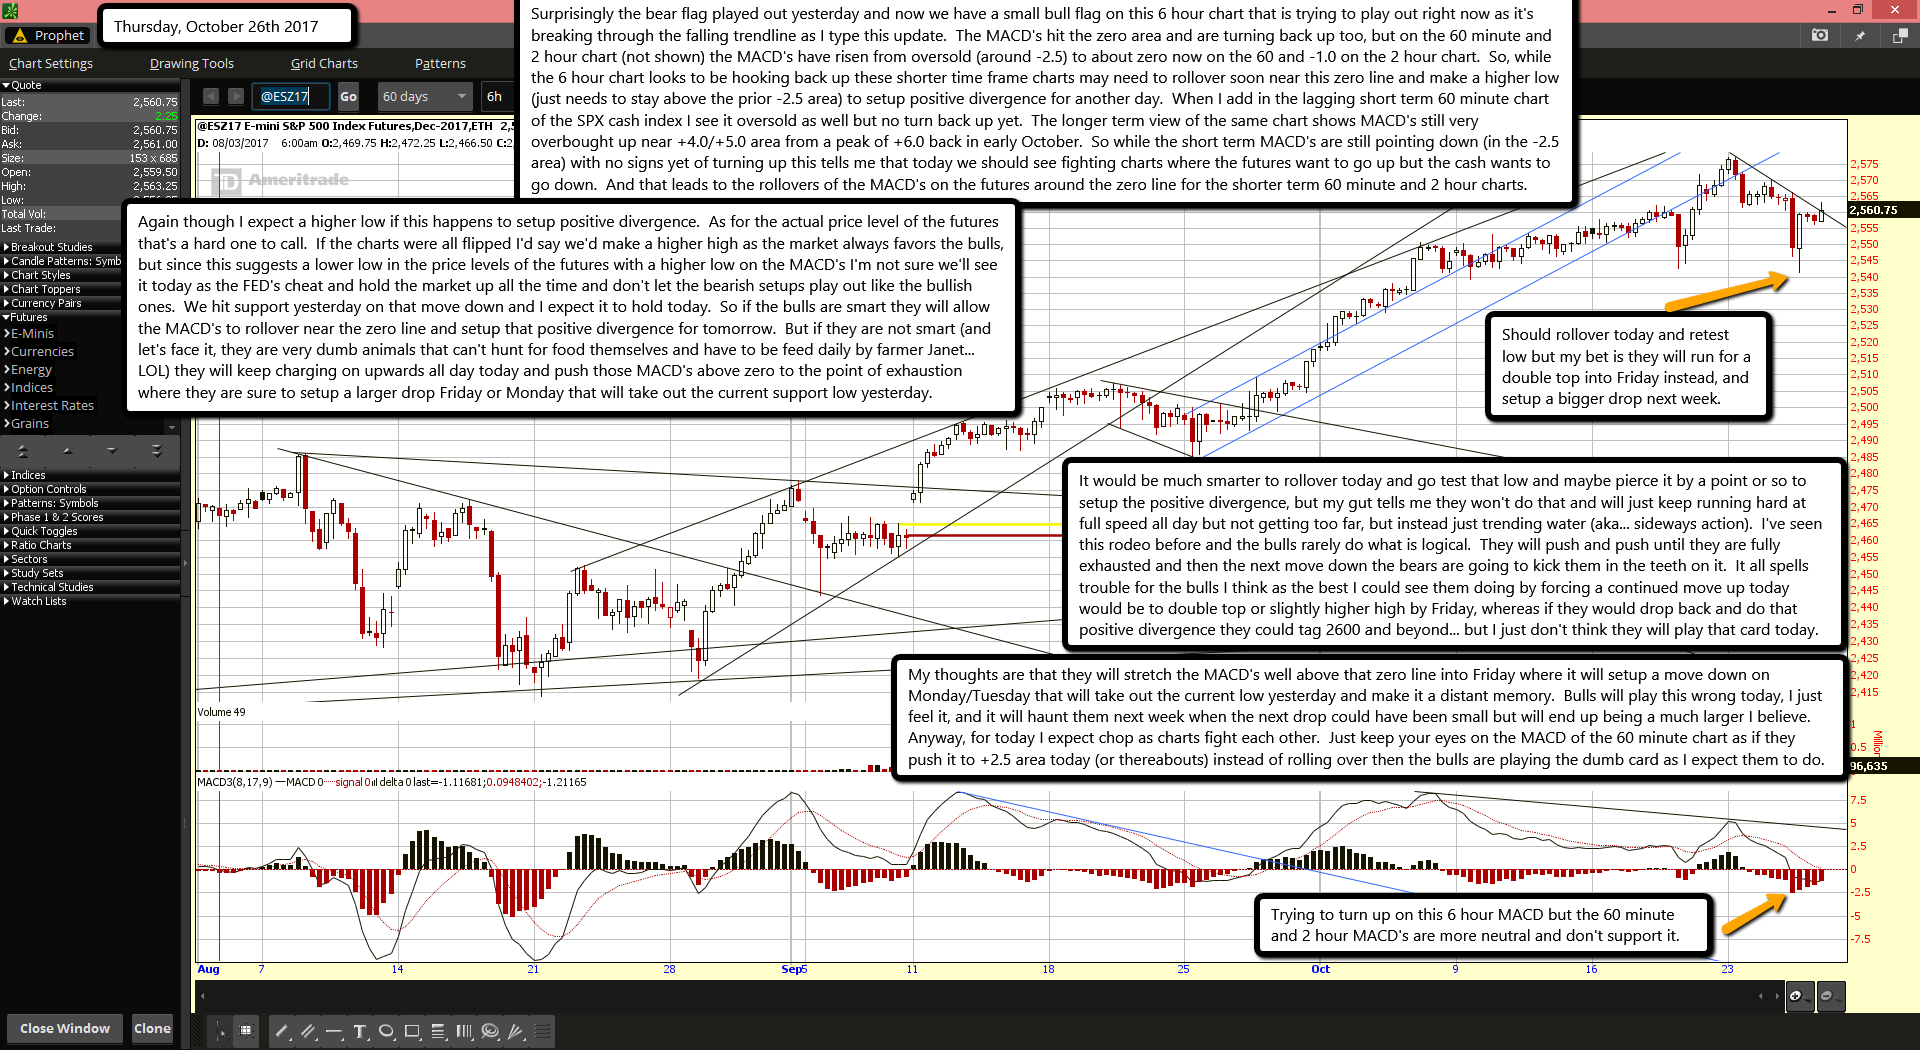
Surprisingly the bear flag played out yesterday and now we have a small bull flag on this 6 hour chart that is trying to play out right now as it's breaking through the falling trendline as I type this update.  The MACD's hit the zero area and are turning back up too, but on the 60 minute and 2 hour chart (not shown) the MACD's have risen from oversold (around -2.5) to about zero now on the 60 and -1.0 on the 2 hour chart.  So, while the 6 hour chart looks to be hooking back up these shorter time frame charts may need to rollover soon near this zero line and make a higher low (just needs to stay above the prior -2.5 area) to setup positive divergence for another day.  When I add in the lagging short term 60 minute chart of the SPX cash index I see it oversold as well but no turn back up yet.  The longer term view of the same chart shows MACD's still very overbought up near +4.0/+5.0 area from a peak of +6.0 back in early October.  So while the short term MACD's are still pointing down (in the -2.5 area) with no signs yet of turning up this tells me that today we should see fighting charts where the futures want to go up but the cash wants to go down.  And that leads to the rollovers of the MACD's on the futures around the zero line for the shorter term 60 minute and 2 hour charts.

Again though I expect a higher low if this happens to setup positive divergence.  As for the actual price level of the futures that's a hard one to call.  If the charts were all flipped I'd say we'd make a higher high as the market always favors the bulls, but since this suggests a lower low in the price levels of the futures with a higher low on the MACD's I'm not sure we'll see it today as the FED's cheat and hold the market up all the time and don't let the bearish setups play out like the bullish ones.  We hit support yesterday on that move down and I expect it to hold today.  So if the bulls are smart they will allow the MACD's to rollover near the zero line and setup that positive divergence for tomorrow.  But if they are not smart (and let's face it, they are very dumb animals that can't hunt for food themselves and have to be feed daily by farmer Janet... LOL) they will keep charging on upwards all day today and push those MACD's above zero to the point of exhaustion where they are sure to setup a larger drop Friday or Monday that will take out the current support low yesterday.

It would be much smarter to rollover today and go test that low and maybe pierce it by a point or so to setup the positive divergence, but my gut tells me they won't do that and will just keep running hard at full speed all day but not getting too far, but instead just trending water (aka... sideways action).  I've seen this rodeo before and the bulls rarely do what is logical.  They will push and push until they are fully exhausted and then the next move down the bears are going to kick them in the teeth on it.  It all spells trouble for the bulls I think as the best I could see them doing by forcing a continued move up today would be to double top or slightly higher high by Friday, whereas if they would drop back and do that positive divergence they could tag 2600 and beyond... but I just don't think they will play that card today.

My thoughts are that they will stretch the MACD's well above that zero line into Friday where it will setup a move down on Monday/Tuesday that will take out the current low yesterday and make it a distant memory.  Bulls will play this wrong today, I just feel it, and it will haunt them next week when the next drop could have been small but will end up being a much larger I believe.  Anyway, for today I expect chop as charts fight each other.  Just keep your eyes on the MACD of the 60 minute chart as if they push it to +2.5 area today (or thereabouts) instead of rolling over then the bulls are playing the dumb card as I expect them to do.

ES Morning Update October 25th 2017

0

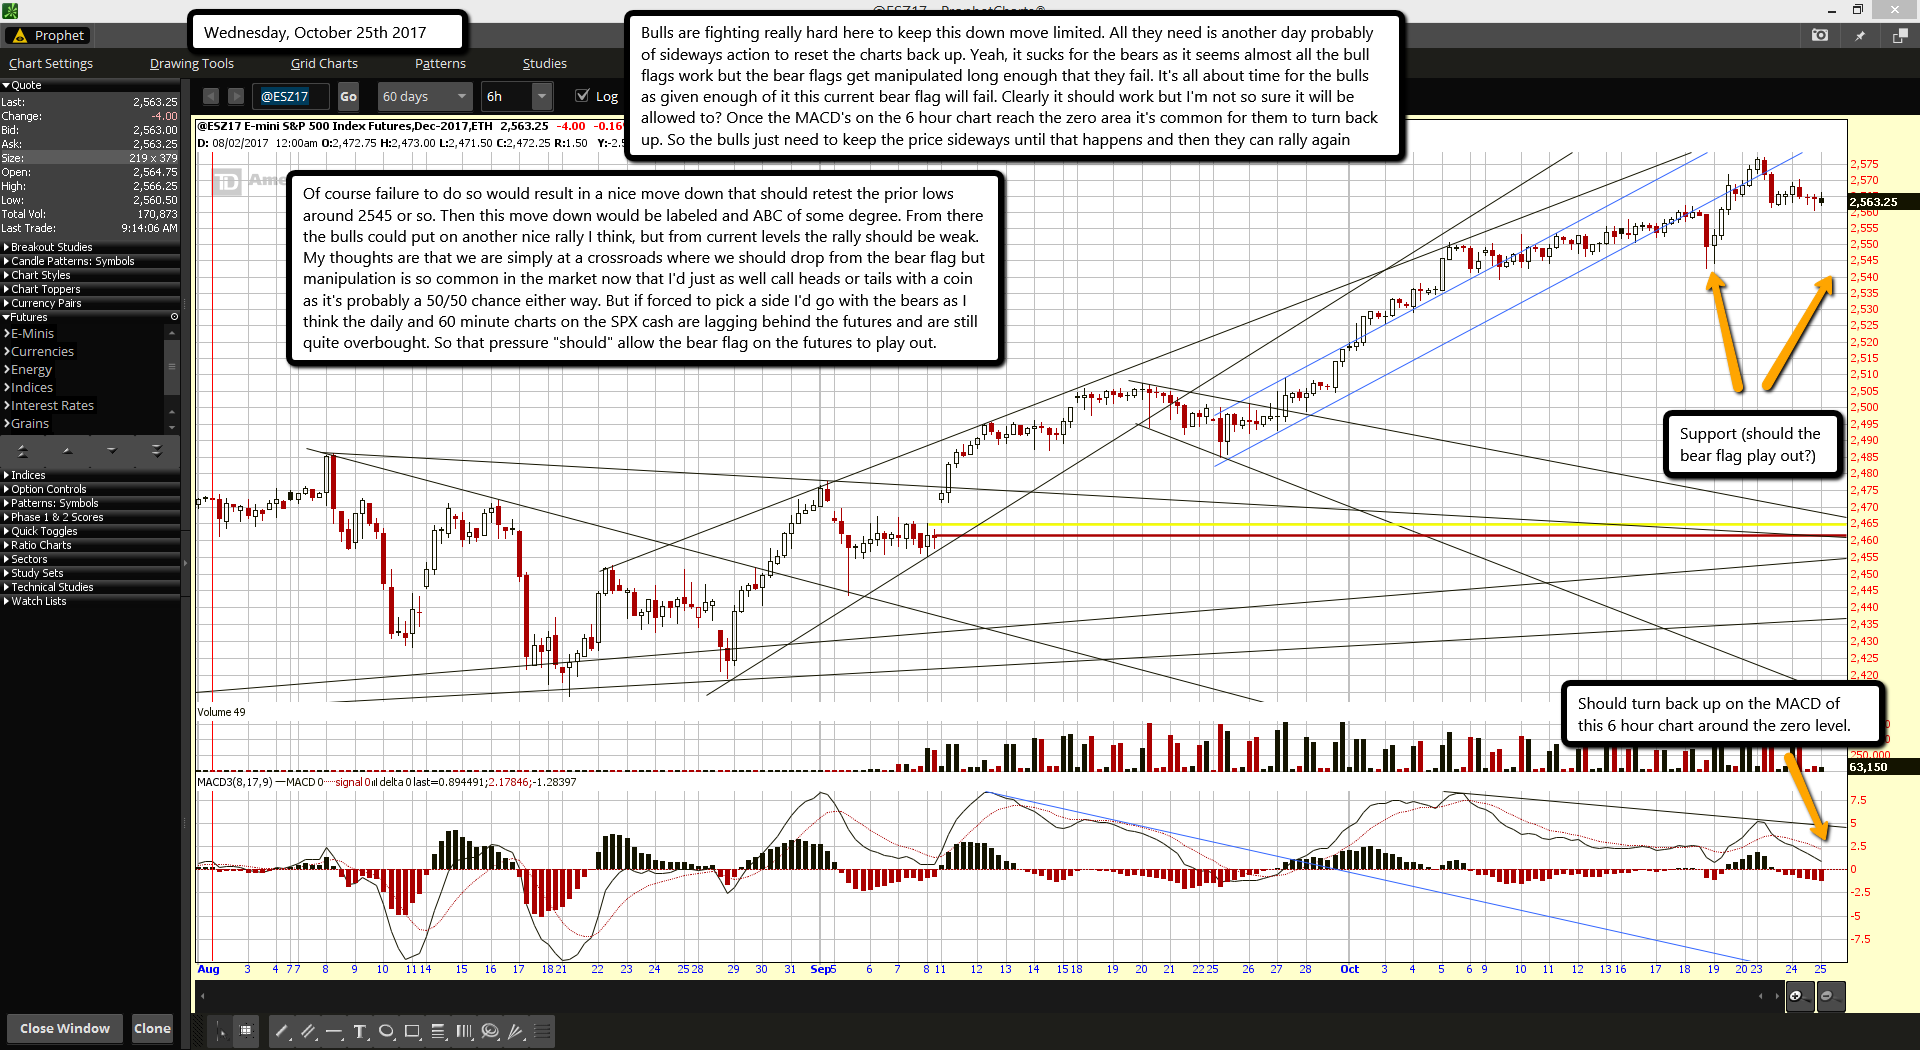
Bulls are fighting really hard here to keep this down move limited. All they need is another day probably of sideways action to reset the charts back up. Yeah, it sucks for the bears as it seems almost all the bull flags work but the bear flags get manipulated long enough that they fail. It's all about time for the bulls as given enough of it this current bear flag will fail. Clearly it should work but I'm not so sure it will be allowed to? Once the MACD's on the 6 hour chart reach the zero area it's common for them to turn back up. So the bulls just need to keep the price sideways until that happens and then they can rally again

Of course failure to do so would result in a nice move down that should retest the prior lows around 2545 or so. Then this move down would be labeled and ABC of some degree. From there the bulls could put on another nice rally I think, but from current levels the rally should be weak. My thoughts are that we are simply at a crossroads where we should drop from the bear flag but manipulation is so common in the market now that I'd just as well call heads or tails with a coin as it's probably a 50/50 chance either way. But if forced to pick a side I'd go with the bears as I think the daily and 60 minute charts on the SPX cash are lagging behind the futures and are still quite overbought. So that pressure "should" allow the bear flag on the futures to play out.

ES Morning Update October 24th 2017

0

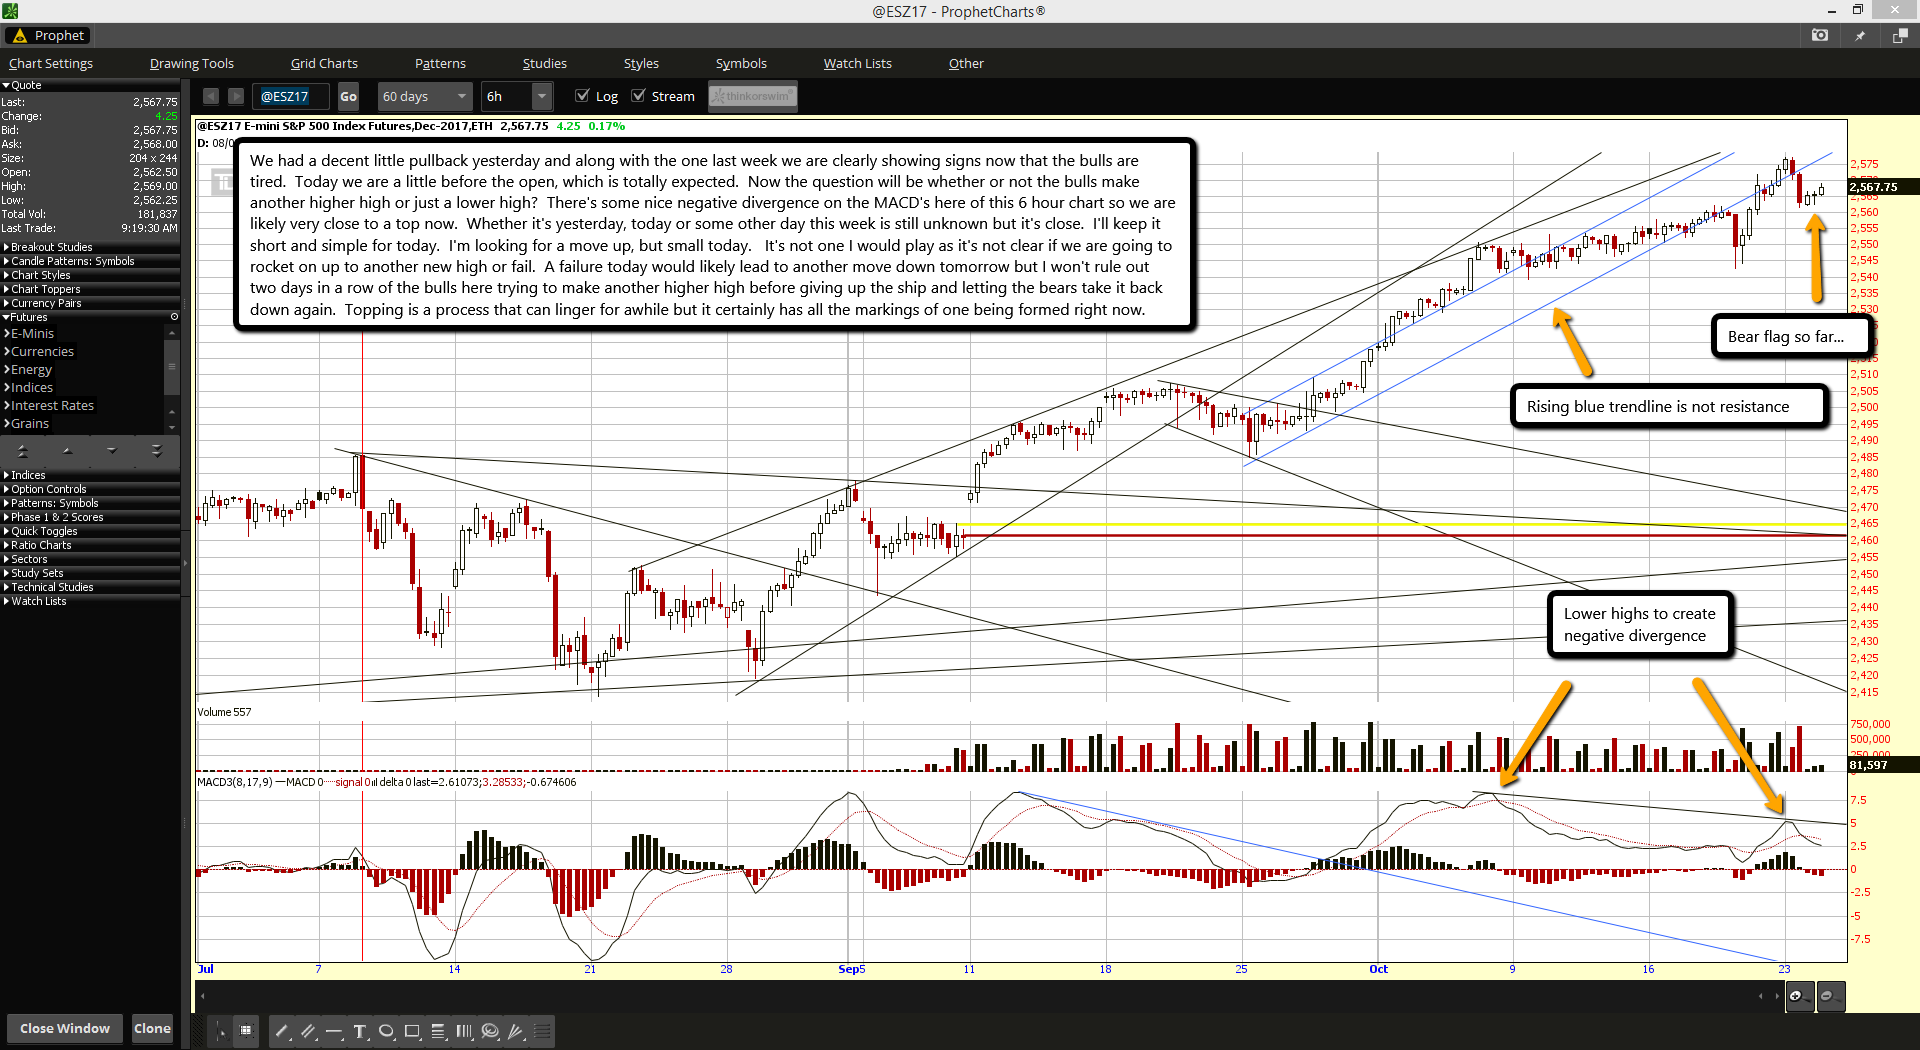
We had a decent little pullback yesterday and along with the one last week we are clearly showing signs now that the bulls are tired. Today we are a little before the open, which is totally expected. Now the question will be whether or not the bulls make another higher high or just a lower high? There's some nice negative divergence on the MACD's here of this 6 hour chart so we are likely very close to a top now. Whether it's yesterday, today or some other day this week is still unknown but it's close. I'll keep it short and simple for today. I'm looking for a move up, but small today. It's not one I would play as it's not clear if we are going to rocket on up to another new high or fail. A failure today would likely lead to another move down tomorrow but I won't rule out two days in a row of the bulls here trying to make another higher high before giving up the ship and letting the bears take it back down again. Topping is a process that can linger for awhile but it certainly has all the markings of one being formed right now.

Is the Fed Getting Cold Feet about the QE Unwind?

0

Curious things are happening on its balance sheet.

The last Fed meeting ended on September 20 with a momentous announcement, confirming what had been telegraphed for months: the QE unwind would begin October 1.

The unwind would proceed at the pace announced at its June 14 meeting. It would shrink the Fed’s balance sheet – “balance sheet normalization” it calls that – and undo what serial bouts of QE have done: gradually destroying some of the money that had been created out of nothing during QE.

The pace of the shrinkage would be $10 billion a month for the first three months, and then it would accelerate every three months until it hits $50 billion a month at this time next year. That was the announcement.

Reality Check

Thursday afternoon, the Fed released its weekly balance sheet for the week ending October 18. We’re now two and half weeks and three weekly balance-sheet releases into the QE unwind period. How much has the Fed actually reduced its balances sheet?

  • Total assets on Oct 4:  $4.460 trillion
  • Total assets on Oct 11: $4.459 trillion
  • Total assets on Oct 18: $4.470 trillion

You read correctly: Since October 4, the balance sheet gained $10 billion, all of it in the week ending October 18.

The Fed is supposed to unload $10 billion in October. But curiously, so far, it has done the opposite. This chart shows the balance sheet movements so far this year. Note the jump in the last week:

The chart below shows the Fed’s total assets over the entire QE period from before the Financial Crisis through the currently missing QE unwind. There was a mini-unwind after QE-1 and that was about it:

As part of the $10 billion that the Fed said it would shrink its balance sheet in October, it is supposed to unload $6 billion in Treasury securities and $4 billion in mortgage backed securities. How did that go so far?

Since October 4, the Fed has in fact added $176 million in Treasury securities and now holds $2,465.6 billion of Treasury securities of all maturities, a new all-time record high, and there is no sign of any unwind:

And even crasser: Since October 4, the Fed has piled on $9.8 billion in mortgage-backed securities, and there is no sign of any unwind either:

In fact, looking at the Fed’s Open Market Operations (OMO), the Fed’s “Trading Desk,” as it calls this entity, was very busy nearly every day in the MBS market, buying between $400 million to over $2 billion of MBS per day.

The Fed has done this since the end of QE in order to keep the MBS on its balance sheet about even. MBS securities constantly forward principal payments to their holders (as underlying mortgages get paid down or off), and unlike regular bonds, they shrink until they’re redeemed at maturity. To keep the MBS balance steady, the Fed has to constantly buy MBS. So this just continues its routine.

But clearly, there is no sign that the Fed has backed off from its purchasing activity – which leaves several possible conclusions:

  1. The whole QE-unwind announcement was a hoax to test how stupid everyone is. But I doubt this.
  2. The people running the OMO are on vacation and have been replaced by algos or interns, and they just keep doing what the folks now on vacation have been doing for years. I doubt this too.
  3. The FOMC told the public what it wants to have done but forgot to tell its own people at the Trading Desk. I doubt that too.
  4. There is willfulness in it – a sign that they’re not ready, or that they want to give the markets more time to get used to the idea of it, etc. And this could be the case.
  5. They’re seeing something that worries them, and they’re holding off for now to get a clearer picture. But I doubt this because their decision to commence the QE-unwind on October 1 was unanimous, and since then nothing of enough enormity has changed.

Whatever the reason, the announced “balance sheet normalization” is not taking place. The opposite is taking place.

By contrast, when QE was started in late 2008, the Fed kicked it off with an explosive vengeance. The folks at the Trading Desk didn’t dillydally around. In the 10 weeks between September 3, 2008 and November 12, 2008, they purchased $1.3 trillion of securities, ballooning the balance sheet by 144%.

Sure, some people may say that a few weeks are not enough time to judge the Fed on its QE unwind. But this is not something we’re going to ignore. And so far, the Fed is doing the opposite of what it said it would do.

ES Morning Update October 23rd 2017

0

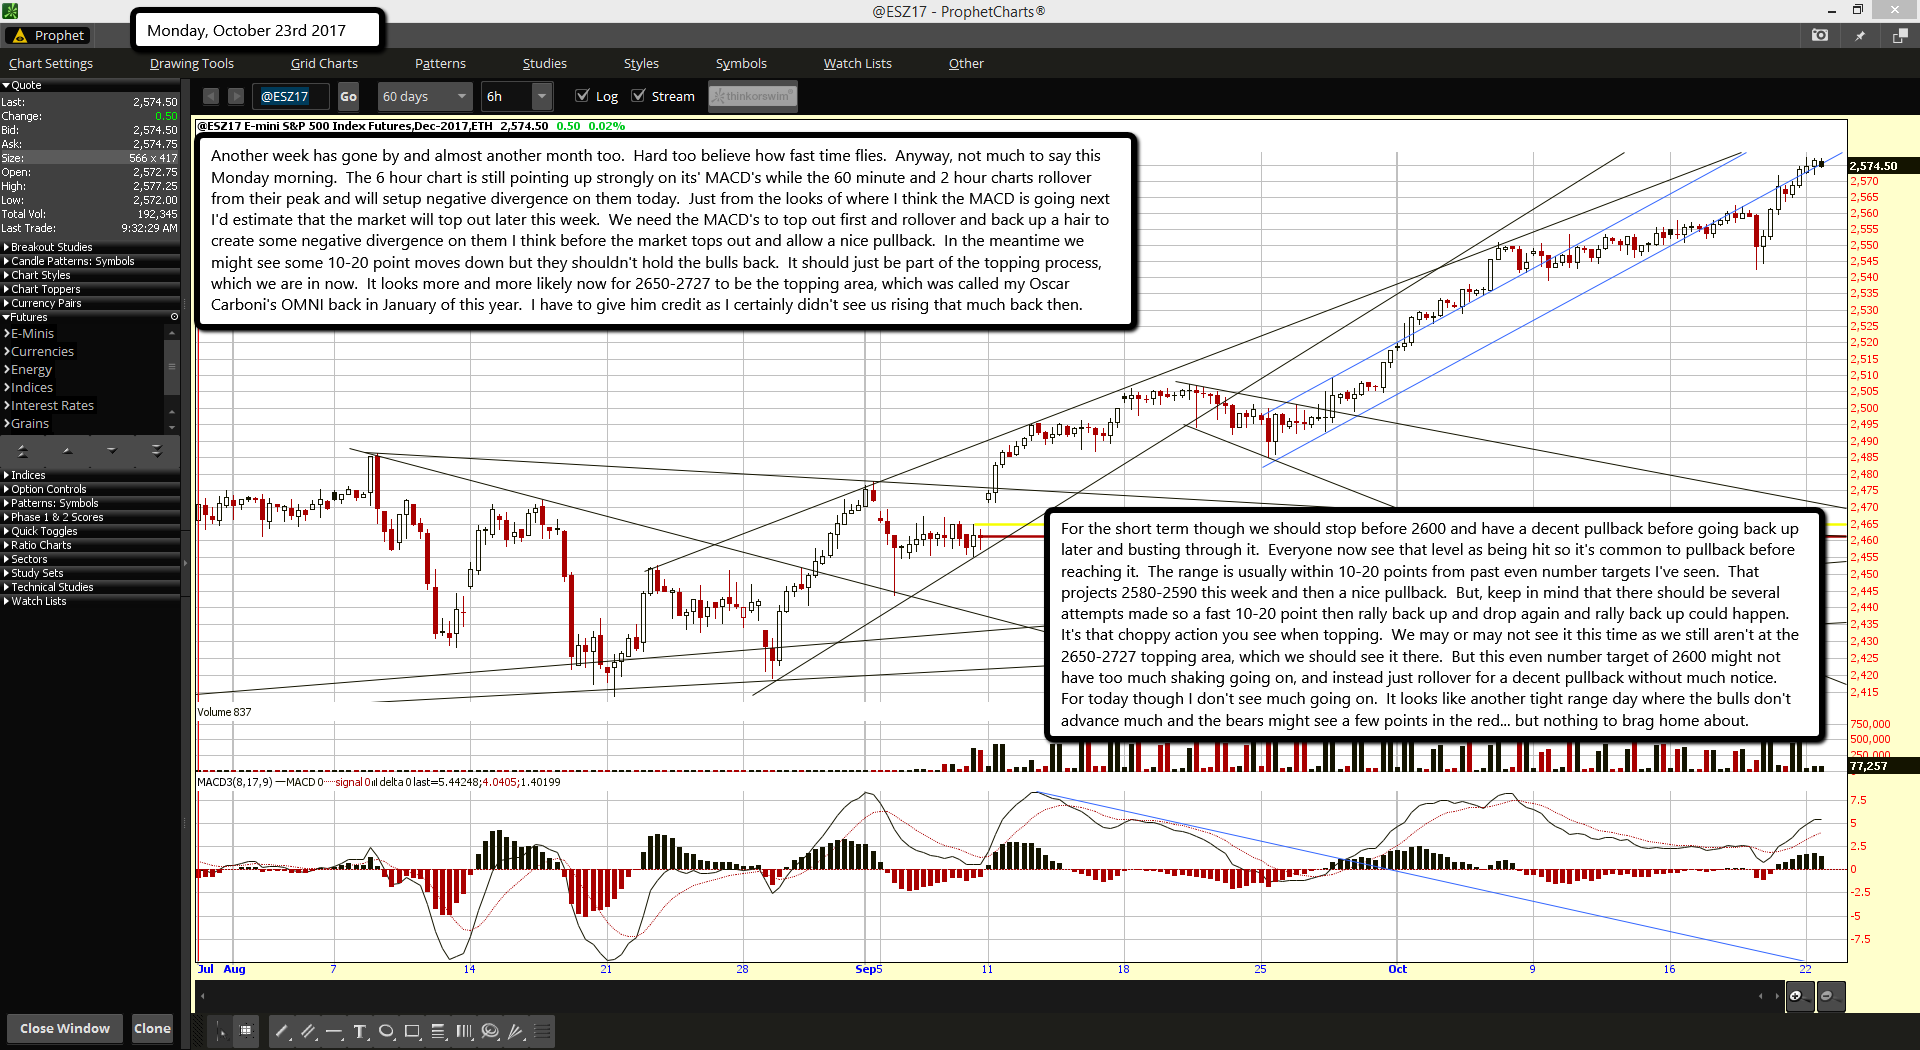
Another week has gone by and almost another month too.  Hard too believe how fast time flies.  Anyway, not much to say this Monday morning.  The 6 hour chart is still pointing up strongly on its' MACD's while the 60 minute and 2 hour charts rollover from their peak and will setup negative divergence on them today.  Just from the looks of where I think the MACD is going next I'd estimate that the market will top out later this week.  We need the MACD's to top out first and rollover and back up a hair to create some negative divergence on them I think before the market tops out and allow a nice pullback.  In the meantime we might see some 10-20 point moves down but they shouldn't hold the bulls back.  It should just be part of the topping process, which we are in now.  It looks more and more likely now for 2650-2727 to be the topping area, which was called my Oscar Carboni's OMNI back in January of this year.  I have to give him credit as I certainly didn't see us rising that much back then.

For the short term though we should stop before 2600 and have a decent pullback before going back up later and busting through it.  Everyone now see that level as being hit so it's common to pullback before reaching it.  The range is usually within 10-20 points from past even number targets I've seen.  That projects 2580-2590 this week and then a nice pullback.  But, keep in mind that there should be several attempts made so a fast 10-20 point then rally back up and drop again and rally back up could happen.  It's that choppy action you see when topping.  We may or may not see it this time as we still aren't at the 2650-2727 topping area, which we should see it there.  But this even number target of 2600 might not have too much shaking going on, and instead just rollover for a decent pullback without much notice.  For today though I don't see much going on.  It looks like another tight range day where the bulls don't advance much and the bears might see a few points in the red... but nothing to brag home about.

ES Morning Update October 20th 2017

0

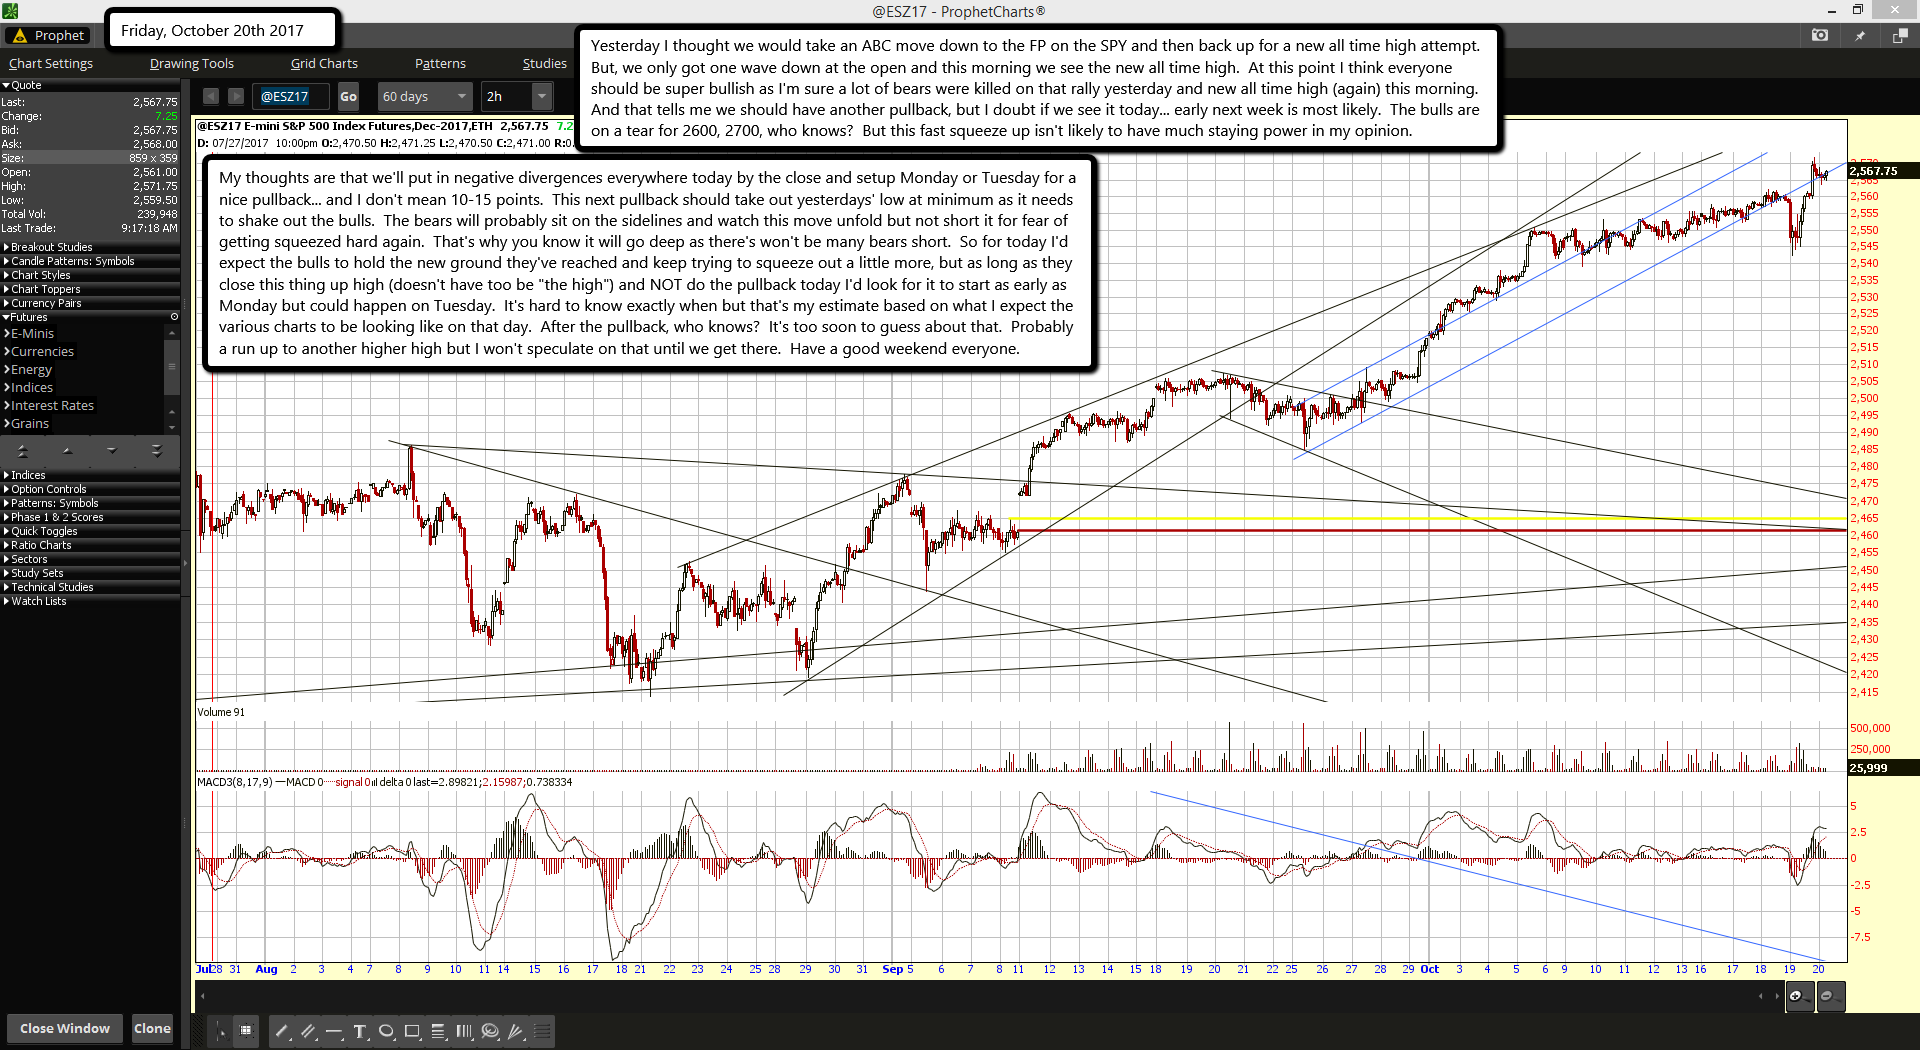
Yesterday I thought we would take an ABC move down to the FP on the SPY and then back up for a new all time high attempt.  But, we only got one wave down at the open and this morning we see the new all time high.  At this point I think everyone should be super bullish as I'm sure a lot of bears were killed on that rally yesterday and new all time high (again) this morning.  And that tells me we should have another pullback, but I doubt if we see it today... early next week is most likely.  The bulls are on a tear for 2600, 2700, who knows?  But this fast squeeze up isn't likely to have much staying power in my opinion.

My thoughts are that we'll put in negative divergences everywhere today by the close and setup Monday or Tuesday for a nice pullback... and I don't mean 10-15 points.  This next pullback should take out yesterdays' low at minimum as it needs to shake out the bulls.  The bears will probably sit on the sidelines and watch this move unfold but not short it for fear of getting squeezed hard again.  That's why you know it will go deep as there's won't be many bears short.  So for today I'd expect the bulls to hold the new ground they've reached and keep trying to squeeze out a little more, but as long as they close this thing up high (doesn't have too be "the high") and NOT do the pullback today I'd look for it to start as early as Monday but could happen on Tuesday.  It's hard to know exactly when but that's my estimate based on what I expect the various charts to be looking like on that day.  After the pullback, who knows?  It's too soon to guess about that.  Probably a run up to another higher high but I won't speculate on that until we get there.  Have a good weekend everyone.

ES Morning Update October 19th 2017

0

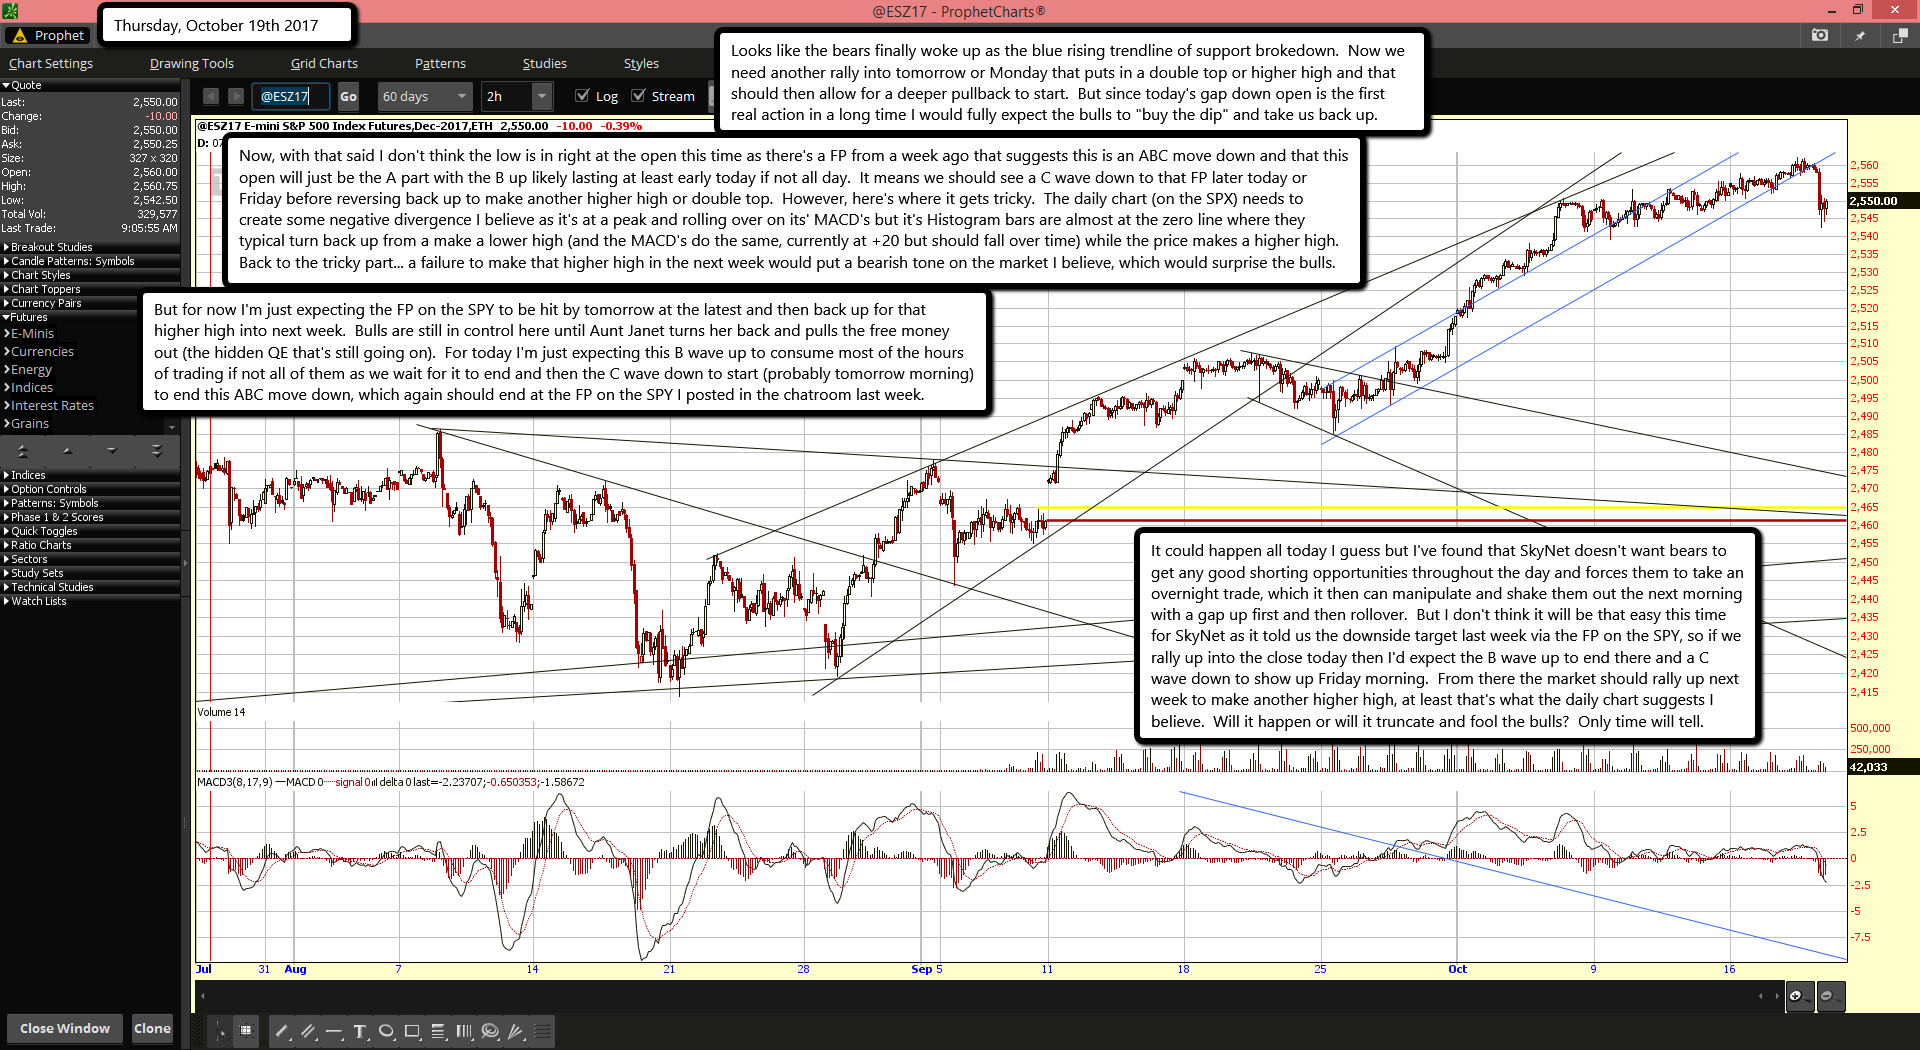
Looks like the bears finally woke up as the blue rising trendline of support brokedown.  Now we need another rally into tomorrow or Monday that puts in a double top or higher high and that should then allow for a deeper pullback to start.  But since today's gap down open is the first real action in a long time I would fully expect the bulls to "buy the dip" and take us back up.

Now, with that said I don't think the low is in right at the open this time as there's a FP from a week ago that suggests this is an ABC move down and that this open will just be the A part with the B up likely lasting at least early today if not all day.  It means we should see a C wave down to that FP later today or Friday before reversing back up to make another higher high or double top.  However, here's where it gets tricky.  The daily chart (on the SPX) needs to create some negative divergence I believe as it's at a peak and rolling over on its' MACD's but it's Histogram bars are almost at the zero line where they typical turn back up from a make a lower high (and the MACD's do the same, currently at +20 but should fall over time) while the price makes a higher high.  Back to the tricky part... a failure to make that higher high in the next week would put a bearish tone on the market I believe, which would surprise the bulls.

But for now I'm just expecting the FP on the SPY to be hit by tomorrow at the latest and then back up for that higher high into next week.  Bulls are still in control here until Aunt Janet turns her back and pulls the free money out (the hidden QE that's still going on).  For today I'm just expecting this B wave up to consume most of the hours of trading if not all of them as we wait for it to end and then the C wave down to start (probably tomorrow morning) to end this ABC move down, which again should end at the FP on the SPY I posted in the chatroom last week.

It could happen all today I guess but I've found that SkyNet doesn't want bears to get any good shorting opportunities throughout the day and forces them to take an overnight trade, which it then can manipulate and shake them out the next morning with a gap up first and then rollover.  But I don't think it will be that easy this time for SkyNet as it told us the downside target last week via the FP on the SPY, so if we rally up into the close today then I'd expect the B wave up to end there and a C wave down to show up Friday morning.  From there the market should rally up next week to make another higher high, at least that's what the daily chart suggests I believe.  Will it happen or will it truncate and fool the bulls?  Only time will tell.

Goldman Sachs’ chief equity strategist says there is an 88% chance we’re heading into a bear market

0

Goldman Sachs has circulated a fascinating but scary research note to clients suggesting that the probability of stocks entering a bear market in the next 24 months currently stands at about 88%, based on the history of previous bear markets.

The note is titled “Bear Necessities. Should we worry now?” It is an exhaustive, 87-page dive through macroeconomic data and stock market activity going all the way back to the early 20th Century. It was written in September by London-based Chief Global Equity Strategist Peter Oppenheimer, and European strategists Sharon Bell and Lilia Iehle Peytavin. Most of their data focus on the US S&P 500 index of stocks – the largest and most-followed of the share indices globally.

Here is the historic context. The S&P is currently the second largest and longest bull run in history.

The index is also relatively expensive, the Goldman trio says. The aggregate valuation of the S&P 500 is now in its 88th percentile, as measured since 1976, according to Goldman’s calculations. The median stock is in the 99th percentile.

The trio calculated a risk index based on the Shiller price-earnings ratio (the price of S&P 500 stocks divided by the average of 10 years of earnings, adjusted for inflation), the US ISM manufacturing index, unemployment (very low), the bond yield curve, and core inflation.

The resultant “GS Bear Market Indicator” is currently flashing at 67%. The indicator typically hits highs right before a bear market in US stocks appears:

Historically, when the indicator is at 67%, there is an 88% chance of stocks falling into a bear market in two years’ time, the Goldman analysts say:

However, the chance of a bear growling into view in the near-term remains low — just 35%.

Bear markets are triggered in three different ways, Oppenheimer et al argue:

  • “Cyclical” bear markets are trigged by rising interest rates and recessions;
  • “Event-driven” bears come from negative economic shocks like war or emerging market crises;
  • “Structural” bears come from financial bubbles.

Depending on your point of view, all three of those triggers are hovering on the horizon: The Fed and the Bank of England are both signalling interest rates will rise; US President Trump is threatening military action in North Korea; and plenty of people think the low-interest rate environment of the last 10 years has inflated asset bubbles in stocks, real estate and property in Europe, and private equity tech startup valuations.

However, Oppenheimer also believes that a bear market is currently being held back by low inflation, which in turn will force central banks to keep interest rates very low. “Rising inflation remains elusive,” he wrote in a recent column for the Financial Times. “Market prices continue to reflect a low risk that interest rates will increase enough to trigger a recession in the near future.”

If a bear market does happen it will be a roller coaster ride. Goldman created this diagram based on an average of historic data. Typical bear markets feature a false “bounce,” in which stocks decline suddenly but then recover, reassuring investors (who then get crushed in the months afterwards) or giving clever investors a second chance to get the heck out of stocks.

Buckle up!

ES Morning Update October 18th 2017

0

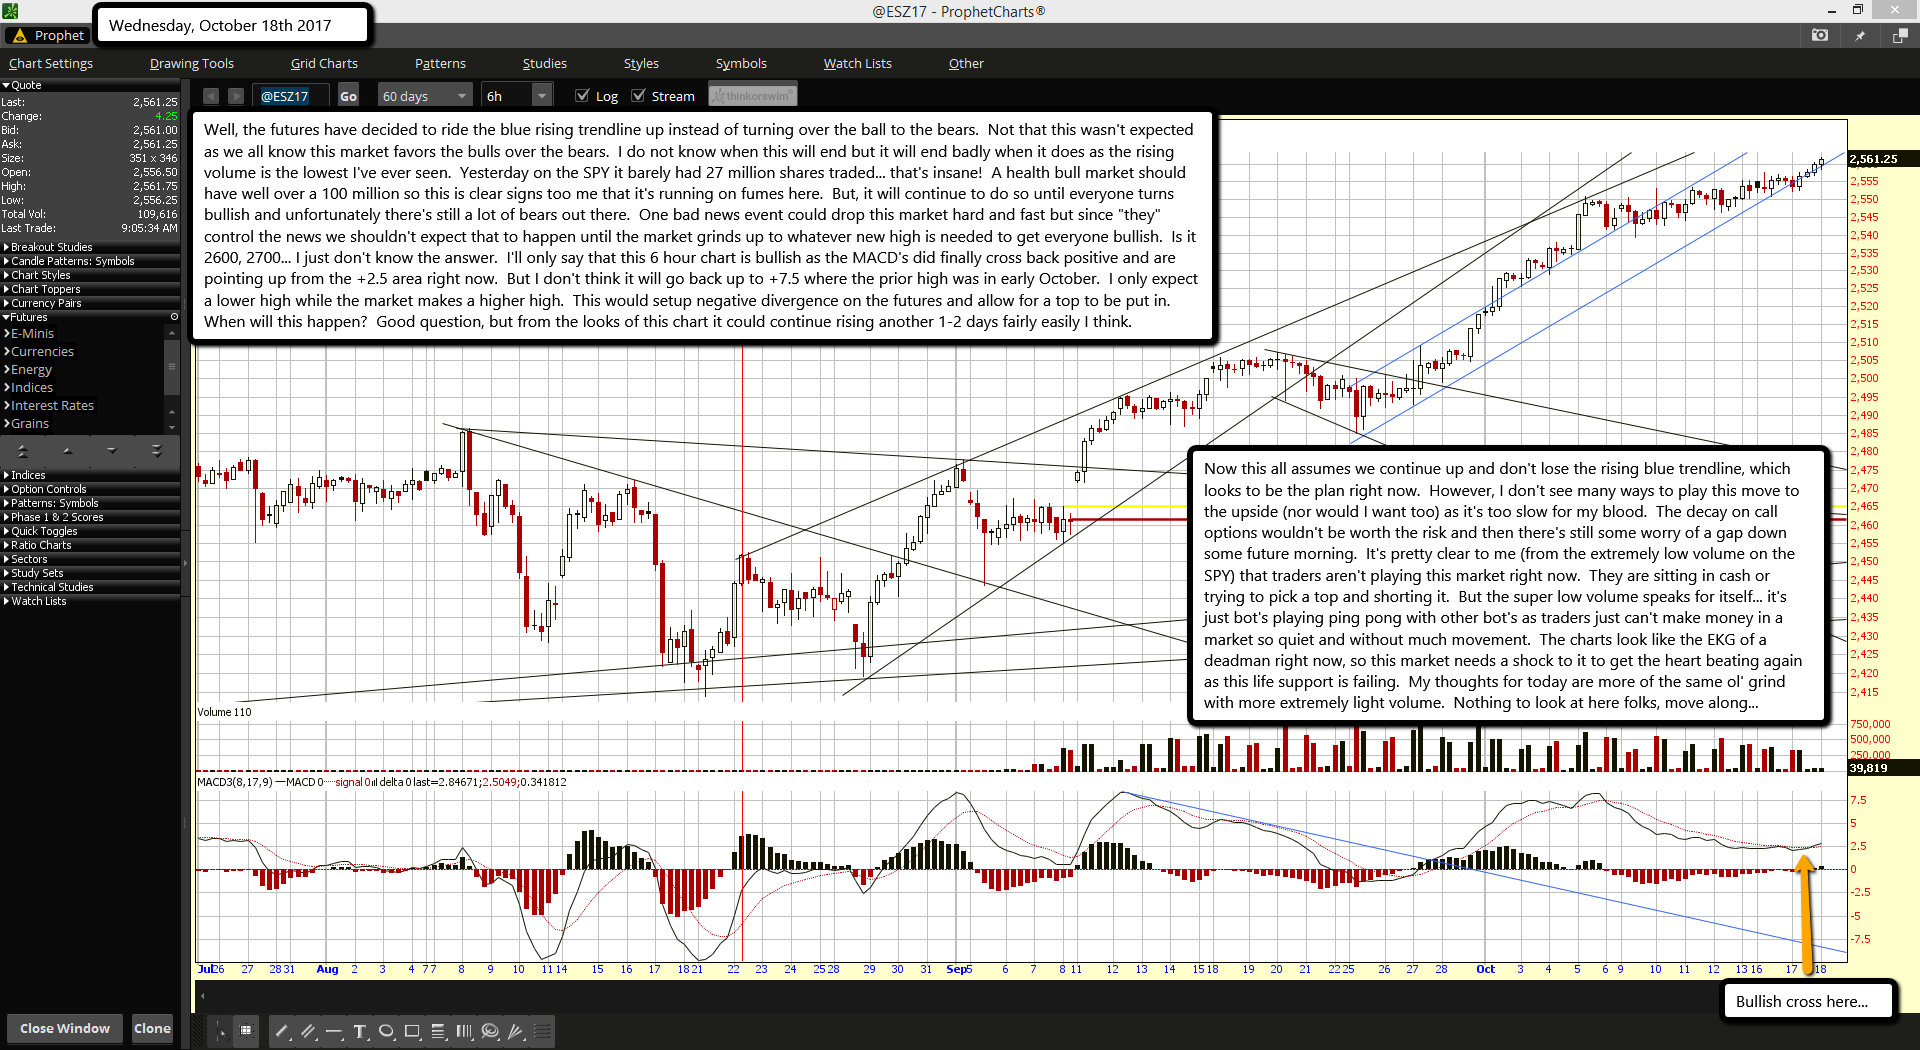
Well, the futures have decided to ride the blue rising trendline up instead of turning over the ball to the bears.  Not that this wasn't expected as we all know this market favors the bulls over the bears.  I do not know when this will end but it will end badly when it does as the rising volume is the lowest I've ever seen.  Yesterday on the SPY it barely had 27 million shares traded... that's insane!  A health bull market should have well over a 100 million so this is clear signs too me that it's running on fumes here.  But, it will continue to do so until everyone turns bullish and unfortunately there's still a lot of bears out there.  One bad news event could drop this market hard and fast but since "they" control the news we shouldn't expect that to happen until the market grinds up to whatever new high is needed to get everyone bullish.  Is it 2600, 2700... I just don't know the answer.  I'll only say that this 6 hour chart is bullish as the MACD's did finally cross back positive and are pointing up from the +2.5 area right now.  But I don't think it will go back up to +7.5 where the prior high was in early October.  I only expect a lower high while the market makes a higher high.  This would setup negative divergence on the futures and allow for a top to be put in.  When will this happen?  Good question, but from the looks of this chart it could continue rising another 1-2 days fairly easily I think.

Now this all assumes we continue up and don't lose the rising blue trendline, which looks to be the plan right now.  However, I don't see many ways to play this move to the upside (nor would I want too) as it's too slow for my blood.  The decay on call options wouldn't be worth the risk and then there's still some worry of a gap down some future morning.  It's pretty clear to me (from the extremely low volume on the SPY) that traders aren't playing this market right now.  They are sitting in cash or trying to pick a top and shorting it.  But the super low volume speaks for itself... it's just bot's playing ping pong with other bot's as traders just can't make money in a market so quiet and without much movement.  The charts look like the EKG of a deadman right now, so this market needs a shock to it to get the heart beating again as this life support is failing.  My thoughts for today are more of the same ol' grind with more extremely light volume.  Nothing to look at here folks, move along...

ES Morning Update October 17th 2017

0

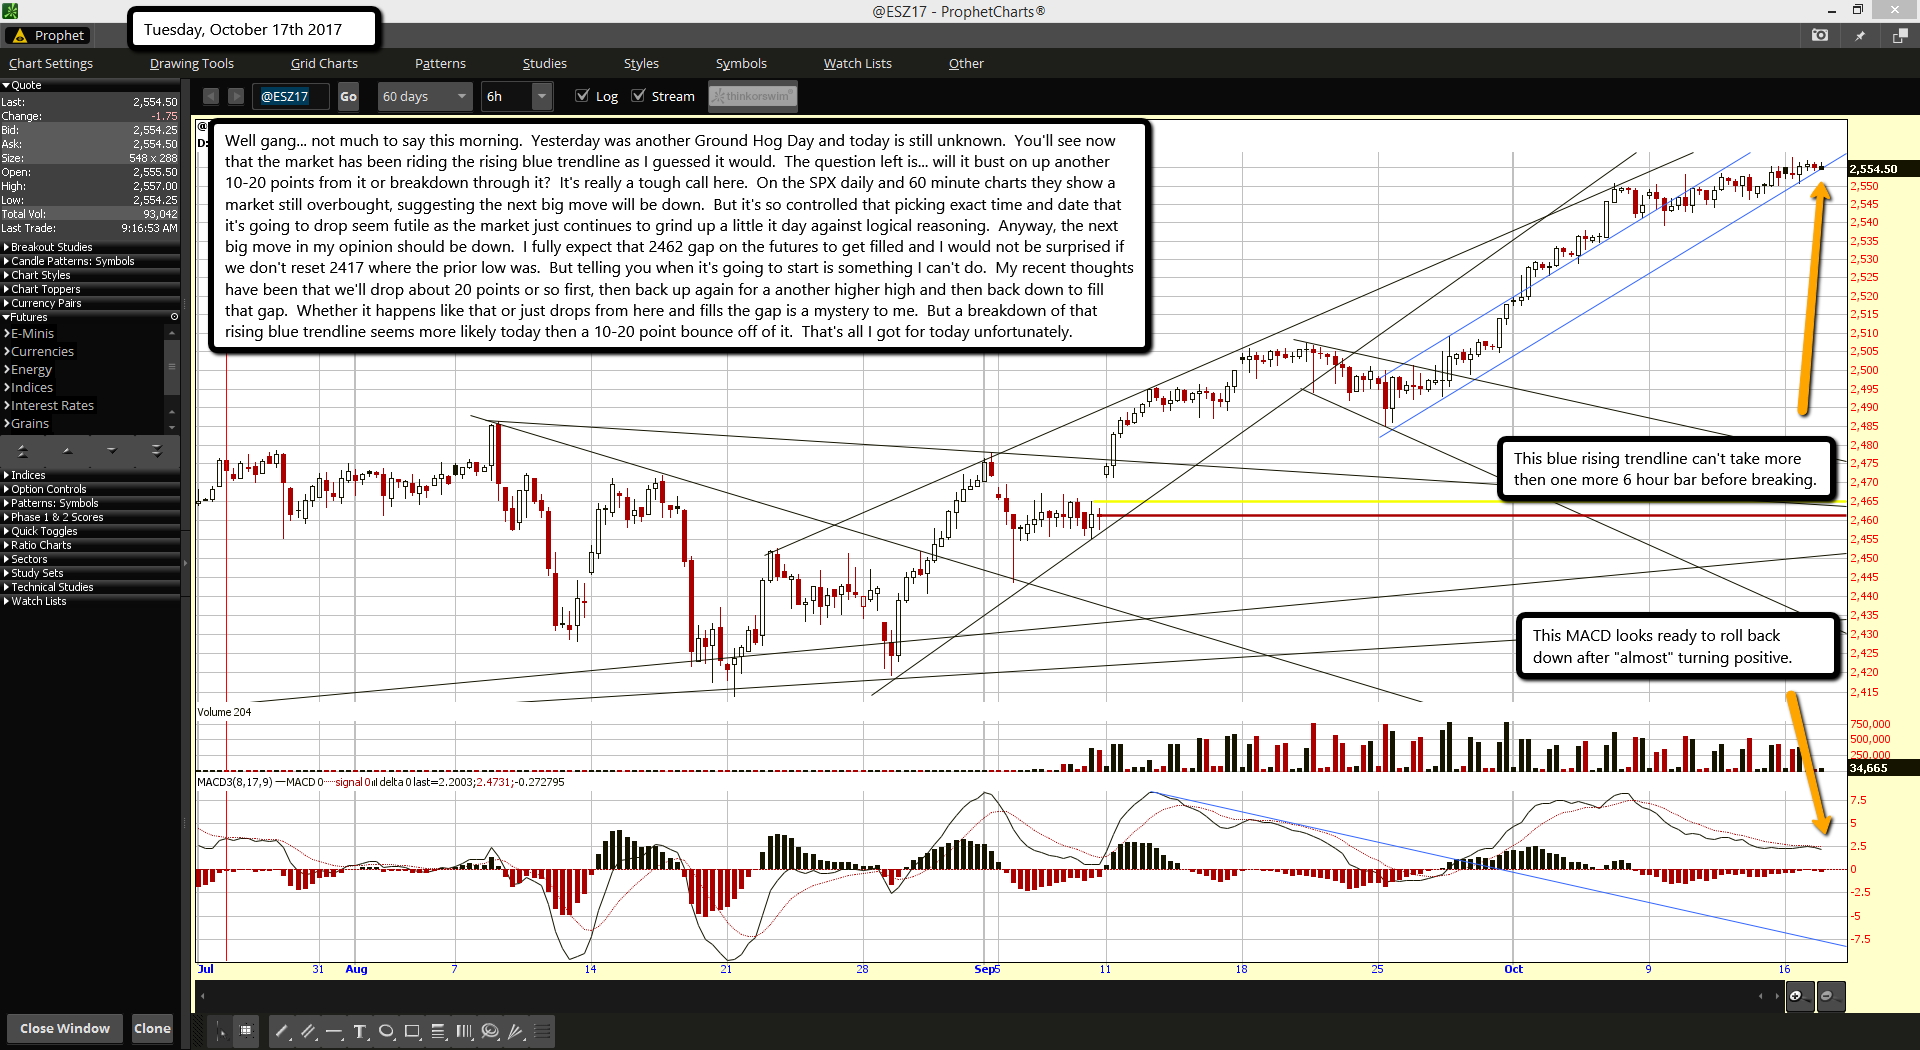
Well gang... not much to say this morning.  Yesterday was another Ground Hog Day and today is still unknown.  You'll see now that the market has been riding the rising blue trendline as I guessed it would.  The question left is... will it bust on up another 10-20 points from it or breakdown through it?  It's really a tough call here.  On the SPX daily and 60 minute charts they show a market still overbought, suggesting the next big move will be down.  But it's so controlled that picking exact time and date that it's going to drop seem futile as the market just continues to grind up a little it day against logical reasoning.  Anyway, the next big move in my opinion should be down.  I fully expect that 2462 gap on the futures to get filled and I would not be surprised if we don't reset 2417 where the prior low was.  But telling you when it's going to start is something I can't do.  My recent thoughts have been that we'll drop about 20 points or so first, then back up again for a another higher high and then back down to fill that gap.  Whether it happens like that or just drops from here and fills the gap is a mystery to me.  But a breakdown of that rising blue trendline seems more likely today then a 10-20 point bounce off of it.  That's all I got for today unfortunately.

ES Morning Update October 16th 2017

0

Looking at the 6 hour chart this morning its' looking bullish to me.  The MACD is about to cross back up positive after flat-lining in the +2.5 area for several day.  Of course it could also be tired from many days sideways without a successful turn back up, so it could rollover too.  But, it's well known that the market is rigged for the bulls.  So when you see bullish setups, like bull flags, inverted head and shoulders, cup and handle patterns and a MACD getting close to crossing back into positive you have to think that odds favor them working out 90% of the time.

On the flip side I doubt if they work out 50% of the time for bears.  Now, that doesn't mean I would go long up here.  I think this market is super stretched to the upside and needs a pullback soon.  But this bullish cross on the MACD could support another 10-20 move higher before getting tired again.  You can also see that it's really close to the lower blue rising trendline of the rising channel now.  That should act as support for it to bounce off of if it plans on going higher.  Failure here would be bad for the bulls as it would allow a nice 20 or more point pullback.  I'd like to think it would allow more but the buy the dipper gang probably won't allow it.

I personally don't see much support on the downside until 2490-2505 but I seriously doubt if we drop that far on the first break of that rising blue trendline of support.  Since these are 6 hours bars it could drag out another 1-2 bars before touching the line, which puts us into Tuesday.  So today could be a sideways day until the bulls decide if they have enough mojo to muster up another 10-20 points or if they want to pass the ball over to the bears for a small pullback.  Odds favor the bulls as they are the chosen team but it's not clear which way we are going today.  Since it's a Monday and the bulls have around 1-2 more candles until hitting that blue trendline my thoughts are that they will go sideways again to up.

The strength of the up part should give us clues to how strong or weak they really are.  If slow on the move up, meaning more of the same old grind, then it's weakness... and that will lead to a pullback at some point this week.  If strength is shown by the bulls then we might only see more sideways trading after a fast 10-20 point move up, which just builds a base for another launch higher at some future date.  My thoughts... we'll grind up slowly and then pullback fast but not too deep, thus making a week full of some action for a change.  But I doubt if we see 2500 this week... next week, who knows?

ES Morning Update October 13th 2017

0

The futures are up a little this morning in what looks like it "could" be the squeeze higher I've been looking for?  If we tag on another 10-20 points and reverse then today might be similar to 8/8/17, but if it holds all day long into the close then it might be pushed out until Monday.  So we are looking for top today or Monday I think as everything is setting up nicely now to complete wave 5's of various degrees.  This 6 hour chart shows a MACD that is curling back up this morning, but I don't expect it to race up to +7.5 area again.  It should instead put in a lower high, and since it's a 6 hour chart this could drag out over the weekend and into Monday before rolling back over.  It's hard to chase this up but it's just as hard to short it too early.  No doubt the bulls climb a wall of worry as each day they gain a few more inches as the bears can barely pull them back one inch from time to time.  Short update for today. I'm looking for a slow grind up all day that holds until the close and most likely carries over into Monday.  Kinda pointless calling levels but the norm is 10-20 up with a bullish setup like we have currently.  Have a great weekend and look for a top on Monday (possibly Tuesday, but low odds) and then pullback to 2500 area would be my best guess.

ES Morning Update October 12th 2017

0

Some weakness this morning but I still don't think the bulls are ready to give up just yet. I'd like to see some exhaustion type squeeze up before I think we'll rollover... kinda like the 8/8 pop and drop. Now it doesn't have to happen in the morning via a gap up (which would be preferred), but I do think we need one to show up. Maybe it comes from a slow grind up into the close today or Friday? Either way I do think it's coming as the longer we chop sideways the better defined the bull flag is... but if it doesn't pop soon it could produce a failed bull flag and just drop hard. I'd give it until tomorrow to see if it's going to play out or not. We all know how rigged the market is in favor of the bulls so I do expect it to work again. Other the that I don't see much clues in the charts for the direction today. They look bearish here on this 6 hour chart but we are still trading sideways in a tight range, so until we breakout one direction or the other it's just a flip of a coin here. My thoughts are still that we are close to a top before a nice pullback happens, but whether that is today or not is just not something I know the answer too? I would like to see that pop of 10-20 points higher as I think that would kill the last bear, but it's not looking likely for today. I'll end it here as I've said everything there is to say now in the prior posts. A top is near, like within days I think, but nailing it exactly is really hard.

Goldman Sachs considers trading bitcoin & other cryptocurrencies

0

A new trading operation dedicated to digital currencies is being explored by Goldman Sachs, sources told the Wall Street Journal. It could be the first blue-chip Wall Street firm to deal directly in the growing yet controversial cryptocurrency market.

“In response to client interest in digital currencies, we are exploring how best to serve them in this space,” said an unnamed Goldman spokeswoman.

According to people familiar with the matter, Goldman’s effort involves both its currency trading division and the bank’s strategic investment group. The firm sees bitcoin’s future more as a payment method rather than a store of value.

Sources also said Goldman’s effort is in its early stages and may not proceed. The firm’s interest, however, could strengthen bitcoin’s position as digital currencies were initially viewed as havens for illicit activity.

Big banks such as UBS, Barclays, ING, Goldman Sachs and BNY Mellon have recently announced ventures into the blockchain technology that allows digital currencies to function and be transferred safely.

BNP Paribas has said it is looking to add bitcoin to one of its currency funds and has been doing "beta testing" involving the cryptocurrency.

Societe Generale and JPMorgan even published job offers for an IT developer and technician on bitcoin, blockchains, and cryptocurrencies.

Morgan Stanley Chief Executive James Gorman said bitcoin is “obviously highly speculative, but it’s not inherently bad.”

According to research firm Autonomous NEXT, around 70 hedge funds are currently investing in cryptocurrencies.

Control over virtual currencies’ trading platforms has been tightened recently to prevent them from becoming money laundering sites.

Last month, Chinese authorities cracked down on cryptocurrencies, ordering the country’s exchanges to suspend operations. Beijing banned initial coin offerings (ICOs), referring to them as an unauthorized fundraising tool that may involve financial scams.

The move was followed by South Korea, with the country’s financial regulator saying it will ban money raising through all forms of virtual currencies.

In July, the US Securities and Exchange Commission warned that some ICOs should be regulated like other securities. Authorities in Singapore and Canada have issued similar warnings.

s2Member®