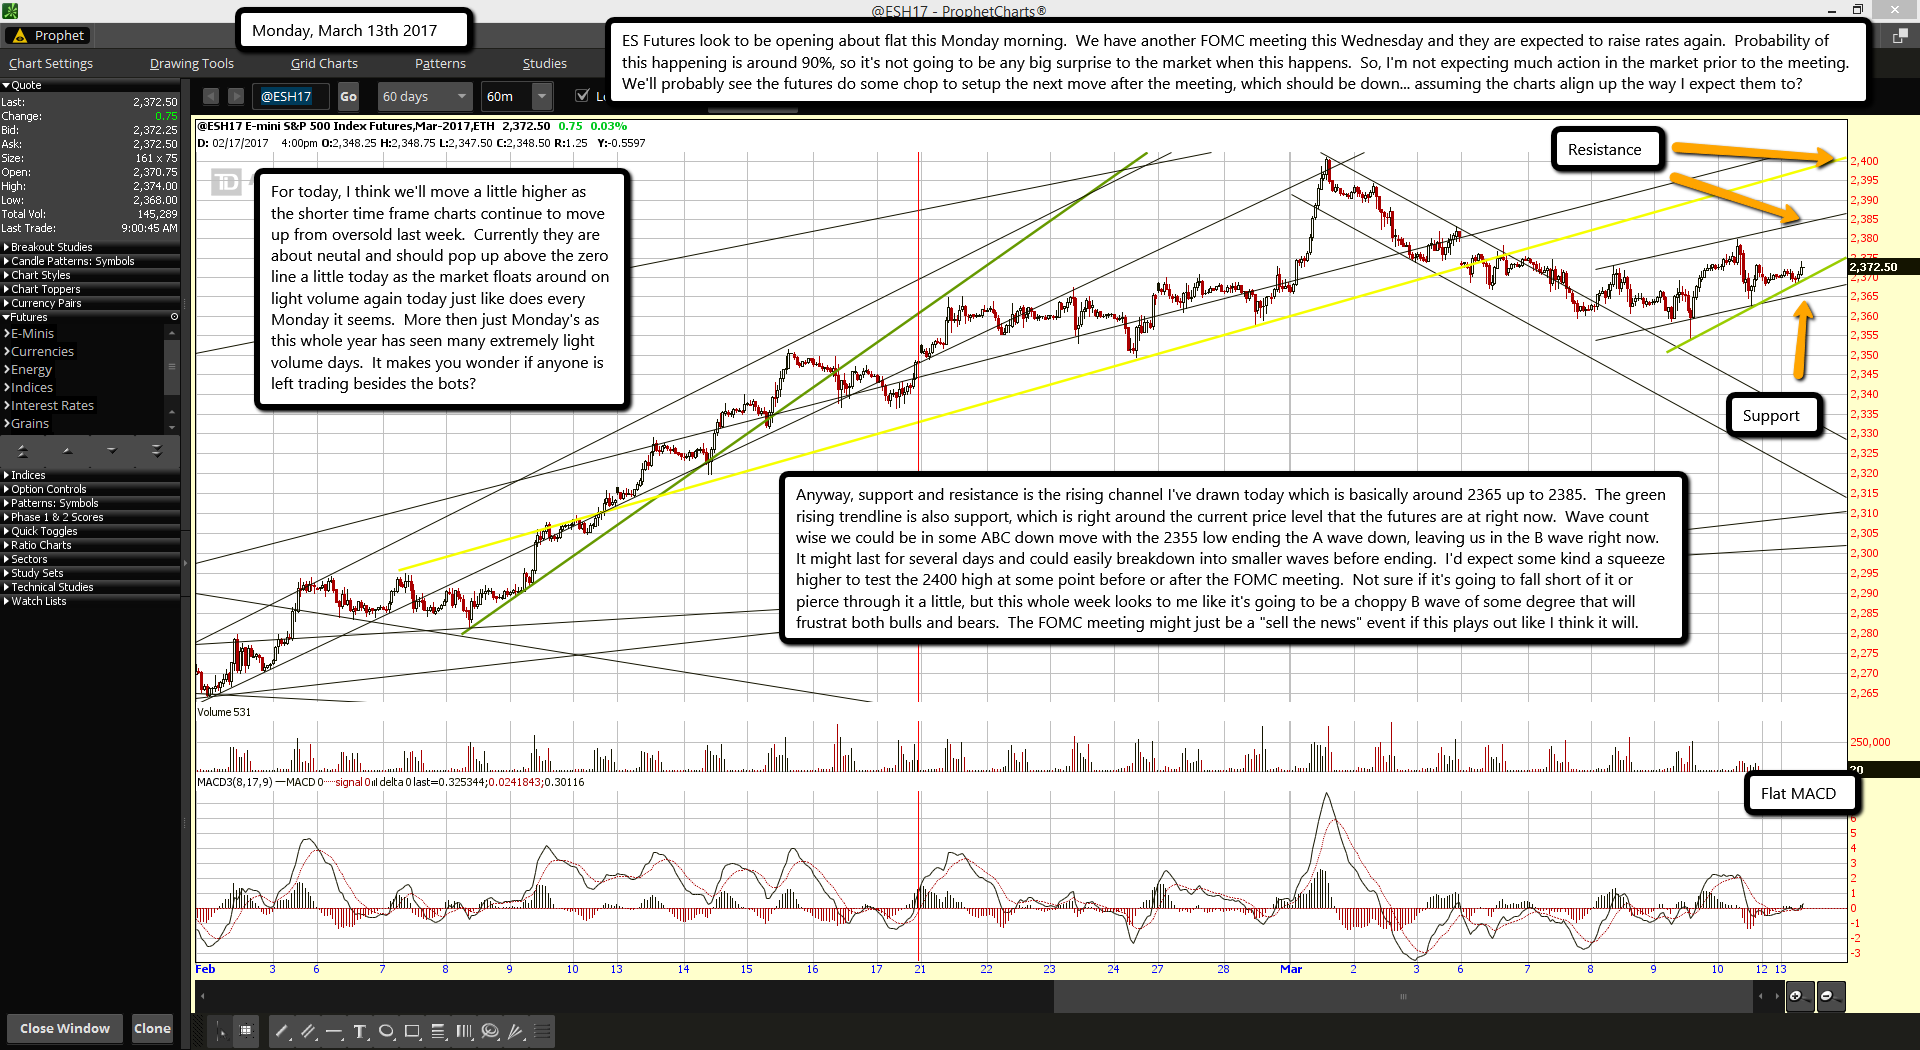
ES Futures look to be opening about flat this Monday morning. We have another FOMC meeting this Wednesday and they are expected to raise rates again. Probability of this happening is around 90%, so it's not going to be any big surprise to the market when this happens. So, I'm not expecting much action in the market prior to the meeting. We'll probably see the futures do some chop to setup the next move after the meeting, which should be down... assuming the charts align up the way I expect them to?
For today, I think we'll move a little higher as the shorter time frame charts continue to move up from oversold last week. Currently they are about neutal and should pop up above the zero line a little today as the market floats around on light volume again today just like does every Monday it seems. More then just Monday's as this whole year has seen many extremely light volume days. It makes you wonder if anyone is left trading besides the bots?
Anyway, support and resistance is the rising channel I've drawn today which is basically around 2365 up to 2385. The green rising trendline is also support, which is right around the current price level that the futures are at right now. Wave count wise we could be in some ABC down move with the 2355 low ending the A wave down, leaving us in the B wave right now. It might last for several days and could easily breakdown into smaller waves before ending. I'd expect some kind a squeeze higher to test the 2400 high at some point before or after the FOMC meeting. Not sure if it's going to fall short of it or pierce through it a little, but this whole week looks to me like it's going to be a choppy B wave of some degree that will frustrat both bulls and bears. The FOMC meeting might just be a "sell the news" event if this plays out like I think it will.
Well gang... it's Friday! Aren't you happy? You can go party now... except that you are addicted to trading now and view the stock market as your party. Then add in the fact that you are no longer 18 years old and can't handle the hangovers you get at your current age. So you now look at the weekend as a time to do chores around the house while you look forward to Monday coming where you can gamble some more in the casino called the stock market. Funny how things flip flop as you get older. The weekends now sucks you have spend them around the house doing things while your trading Monday through Friday (aka... your work or job) is what you look forward too. Such is life...
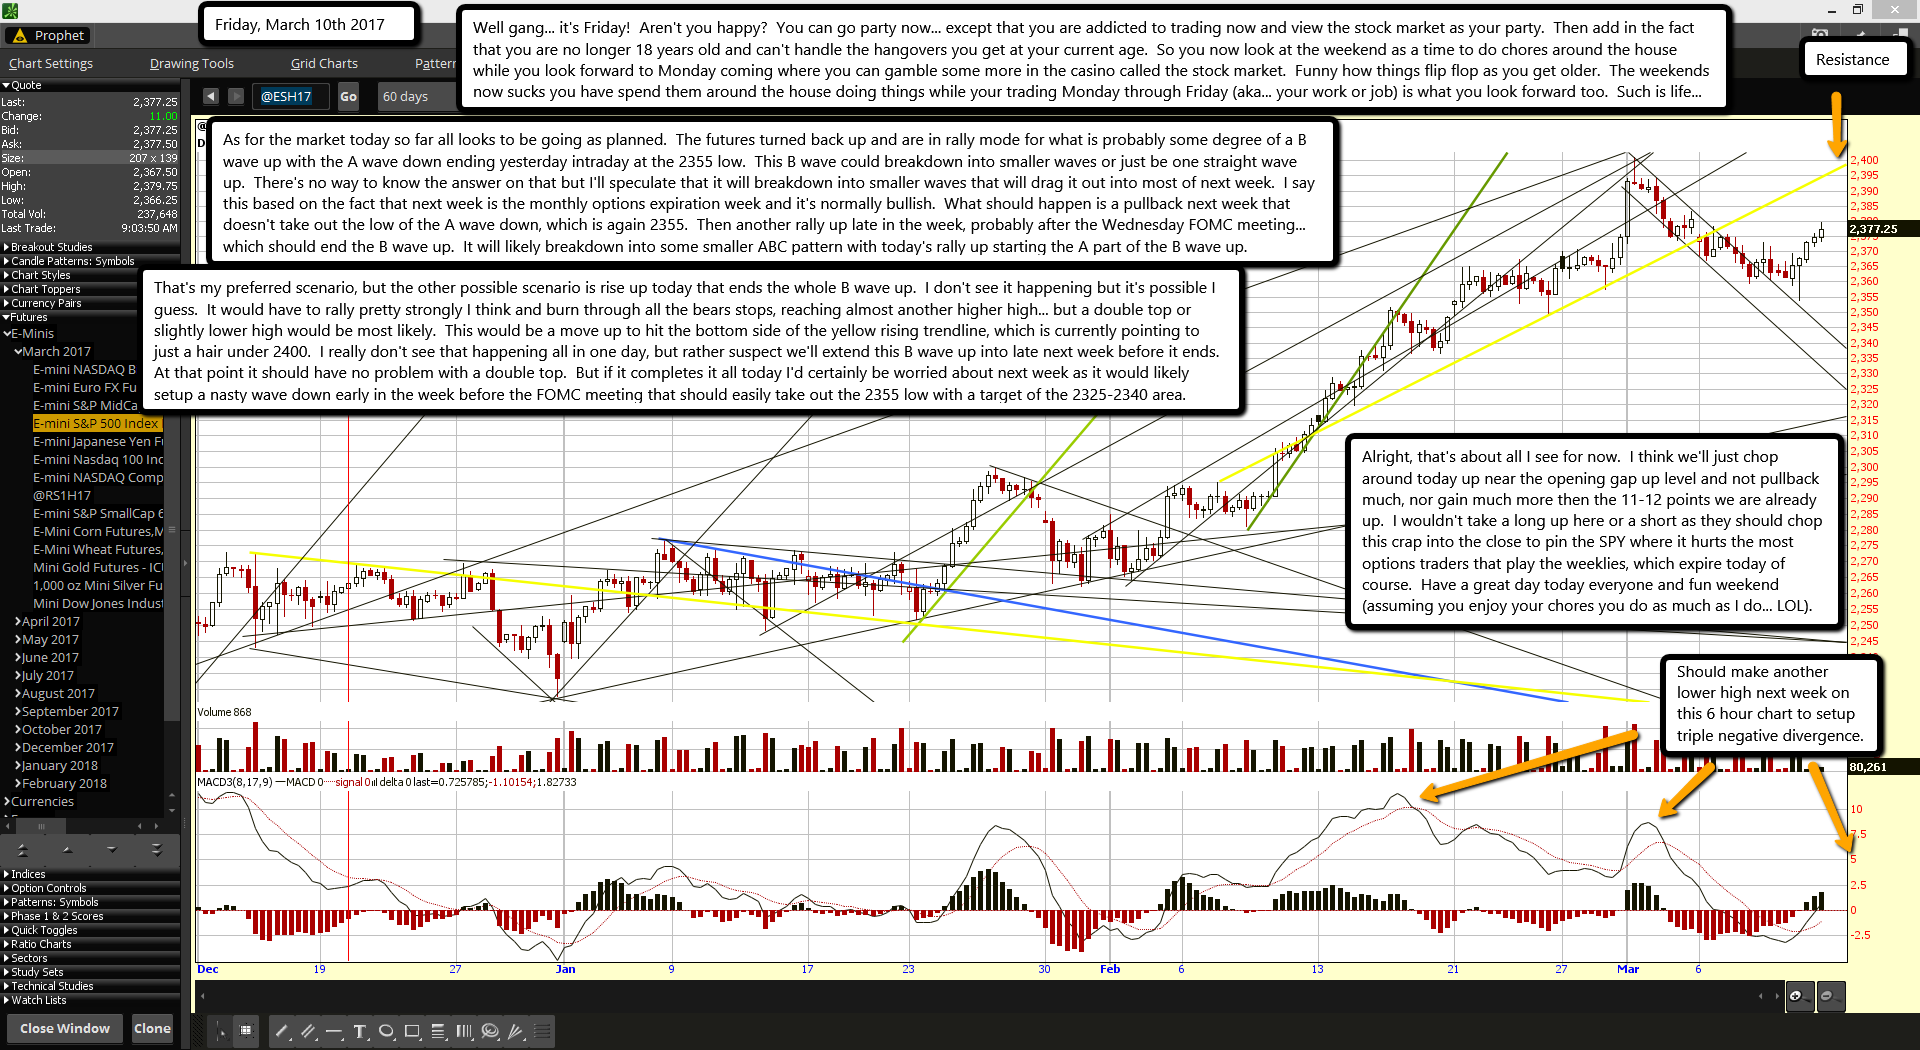
As for the market today so far all looks to be going as planned. The futures turned back up and are in rally mode for what is probably some degree of a B wave up with the A wave down ending yesterday intraday at the 2355 low. This B wave could breakdown into smaller waves or just be one straight wave up. There's no way to know the answer on that but I'll speculate that it will breakdown into smaller waves that will drag it out into most of next week. I say this based on the fact that next week is the monthly options expiration week and it's normally bullish. What should happen is a pullback next week that doesn't take out the low of the A wave down, which is again 2355. Then another rally up late in the week, probably after the Wednesday FOMC meeting... which should end the B wave up. It will likely breakdown into some smaller ABC pattern with today's rally up starting the A part of the B wave up.
That's my preferred scenario, but the other possible scenario is rise up today that ends the whole B wave up. I don't see it happening but it's possible I guess. It would have to rally pretty strongly I think and burn through all the bears stops, reaching almost another higher high... but a double top or slightly lower high would be most likely. This would be a move up to hit the bottom side of the yellow rising trendline, which is currently pointing to just a hair under 2400. I really don't see that happening all in one day, but rather suspect we'll extend this B wave up into late next week before it ends. At that point it should have no problem with a double top. But if it completes it all today I'd certainly be worried about next week as it would likely setup a nasty wave down early in the week before the FOMC meeting that should easily take out the 2355 low with a target of the 2325-2340 area.
Alright, that's about all I see for now. I think we'll just chop around today up near the opening gap up level and not pullback much, nor gain much more then the 11-12 points we are already up. I wouldn't take a long up here or a short as they should chop this crap into the close to pin the SPY where it hurts the most options traders that play the weeklies, which expire today of course. Have a great day today everyone and fun weekend (assuming you enjoy your chores you do as much as I do... LOL).
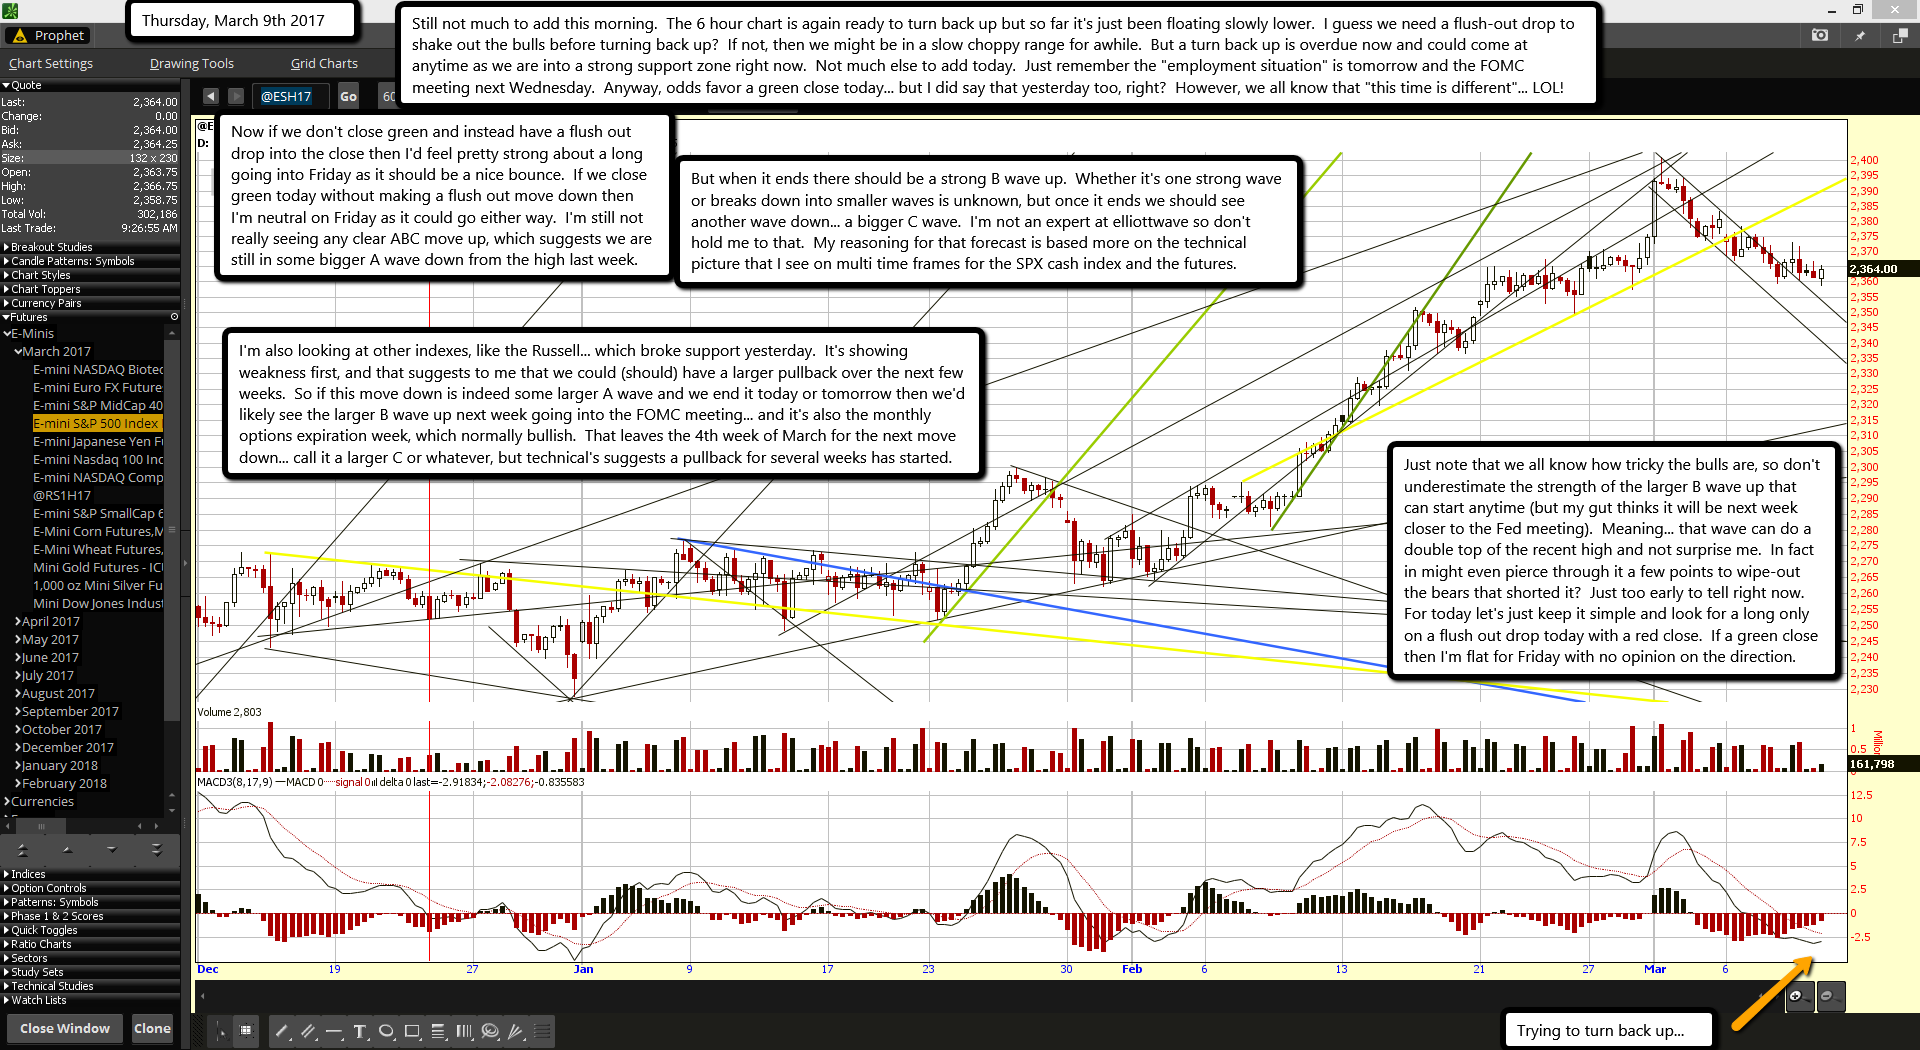
Still not much to add this morning. The 6 hour chart is again ready to turn back up but so far it's just been floating slowly lower. I guess we need a flush-out drop to shake out the bulls before turning back up? If not, then we might be in a slow choppy range for awhile. But a turn back up is overdue now and could come at anytime as we are into a strong support zone right now. Not much else to add today. Just remember the "employment situation" is tomorrow and the FOMC meeting next Wednesday. Anyway, odds favor a green close today... but I did say that yesterday too, right? However, we all know that "this time is different"... LOL!
Now if we don't close green and instead have a flush out drop into the close then I'd feel pretty strong about a long going into Friday as it should be a nice bounce. If we close green today without making a flush out move down then I'm neutral on Friday as it could go either way. I'm still not really seeing any clear ABC move up, which suggests we are still in some bigger A wave down from the high last week.
But when it ends there should be a strong B wave up. Whether it's one strong wave or breaks down into smaller waves is unknown, but once it ends we should see another wave down... a bigger C wave. I'm not an expert at elliottwave so don't hold me to that. My reasoning for that forecast is based more on the technical picture that I see on multi time frames for the SPX cash index and the futures.
I'm also looking at other indexes, like the Russell... which broke support yesterday. It's showing weakness first, and that suggests to me that we could (should) have a larger pullback over the next few weeks. So if this move down is indeed some larger A wave and we end it today or tomorrow then we'd likely see the larger B wave up next week going into the FOMC meeting... and it's also the monthly options expiration week, which normally bullish. That leaves the 4th week of March for the next move down... call it a larger C or whatever, but technical's suggests a pullback for several weeks has started.
Just note that we all know how tricky the bulls are, so don't underestimate the strength of the larger B wave up that can start anytime (but my gut thinks it will be next week closer to the Fed meeting). Meaning... that wave can do a double top of the recent high and not surprise me. In fact in might even pierce through it a few points to wipe-out the bears that shorted it? Just too early to tell right now. For today let's just keep it simple and look for a long only on a flush out drop today with a red close. If a green close then I'm flat for Friday with no opinion on the direction.
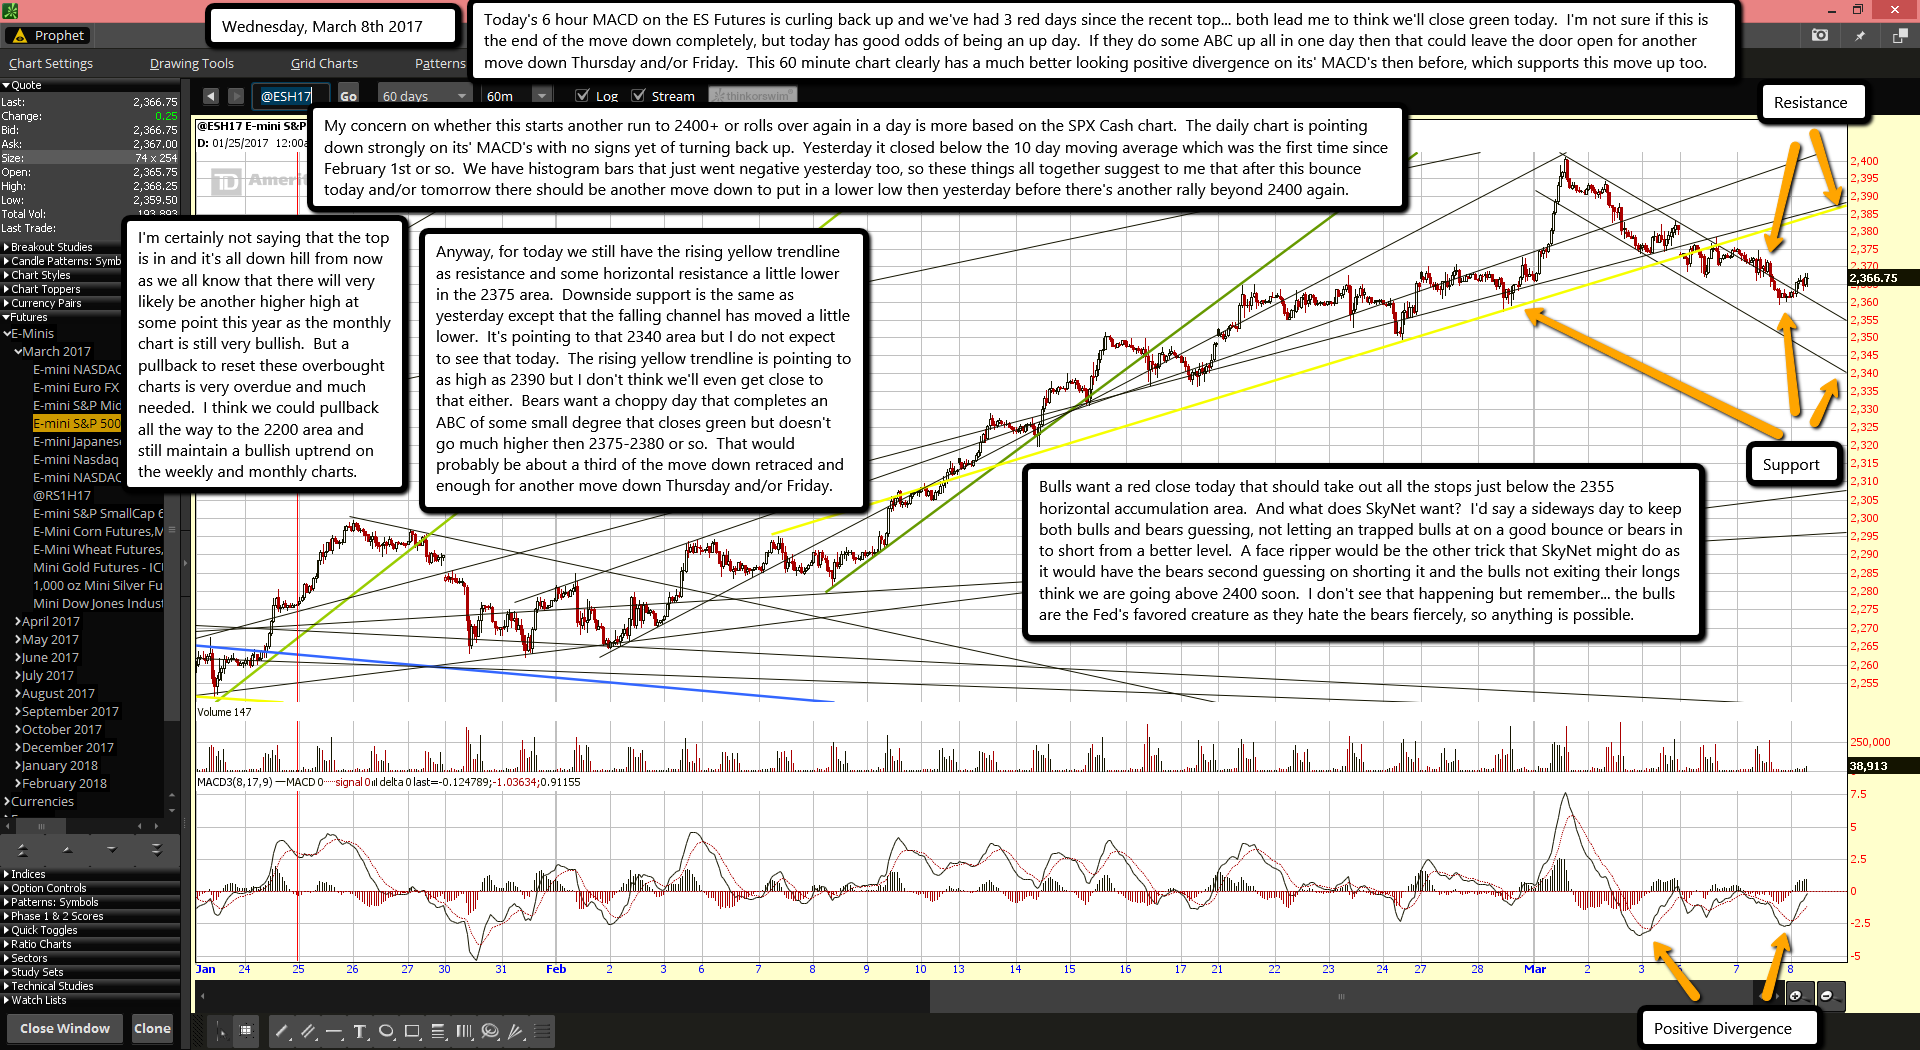
Today's 6 hour MACD on the ES Futures is curling back up and we've had 3 red days since the recent top... both lead me to think we'll close green today. I'm not sure if this is the end of the move down completely, but today has good odds of being an up day. If they do some ABC up all in one day then that could leave the door open for another move down Thursday and/or Friday. This 60 minute chart clearly has a much better looking positive divergence on its' MACD's then before, which supports this move up too.
My concern on whether this starts another run to 2400+ or rolls over again in a day is more based on the SPX Cash chart. The daily chart is pointing down strongly on its' MACD's with no signs yet of turning back up. Yesterday it closed below the 10 day moving average which was the first time since February 1st or so. We have histogram bars that just went negative yesterday too, so these things all together suggest to me that after this bounce today and/or tomorrow there should be another move down to put in a lower low then yesterday before there's another rally beyond 2400 again.
I'm certainly not saying that the top is in and it's all down hill from now as we all know that there will very likely be another higher high at some point this year as the monthly chart is still very bullish. But a pullback to reset these overbought charts is very overdue and much needed. I think we could pullback all the way to the 2200 area and still maintain a bullish uptrend on the weekly and monthly charts.
Anyway, for today we still have the rising yellow trendline as resistance and some horizontal resistance a little lower in the 2375 area. Downside support is the same as yesterday except that the falling channel has moved a little lower. It's pointing to that 2340 area but I do not expect to see that today. The rising yellow trendline is pointing to as high as 2390 but I don't think we'll even get close to that either. Bears want a choppy day that completes an ABC of some small degree that closes green but doesn't go much higher then 2375-2380 or so. That would probably be about a third of the move down retraced and enough for another move down Thursday and/or Friday.
Bulls want a red close today that should take out all the stops just below the 2355 horizontal accumulation area. And what does SkyNet want? I'd say a sideways day to keep both bulls and bears guessing, not letting an trapped bulls at on a good bounce or bears in to short from a better level. A face ripper would be the other trick that SkyNet might do as it would have the bears second guessing on shorting it and the bulls not exiting their longs think we are going above 2400 soon. I don't see that happening but remember... the bulls are the Fed's favored creature as they hate the bears fiercely, so anything is possible.
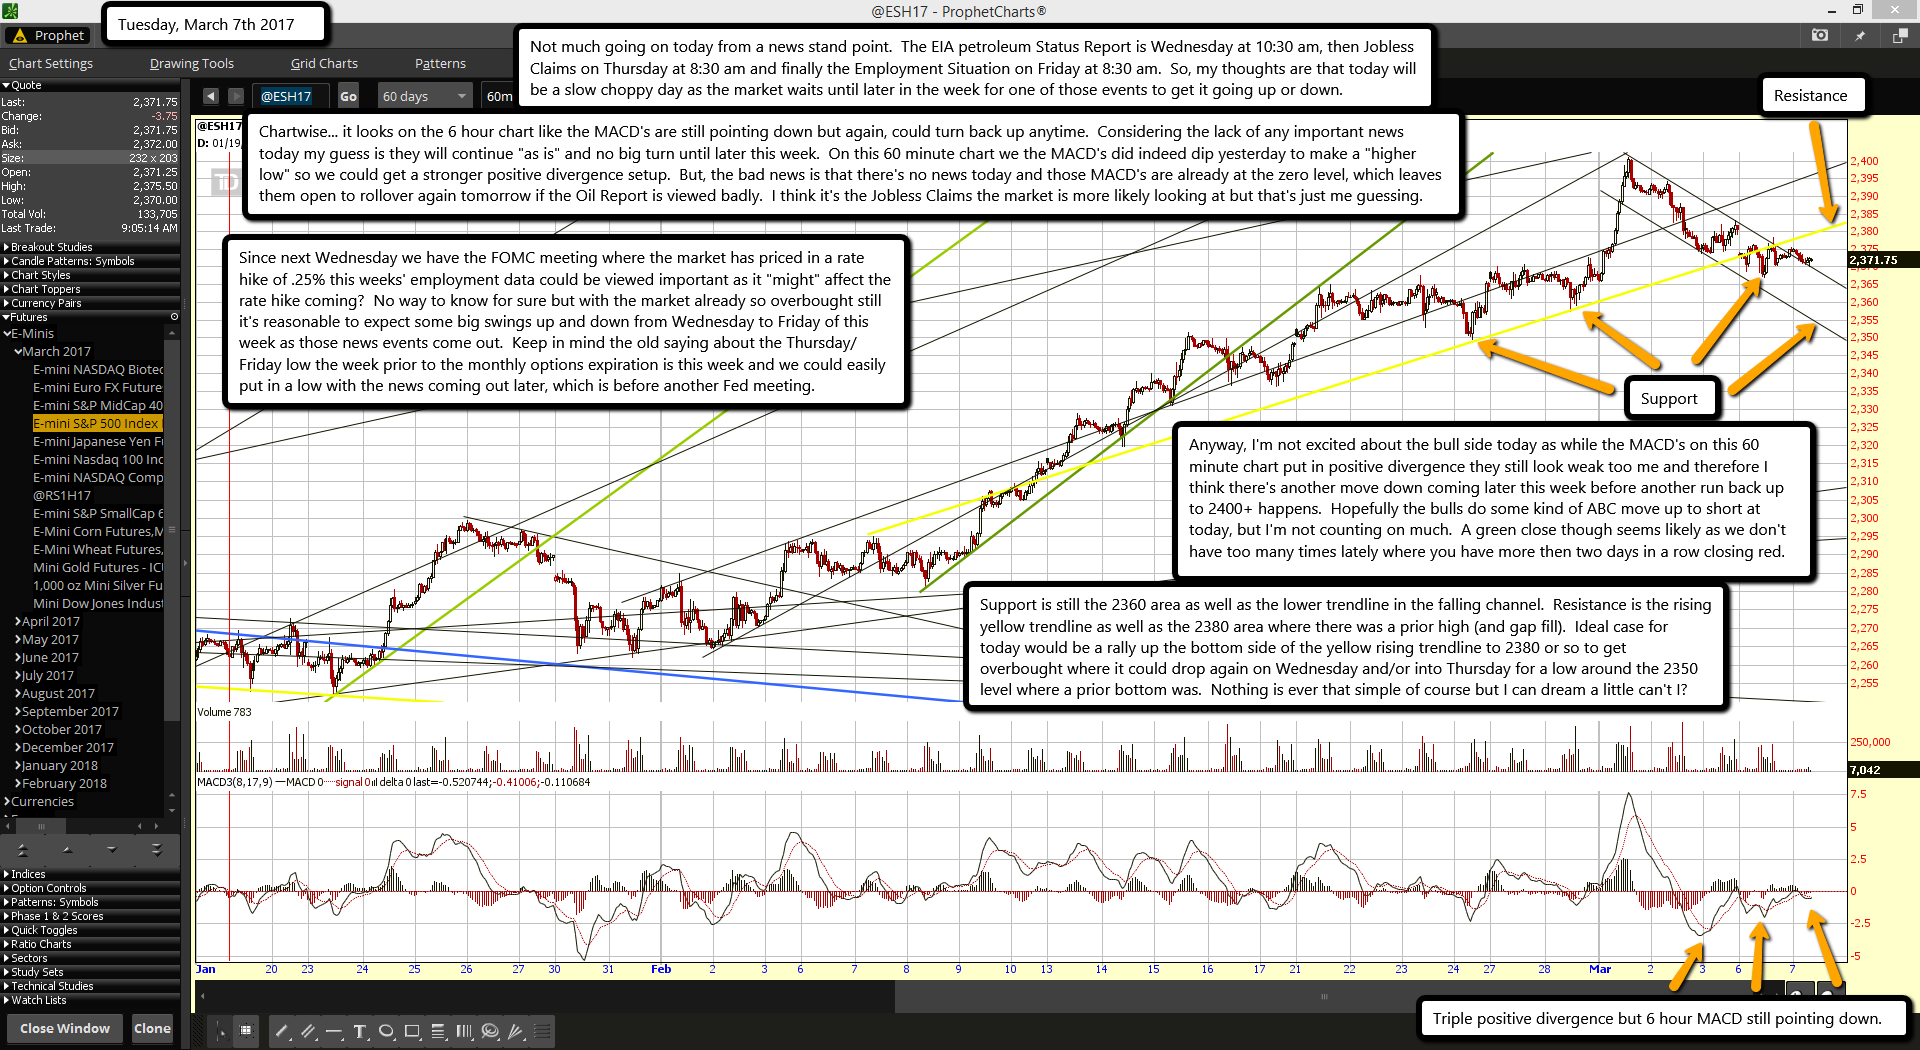
Not much going on today from a news stand point. The EIA petroleum Status Report is Wednesday at 10:30 am, then Jobless Claims on Thursday at 8:30 am and finally the Employment Situation on Friday at 8:30 am. So, my thoughts are that today will be a slow choppy day as the market waits until later in the week for one of those events to get it going up or down.
Chartwise... it looks on the 6 hour chart like the MACD's are still pointing down but again, could turn back up anytime. Considering the lack of any important news today my guess is they will continue "as is" and no big turn until later this week. On this 60 minute chart we the MACD's did indeed dip yesterday to make a "higher low" so we could get a stronger positive divergence setup. But, the bad news is that there's no news today and those MACD's are already at the zero level, which leaves them open to rollover again tomorrow if the Oil Report is viewed badly. I think it's the Jobless Claims the market is more likely looking at but that's just me guessing.
Since next Wednesday we have the FOMC meeting where the market has priced in a rate hike of .25% this weeks' employment data could be viewed important as it "might" affect the rate hike coming? No way to know for sure but with the market already so overbought still it's reasonable to expect some big swings up and down from Wednesday to Friday of this week as those news events come out. Keep in mind the old saying about the Thursday/Friday low the week prior to the monthly options expiration is this week and we could easily put in a low with the news coming out later, which is before another Fed meeting.
Anyway, I'm not excited about the bull side today as while the MACD's on this 60 minute chart put in positive divergence they still look weak too me and therefore I think there's another move down coming later this week before another run back up to 2400+ happens. Hopefully the bulls do some kind of ABC move up to short at today, but I'm not counting on much. A green close though seems likely as we don't have too many times lately where you have more then two days in a row closing red.
Support is still the 2360 area as well as the lower trendline in the falling channel. Resistance is the rising yellow trendline as well as the 2380 area where there was a prior high (and gap fill). Ideal case for today would be a rally up the bottom side of the yellow rising trendline to 2380 or so to get overbought where it could drop again on Wednesday and/or into Thursday for a low around the 2350 level where a prior bottom was. Nothing is ever that simple of course but I can dream a little can't I?
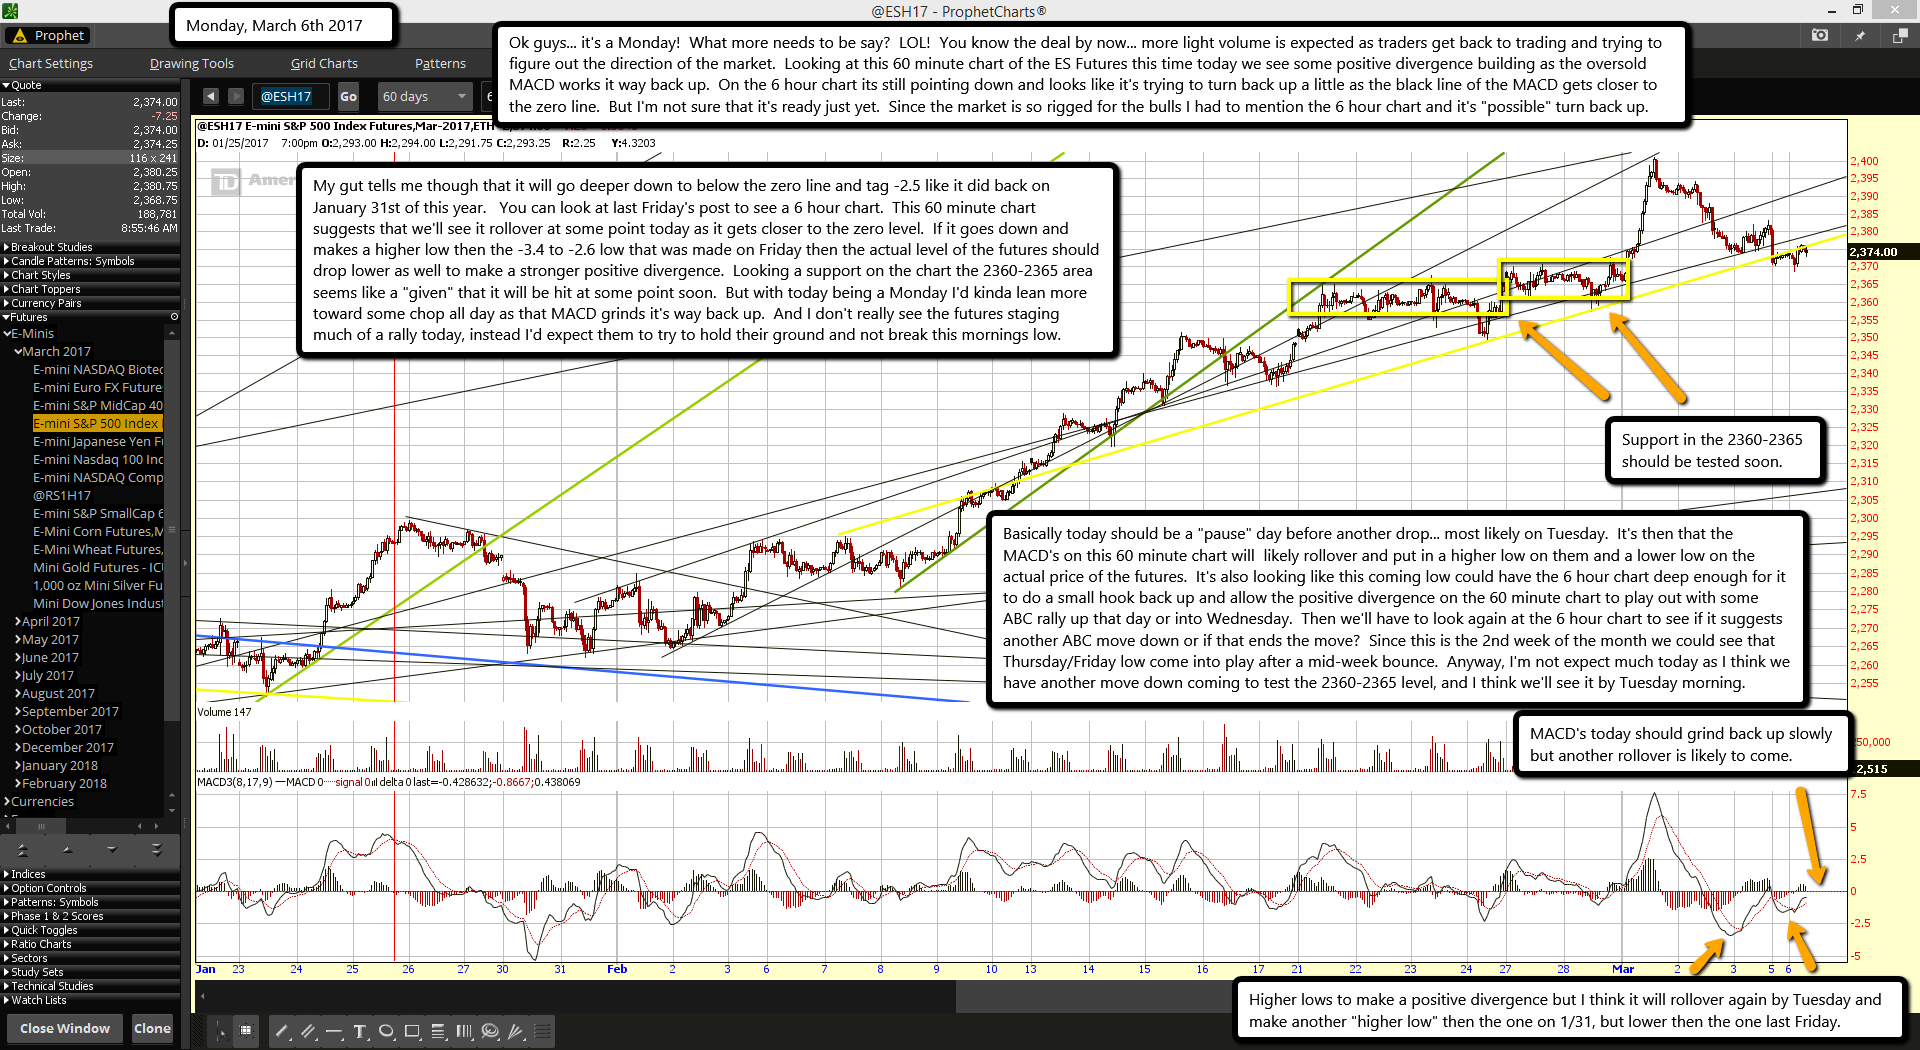
Ok guys... it's a Monday! What more needs to be say? LOL! You know the deal by now... more light volume is expected as traders get back to trading and trying to figure out the direction of the market. Looking at this 60 minute chart of the ES Futures this time today we see some positive divergence building as the oversold MACD works it way back up. On the 6 hour chart its still pointing down and looks like it's trying to turn back up a little as the black line of the MACD gets closer to the zero line. But I'm not sure that it's ready just yet. Since the market is so rigged for the bulls I had to mention the 6 hour chart and it's "possible" turn back up.
My gut tells me though that it will go deeper down to below the zero line and tag -2.5 like it did back on January 31st of this year. You can look at last Friday's post to see a 6 hour chart. This 60 minute chart suggests that we'll see it rollover at some point today as it gets closer to the zero level. If it goes down and makes a higher low then the -3.4 to -2.6 low that was made on Friday then the actual level of the futures should drop lower as well to make a stronger positive divergence. Looking a support on the chart the 2360-2365 area seems like a "given" that it will be hit at some point soon. But with today being a Monday I'd kinda lean more toward some chop all day as that MACD grinds it's way back up. And I don't really see the futures staging much of a rally today, instead I'd expect them to try to hold their ground and not break this mornings low.
Basically today should be a "pause" day before another drop... most likely on Tuesday. It's then that the MACD's on this 60 minute chart will likely rollover and put in a higher low on them and a lower low on the actual price of the futures. It's also looking like this coming low could have the 6 hour chart deep enough for it to do a small hook back up and allow the positive divergence on the 60 minute chart to play out with some ABC rally up that day or into Wednesday. Then we'll have to look again at the 6 hour chart to see if it suggests another ABC move down or if that ends the move? Since this is the 2nd week of the month we could see that Thursday/Friday low come into play after a mid-week bounce. Anyway, I'm not expect much today as I think we have another move down coming to test the 2360-2365 level, and I think we'll see it by Tuesday morning.
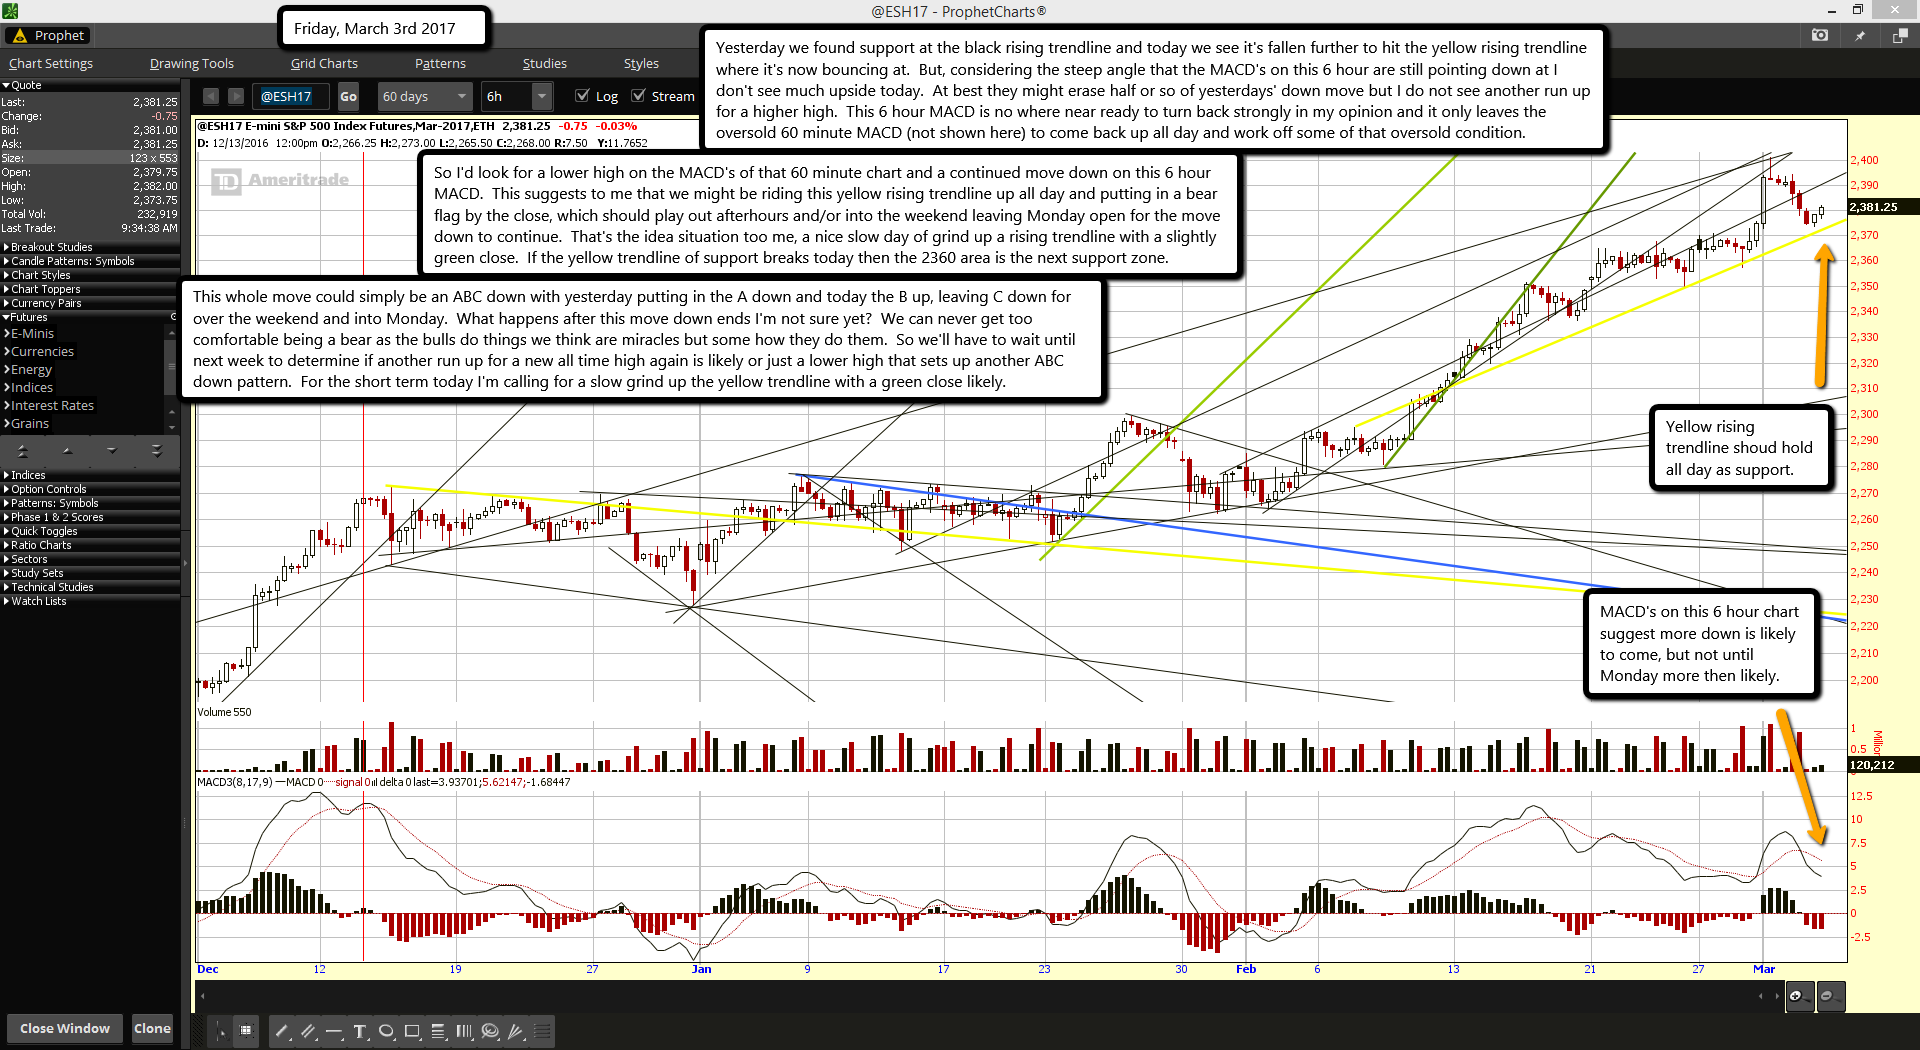
Yesterday we found support at the black rising trendline and today we see it's fallen further to hit the yellow rising trendline where it's now bouncing at. But, considering the steep angle that the MACD's on this 6 hour are still pointing down at I don't see much upside today. At best they might erase half or so of yesterdays' down move but I do not see another run up for a higher high. This 6 hour MACD is no where near ready to turn back strongly in my opinion and it only leaves the oversold 60 minute MACD (not shown here) to come back up all day and work off some of that oversold condition.
So I'd look for a lower high on the MACD's of that 60 minute chart and a continued move down on this 6 hour MACD. This suggests to me that we might be riding this yellow rising trendline up all day and putting in a bear flag by the close, which should play out afterhours and/or into the weekend leaving Monday open for the move down to continue. That's the idea situation too me, a nice slow day of grind up a rising trendline with a slightly green close. If the yellow trendline of support breaks today then the 2360 area is the next support zone.
This whole move could simply be an ABC down with yesterday putting in the A down and today the B up, leaving C down for over the weekend and into Monday. What happens after this move down ends I'm not sure yet? We can never get too comfortable being a bear as the bulls do things we think are miracles but some how they do them. So we'll have to wait until next week to determine if another run up for a new all time high again is likely or just a lower high that sets up another ABC down pattern. For the short term today I'm calling for a slow grind up the yellow trendline with a green close likely.
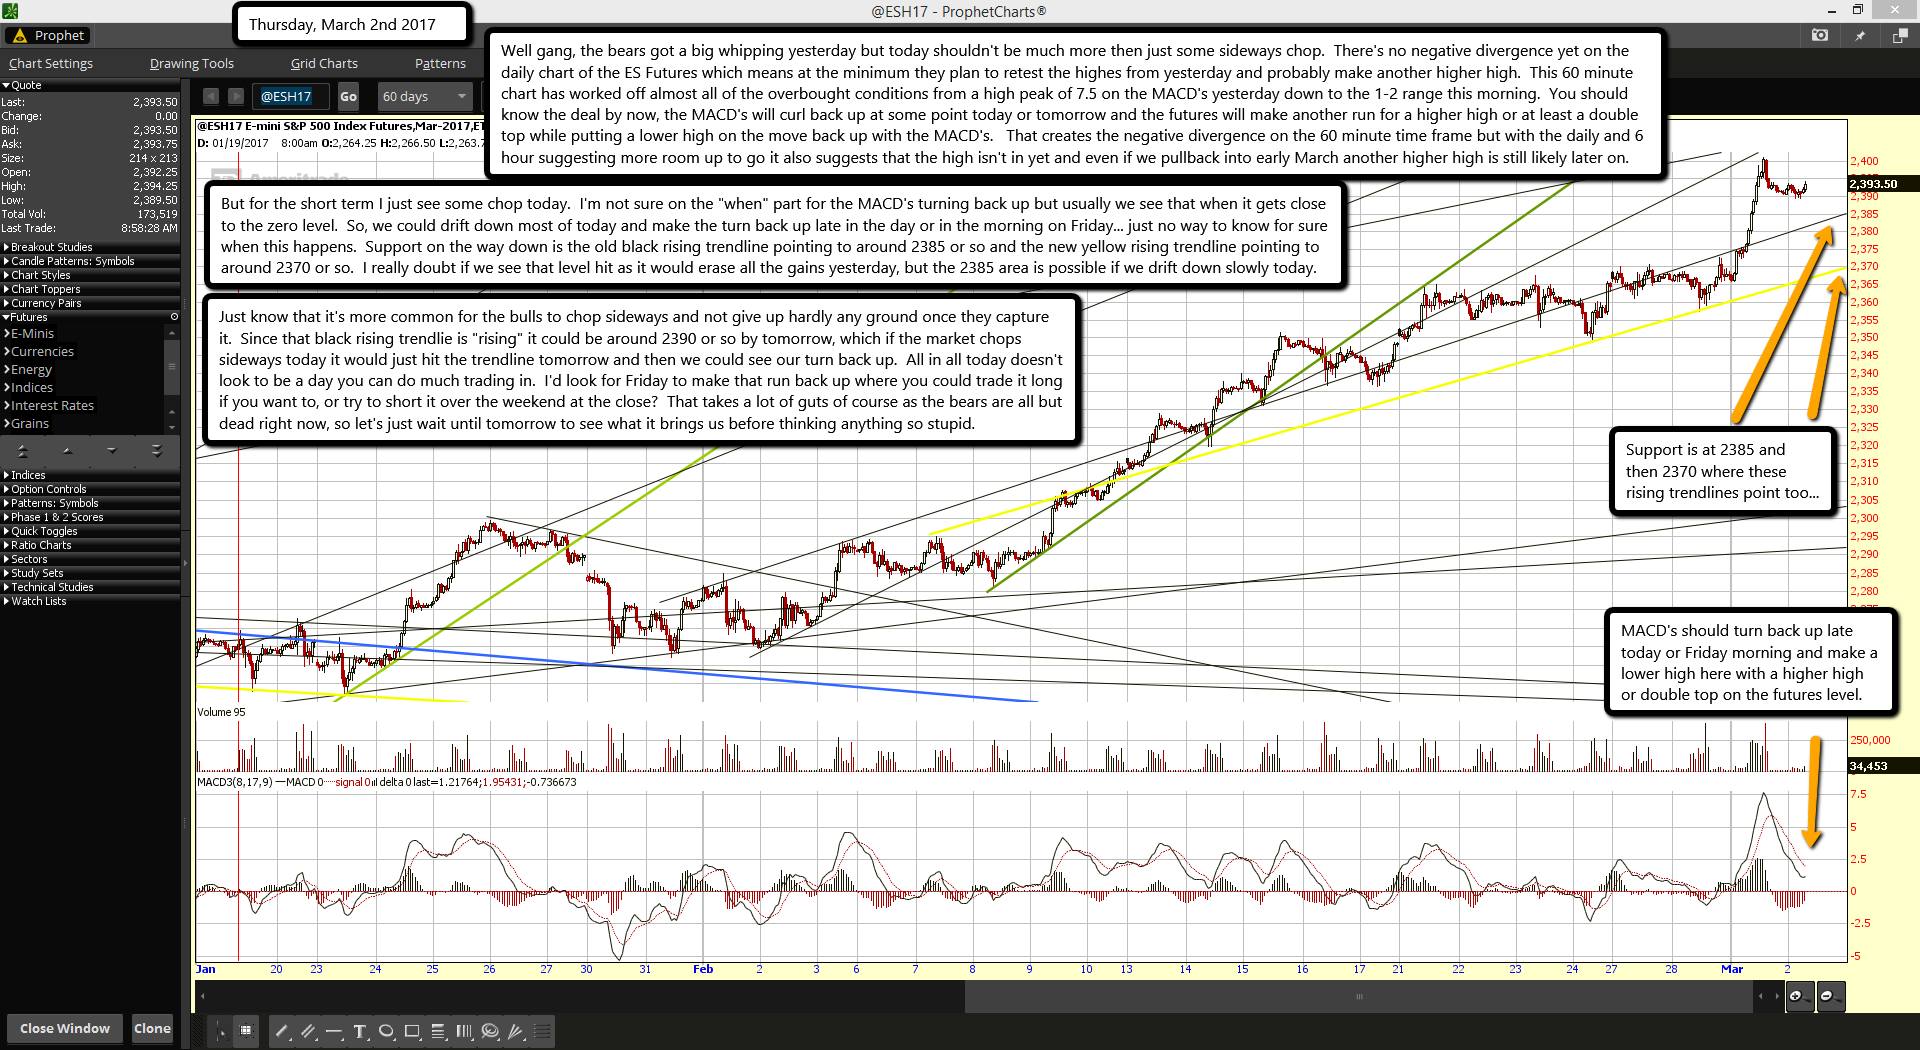
Well gang, the bears got a big whipping yesterday but today shouldn't be much more then just some sideways chop. There's no negative divergence yet on the daily chart of the ES Futures which means at the minimum they plan to retest the highes from yesterday and probably make another higher high. This 60 minute chart has worked off almost all of the overbought conditions from a high peak of 7.5 on the MACD's yesterday down to the 1-2 range this morning. You should know the deal by now, the MACD's will curl back up at some point today or tomorrow and the futures will make another run for a higher high or at least a double top while putting a lower high on the move back up with the MACD's. That creates the negative divergence on the 60 minute time frame but with the daily and 6 hour suggesting more room up to go it also suggests that the high isn't in yet and even if we pullback into early March another higher high is still likely later on.
But for the short term I just see some chop today. I'm not sure on the "when" part for the MACD's turning back up but usually we see that when it gets close to the zero level. So, we could drift down most of today and make the turn back up late in the day or in the morning on Friday... just no way to know for sure when this happens. Support on the way down is the old black rising trendline pointing to around 2385 or so and the new yellow rising trendline pointing to around 2370 or so. I really doubt if we see that level hit as it would erase all the gains yesterday, but the 2385 area is possible if we drift down slowly today.
Just know that it's more common for the bulls to chop sideways and not give up hardly any ground once they capture it. Since that black rising trendlie is "rising" it could be around 2390 or so by tomorrow, which if the market chops sideways today it would just hit the trendline tomorrow and then we could see our turn back up. All in all today doesn't look to be a day you can do much trading in. I'd look for Friday to make that run back up where you could trade it long if you want to, or try to short it over the weekend at the close? That takes a lot of guts of course as the bears are all but dead right now, so let's just wait until tomorrow to see what it brings us before thinking anything so stupid.
The US Dow Jones stock index has closed at a record high for the 12th day running as Donald Trump promised a "big" infrastructure announcement.
It is the longest winning streak for the share index since January 1987.
Analysts said Wall Street was buoyed by hopes the US president would set out more on his spending and tax plans in a speech to Congress on Tuesday.
The Dow Jones Industrial Average, one of the US's three main stock indexes, finished 15 points higher at 20,837.
Ahead of the speech, Mr Trump said: "We're going to make it easier for states to invest in infrastructure and I'm going to have a big statement tomorrow night on infrastructure."
The president also said he would seek to boost defence spending by $54bn (£43bn), a 10% rise, in his proposed budget plans for 2018.
As well as significantly raising infrastructure spending, Mr Trump has previously pledged to cut taxes for US businesses.
"For the moment, whenever he speaks of those upcoming plans, we get a leg up in the market," Peter Jankovskis, director of research at Oakbrook Investments, told BBC World Service.
"Whenever he's not talking, there's enough momentum to keep it moving forward."
The S&P 500 index also edged two points higher to 2,370, while the tech-focused Nasdaq Composite index rose 17 points to 5,862.
The biggest winners were shares in energy, financial and healthcare firms - areas that stand to gain if Mr Trump's policies spur faster economic growth, Mr Jankovskis said.
The Dow closed at record highs for 13 sessions in a row in January 1987, nine months before the Black Monday market crash.
Certainly interesting about 1987 but I don't expect a crash this year. To me I think the really bad year is going to be 2019, but that doesn't rule out some surprise moves down this year.
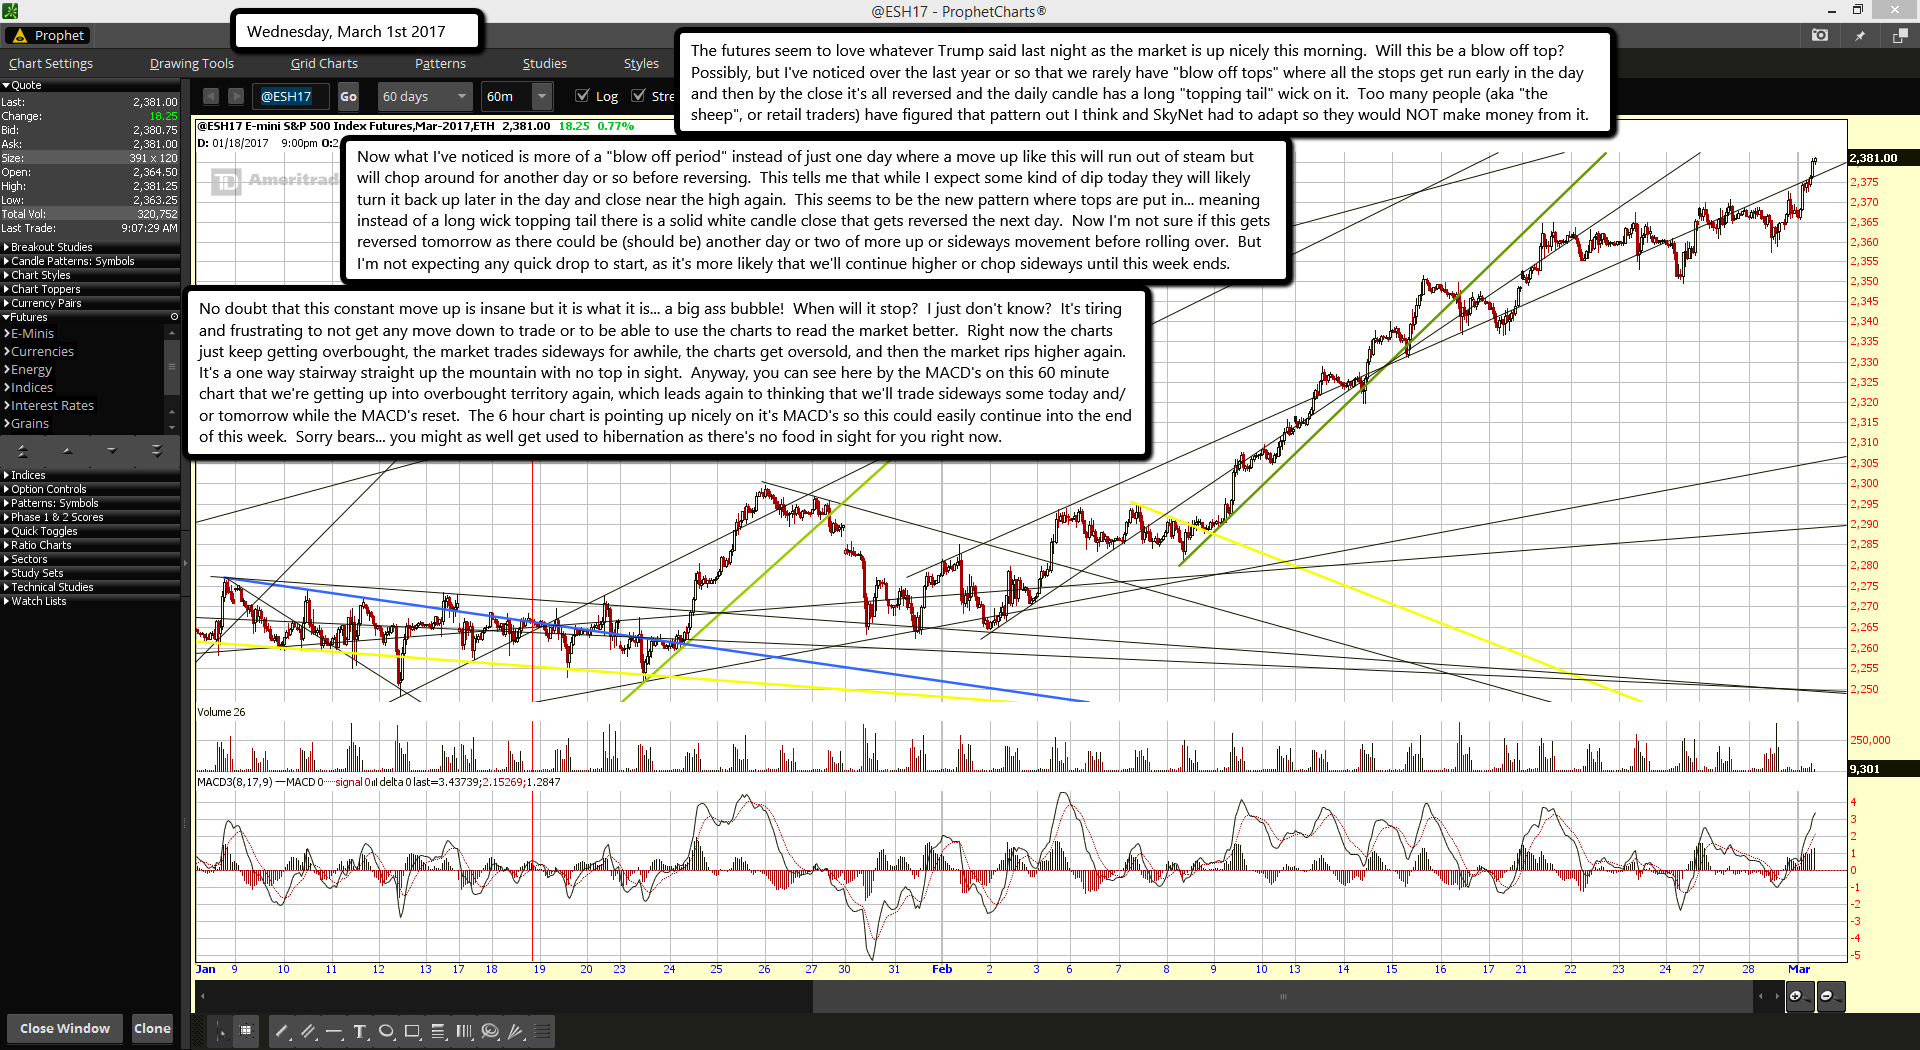
The futures seem to love whatever Trump said last night as the market is up nicely this morning. Will this be a blow off top? Possibly, but I've noticed over the last year or so that we rarely have "blow off tops" where all the stops get run early in the day and then by the close it's all reversed and the daily candle has a long "topping tail" wick on it. Too many people (aka "the sheep", or retail traders) have figured that pattern out I think and SkyNet had to adapt so they would NOT make money from it.
Now what I've noticed is more of a "blow off period" instead of just one day where a move up like this will run out of steam but will chop around for another day or so before reversing. This tells me that while I expect some kind of dip today they will likely turn it back up later in the day and close near the high again. This seems to be the new pattern where tops are put in... meaning instead of a long wick topping tail there is a solid white candle close that gets reversed the next day. Now I'm not sure if this gets reversed tomorrow as there could be (should be) another day or two of more up or sideways movement before rolling over. But I'm not expecting any quick drop to start, as it's more likely that we'll continue higher or chop sideways until this week ends.
No doubt that this constant move up is insane but it is what it is... a big ass bubble! When will it stop? I just don't know? It's tiring and frustrating to not get any move down to trade or to be able to use the charts to read the market better. Right now the charts just keep getting overbought, the market trades sideways for awhile, the charts get oversold, and then the market rips higher again. It's a one way stairway straight up the mountain with no top in sight. Anyway, you can see here by the MACD's on this 60 minute chart that we're getting up into overbought territory again, which leads again to thinking that we'll trade sideways some today and/or tomorrow while the MACD's reset. The 6 hour chart is pointing up nicely on it's MACD's so this could easily continue into the end of this week. Sorry bears... you might as well get used to hibernation as there's no food in sight for you right now.
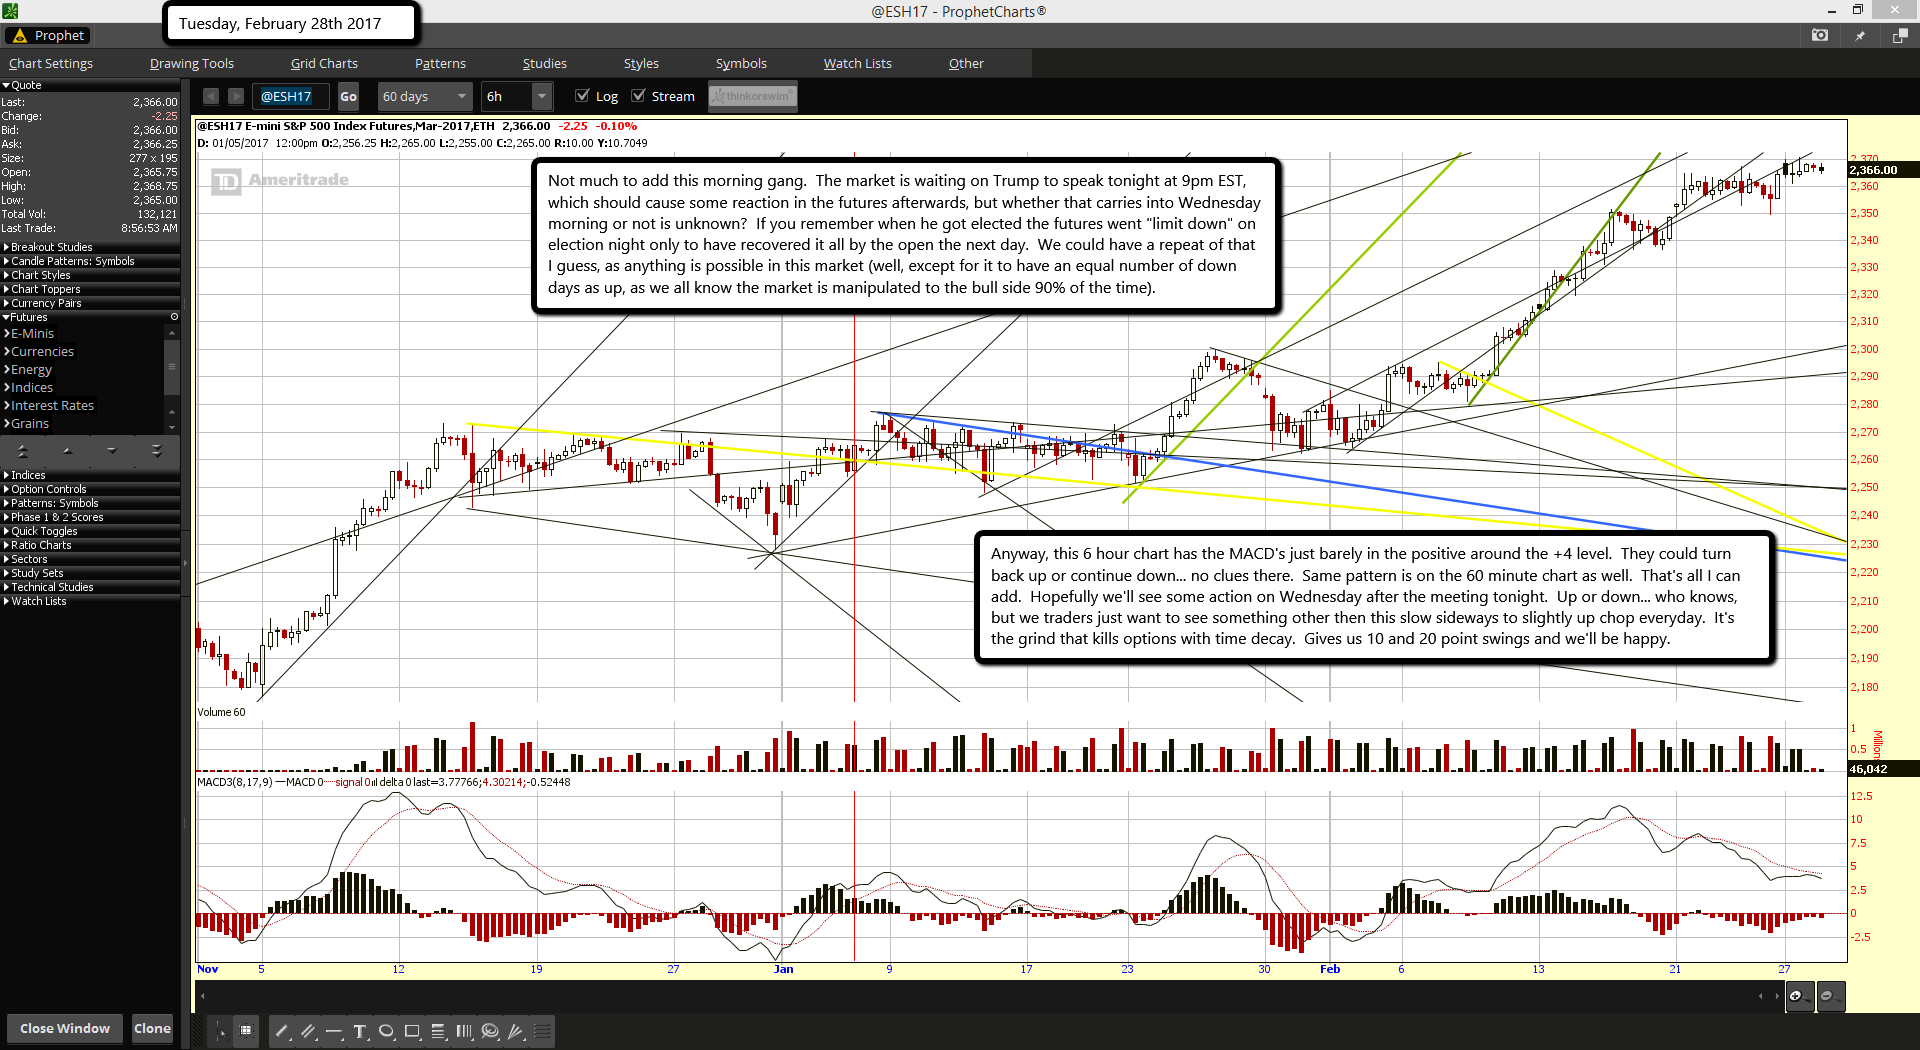
Not much to add this morning gang. The market is waiting on Trump to speak tonight at 9pm EST, which should cause some reaction in the futures afterwards, but whether that carries into Wednesday morning or not is unknown? If you remember when he got elected the futures went "limit down" on election night only to have recovered it all by the open the next day. We could have a repeat of that I guess, as anything is possible in this market (well, except for it to have an equal number of down days as up, as we all know the market is manipulated to the bull side 90% of the time).
Anyway, this 6 hour chart has the MACD's just barely in the positive around the +4 level. They could turn back up or continue down... no clues there. Same pattern is on the 60 minute chart as well. That's all I can add. Hopefully we'll see some action on Wednesday after the meeting tonight. Up or down... who knows, but we traders just want to see something other then this slow sideways to slightly up chop everyday. It's the grind that kills options with time decay. Gives us 10 and 20 point swings and we'll be happy.
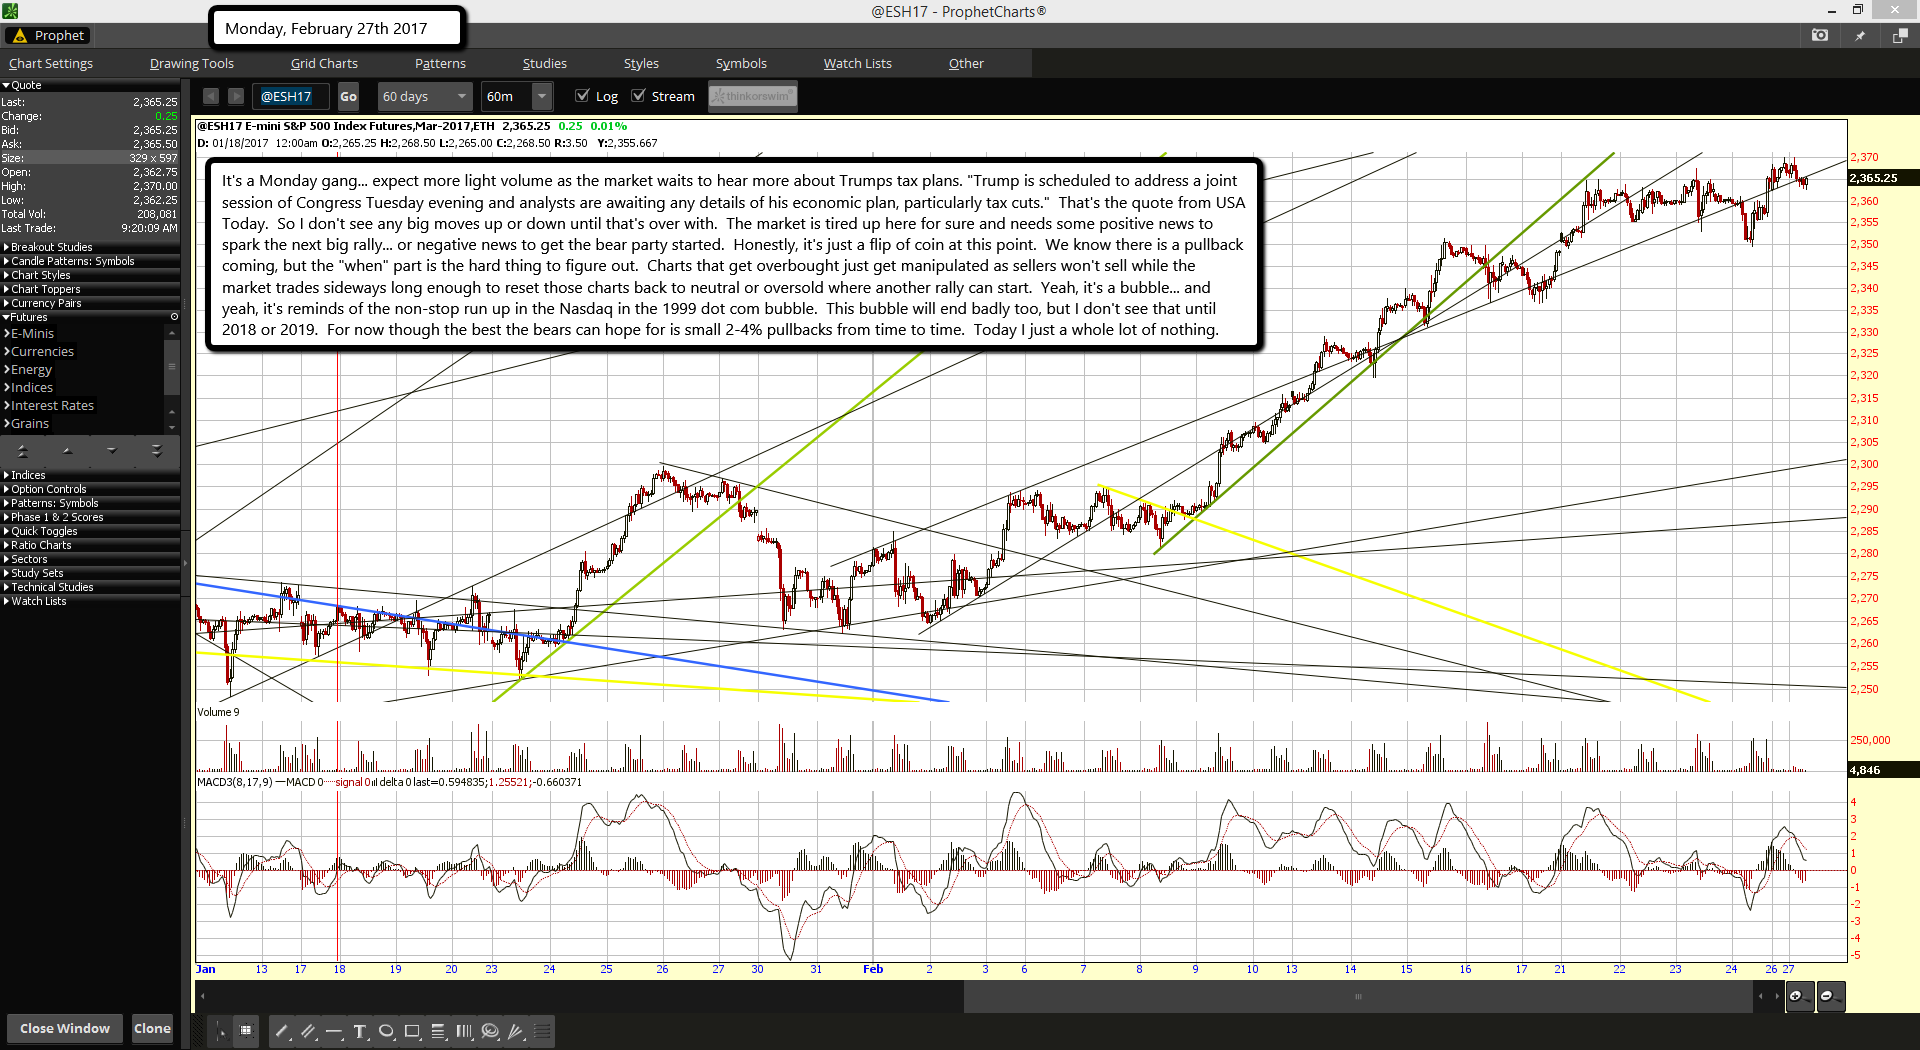
It's a Monday gang... expect more light volume as the market waits to hear more about Trumps tax plans. "Trump is scheduled to address a joint session of Congress Tuesday evening and analysts are awaiting any details of his economic plan, particularly tax cuts." That's the quote from USA Today. So I don't see any big moves up or down until that's over with. The market is tired up here for sure and needs some positive news to spark the next big rally... or negative news to get the bear party started. Honestly, it's just a flip of coin at this point. We know there is a pullback coming, but the "when" part is the hard thing to figure out. Charts that get overbought just get manipulated as sellers won't sell while the market trades sideways long enough to reset those charts back to neutral or oversold where another rally can start. Yeah, it's a bubble... and yeah, it's reminds of the non-stop run up in the Nasdaq in the 1999 dot com bubble. This bubble will end badly too, but I don't see that until 2018 or 2019. For now though the best the bears can hope for is small 2-4% pullbacks from time to time. Today I just a whole lot of nothing.
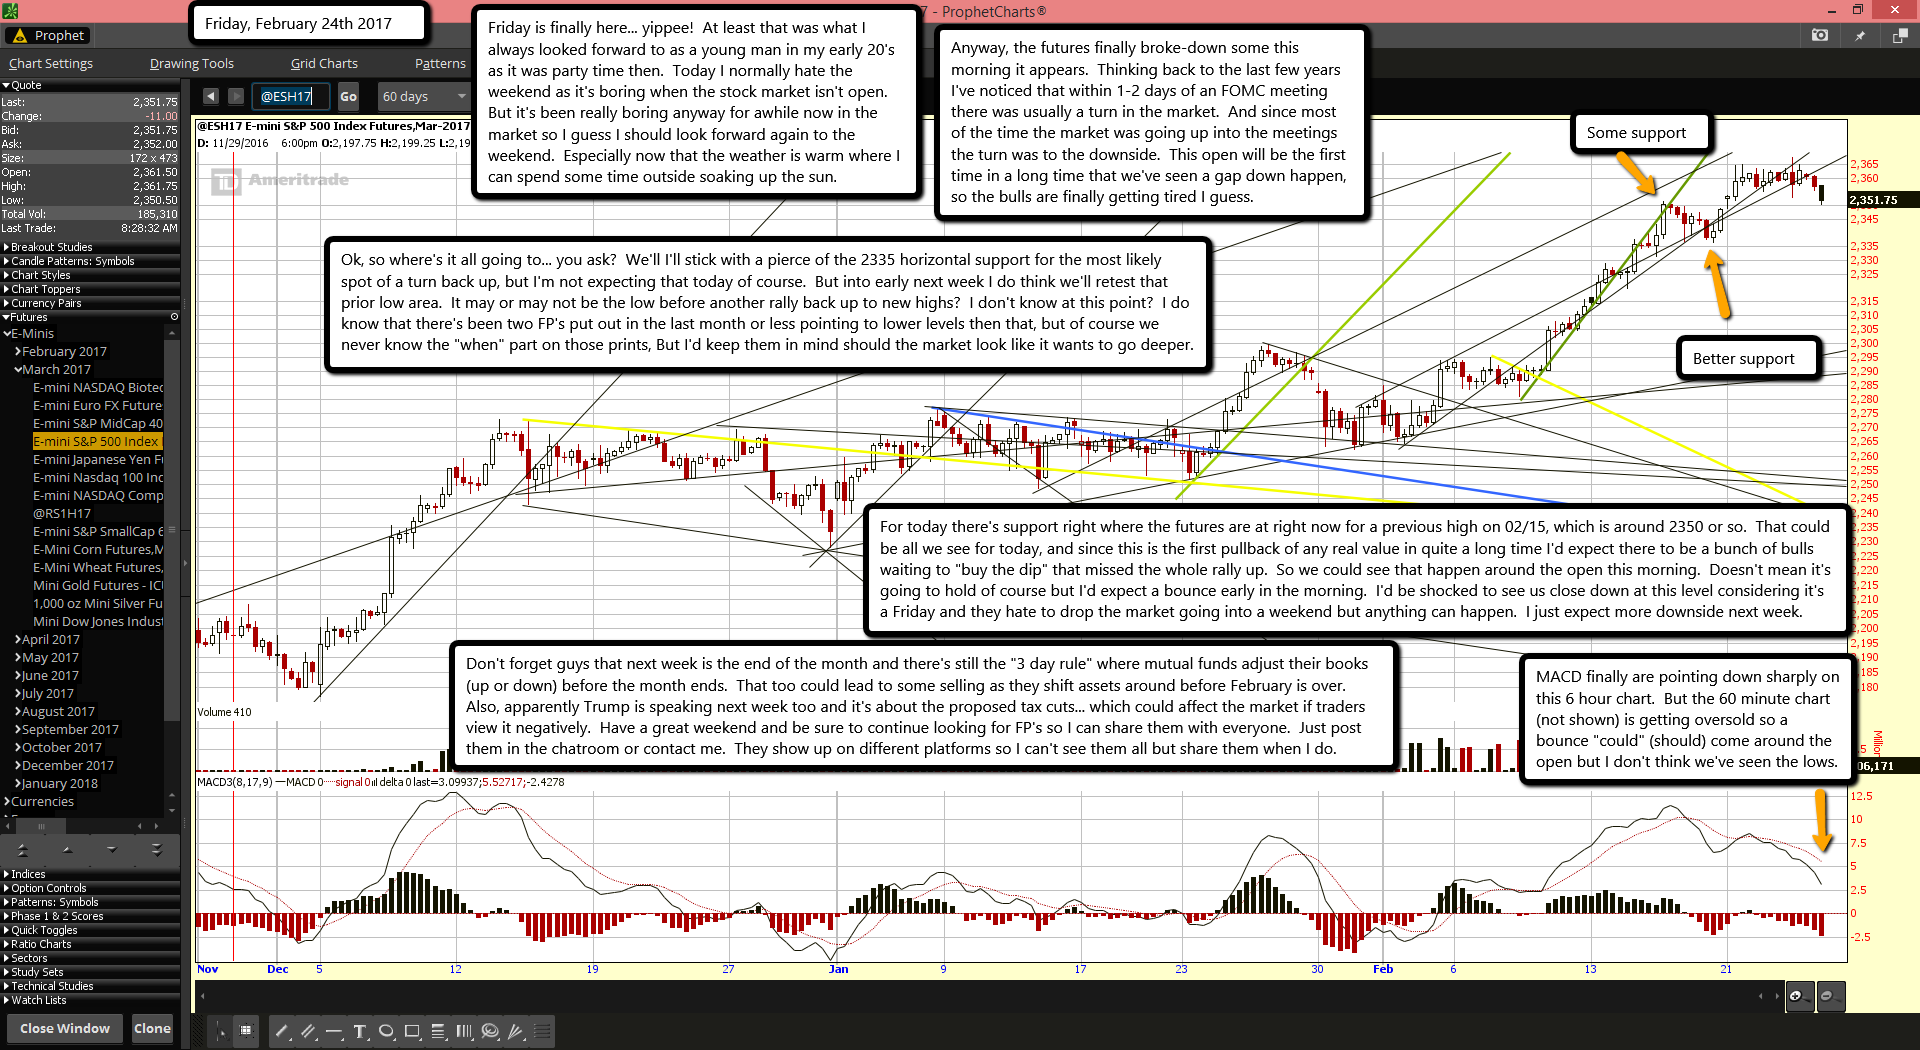
Friday is finally here... yippee! At least that was what I always looked forward to as a young man in my early 20's as it was party time then. Today I normally hate the weekend as it's boring when the stock market isn't open. But it's been really boring anyway for awhile now in the market so I guess I should look forward again to the weekend. Especially now that the weather is warm where I can spend some time outside soaking up the sun.
Anyway, the futures finally broke-down some this morning it appears. Thinking back to the last few years I've noticed that within 1-2 days of an FOMC meeting there was usually a turn in the market. And since most of the time the market was going up into the meetings the turn was to the downside. This open will be the first time in a long time that we've seen a gap down happen, so the bulls are finally getting tired I guess.
Ok, so where's it all going to... you ask? We'll I'll stick with a pierce of the 2335 horizontal support for the most likely spot of a turn back up, but I'm not expecting that today of course. But into early next week I do think we'll retest that prior low area. It may or may not be the low before another rally back up to new highs? I don't know at this point? I do know that there's been two FP's put out in the last month or less pointing to lower levels then that, but of course we never know the "when" part on those prints, But I'd keep them in mind should the market look like it wants to go deeper.
For today there's support right where the futures are at right now for a previous high on 02/15, which is around 2350 or so. That could be all we see for today, and since this is the first pullback of any real value in quite a long time I'd expect there to be a bunch of bulls waiting to "buy the dip" that missed the whole rally up. So we could see that happen around the open this morning. Doesn't mean it's going to hold of course but I'd expect a bounce early in the morning. I'd be shocked to see us close down at this level considering it's a Friday and they hate to drop the market going into a weekend but anything can happen. I just expect more downside next week.
Don't forget guys that next week is the end of the month and there's still the "3 day rule" where mutual funds adjust their books (up or down) before the month ends. That too could lead to some selling as they shift assets around before February is over. Also, apparently Trump is speaking next week too and it's about the proposed tax cuts... which could affect the market if traders view it negatively. Have a great weekend and be sure to continue looking for FP's so I can share them with everyone. Just post them in the chatroom or contact me. They show up on different platforms so I can't see them all but share them when I do.
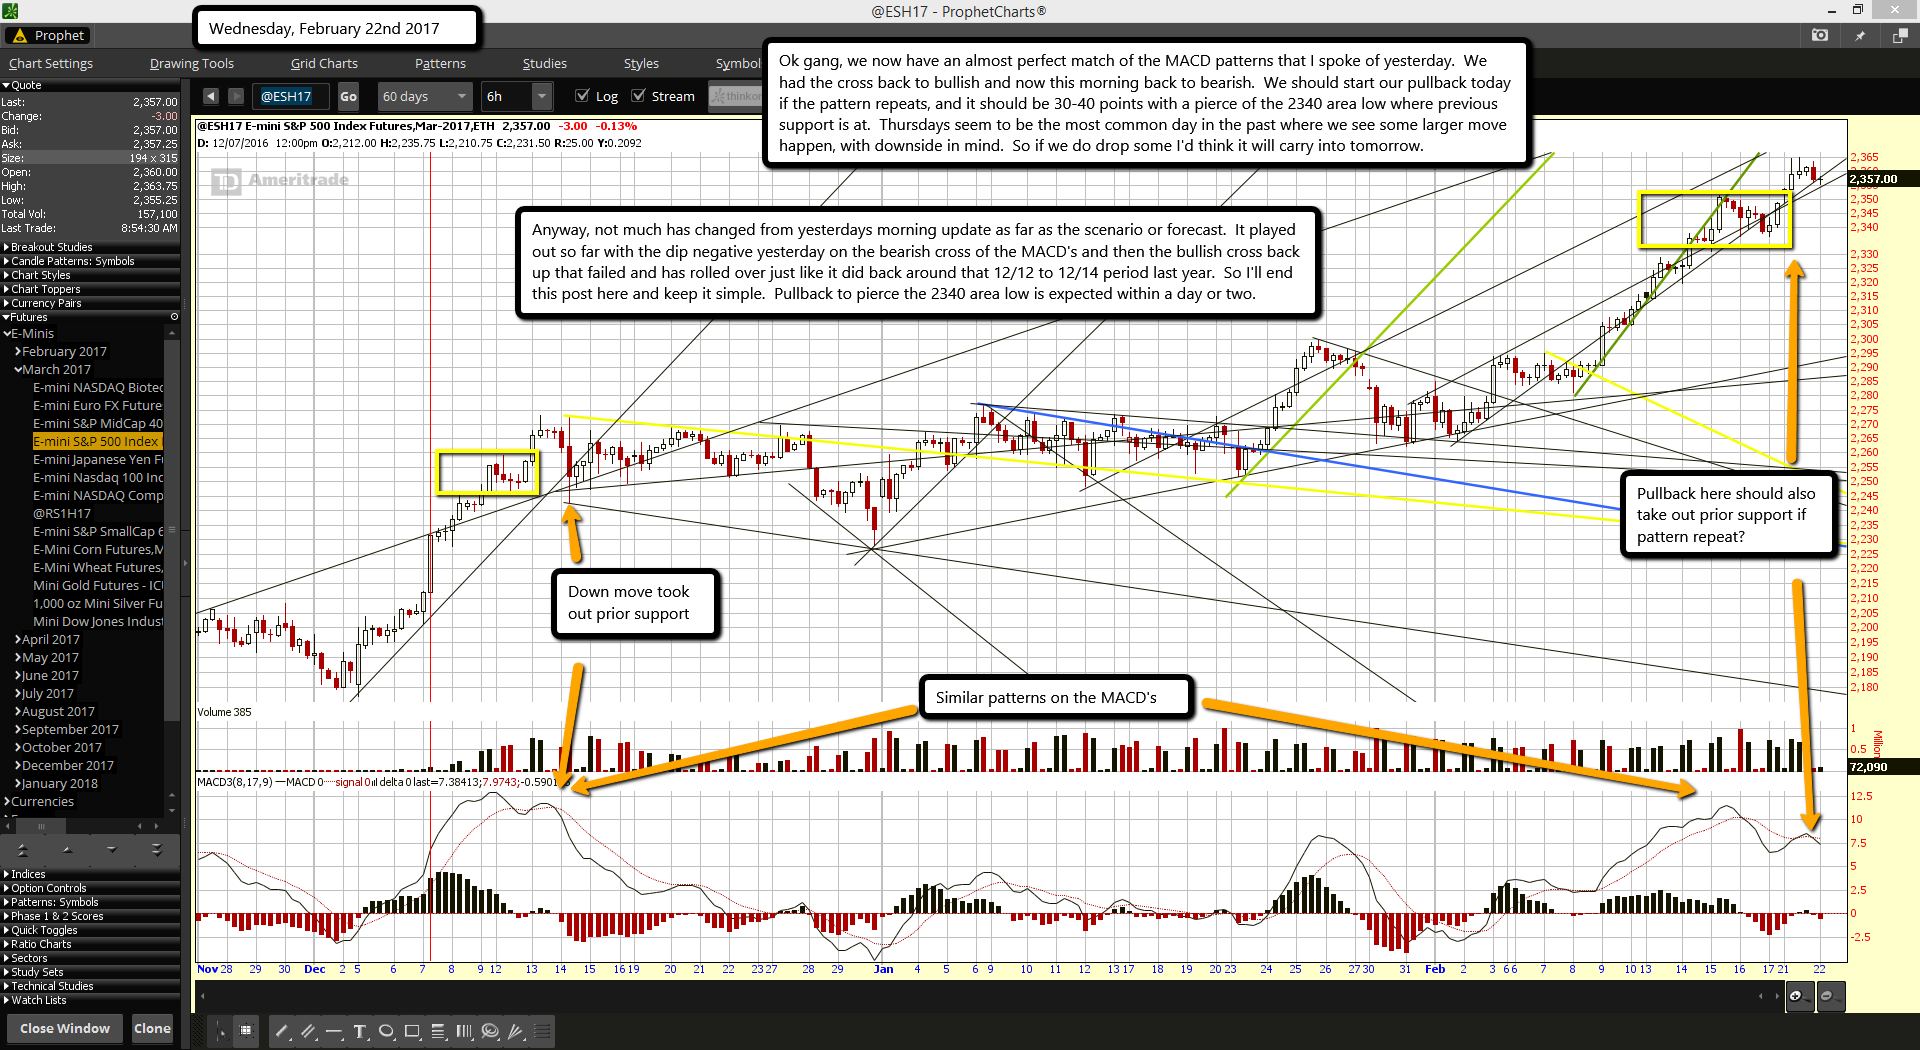
Ok gang, we now have an almost perfect match of the MACD patterns that I spoke of yesterday. We had the cross back to bullish and now this morning back to bearish. We should start our pullback today if the pattern repeats, and it should be 30-40 points with a pierce of the 2340 area low where previous support is at. Thursdays seem to be the most common day in the past where we see some larger move happen, with downside in mind. So if we do drop some I'd think it will carry into tomorrow.
Anyway, not much has changed from yesterdays morning update as far as the scenario or forecast. It played out so far with the dip negative yesterday on the bearish cross of the MACD's and then the bullish cross back up that failed and has rolled over just like it did back around that 12/12 to 12/14 period last year. So I'll end this post here and keep it simple. Pullback to pierce the 2340 area low is expected within a day or two.
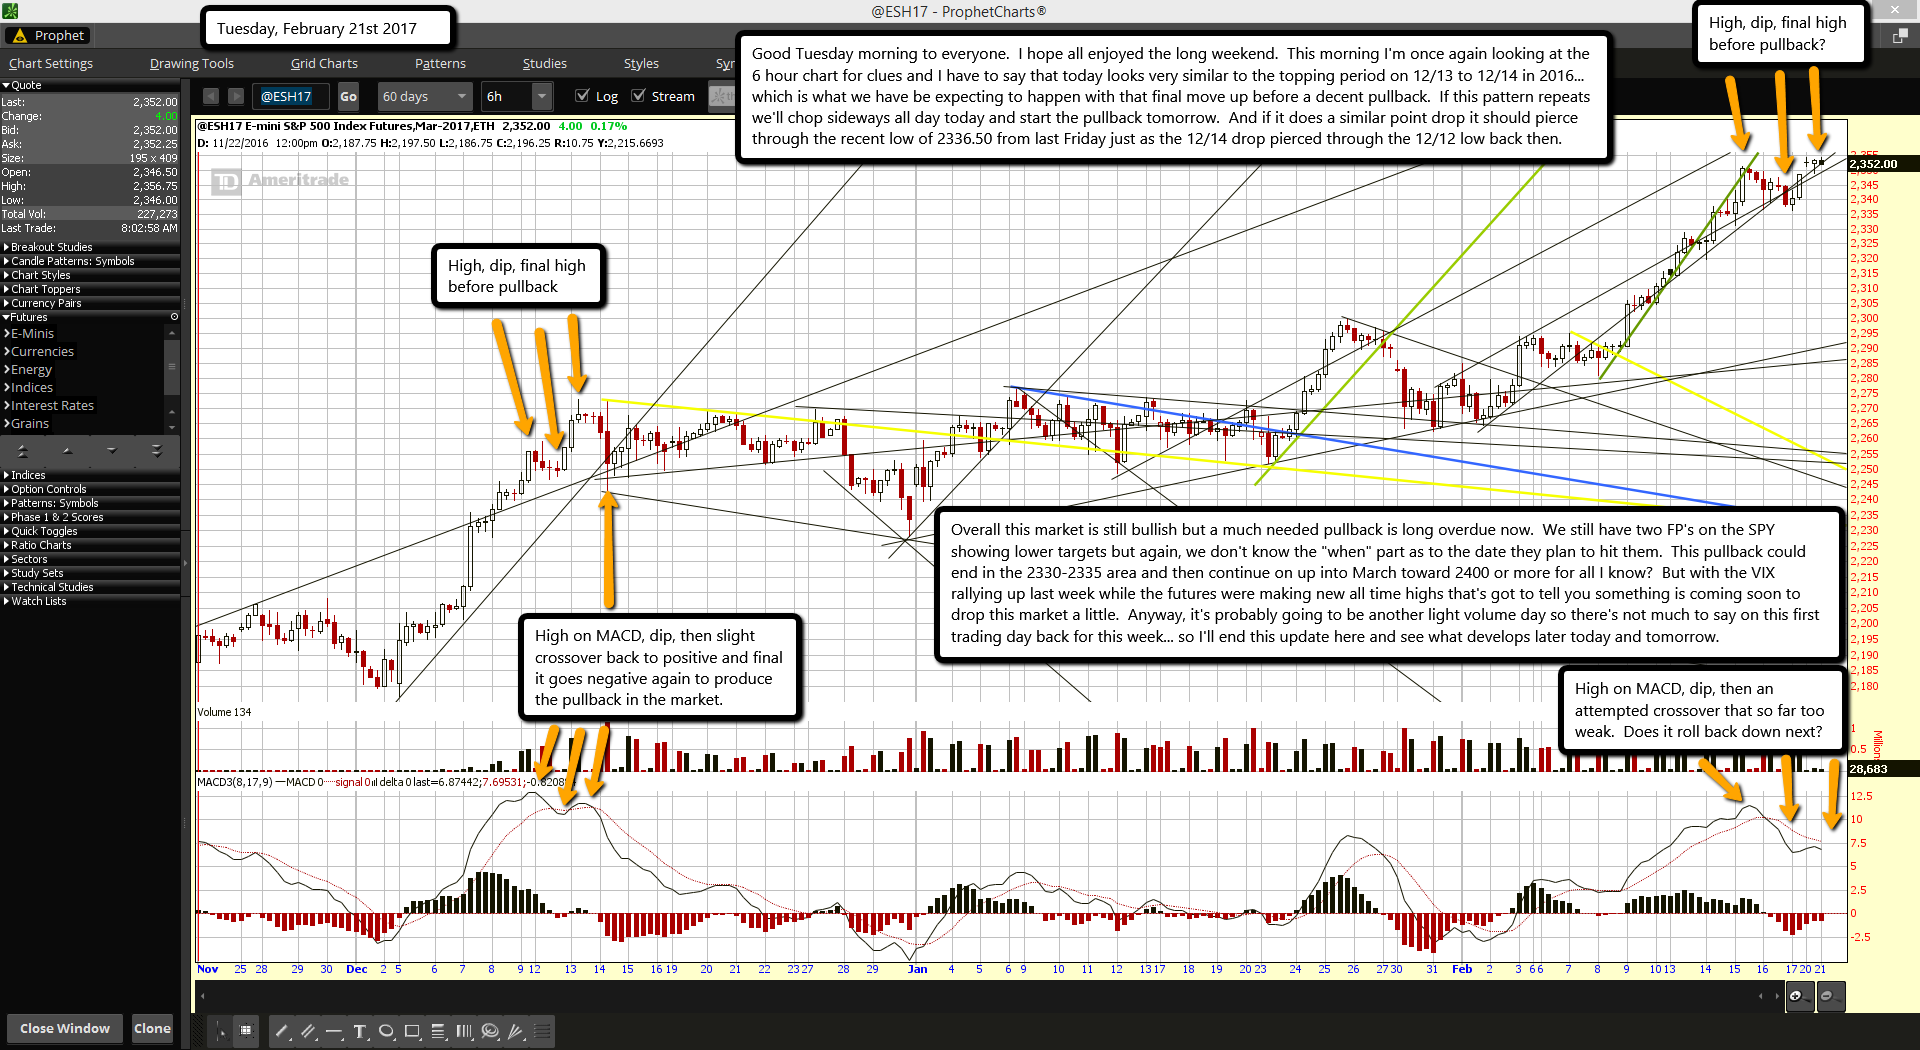
Good Tuesday morning to everyone. I hope all enjoyed the long weekend. This morning I'm once again looking at the 6 hour chart for clues and I have to say that today looks very similar to the topping period on 12/13 to 12/14 in 2016... which is what we have be expecting to happen with that final move up before a decent pullback. If this pattern repeats we'll chop sideways all day today and start the pullback tomorrow. And if it does a similar point drop it should pierce through the recent low of 2336.50 from last Friday just as the 12/14 drop pierced through the 12/12 low back then.
Overall this market is still bullish but a much needed pullback is long overdue now. We still have two FP's on the SPY showing lower targets but again, we don't know the "when" part as to the date they plan to hit them. This pullback could end in the 2330-2335 area and then continue on up into March toward 2400 or more for all I know? But with the VIX rallying up last week while the futures were making new all time highs that's got to tell you something is coming soon to drop this market a little. Anyway, it's probably going to be another light volume day so there's not much to say on this first trading day back for this week... so I'll end this update here and see what develops later today and tomorrow.
Medical treatments today often involve the use of medications mostly made from various chemicals or chemical extractions from plants. It would be fair to say that modern pharmaceuticals don’t necessarily represent a natural treatment and they are very targeted in how they work.
We have all seen the TV ads for pharmaceutical drugs that end with a long, quickly spoken list of side effects that can often be worse than the issue someone is treating to begin with. It is important to note that these aren’t really side effects but are instead the effects of the drug. We often don’t look at it this way, but when you do, you begin to realize the absurdity that goes along with many modern treatments for illness.
The technology this article will discuss takes a very different approach to treating the body. Royal Rife machines have been around for many years and it didn’t take long for them to be cast aside negatively by modern medicine when the results began pouring in.
It was in 1920 that Royal Rife first identified the human cancer virus using the world’s most powerful microscope. After identifying and isolating the virus, he decided to culture it on salted pork. At the time this was a very good method for culturing a virus. He then took the culture and injected it into 400 rats which as you might expect, created cancer in all 400 rats very quickly. The next step for Rife is where things took an interesting turn.
He later found a frequency of electromagnetic energy that would cause the cancer virus to diminish completely when entered into the energy field. The great discovery led Rife to create a device that could be tuned to output the frequency that would destruct the cancer. He was then able to treat the cancer within both rats and patients who were within close proximity of the device.
By 1934, the device began getting much more attention. The University of Southern California appointed a Special Medical Research Committee to further look at and study the device and it’s claims. 16 terminal cancer patients from Pasadena County Hospital were brought to Rife’s San Diego Laboratory for treatment. This committee was made up of doctors and pathologists who were assigned to examine the patients if they were still alive in 90 days.
“The 3 months of treatment went by and the Committee concluded that 14 of the 16 patients had been completely cured of cancer.”
The remaining 2 patients were exposed to the device for another 4 weeks after a few adjustments were made.
“Both were cured after the 4 weeks.”
The amazing results were a surprise to many, as no one knew what to expect out of frequency based medical treatment.
On November 20, 1931, Royal Rife was honored with a banquet billed as “The End To All Diseases” at the Pasadena estate of Dr. Milbank Johnson by 44 of the nations most respected medical authorities.
The device began receiving flack in 1939 and almost all distinguished doctors and scientists close to the device began denying that they had ever met Rife and saw results with his device. The complete reversal was due to pressure from drug companies who were being threatened by the device’s potential.
Interestingly, on the night of the press conference where Dr. Milbank Johnson was going to reveal the results of Rife’s study in 1934, he was fatally poisoned and his notes and papers were “lost.” Along with that, a failed attempt by drug companies to purchase the device from Rife resulted in his labs being destroyed by arson.
If that wasn’t enough, Dr. Nemes who had been duplicating Rife’s work, was mysteriously killed in a fire and his research material was all destroyed as well.
Finally, the Burnett Lab, which had been validating all of Rife’s work, was also destroyed in a fire. Sure seems like the pharmaceutical industry may have been involved in this.
But what about Rife?
By 1971 Royal Rife died by an “accidental” lethal dose of Valium and alcohol at Grossmont hospital.
Thank You to the tens of thousands…
Royal Rife Revolution…
Working long hours, non-profit, to help all earthlings release disease and be free
Admins, Webmasters, Spooky2 Guide Writers & Translators, Frequency Engineers, Tech Support, Hardware Tech, Engineers, Software Programmers, Bloggers, Teamviewer, Skype, Google Hangouts, online and telephone Support, Youtube & Video Creators, Teacher – Educators, Advocates, Shipping, and those getting the word out.
Thanks to those who are now inviting friends, family, co-workers to our Spooky2 group…
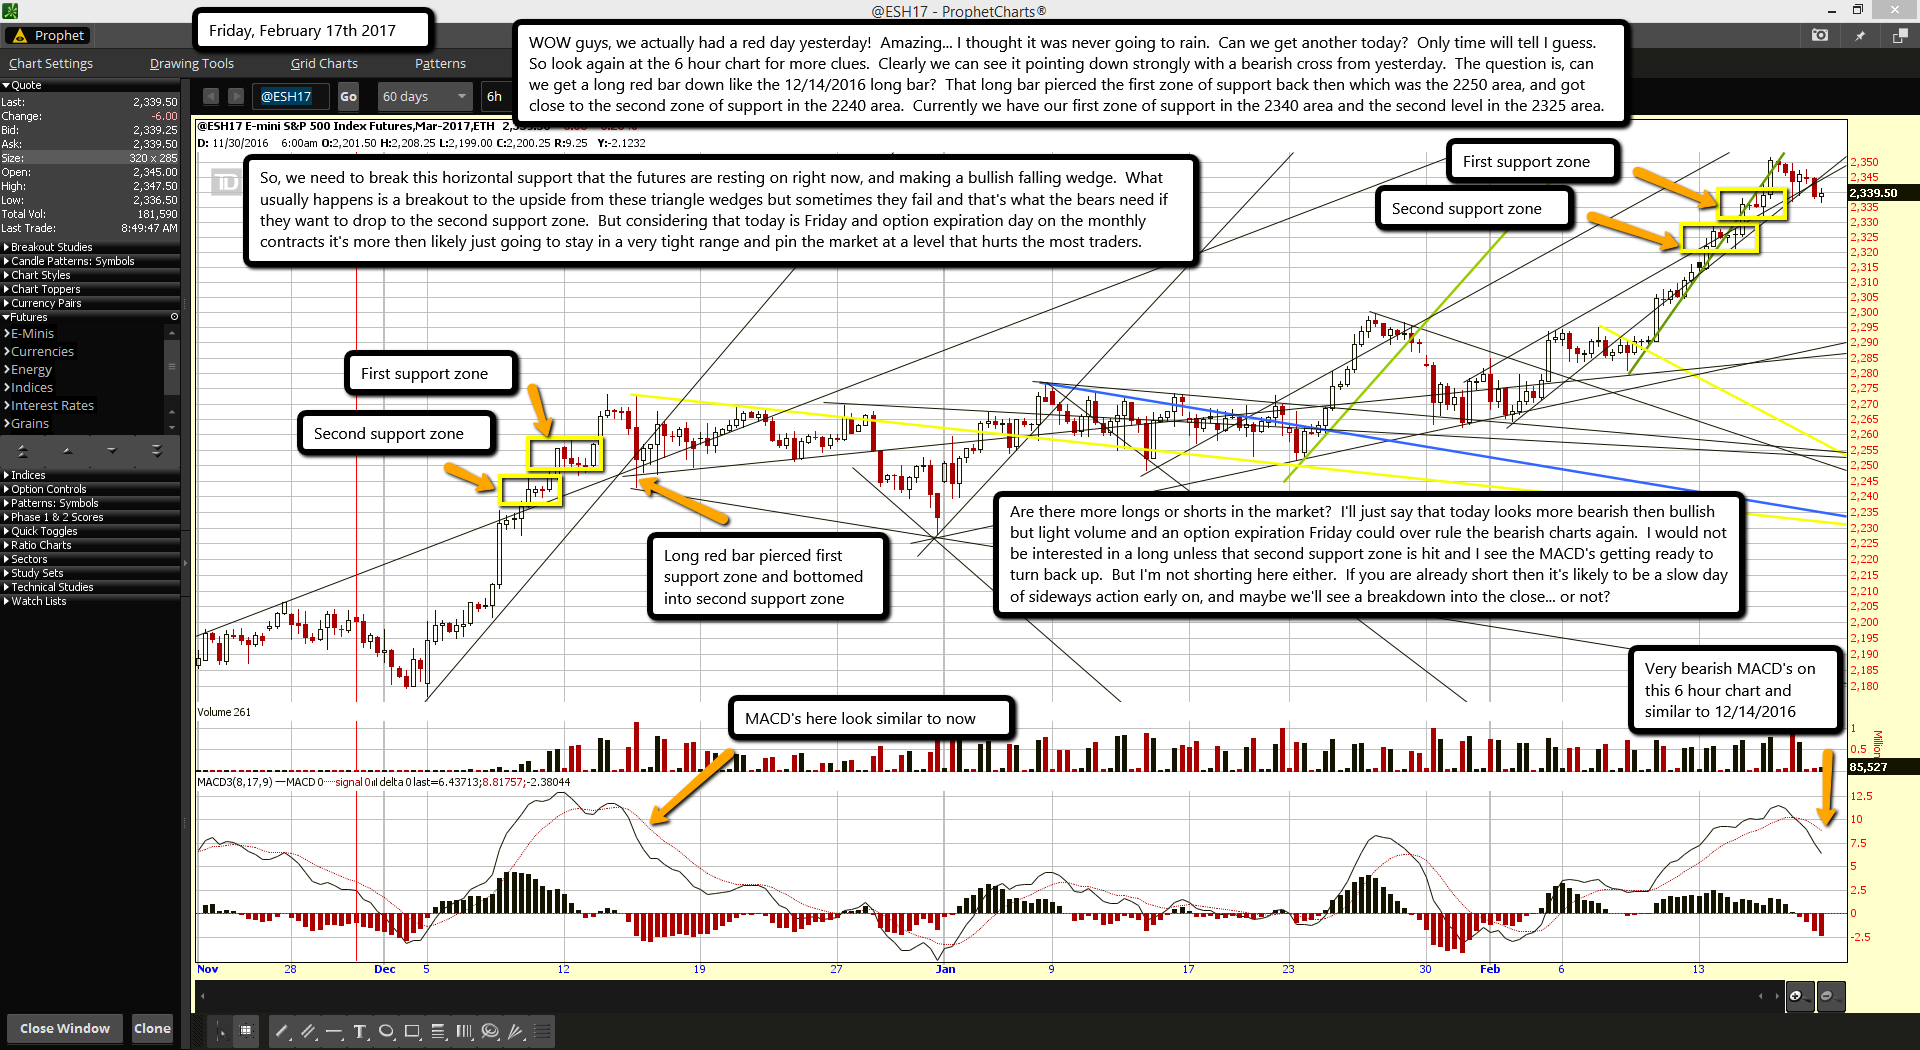
WOW guys, we actually had a red day yesterday! Amazing... I thought it was never going to rain. Can we get another today? Only time will tell I guess. So look again at the 6 hour chart for more clues. Clearly we can see it pointing down strongly with a bearish cross from yesterday. The question is, can we get a long red bar down like the 12/14/2016 long bar? That long bar pierced the first zone of support back then which was the 2250 area, and got close to the second zone of support in the 2240 area. Currently we have our first zone of support in the 2340 area and the second level in the 2325 area.
So, we need to break this horizontal support that the futures are resting on right now, and making a bullish falling wedge. What usually happens is a breakout to the upside from these triangle wedges but sometimes they fail and that's what the bears need if they want to drop to the second support zone. But considering that today is Friday and option expiration day on the monthly contracts it's more then likely just going to stay in a very tight range and pin the market at a level that hurts the most traders.
Are there more longs or shorts in the market? I'll just say that today looks more bearish then bullish but light volume and an option expiration Friday could over rule the bearish charts again. I would not be interested in a long unless that second support zone is hit and I see the MACD's getting ready to turn back up. But I'm not shorting here either. If you are already short then it's likely to be a slow day of sideways action early on, and maybe we'll see a breakdown into the close... or not?
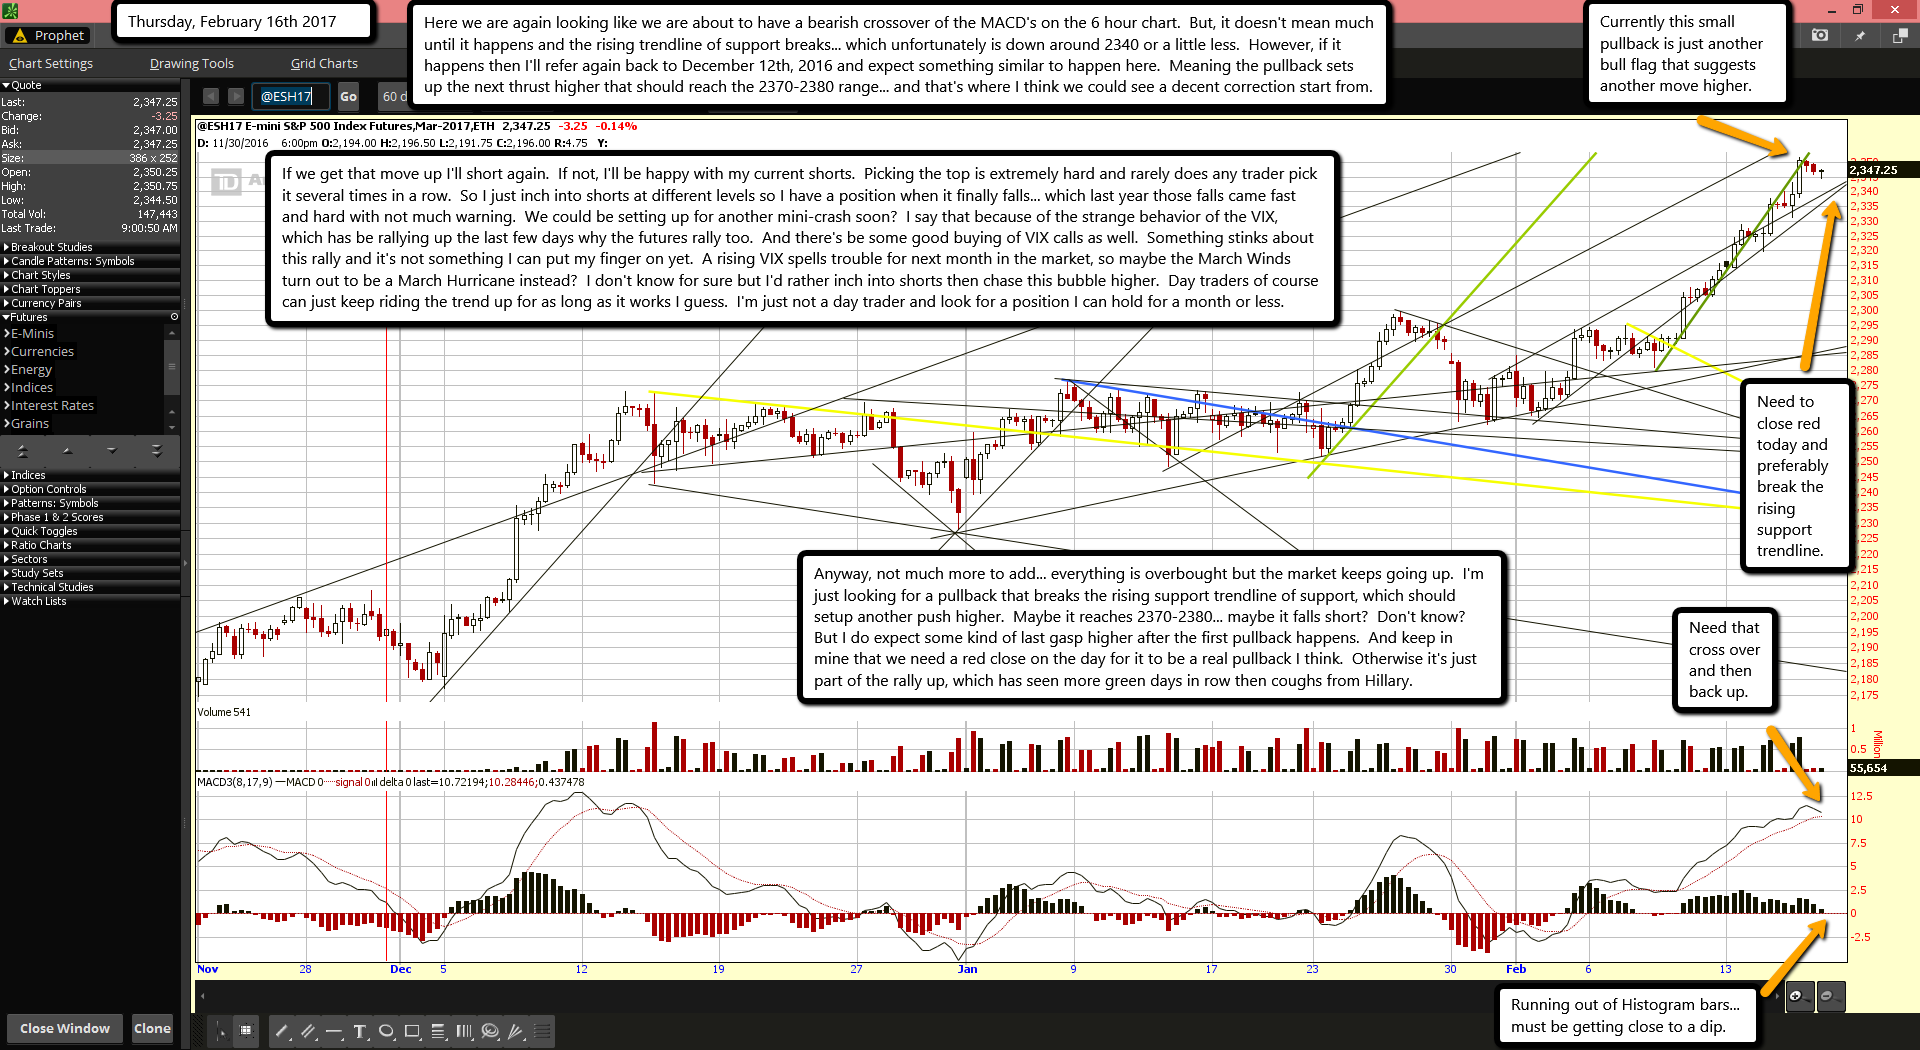
Here we are again looking like we are about to have a bearish crossover of the MACD's on the 6 hour chart. But, it doesn't mean much until it happens and the rising trendline of support breaks... which unfortunately is down around 2340 or a little less. However, if it happens then I'll refer again back to December 12th, 2016 and expect something similar to happen here. Meaning the pullback sets up the next thrust higher that should reach the 2370-2380 range... and that's where I think we could see a decent correction start from.
If we get that move up I'll short again. If not, I'll be happy with my current shorts. Picking the top is extremely hard and rarely does any trader pick it several times in a row. So I just inch into shorts at different levels so I have a position when it finally falls... which last year those falls came fast and hard with not much warning. We could be setting up for another mini-crash soon? I say that because of the strange behavior of the VIX, which has be rallying up the last few days why the futures rally too. And there's be some good buying of VIX calls as well. Something stinks about this rally and it's not something I can put my finger on yet. A rising VIX spells trouble for next month in the market, so maybe the March Winds turn out to be a March Hurricane instead? I don't know for sure but I'd rather inch into shorts then chase this bubble higher. Day traders of course can just keep riding the trend up for as long as it works I guess. I'm just not a day trader and look for a position I can hold for a month or less.
Anyway, not much more to add... everything is overbought but the market keeps going up. I'm just looking for a pullback that breaks the rising support trendline of support, which should setup another push higher. Maybe it reaches 2370-2380... maybe it falls short? Don't know? But I do expect some kind of last gasp higher after the first pullback happens. And keep in mine that we need a red close on the day for it to be a real pullback I think. Otherwise it's just part of the rally up, which has seen more green days in row then coughs from Hillary.
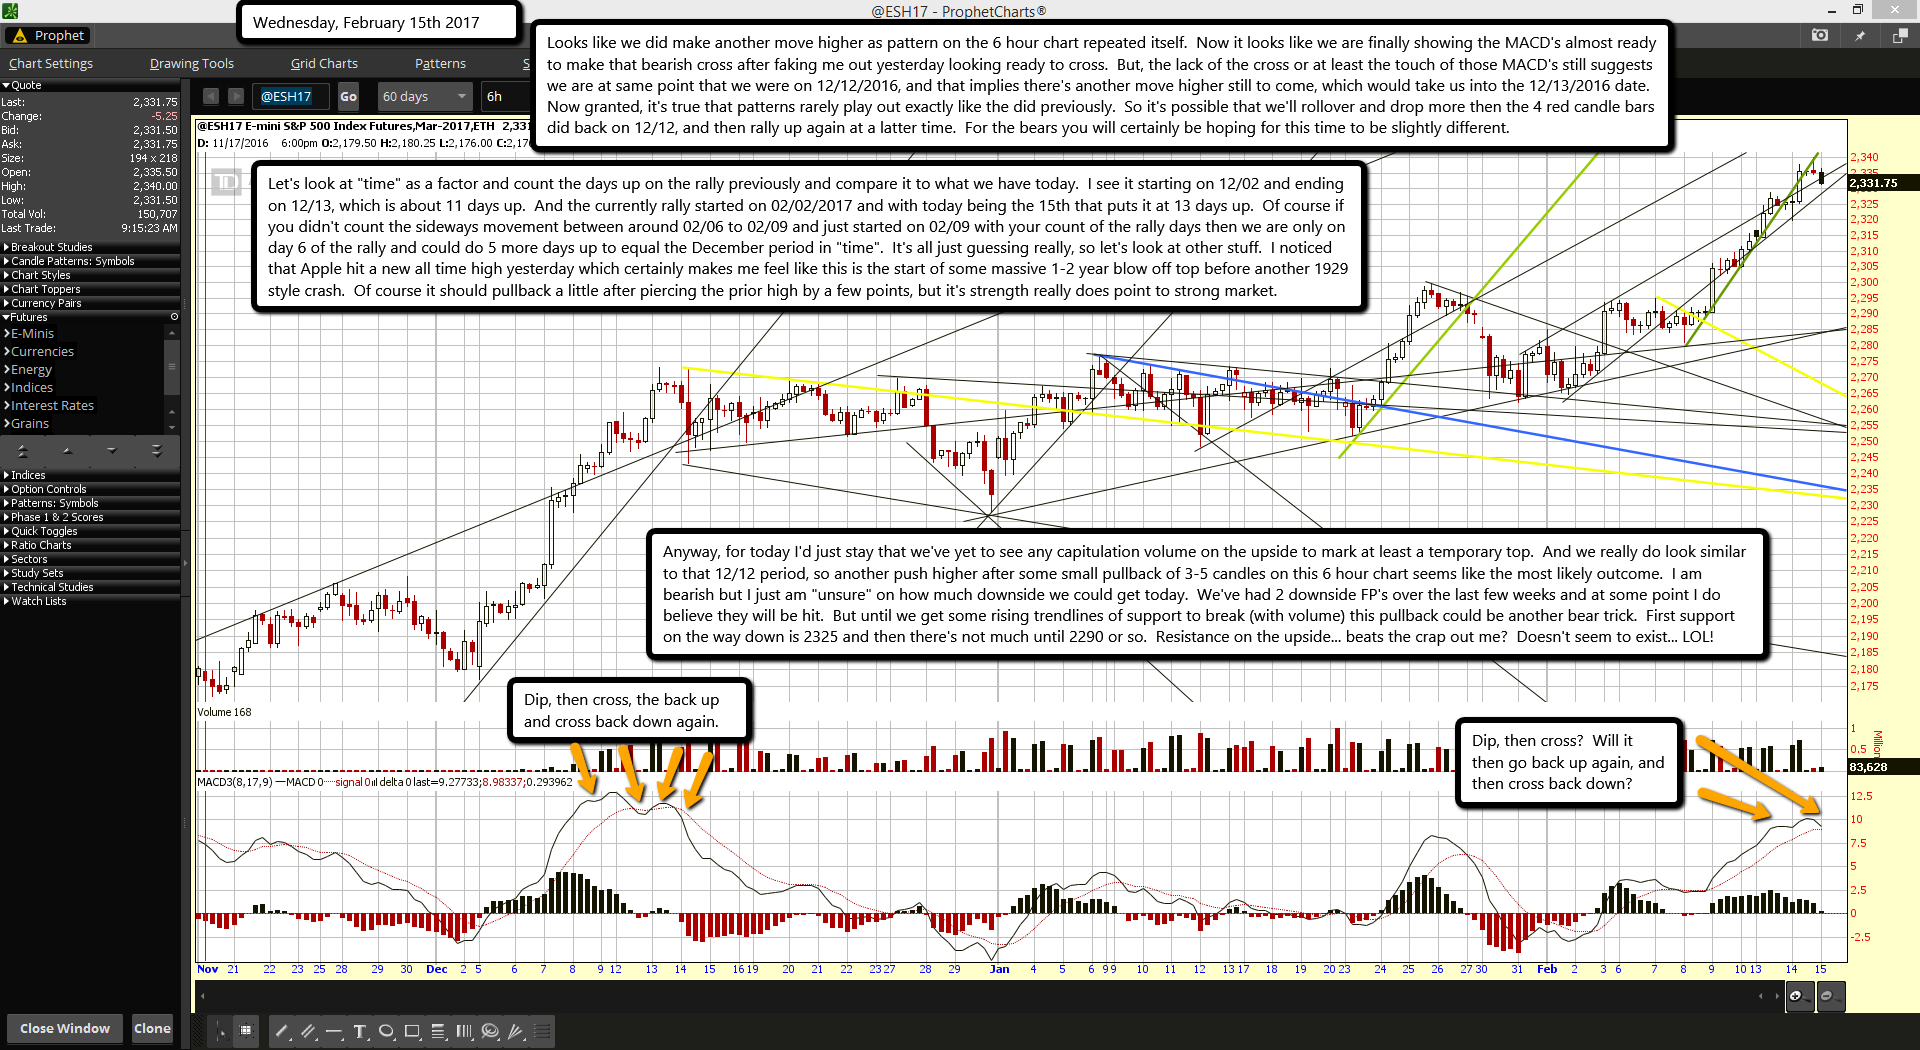
Looks like we did make another move higher as pattern on the 6 hour chart repeated itself. Now it looks like we are finally showing the MACD's almost ready to make that bearish cross after faking me out yesterday looking ready to cross. But, the lack of the cross or at least the touch of those MACD's still suggests we are at same point that we were on 12/12/2016, and that implies there's another move higher still to come, which would take us into the 12/13/2016 date. Now granted, it's true that patterns rarely play out exactly like the did previously. So it's possible that we'll rollover and drop more then the 4 red candle bars did back on 12/12, and then rally up again at a latter time. For the bears you will certainly be hoping for this time to be slightly different.
Let's look at "time" as a factor and count the days up on the rally previously and compare it to what we have today. I see it starting on 12/02 and ending on 12/13, which is about 11 days up. And the currently rally started on 02/02/2017 and with today being the 15th that puts it at 13 days up. Of course if you didn't count the sideways movement between around 02/06 to 02/09 and just started on 02/09 with your count of the rally days then we are only on day 6 of the rally and could do 5 more days up to equal the December period in "time". It's all just guessing really, so let's look at other stuff. I noticed that Apple hit a new all time high yesterday which certainly makes me feel like this is the start of some massive 1-2 year blow off top before another 1929 style crash. Of course it should pullback a little after piercing the prior high by a few points, but it's strength really does point to strong market.
Anyway, for today I'd just stay that we've yet to see any capitulation volume on the upside to mark at least a temporary top. And we really do look similar to that 12/12 period, so another push higher after some small pullback of 3-5 candles on this 6 hour chart seems like the most likely outcome. I am bearish but I just am "unsure" on how much downside we could get today. We've had 2 downside FP's over the last few weeks and at some point I do believe they will be hit. But until we get some rising trendlines of support to break (with volume) this pullback could be another bear trick. First support on the way down is 2325 and then there's not much until 2290 or so. Resistance on the upside... beats the crap out me? Doesn't seem to exist... LOL!