Sunday, July 26, 2026
Home Blog Page 65

ES Morning Update February 8th, 2017

0

add74ee0-cb12-4bfb-9a1f-8b094ef5e5ca

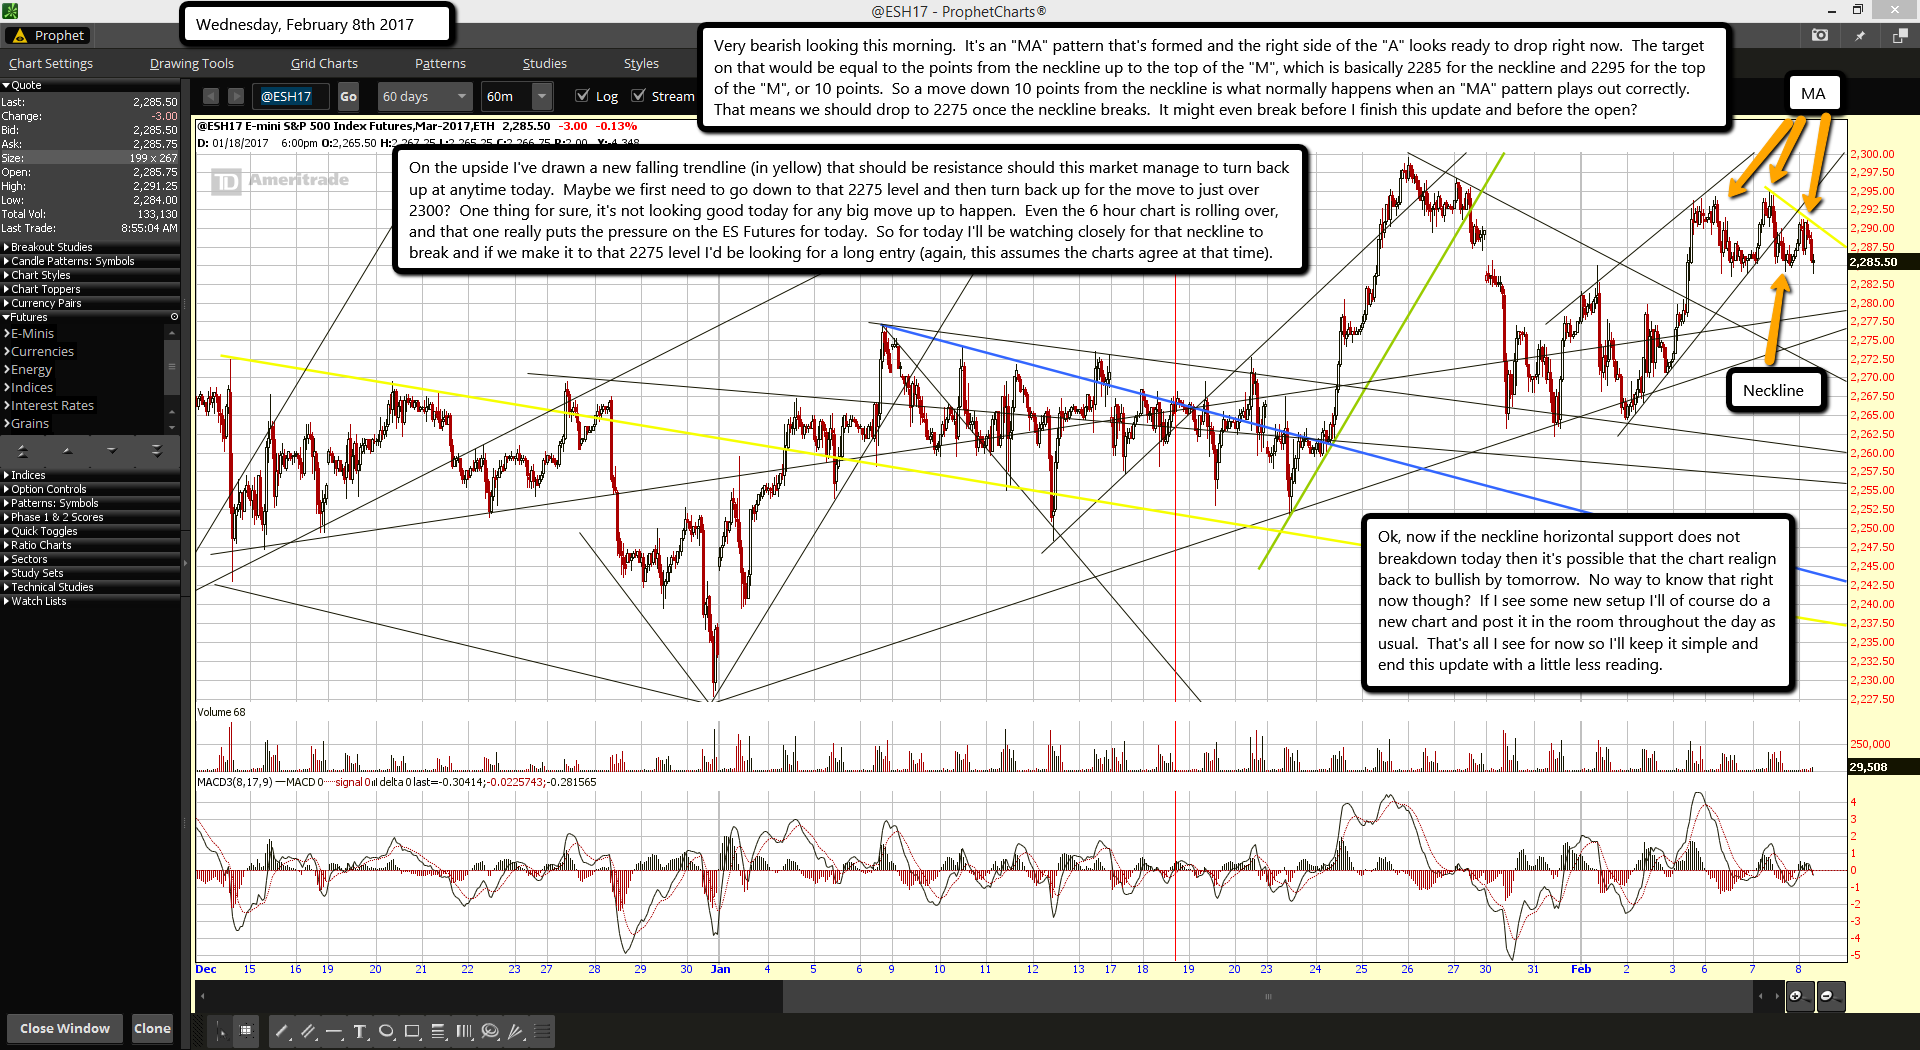
Very bearish looking this morning.  It's an "MA" pattern that's formed and the right side of the "A" looks ready to drop right now.  The target on that would be equal to the points from the neckline up to the top of the "M", which is basically 2285 for the neckline and 2295 for the top of the "M", or 10 points.  So a move down 10 points from the neckline is what normally happens when an "MA" pattern plays out correctly.  That means we should drop to 2275 once the neckline breaks.  It might even break before I finish this update and before the open?

On the upside I've drawn a new falling trendline (in yellow) that should be resistance should this market manage to turn back up at anytime today.  Maybe we first need to go down to that 2275 level and then turn back up for the move to just over 2300?  One thing for sure, it's not looking good today for any big move up to happen.  Even the 6 hour chart is rolling over, and that one really puts the pressure on the ES Futures for today.  So for today I'll be watching closely for that neckline to break and if we make it to that 2275 level I'd be looking for a long entry (again, this assumes the charts agree at that time).

Ok, now if the neckline horizontal support does not breakdown today then it's possible that the chart realign back to bullish by tomorrow.  No way to know that right now though?  If I see some new setup I'll of course do a new chart and post it in the room throughout the day as usual.  That's all I see for now so I'll keep it simple and end this update with a little less reading.

The 2017 Economist cover: Do you really want to know what it means?

0


Trump & 2017 Economist Cover: Do You Really Want To Know What It Means?

TMR Editor’s Report:
The following extended essay on the 2017 Economist Cover is extremely telling and radioactive, to say the very least.

For anyone who really wants to know the hidden Tarot meaning of this cover, especially where it concerns the future of the entire planetary civilization, keep on reading.

The Rothschild Code – The World in 2017 – Planet Trump

Serge Bernard does a great job of teasing out the secret messaging of the very symbolic cover art.  Truly, it is pregnant with esoteric meaning and clandestine signage.  It reveals the thinking of the international banksters*, and particularly their vision of the future of the world.

*The Economist is half owned by the Rothschild clan and the Agnelli Black Nobility family of Northern Italy, each having an equal share of the 50% ownership.

The Millennium Report
December 5, 2016


The Rothschild Code – The World in 2017 – Planet Trump

The Tarot Cards On The Economist Cover
About The World For 2017


By Serge Bernard

The respectable English magazine “The Economist” [that extols the virtues of economic liberalism] expresses world oligarchs financial and political views. It is owned 50% by the English branch of the Rothschild family and the Agnelli Family. The remaining 50% are owned by private investors, editors and staff members. Each year, the Economist publishes a special issue about the year to come –illustrated by its cryptic cover– that is always revealing of Rothschild world views. The issue about 2017 is no exception and is surprising as its cover is showing eight modified tarot cards, making hidden messages more accessible.

TW2017_Cover_FINALS.indd

A Few Words About Rothschild Materialism and Spirituality

This article follows last week astro-tarologic article “Who Are Those Secretive Billionaires Ruling The World And Our Lives?” The tarot cards presence on the 2017 Economist cover indicate that the oligarchs who are materially mega-rich may start to realize that they are also spiritually mega-poor. While they look at the world for more material  power, they may become aware that human destruction will not bring them more happiness and freedom rather it will bring them less. Not a good deal. With the eight tarot cards analyzed one by one, Rothschild world vision will become clearer.

World Previsions According to Rothschild

1024x1346-the-economist-cover-2016

The eight tarot cards need to be interpreted, literally and symbolically, from Rothschild perspective and not from the reader viewpoint. The cards don’t present events predictions, but Rothschild opinion about his world vision. This year messages are somewhat more open than in the past for who can understand the tarot cards literal and symbolic meanings. When talking about the future we must distinguish three possible approaches: (1) forecasting, (2) anticipation, and (3) opinion. (1) It is my belief that no one can predict future events, not even Rothschild. As evidence, the complete absence of Trump on the 2016 Economist cover. Events only exist after being produced. (2) However, it is possible to express anticipations of trends and potentials in the light of existing facts, such as for instance global events created or planned by the oligarchy, and (3) Anyone can express opinions about the future, which are only engaging their authors, whom then have the same right to error than meteorologists or doctors. In a nutshell, futurologists, whether oligarchs, economists or anyone, can’t make forecasts. They only reveal the present to those who are still stuck in the past. This applies to Rothschild visions as well.

The Eight Tarot Cards from the 2017 Economist Cover

300x300-jp-morgan

Millionaires don’t use astrology, billionaires do.
J.P. Morgan

Targeted to an educated and influential readership, the Economist is a magazine representing issues from an economic, political and cultural liberalism point of view (free trade, globalisation and free immigration). That oligarchs are showing an interest for the esoteric world shouldn’t be a surprise. They are very lonely at the top and their spiritual vacuum is huge. The tarots cards on the Economist cover may represent a desire to reconcile the material world to the esoteric and spiritual world.

Here are some comments before analyzing the eight selected tarot cards: (1) they kept their original names and symbolic meanings, (2) they are modified to give some literal representations about Rothschild’s view of the world to come, (3) they all belong to the 22 major arcana in the 78-card deck, (4) they are presented in a sequence different than their natural order (which could be justified by the new narrative, but I believe is more for visual illustration reasons) and (5) two cards are tilted (which could be interpreted more obliquely, but I believe that this too is for visual illustration reasons). Therefore, I will analyze the eight tarot cards in their natural sequence and in vertical position.

01 – The Initiating MAGICIAN – INITIATION – To choose
Uncover the life direction and build a new reality

For more info about the Initiating Magician

345x565-01-economist-the-magician

The classical tarot card of The Magician is sometimes titled “Le Bateleur” meaning the Street Showman. The Economist Magician has many similarities with the Rider-Waite-Smith classical tarot Magician. (1) He is a standing showman (ready for action), (2) behind a table (ready for magical objects), (3) facing a future audience (his magic show), (4) his right hand (sign of activity as opposed to the left hand receptivity), (5) holding vertically (earth life is linked to the cosmos), (6) a magic wand (supernatural power), (7) his right arm is directed towards the sky and his left arm towards the earth (ability to link the material energy of the earth to the spiritual energy in the sky). (8) He is wearing a red cloak (life energy ready for practical action), (9) with yellow (gold = wealth) neck border and belt, and (10) he has a lemniscate over his head (infinite energy and stamina).

Unlike the classical tarot Magician, the Economist Magician (1) has a yellow sun behind his head (royal ego), (2) with a virtual reality (VR) device over his eyes (virtual reality show), (4) and his left index (receptivity), (5) is over a 3D printer (modern technology), (6) touching the power button (easy activation), (7) producing unlimited housing units (abundant real estate production).

1200x1200-donald-trump-profileThe Economist Magician is a direct metaphor for none other than Donald Trump (“Planet Trump” is the subtitle on the cover). The Showman with a royal ego, a virtual reality show and a real estate  production machine are obvious literal symbols. Donald Trump has no previous political experience, he is like Mickey in Disney episode of “The Apprentice Sorcerer” in Fantasia. In his own reality TV show, Donald Trump was the Master of the “Apprentice”. Today, tables have turned and he is the Apprentice. His Master is Rothschild, who put him in the US President position.

In 2016, I wrote six astro-tarologic articles about Trump and always associated him with the Magician tarot card. I also considered him as an actor and questioned whether that would be enough to qualify him to be President. Yes, Ronald Reagan did it before him. Here are the links for the previous Trump articles: Donald Trump, The Egomaniac We Love To HateWhat Would An Astro Tarologer Tell Donald Trump After His Iowa Defeat? – Donald, Bernie, Ben And The Others Can Donald Trump Fake It All The Way to The Presidency? – Trump Secret Plan: Not Becoming the Next President – Unveiling the Secret Behind Donald Trump Unexpected Victory

09 – The Enlightening HERMIT – ASCENT – To enlighten
Look inside and trust the unknown

345x565-09-economist-the-hermit

The Rider-Waite-Smith classical tarot card of the Hermit shows an introspective (isolation) old man (wisdom) with a long beard (austerity) looking to the left (past) in a long vertical monastic (asceticism) dress (time mastery) standing straight (self-confidence) holding a stick (connection to material earth) in his left hand (receptive) and a lantern (search of light) in his right (active) hand.

  4th Baron Nathaniel Charles Jacob Rothschild

The Hermit of the Economist shows an identical old man, but occupying only a small portion of the image. The rest is mostly representing the hermit world mastery who (1) stands on a rock solid platform of a mountain top (dominating global panorama), (2) overlooking (in a power position), (3) marching groups of people (united in a single military march), (4) in the valley (lower level). (5) In the back there are four (stability) pyramidal mountain tops (esoteric elevation), (6) and several flowing mountains (potential flooding in the valley) (7) during a night sky (dreams), (8) showing the moon (unconscious), (9) and six (harmony) stars (small spotty lights). (10) Under the hermit mountain, there is a lightning (destruction by fire), (11) striking the United States (end of US supremacy). See more info about the US superpower cycle in the article 2010-2025: Our World In Transition. The marching people in the valley are carrying groups flags: (a) TTIP (Transatlantic Trade and Investment Partnership) blue flag, crossed, (b) TTP (Trans-Pacific Partnership) red flag, crossed, (c) EU (European Union) blue flag crossed, (d) STOP (attacks against the USA?) red on white flag, (e) NO (no other Brexit?) white on blue flag, (f) a small unreadable red flag, crossed, (g) a small unreadable blue flag, and (h) a very small unreadable red flag. It looks like f, g and h are not specific but only mean “more…”

With those symbols of world political mastery and anti-US Establishment supremacy (lighting over US as well as the three main flags a, b and c), the Hermit of the Economist is nobody else than Rothschild himself with his own world power vision.

10 – The Renewing WHEEL OF FORTUNE – RENEWAL – To accept
Go with the flow of life cycles and seek help of others if needed

345x565-10-economist-wheel-of-fortune

The traditional Wheel of Fortune tarot card shows three animals turning head first in an anti-clockwise rotation. The card symbolizes life vicissitudes of successes and failures.

The Economist Wheel of Fortune shows three European political leaders rotating head first in a clockwise rotation. There are two ballot boxes in the bottom, where each contain a voting ticket with a letter “x”, indicating that the “x” can be rigged in favor of any candidate to be selected by whom is holding the handle to rotate the wheel. It is obvious  for Rothschild that the invisible handle decision maker is none other than himself.

The Economist Wheel of Fortune is in line with the Hermit EU crossed flag, meaning that Rothschild is planning to end the EU. The three persons on the Wheel of Fortune are Germany, France and Holland key candidates for the coming 2017 elections: (1) Angela Merkel the incombent candidate for Germany elections to be held somewhere between August 27 and October 22, (2) Marine Le Pen for France elections to be held between April 23 and May 7 and (3) Mark Rutte the incumbent candidate for Holland elections to be held on March 15. The Economist Wheel of Fortune indicates Rothshild plans: (1) Eliminate Angela Merkel (dark cloud with lightning and rotating head down) as the US Establishment candidate, (2) Support Marine Le Pen (sun in the sky and rotating head up), kind of a French Trump, in favor of a Frexit referendum and (3) Wait to see how the Dutch campaign enfolds (emerging new head) and decide between Mark Rutte continued country leadership or Geert Wilders the contested Dutch populist. Note that all three are bound to the Wheel of Fortune meaning that they have no freedom of action and are totally dependent of the decision maker power.

13 – The Rebirthing DEATHREVOLUTION – To eliminate
Destroy what is over and build anew

345x565-13-economist-death

There is no resemblance of the Economist card of Death with any classical tarot card with the same name. So, let’s observe it from Rothschild perspective. The skeleton in a black (funeral) robe and holding a scythe is the symbol of death. The scenery is a nuclear apocalypse. Everything is dead except the horse with a red (life) harness and two blue flying insects. The fish in the dried out river is either dead or dying, and so are the three plants. The yellow (gold) sky is centered around a radiating red (life) sun while nine small yellow (gold) pieces are found scattered on the desolated land.

With the last minute replacement of Hillary Clinton by Donald Trump for the US Presidency, the London City (lead by the Rothschild Dynasty) dethroned the US Establishment (lead by the Bush Dynasty) after a century of supremacy. The power change went from 51/49 to 49/51 and is still very volatile. It is certain that the US Establishment will not give up its centennial supremacy without a fight. They still have the strongest military force in the world and may consider using the nuclear option. With such a scenario there would only be losers. Everyone is very much aware of that and nobody wants a nuclear apocalypse. In this poker game, the winner may die too. I am more inclined to believe that for Rothschild the apocalypse image is a metaphor for the unavoidable world economic and financial collapse, which will be painful but will open the door for a better life on earth.

16 – The Inspiring TOWER – INSPIRATION – To celebrate
Return to solid ground and dance

345x565-16-economist-the-tower

In certain classical tarot decks, the Tower card is called “Maison-Dieu”, “God’s House”, which in the Economist Tower card is represented by a Christian cross above the door. Above the Tower, the sky has very dark clouds with a huge thunderstorm and powerful lightnings. The Tower explosion symbolizes the Christianity fate in a war of religions. The Tower is spliced in two parts with followers groups on each side. Christianity on the right (the Christ on the cross) and Leninist Communism (the red flag with hammer and sickle) on the left. As Communism was more of a Christianity adversary in the past, I believe that Communism is a politically correct metaphor for today’s Islamism. The Tower is accessed by an angular path (broken access) surrounded by yellow (gold) wavy land (Vatican wealth). There is a note on the door (Vatican City is closed) and some texts and stones (Christianity relics losses) are falling from the exploded Tower. Rothschild vision is that Christianity, as we knew it, will lose its two millenaries superpower.

17 – The Giving STAR – EXPRESSION – To give
Act upon the world and live completely

345x565-17-economist-the-star

There is no resemblance of the Economist card of The Star with any classical tarot card with the same name. The image represents 14 big yellow 8-pointed (cardinal perfection) stars (fixed), 10 white small stars (the solar system) and one meteors (mobile shooting star) in a blue sky above a red soils with craters (new planet). Inside each big star, there is a picture of a young unidentified person (youth in general). The 10 white stars imply that the red celestial body is situated outside our solar system. We are in space where youth is shining. The meteor is representing a star in transformation. From Rothschild vision, human race apocalypse on earth will not be final. There will be new life in space after.

20 – The Transforming JUDGMENT – TRANSFORMATION – To be reborn
Welcome the irresistible call of your soul and prepare for a new level of consciousness

345x565-20-economist-judgment

There is no resemblance of the Economist card of Judgment with any classical tarot card with the same name. With a crowned globe (world power) in his right hand (active) and a scepter (royal power) in his left hand (receptive), Donald Trump feels like the world Emperor (very much like the Emperor tarot card). However in traditional Emperor card, the Emperor holds the scepter in his right hand and the globe in the left. This indicates that Trump received the world power instead of conquering it. The Judgment card shows Trump dressed in black (funeral), sitting only on the United States and not the world. Hence his vulnerability. Rothschild vision is that Trump is blinded by his narcissistic power and seems to forget who put him there.Trump could be taken out of power if he does not obey Rothschild directions.

21 – The Awakening WORLD – AWAKENING – To triumph
You attained a soul awareness realization, enjoy your life to the utmost

345x565-21-economist-the-world

There is no resemblance of the Economist card of The World with any classical tarot card with the same name. The yellow (gold) sun (king of the universe) radiates its rays to the yellow earth continents (material wealth) on which lay three sacred architectures (spiritual wealth): a Greek temple, a Roman temple and an Egyptian pyramid. They are symbolized by a red (life) book (knowledge), a framed artwork (art) and two masks (life as the theater of tragedy and comedy). All three in turn are summarized by a red (life) framed artwork (art) and an open book (science). According to Rothschild vision, the World card represents his philanthropist side in the art and science world.

A Few Closing Words

According to Rothschild views and anticipations of the 2017 world, we are heading towards a dark period of major radical world changes: world economic and financial collapse, end of Christianity and the European Union, in an unpredictable Trump Planet. The eight tarot cards symbolize a paradigm shift of historic proportion. I want to believe that from the destruction, a more just, more humane and more united world will emerge … the Age of Aquarius that anticipates the art and science unity, as it appears in Rothschild ultimate vision of the World card.

As the paradigm shift will happen anyway, here is my single suggestion for Rothschild. “As conflicts only create problems and solve none, why not try love, light and harmony for a change.

In love, light and harmony.

Always,
Serge Bernard

Above post at http://astro-tarology.com/news/the-rothschild-code-the-world-in-2017-planet-trump/

ES Morning Update February 7th, 2017

0

b1766443-fd7f-4b3a-88cd-4008e7befb81

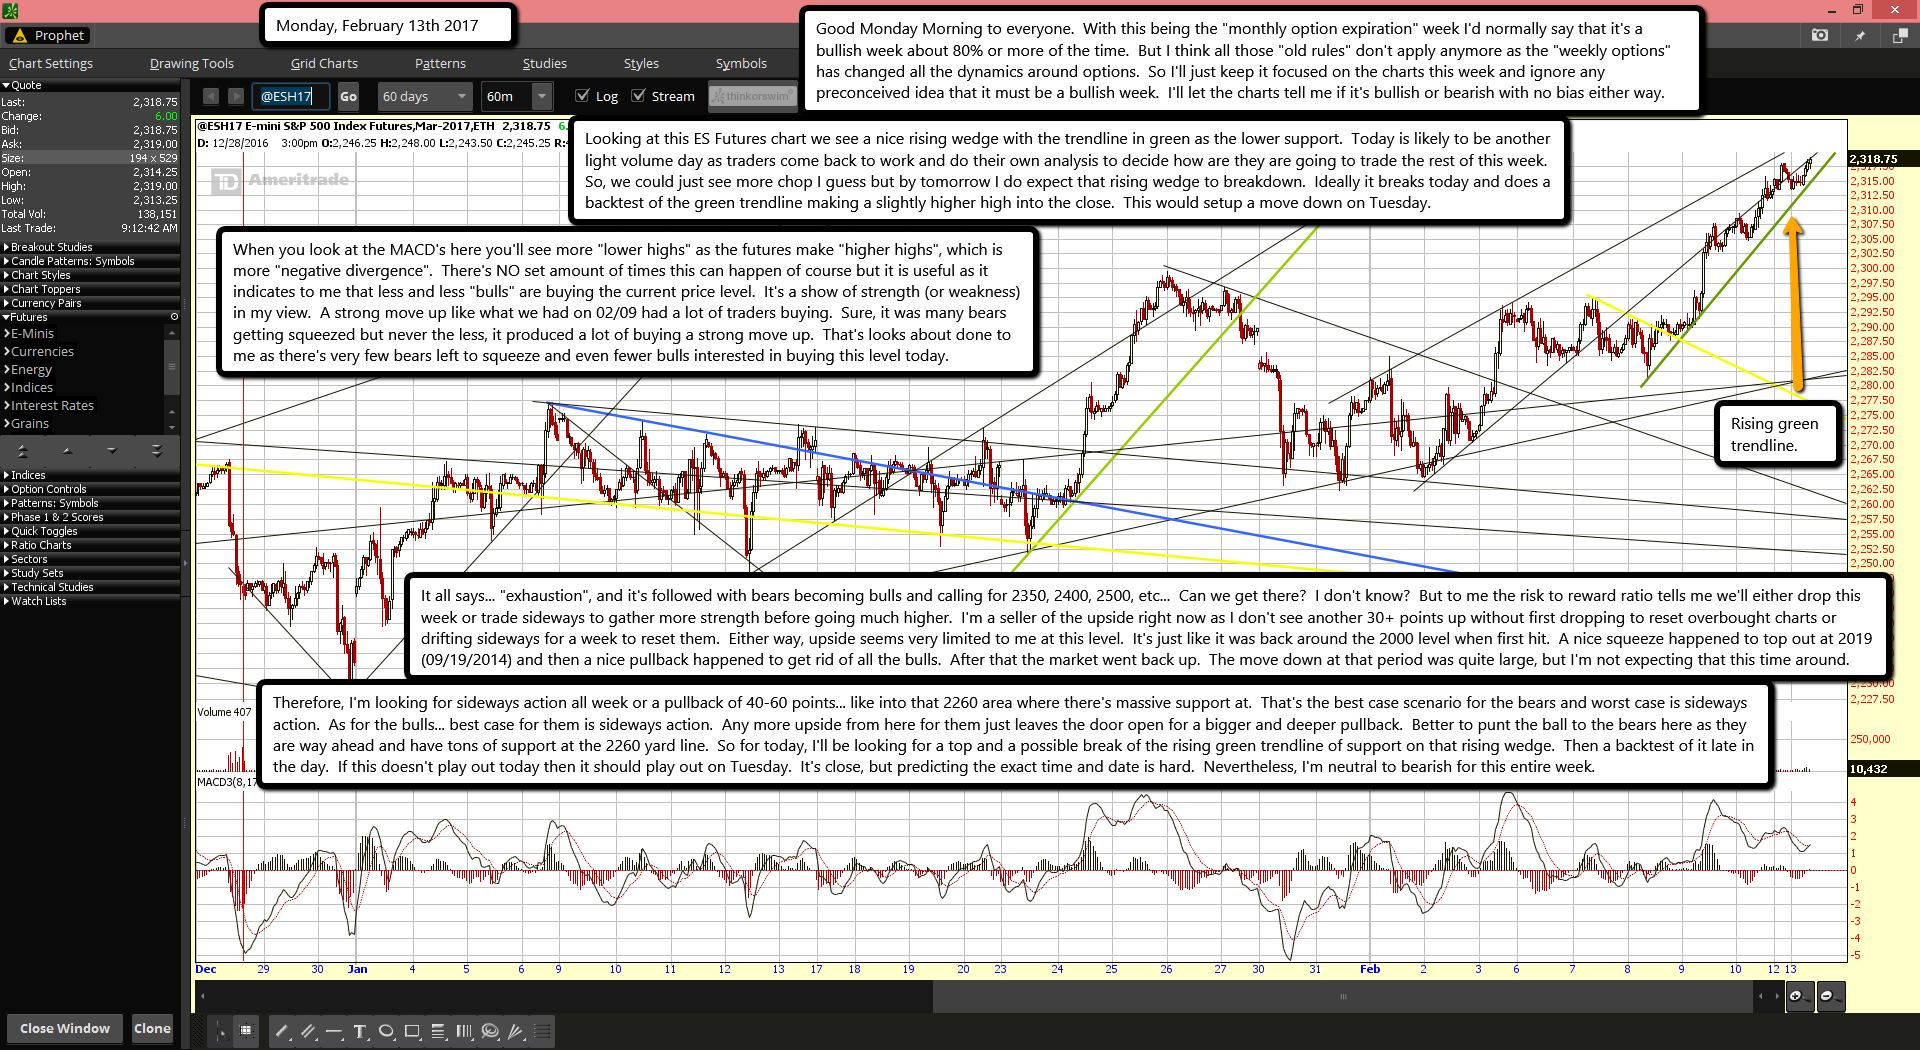
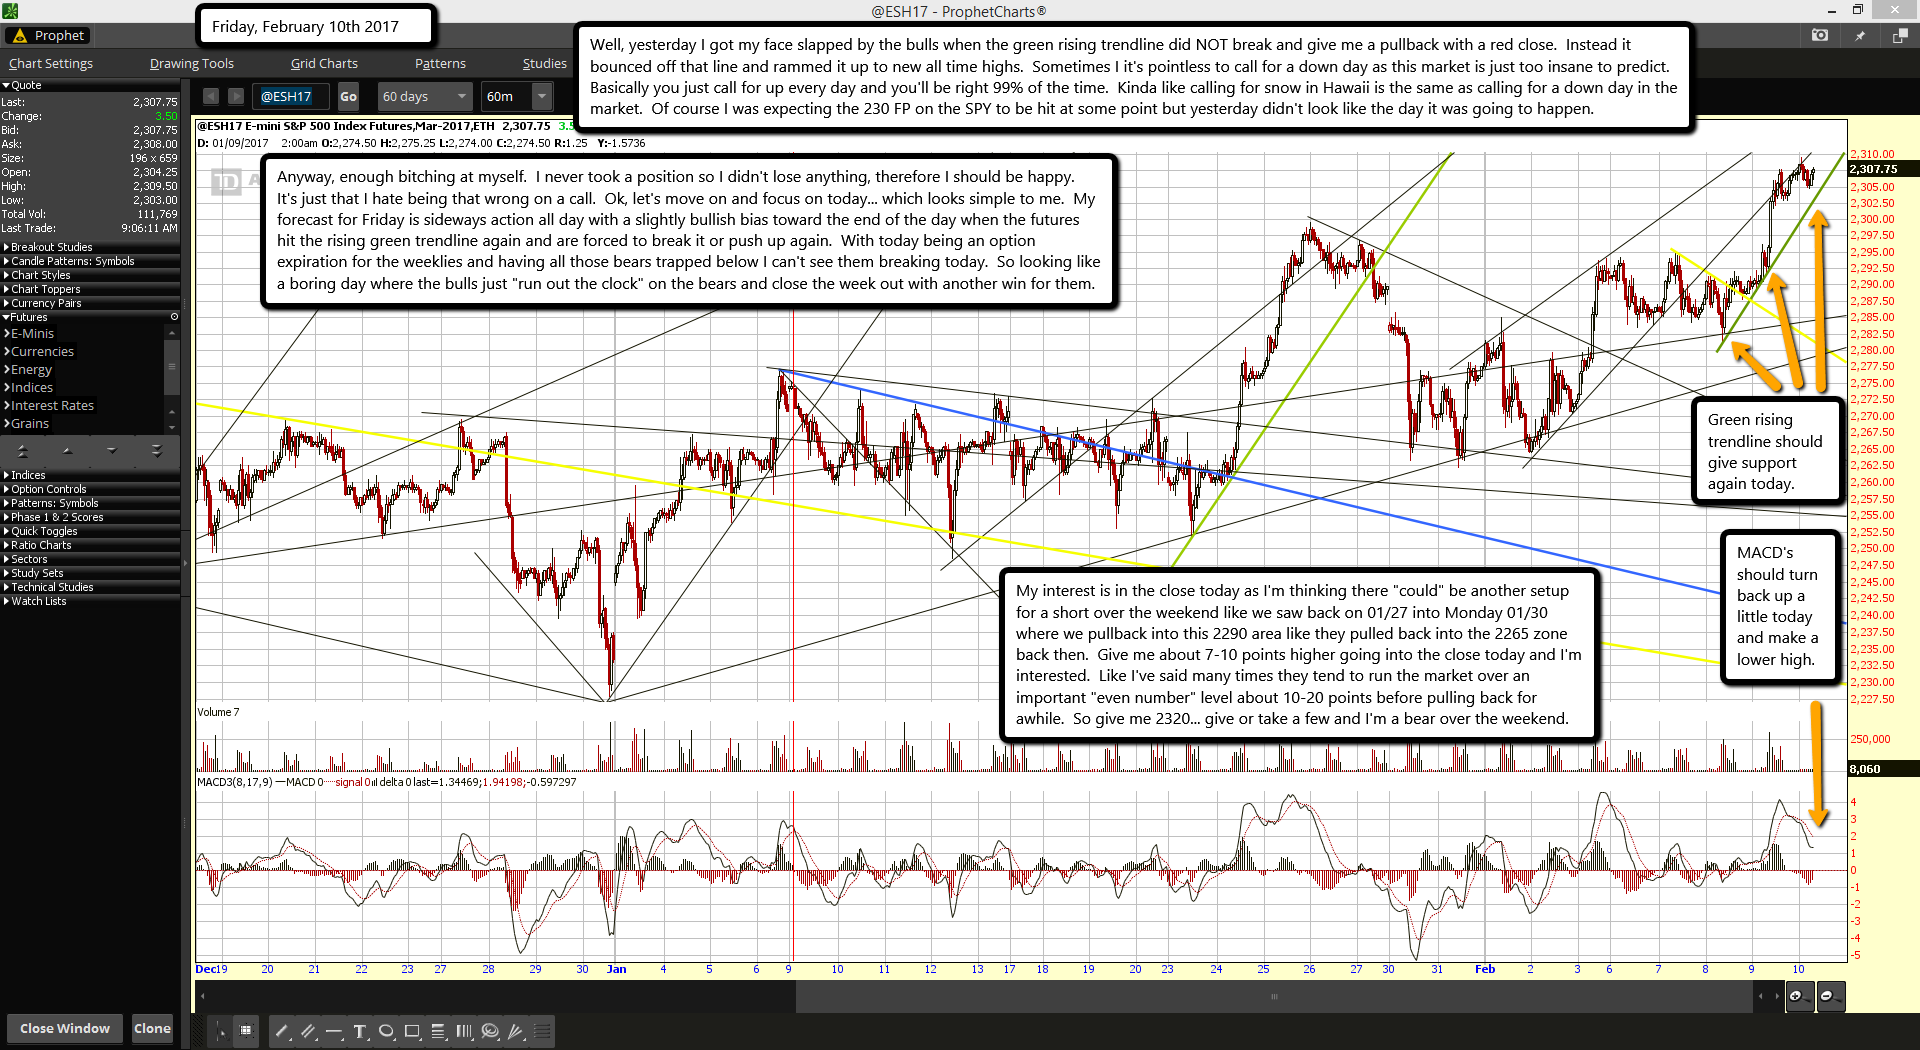
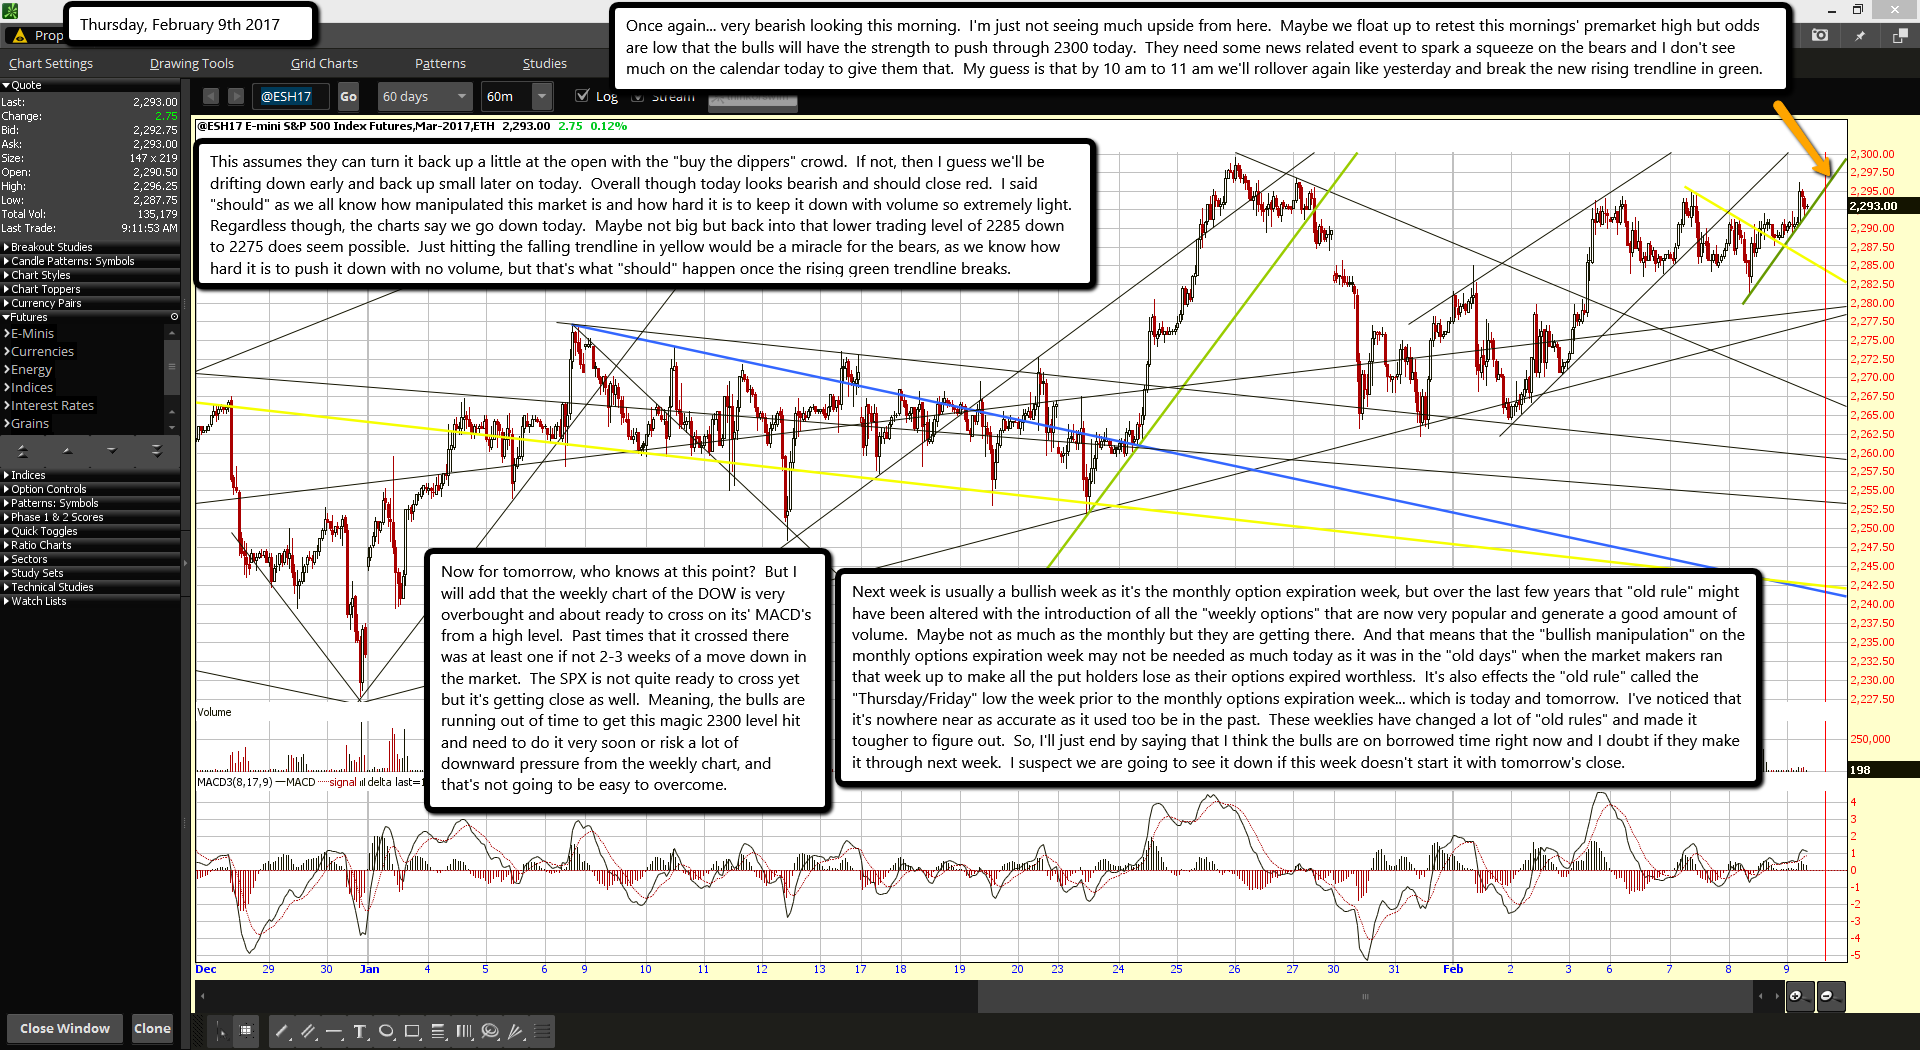
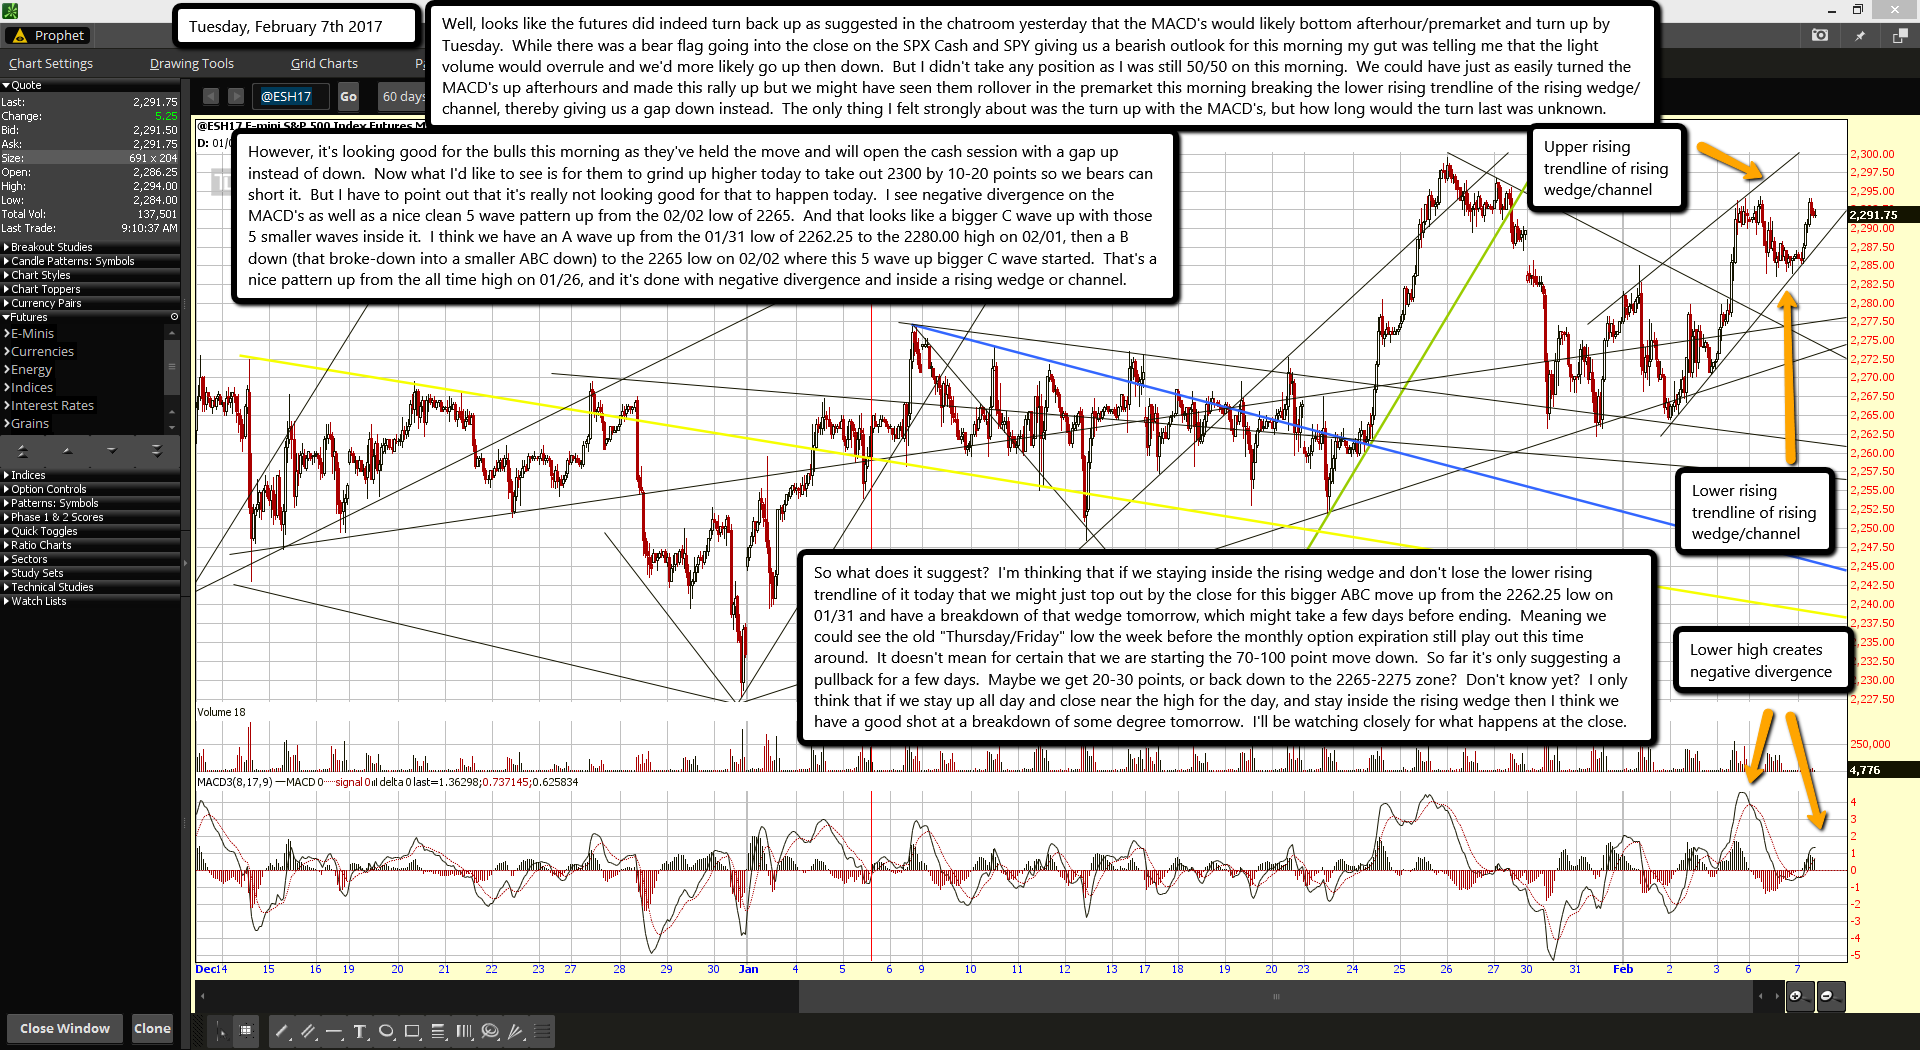
Well, looks like the futures did indeed turn back up as suggested in the chatroom yesterday that the MACD's would likely bottom afterhour/premarket and turn up by Tuesday.  While there was a bear flag going into the close on the SPX Cash and SPY giving us a bearish outlook for this morning my gut was telling me that the light volume would overrule and we'd more likely go up then down.  But I didn't take any position as I was still 50/50 on this morning.  We could have just as easily turned the MACD's up afterhours and made this rally up but we might have seen them rollover in the premarket this morning breaking the lower rising trendline of the rising wedge/channel, thereby giving us a gap down instead.  The only thing I felt strongly about was the turn up with the MACD's, but how long would the turn last was unknown.

However, it's looking good for the bulls this morning as they've held the move and will open the cash session with a gap up instead of down.  Now what I'd like to see is for them to grind up higher today to take out 2300 by 10-20 points so we bears can short it.  But I have to point out that it's really not looking good for that to happen today.  I see negative divergence on the MACD's as well as a nice clean 5 wave pattern up from the 02/02 low of 2265.  And that looks like a bigger C wave up with those 5 smaller waves inside it.  I think we have an A wave up from the 01/31 low of 2262.25 to the 2280.00 high on 02/01, then a B down (that broke-down into a smaller ABC down) to the 2265 low on 02/02 where this 5 wave up bigger C wave started.  That's a nice pattern up from the all time high on 01/26, and it's done with negative divergence and inside a rising wedge or channel.

So what does it suggest?  I'm thinking that if we staying inside the rising wedge and don't lose the lower rising trendline of it today that we might just top out by the close for this bigger ABC move up from the 2262.25 low on 01/31 and have a breakdown of that wedge tomorrow, which might take a few days before ending.  Meaning we could see the old "Thursday/Friday" low the week before the monthly option expiration still play out this time around.  It doesn't mean for certain that we are starting the 70-100 point move down.  So far it's only suggesting a pullback for a few days.  Maybe we get 20-30 points, or back down to the 2265-2275 zone?  Don't know yet?  I only think that if we stay up all day and close near the high for the day, and stay inside the rising wedge then I think we have a good shot at a breakdown of some degree tomorrow.  I'll be watching closely for what happens at the close.

ES Morning Update February 6th, 2017

0

5f07f00e-132c-435a-b12c-9e457f15569d

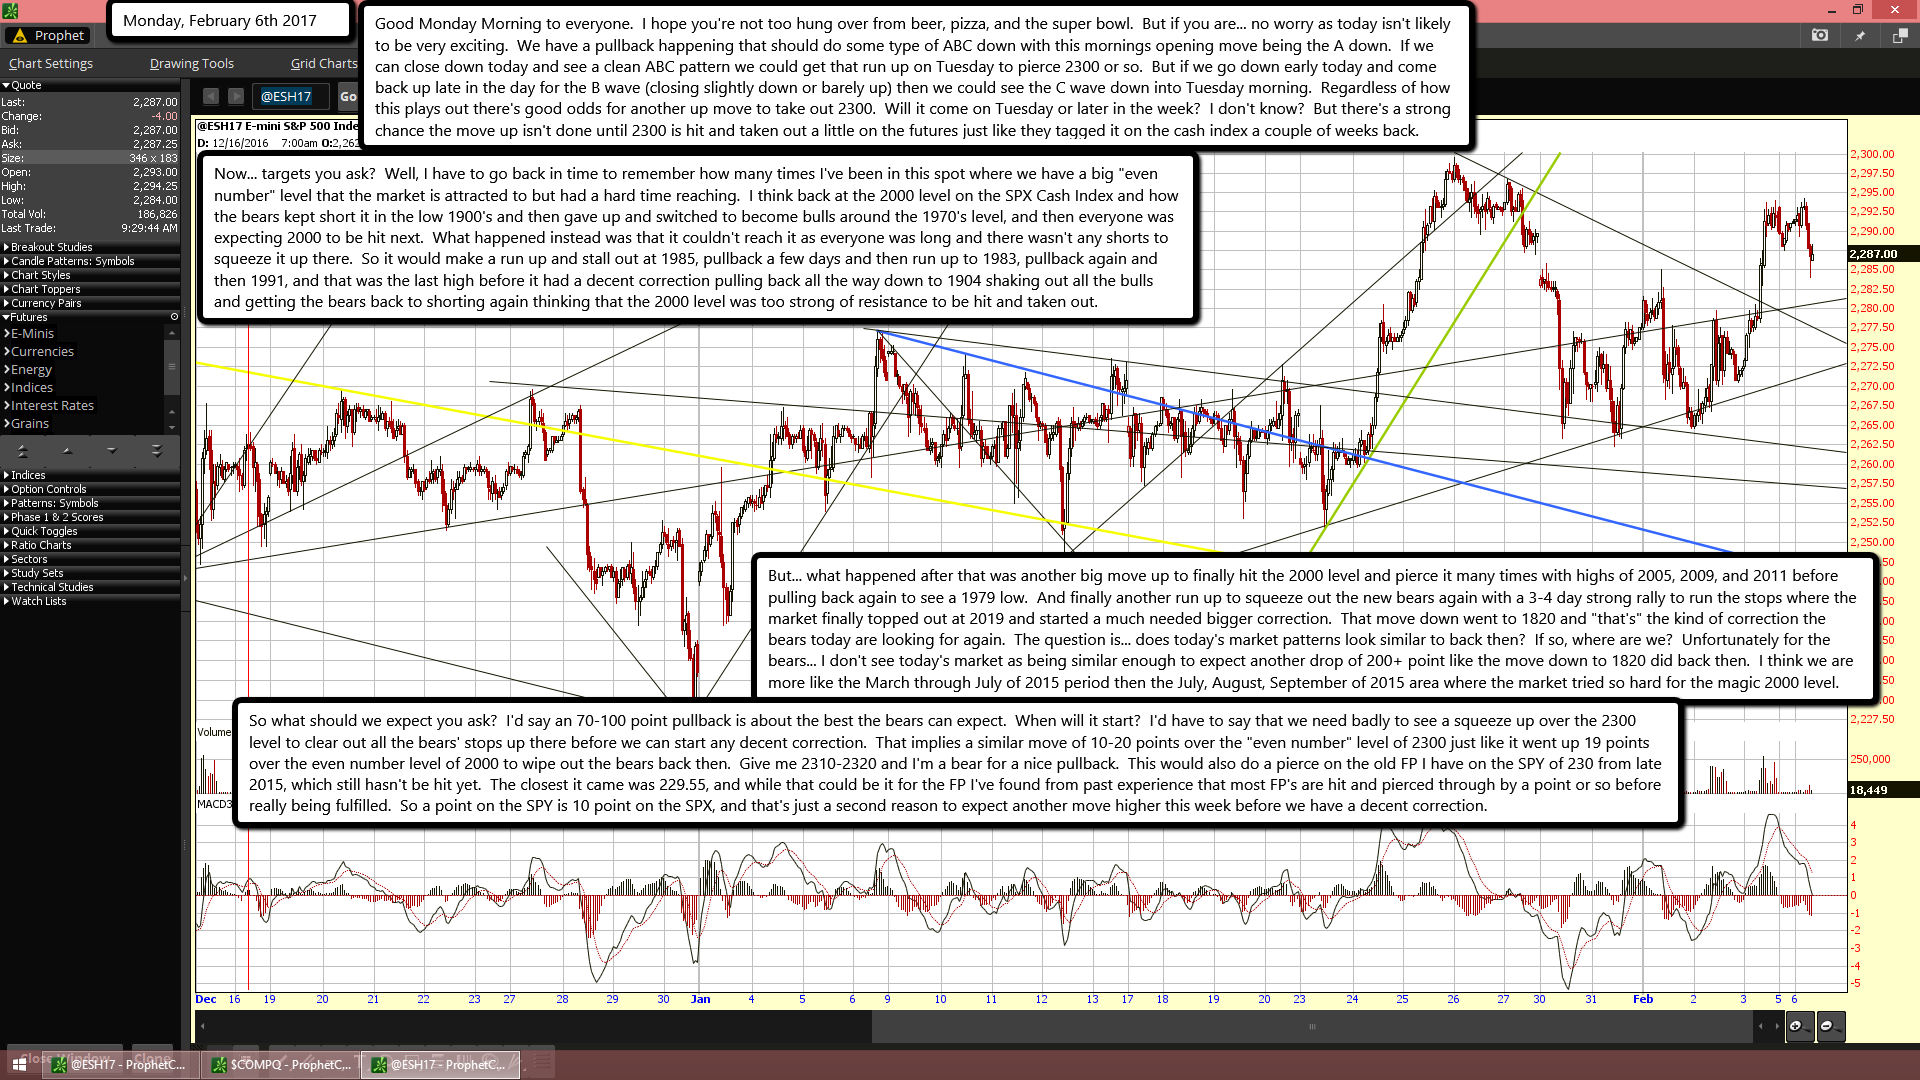
Good Monday Morning to everyone.  I hope you're not too hung over from beer, pizza, and the super bowl.  But if you are... no worry as today isn't likely to be very exciting.  We have a pullback happening that should do some type of ABC down with this mornings opening move being the A down.  If we can close down today and see a clean ABC pattern we could get that run up on Tuesday to pierce 2300 or so.  But if we go down early today and come back up late in the day for the B wave (closing slightly down or barely up) then we could see the C wave down into Tuesday morning.  Regardless of how this plays out there's good odds for another up move to take out 2300.  Will it come on Tuesday or later in the week?  I don't know?  But there's a strong chance the move up isn't done until 2300 is hit and taken out a little on the futures just like they tagged it on the cash index a couple of weeks back.

Now... targets you ask?  Well, I have to go back in time to remember how many times I've been in this spot where we have a big "even number" level that the market is attracted to but had a hard time reaching.  I think back at the 2000 level on the SPX Cash Index and how the bears kept short it in the low 1900's and then gave up and switched to become bulls around the 1970's level, and then everyone was expecting 2000 to be hit next.  What happened instead was that it couldn't reach it as everyone was long and there wasn't any shorts to squeeze it up there.  So it would make a run up and stall out at 1985, pullback a few days and then run up to 1983, pullback again and then 1991, and that was the last high before it had a decent correction pulling back all the way down to 1904 shaking out all the bulls and getting the bears back to shorting again thinking that the 2000 level was too strong of resistance to be hit and taken out.

But... what happened after that was another big move up to finally hit the 2000 level and pierce it many times with highs of 2005, 2009, and 2011 before pulling back again to see a 1979 low.  And finally another run up to squeeze out the new bears again with a 3-4 day strong rally to run the stops where the market finally topped out at 2019 and started a much needed bigger correction.  That move down went to 1820 and "that's" the kind of correction the bears today are looking for again.  The question is... does today's market patterns look similar to back then?  If so, where are we?  Unfortunately for the bears... I don't see today's market as being similar enough to expect another drop of 200+ point like the move down to 1820 did back then.  I think we are more like the March through July of 2015 period then the July, August, September of 2015 area where the market tried so hard for the magic 2000 level.

So what should we expect you ask?  I'd say an 70-100 point pullback is about the best the bears can expect.  When will it start?  I'd have to say that we need badly to see a squeeze up over the 2300 level to clear out all the bears' stops up there before we can start any decent correction.  That implies a similar move of 10-20 points over the "even number" level of 2300 just like it went up 19 points over the even number level of 2000 to wipe out the bears back then.  Give me 2310-2320 and I'm a bear for a nice pullback.  This would also do a pierce on the old FP I have on the SPY of 230 from late 2015, which still hasn't be hit yet.  The closest it came was 229.55, and while that could be it for the FP I've found from past experience that most FP's are hit and pierced through by a point or so before really being fulfilled.  So a point on the SPY is 10 point on the SPX, and that's just a second reason to expect another move higher this week before we have a decent correction.

ES Morning Update February 3rd, 2017

0

b49c9915-8869-48ed-9b74-44018390f633

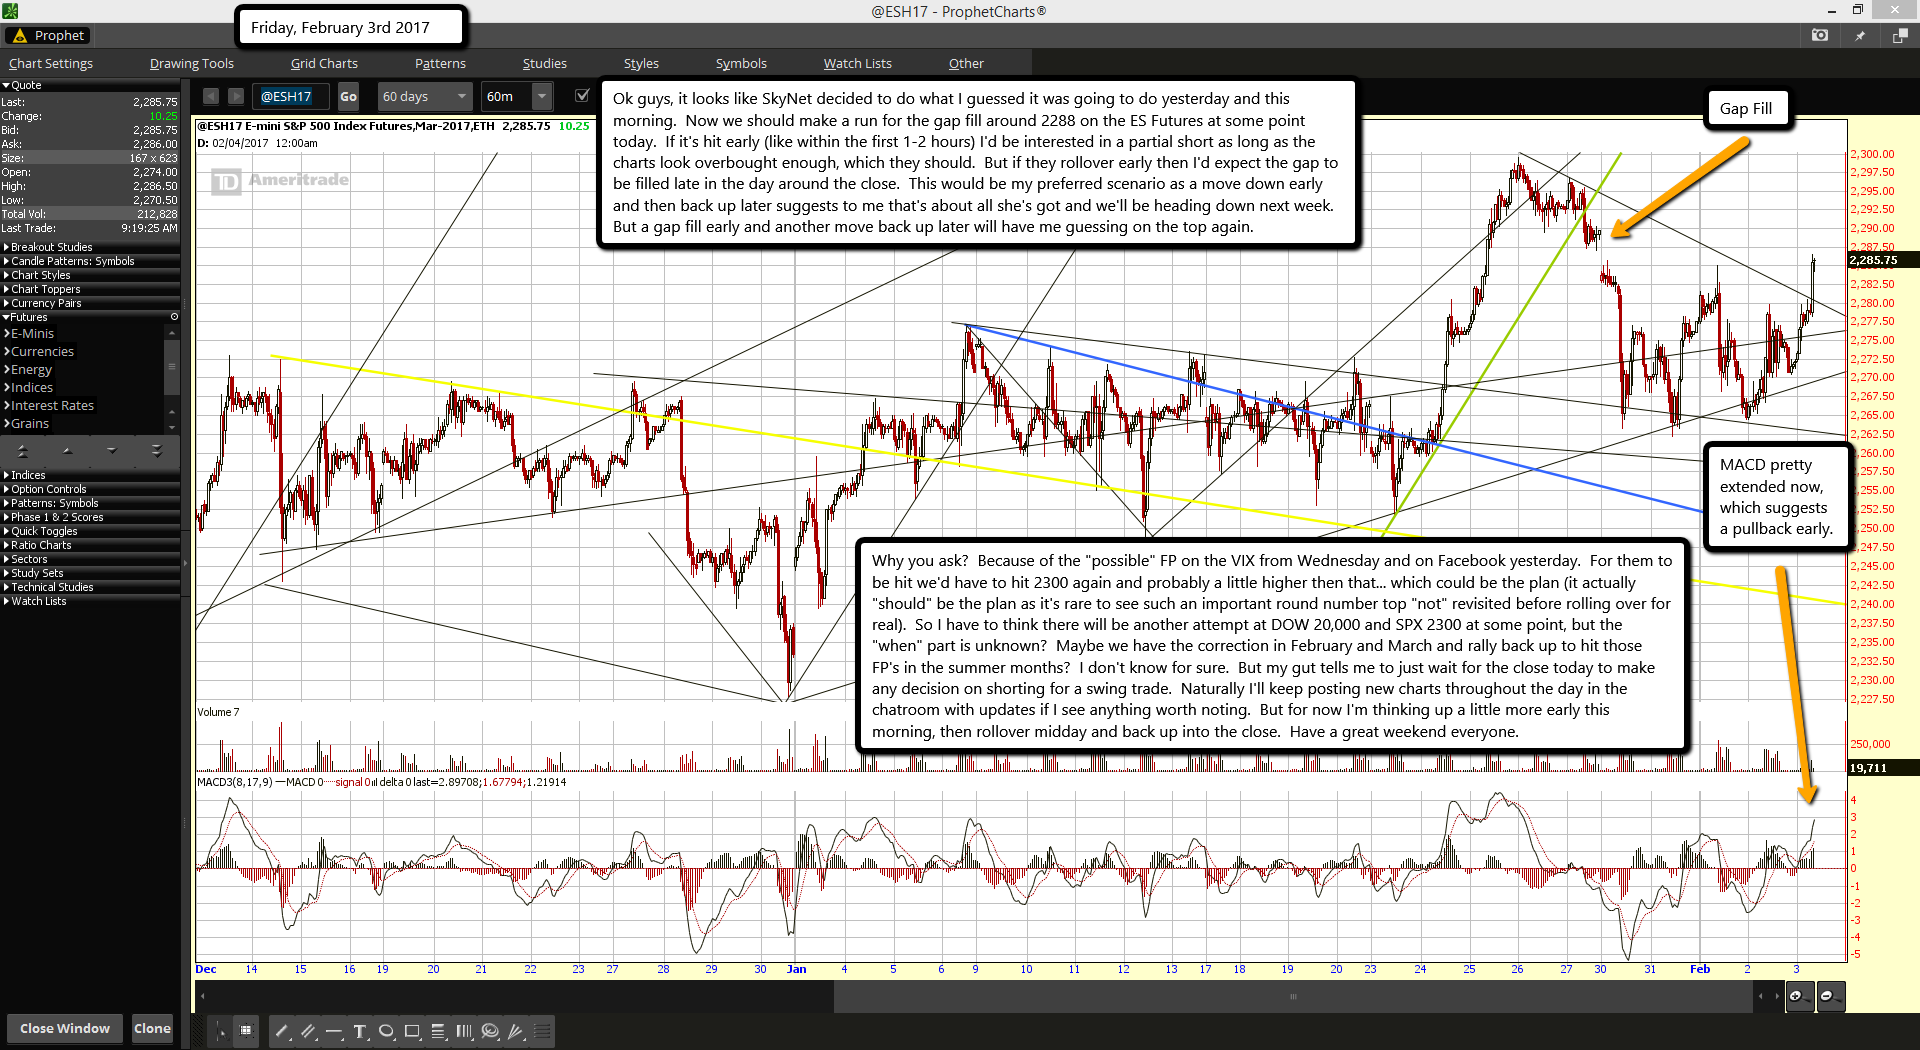
Ok guys, it looks like SkyNet decided to do what I guessed it was going to do yesterday and this morning.  Now we should make a run for the gap fill around 2288 on the ES Futures at some point today.  If it's hit early (like within the first 1-2 hours) I'd be interested in a partial short as long as the charts look overbought enough, which they should.  But if they rollover early then I'd expect the gap to be filled late in the day around the close.  This would be my preferred scenario as a move down early and then back up later suggests to me that's about all she's got and we'll be heading down next week.  But a gap fill early and another move back up later will have me guessing on the top again.

Why you ask?  Because of the "possible" FP on the VIX from Wednesday and on Facebook yesterday.  For them to be hit we'd have to hit 2300 again and probably a little higher then that... which could be the plan (it actually "should" be the plan as it's rare to see such an important round number top "not" revisited before rolling over for real).  So I have to think there will be another attempt at DOW 20,000 and SPX 2300 at some point, but the "when" part is unknown?  Maybe we have the correction in February and March and rally back up to hit those FP's in the summer months?  I don't know for sure.  But my gut tells me to just wait for the close today to make any decision on shorting for a swing trade.  Naturally I'll keep posting new charts throughout the day in the chatroom with updates if I see anything worth noting.  But for now I'm thinking up a little more early this morning, then rollover midday and back up into the close.  Have a great weekend everyone.

ES Morning Update February 2nd, 2017

0

2542bcdd-da78-4db7-a419-4243193837bd

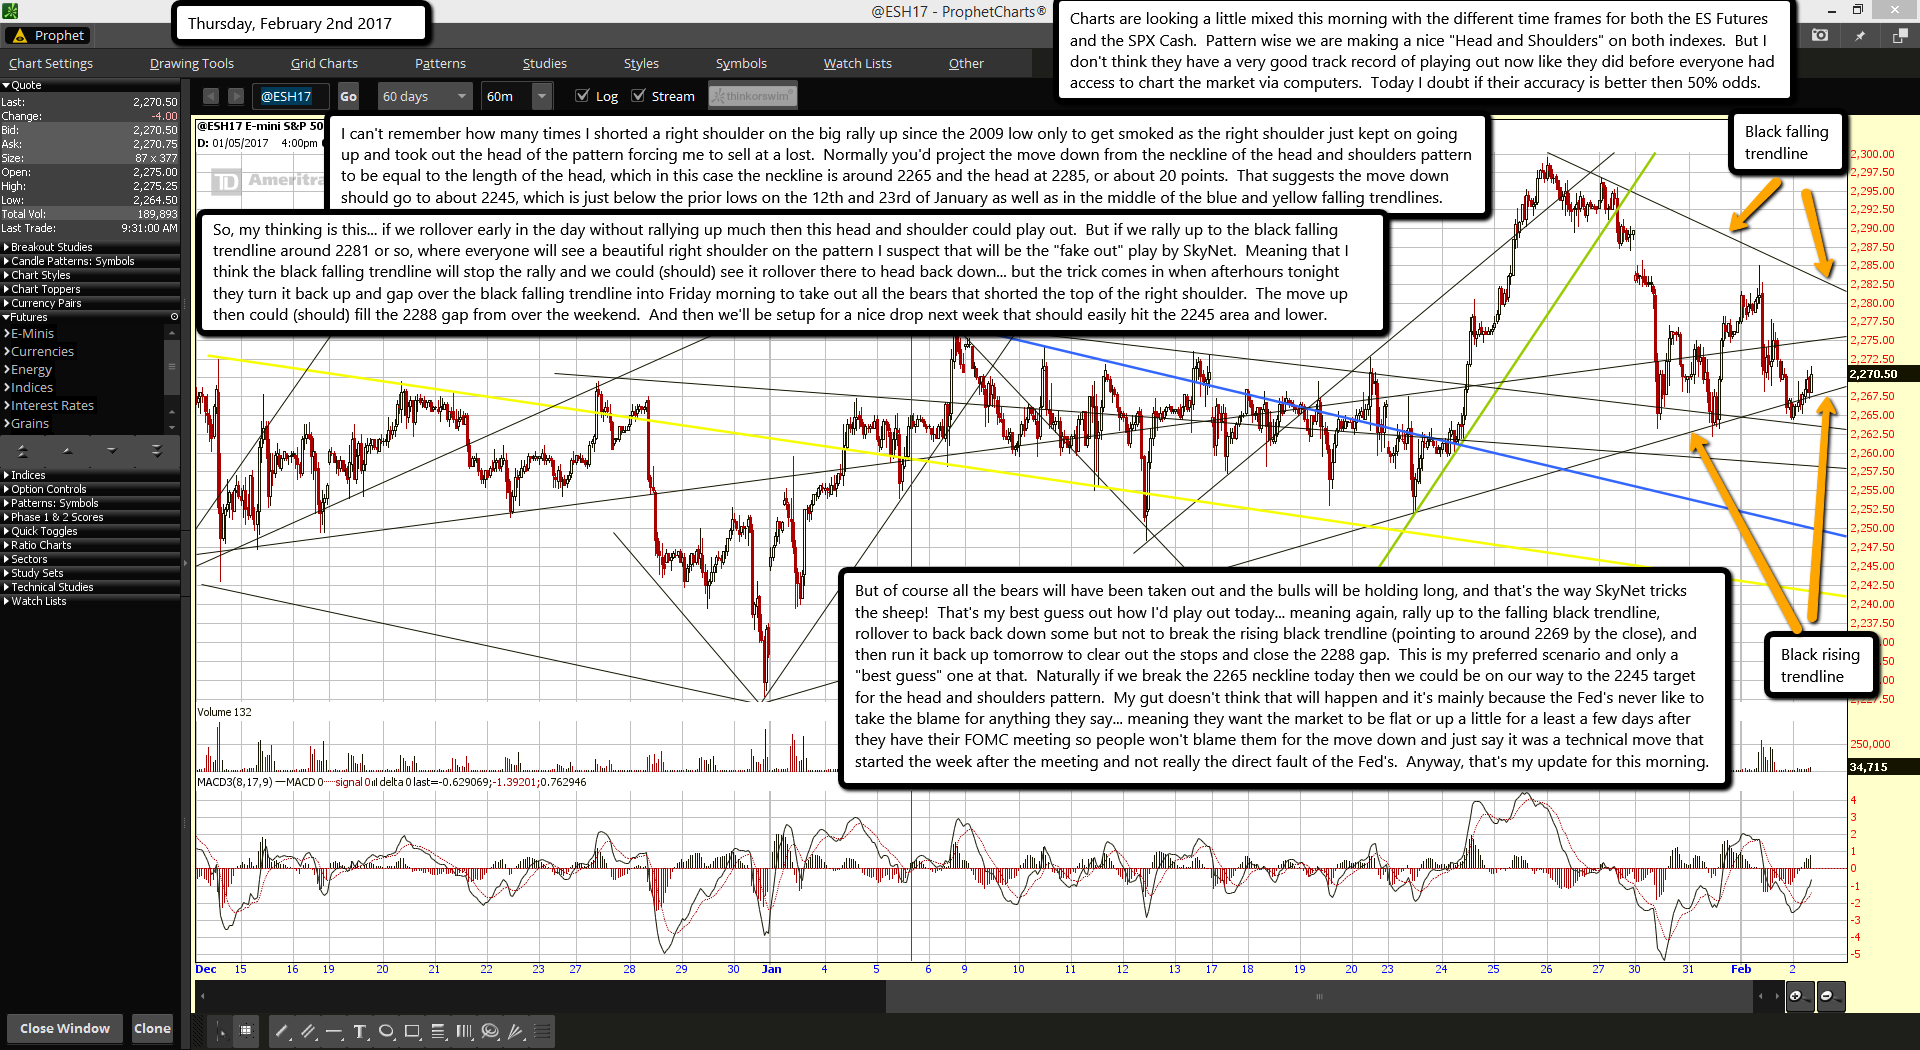
Charts are looking a little mixed this morning with the different time frames for both the ES Futures and the SPX Cash.  Pattern wise we are making a nice "Head and Shoulders" on both indexes.  But I don't think they have a very good track record of playing out now like they did before everyone had access to chart the market via computers.  Today I doubt if their accuracy is better then 50% odds.

I can't remember how many times I shorted a right shoulder on the big rally up since the 2009 low only to get smoked as the right shoulder just kept on going up and took out the head of the pattern forcing me to sell at a lost.  Normally you'd project the move down from the neckline of the head and shoulders pattern to be equal to the length of the head, which in this case the neckline is around 2265 and the head at 2285, or about 20 points.  That suggests the move down should go to about 2245, which is just below the prior lows on the 12th and 23rd of January as well as in the middle of the blue and yellow falling trendlines.

So, my thinking is this... if we rollover early in the day without rallying up much then this head and shoulder could play out.  But if we rally up to the black falling trendline around 2281 or so, where everyone will see a beautiful right shoulder on the pattern I suspect that will be the "fake out" play by SkyNet.  Meaning that I think the black falling trendline will stop the rally and we could (should) see it rollover there to head back down... but the trick comes in when afterhours tonight they turn it back up and gap over the black falling trendline into Friday morning to take out all the bears that shorted the top of the right shoulder.  The move up then could (should) fill the 2288 gap from over the weekend.  And then we'll be setup for a nice drop next week that should easily hit the 2245 area and lower.

But of course all the bears will have been taken out and the bulls will be holding long, and that's the way SkyNet tricks the sheep!  That's my best guess out how I'd play out today... meaning again, rally up to the falling black trendline, rollover to back back down some but not to break the rising black trendline (pointing to around 2269 by the close), and then run it back up tomorrow to clear out the stops and close the 2288 gap.  This is my preferred scenario and only a "best guess" one at that.  Naturally if we break the 2265 neckline today then we could be on our way to the 2245 target for the head and shoulders pattern.  My gut doesn't think that will happen and it's mainly because the Fed's never like to take the blame for anything they say... meaning they want the market to be flat or up a little for a least a few days after they have their FOMC meeting so people won't blame them for the move down and just say it was a technical move that started the week after the meeting and not really the direct fault of the Fed's.  Anyway, that's my update for this morning.

ES Morning Update February 1st, 2017

0

605796a0-b8dd-4911-923d-f5aadeef952b

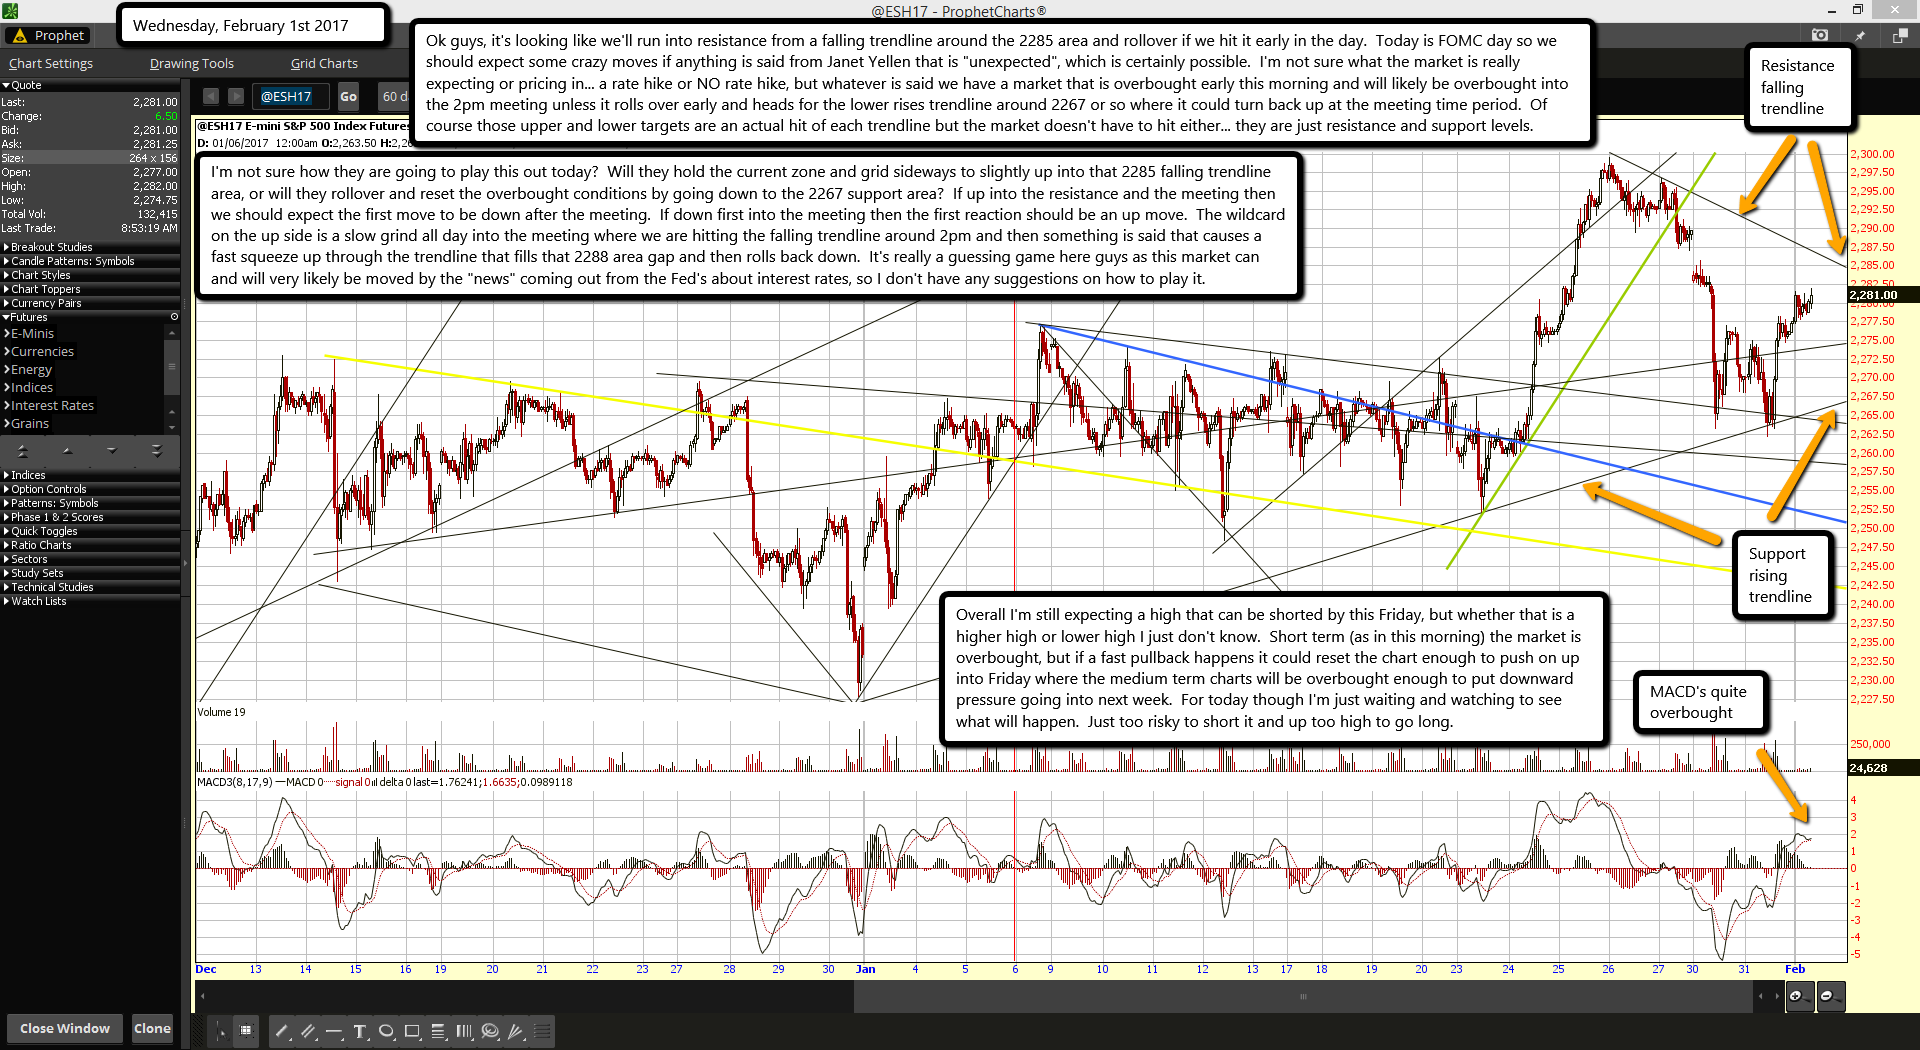
Ok guys, it's looking like we'll run into resistance from a falling trendline around the 2285 area and rollover if we hit it early in the day.  Today is FOMC day so we should expect some crazy moves if anything is said from Janet Yellen that is "unexpected", which is certainly possible.  I'm not sure what the market is really expecting or pricing in... a rate hike or NO rate hike, but whatever is said we have a market that is overbought early this morning and will likely be overbought into the 2pm meeting unless it rolls over early and heads for the lower rises trendline around 2267 or so where it could turn back up at the meeting time period.  Of course those upper and lower targets are an actual hit of each trendline but the market doesn't have to hit either... they are just resistance and support levels.

I'm not sure how they are going to play this out today?  Will they hold the current zone and grid sideways to slightly up into that 2285 falling trendline area, or will they rollover and reset the overbought conditions by going down to the 2267 support area?  If up into the resistance and the meeting then we should expect the first move to be down after the meeting.  If down first into the meeting then the first reaction should be an up move.  The wildcard on the up side is a slow grind all day into the meeting where we are hitting the falling trendline around 2pm and then something is said that causes a fast squeeze up through the trendline that fills that 2288 area gap and then rolls back down.  It's really a guessing game here guys as this market can and will very likely be moved by the "news" coming out from the Fed's about interest rates, so I don't have any suggestions on how to play it.

Overall I'm still expecting a high that can be shorted by this Friday, but whether that is a higher high or lower high I just don't know.  Short term (as in this morning) the market is overbought, but if a fast pullback happens it could reset the chart enough to push on up into Friday where the medium term charts will be overbought enough to put downward pressure going into next week.  For today though I'm just waiting and watching to see what will happen.  Just too risky to short it and up too high to go long.

ES Morning Update January 31st, 2017

0

2208cd0d-c917-4c88-8f66-d804f35b8611

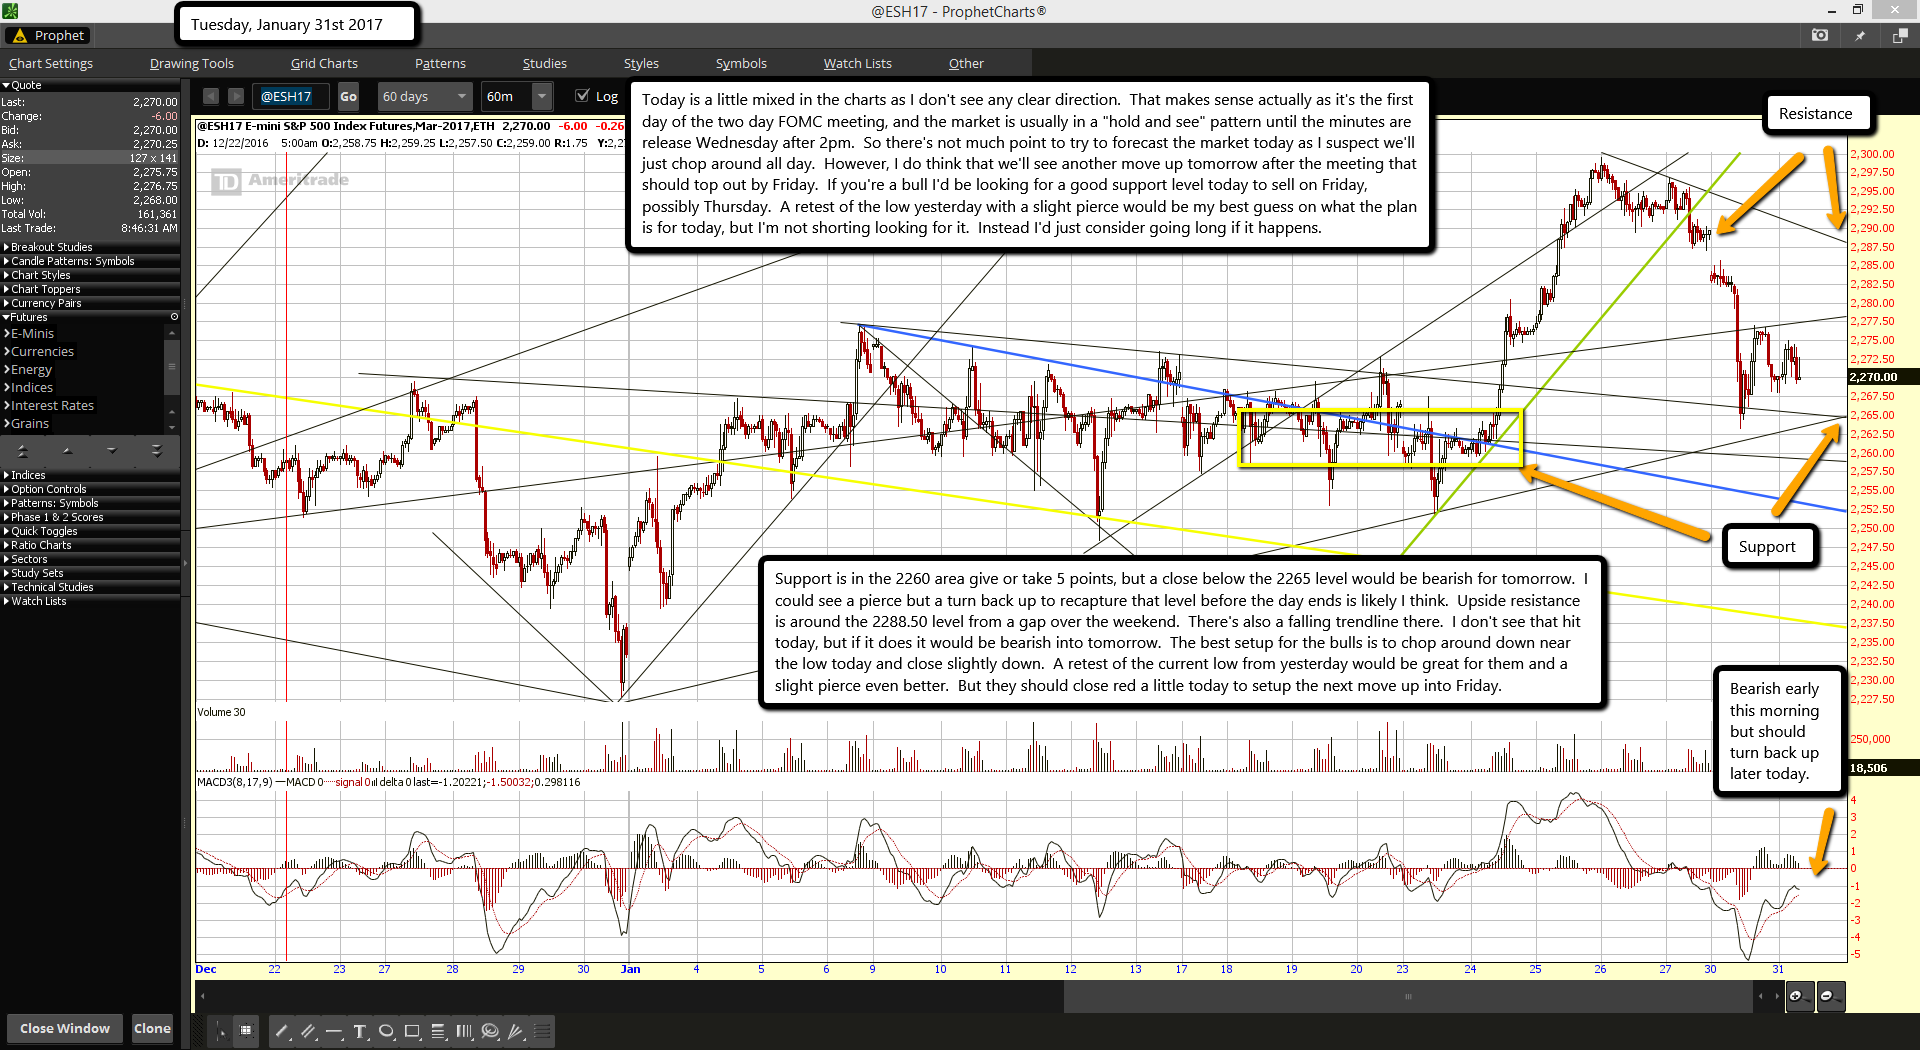
Today is a little mixed in the charts as I don't see any clear direction. That makes sense actually as it's the first day of the two day FOMC meeting, and the market is usually in a "hold and see" pattern until the minutes are release Wednesday after 2pm. So there's not much point to try to forecast the market today as I suspect we'll just chop around all day. However, I do think that we'll see another move up tomorrow after the meeting that should top out by Friday. If you're a bull I'd be looking for a good support level today to sell on Friday, possibly Thursday. A retest of the low yesterday with a slight pierce would be my best guess on what the plan is for today, but I'm not shorting looking for it. Instead I'd just consider going long if it happens.

Support is in the 2260 area give or take 5 points, but a close below the 2265 level would be bearish for tomorrow. I could see a pierce but a turn back up to recapture that level before the day ends is likely I think. Upside resistance is around the 2288.50 level from a gap over the weekend. There's also a falling trendline there. I don't see that hit today, but if it does it would be bearish into tomorrow. The best setup for the bulls is to chop around down near the low today and close slightly down. A retest of the current low from yesterday would be great for them and a slight pierce even better. But they should close red a little today to setup the next move up into Friday.

ES Morning Update January 30th, 2017

0

87ec082b-bfa4-4592-af4b-643f7113910c

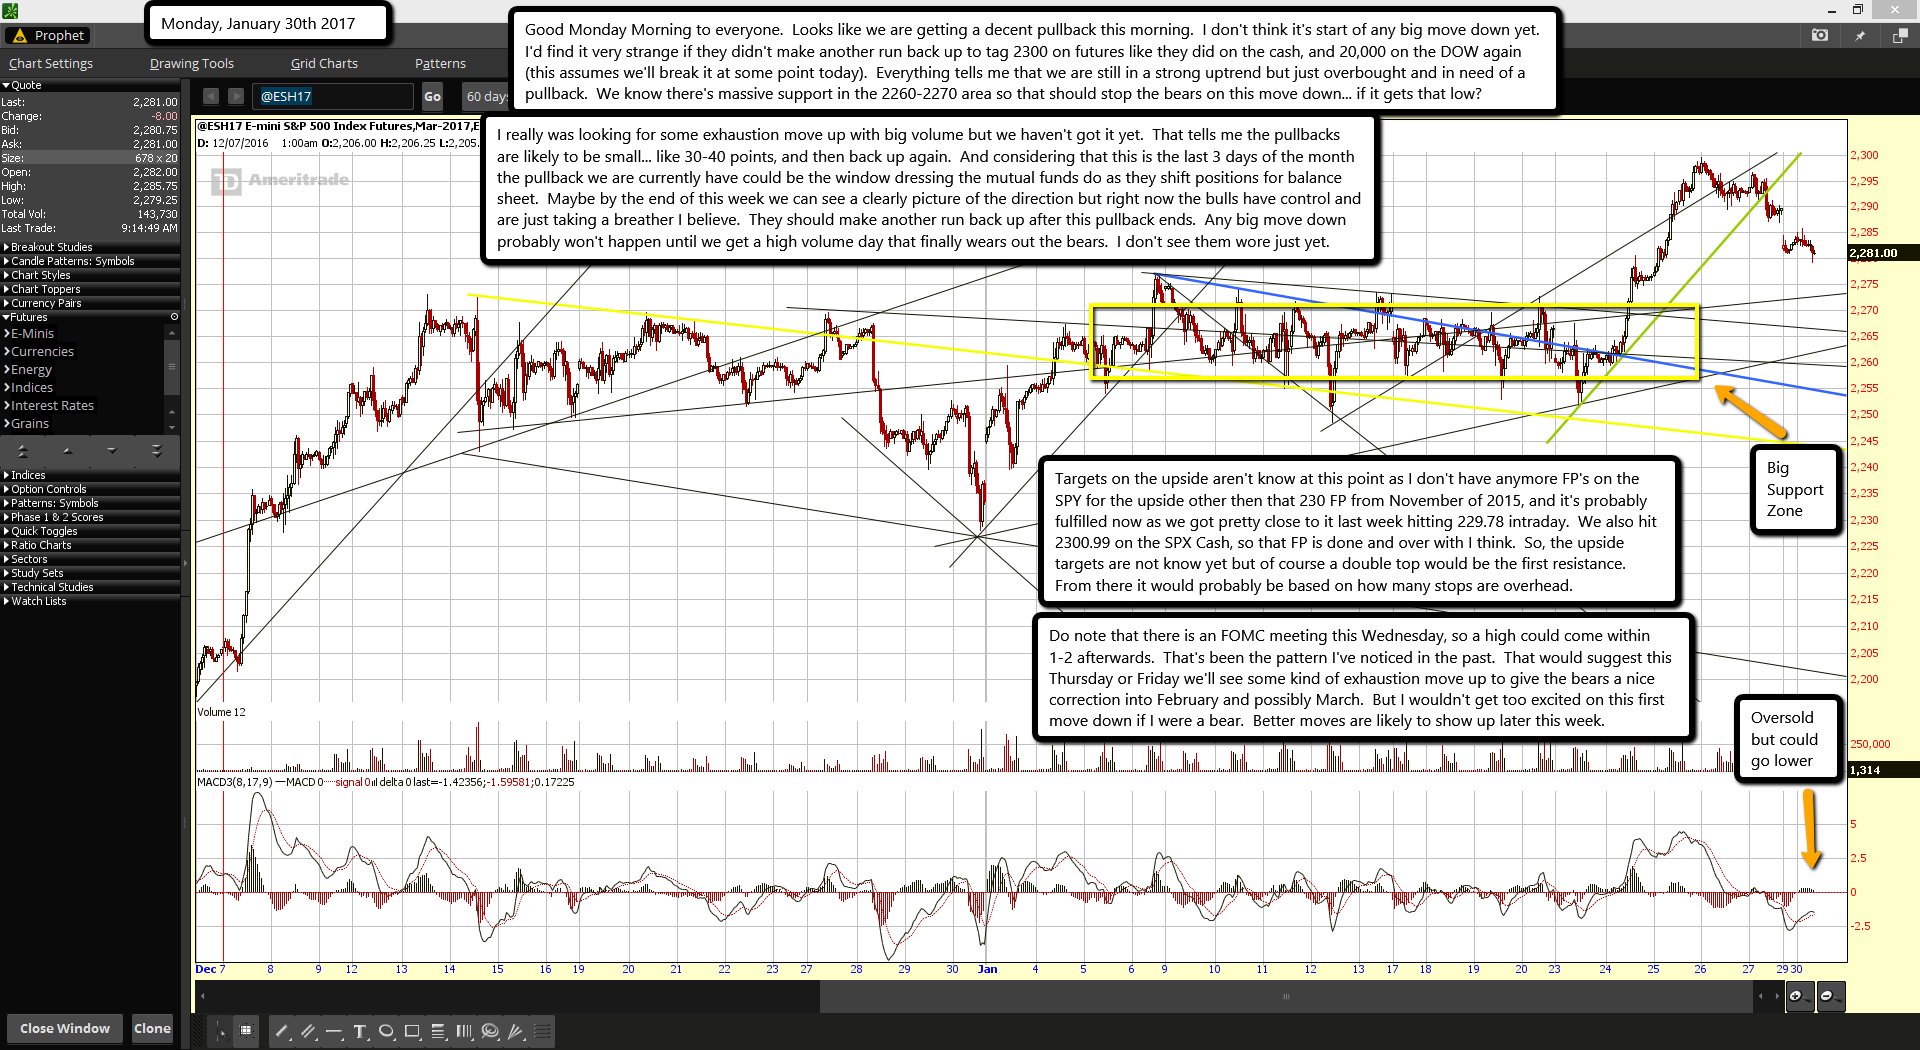
Good Monday Morning to everyone.  Looks like we are getting a decent pullback this morning.  I don't think it's start of any big move down yet.  I'd find it very strange if they didn't make another run back up to tag 2300 on futures like they did on the cash, and 20,000 on the DOW again (this assumes we'll break it at some point today).  Everything tells me that we are still in a strong uptrend but just overbought and in need of a pullback.  We know there's massive support in the 2260-2270 area so that should stop the bears on this move down... if it gets that low?

I really was looking for some exhaustion move up with big volume but we haven't got it yet.  That tells me the pullbacks are likely to be small... like 30-40 points, and then back up again.  And considering that this is the last 3 days of the month the pullback we are currently have could be the window dressing the mutual funds do as they shift positions for balance sheet.  Maybe by the end of this week we can see a clearly picture of the direction but right now the bulls have control and are just taking a breather I believe.  They should make another run back up after this pullback ends.  Any big move down probably won't happen until we get a high volume day that finally wears out the bears.  I don't see them wore just yet.

Targets on the upside aren't know at this point as I don't have anymore FP's on the SPY for the upside other then that 230 FP from November of 2015, and it's probably fulfilled now as we got pretty close to it last week hitting 229.78 intraday.  We also hit 2300.99 on the SPX Cash, so that FP is done and over with I think.  So, the upside targets are not know yet but of course a double top would be the first resistance.  From there it would probably be based on how many stops are overhead.

Do note that there is an FOMC meeting this Wednesday, so a high could come within 1-2 afterwards.  That's been the pattern I've noticed in the past.  That would suggest this Thursday or Friday we'll see some kind of exhaustion move up to give the bears a nice correction into February and possibly March.  But I wouldn't get too excited on this first move down if I were a bear.  Better moves are likely to show up later this week.

ES Morning Update January 27th, 2017

0

b8155c81-e3ce-41ac-bf88-78694d479ffb

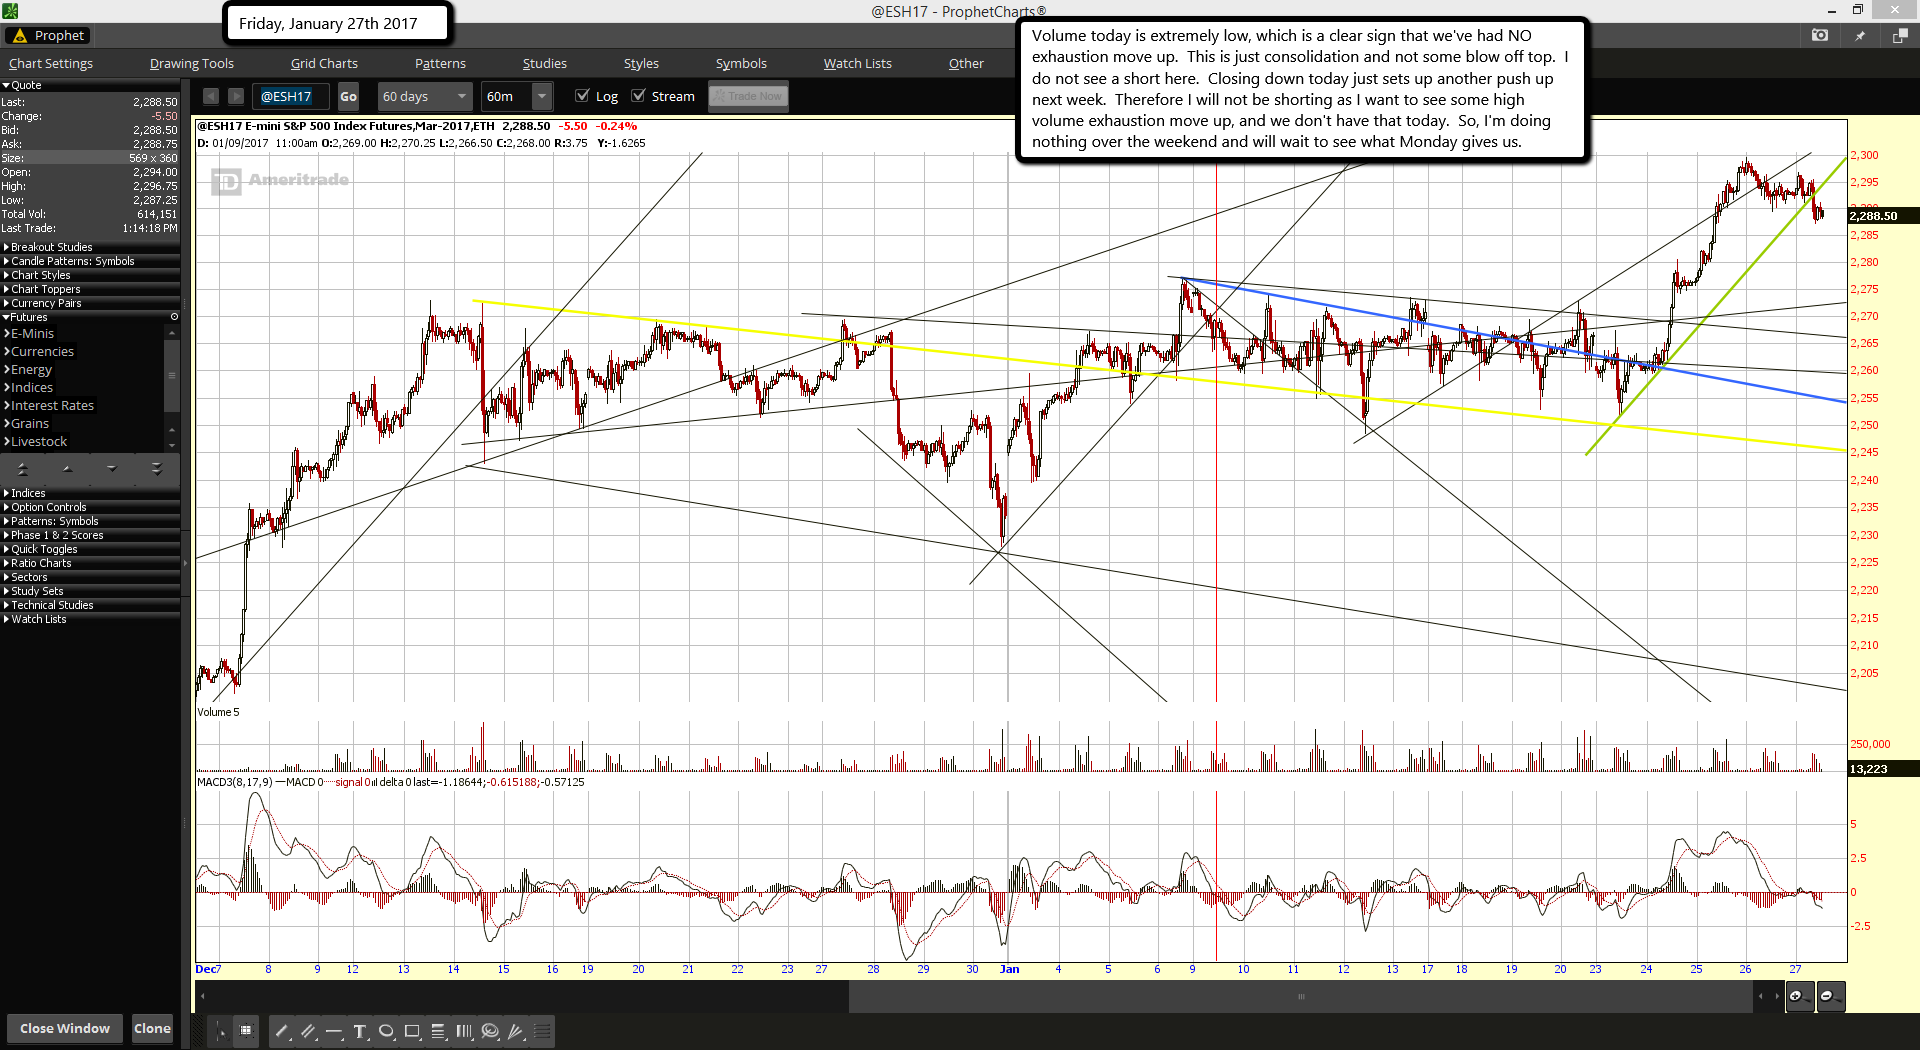
Volume today is extremely low, which is a clear sign that we've had NO exhaustion move up.  This is just consolidation and not some blow off top.  I do not see a short here.  Closing down today just sets up another push up next week.  Therefore I will not be shorting as I want to see some high volume exhaustion move up, and we don't have that today.  So, I'm doing nothing over the weekend and will wait to see what Monday gives us.

ES Morning Update January 26th, 2017

0

bc884dea-fe70-4e2a-acab-e6ff8d4231e6

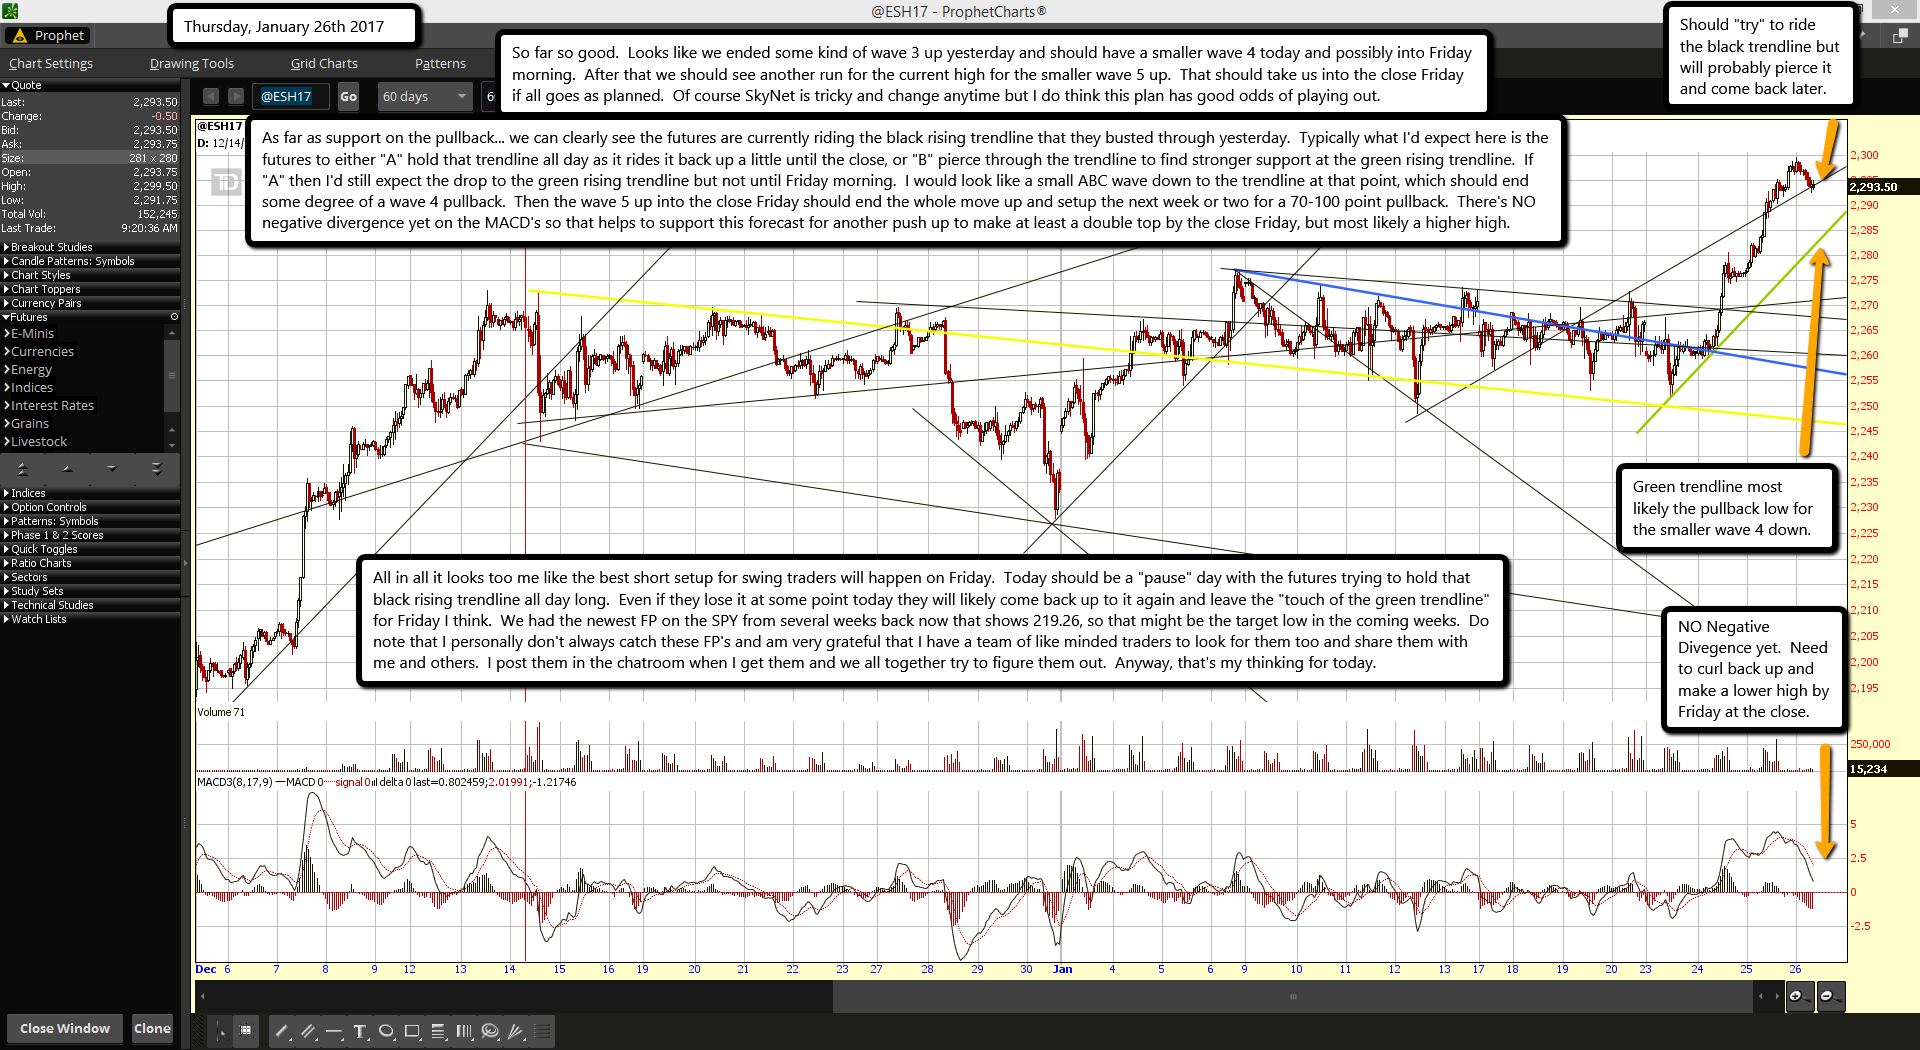
So far so good.  Looks like we ended some kind of wave 3 up yesterday and should have a smaller wave 4 today and possibly into Friday morning.  After that we should see another run for the current high for the smaller wave 5 up.  That should take us into the close Friday if all goes as planned.  Of course SkyNet is tricky and change anytime but I do think this plan has good odds of playing out.

As far as support on the pullback... we can clearly see the futures are currently riding the black rising trendline that they busted through yesterday.  Typically what I'd expect here is the futures to either "A" hold that trendline all day as it rides it back up a little until the close, or "B" pierce through the trendline to find stronger support at the green rising trendline.  If "A" then I'd still expect the drop to the green rising trendline but not until Friday morning.  I would look like a small ABC wave down to the trendline at that point, which should end some degree of a wave 4 pullback.  Then the wave 5 up into the close Friday should end the whole move up and setup the next week or two for a 70-100 point pullback.  There's NO negative divergence yet on the MACD's so that helps to support this forecast for another push up to make at least a double top by the close Friday, but most likely a higher high.

All in all it looks too me like the best short setup for swing traders will happen on Friday.  Today should be a "pause" day with the futures trying to hold that black rising trendline all day long.  Even if they lose it at some point today they will likely come back up to it again and leave the "touch of the green trendline" for Friday I think.  We had the newest FP on the SPY from several weeks back now that shows 219.26, so that might be the target low in the coming weeks.  Do note that I personally don't always catch these FP's and am very grateful that I have a team of like minded traders to look for them too and share them with me and others.  I post them in the chatroom when I get them and we all together try to figure them out.  Anyway, that's my thinking for today.

ES Morning Update January 25th, 2017

0

b3ab7e3b-fa1b-4ab6-a2ce-e45aeeb7504a

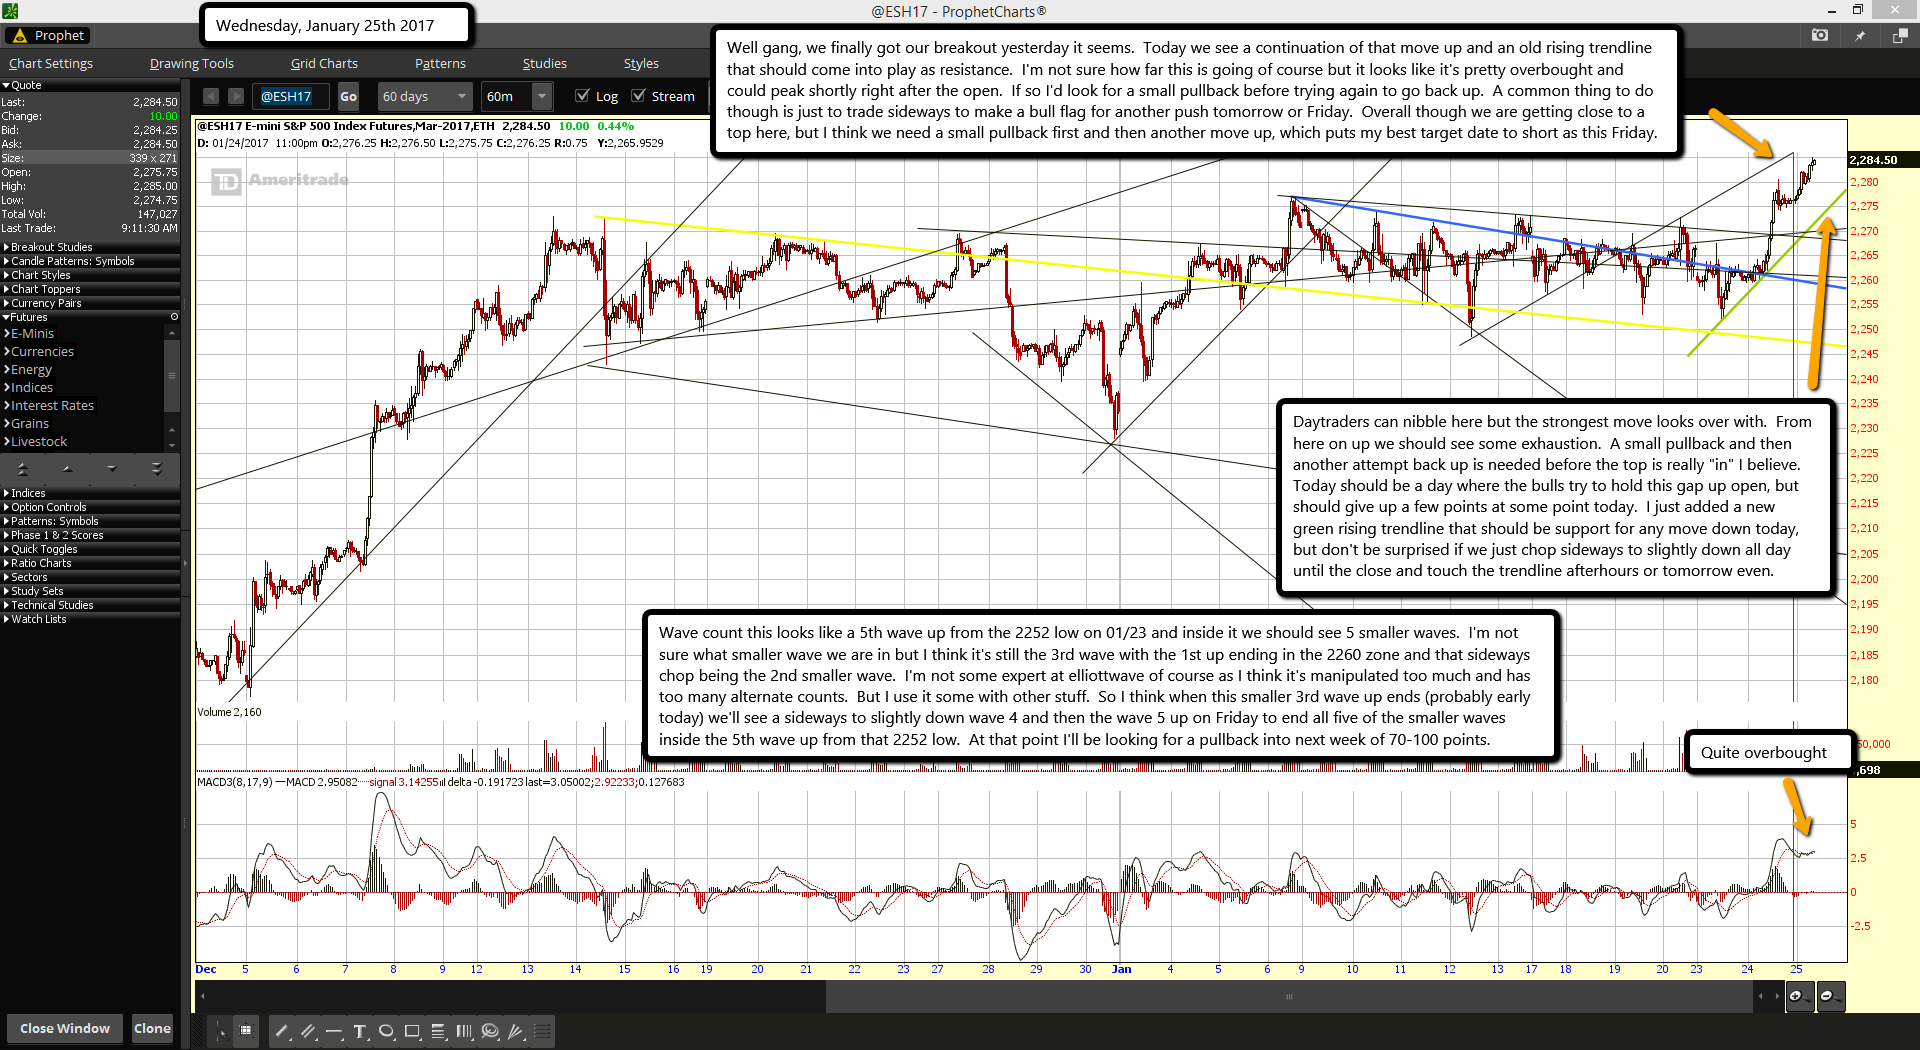
Well gang, we finally got our breakout yesterday it seems.  Today we see a continuation of that move up and an old rising trendline that should come into play as resistance.  I'm not sure how far this is going of course but it looks like it's pretty overbought and could peak shortly right after the open.  If so I'd look for a small pullback before trying again to go back up.  A common thing to do though is just to trade sideways to make a bull flag for another push tomorrow or Friday.  Overall though we are getting close to a top here, but I think we need a small pullback first and then another move up, which puts my best target date to short as this Friday.

Daytraders can nibble here but the strongest move looks over with.  From here on up we should see some exhaustion.  A small pullback and then another attempt back up is needed before the top is really "in" I believe.  Today should be a day where the bulls try to hold this gap up open, but should give up a few points at some point today.  I just added a new green rising trendline that should be support for any move down today, but don't be surprised if we just chop sideways to slightly down all day until the close and touch the trendline afterhours or tomorrow even.

Wave count this looks like a 5th wave up from the 2252 low on 01/23 and inside it we should see 5 smaller waves.  I'm not sure what smaller wave we are in but I think it's still the 3rd wave with the 1st up ending in the 2260 zone and that sideways chop being the 2nd smaller wave.  I'm not some expert at elliottwave of course as I think it's manipulated too much and has too many alternate counts.  But I use it some with other stuff.  So I think when this smaller 3rd wave up ends (probably early today) we'll see a sideways to slightly down wave 4 and then the wave 5 up on Friday to end all five of the smaller waves inside the 5th wave up from that 2252 low.  At that point I'll be looking for a pullback into next week of 70-100 points.

ES Morning Update January 24th, 2017

0

cf5707f1-c6e9-4c53-b897-d4809a96ee3a

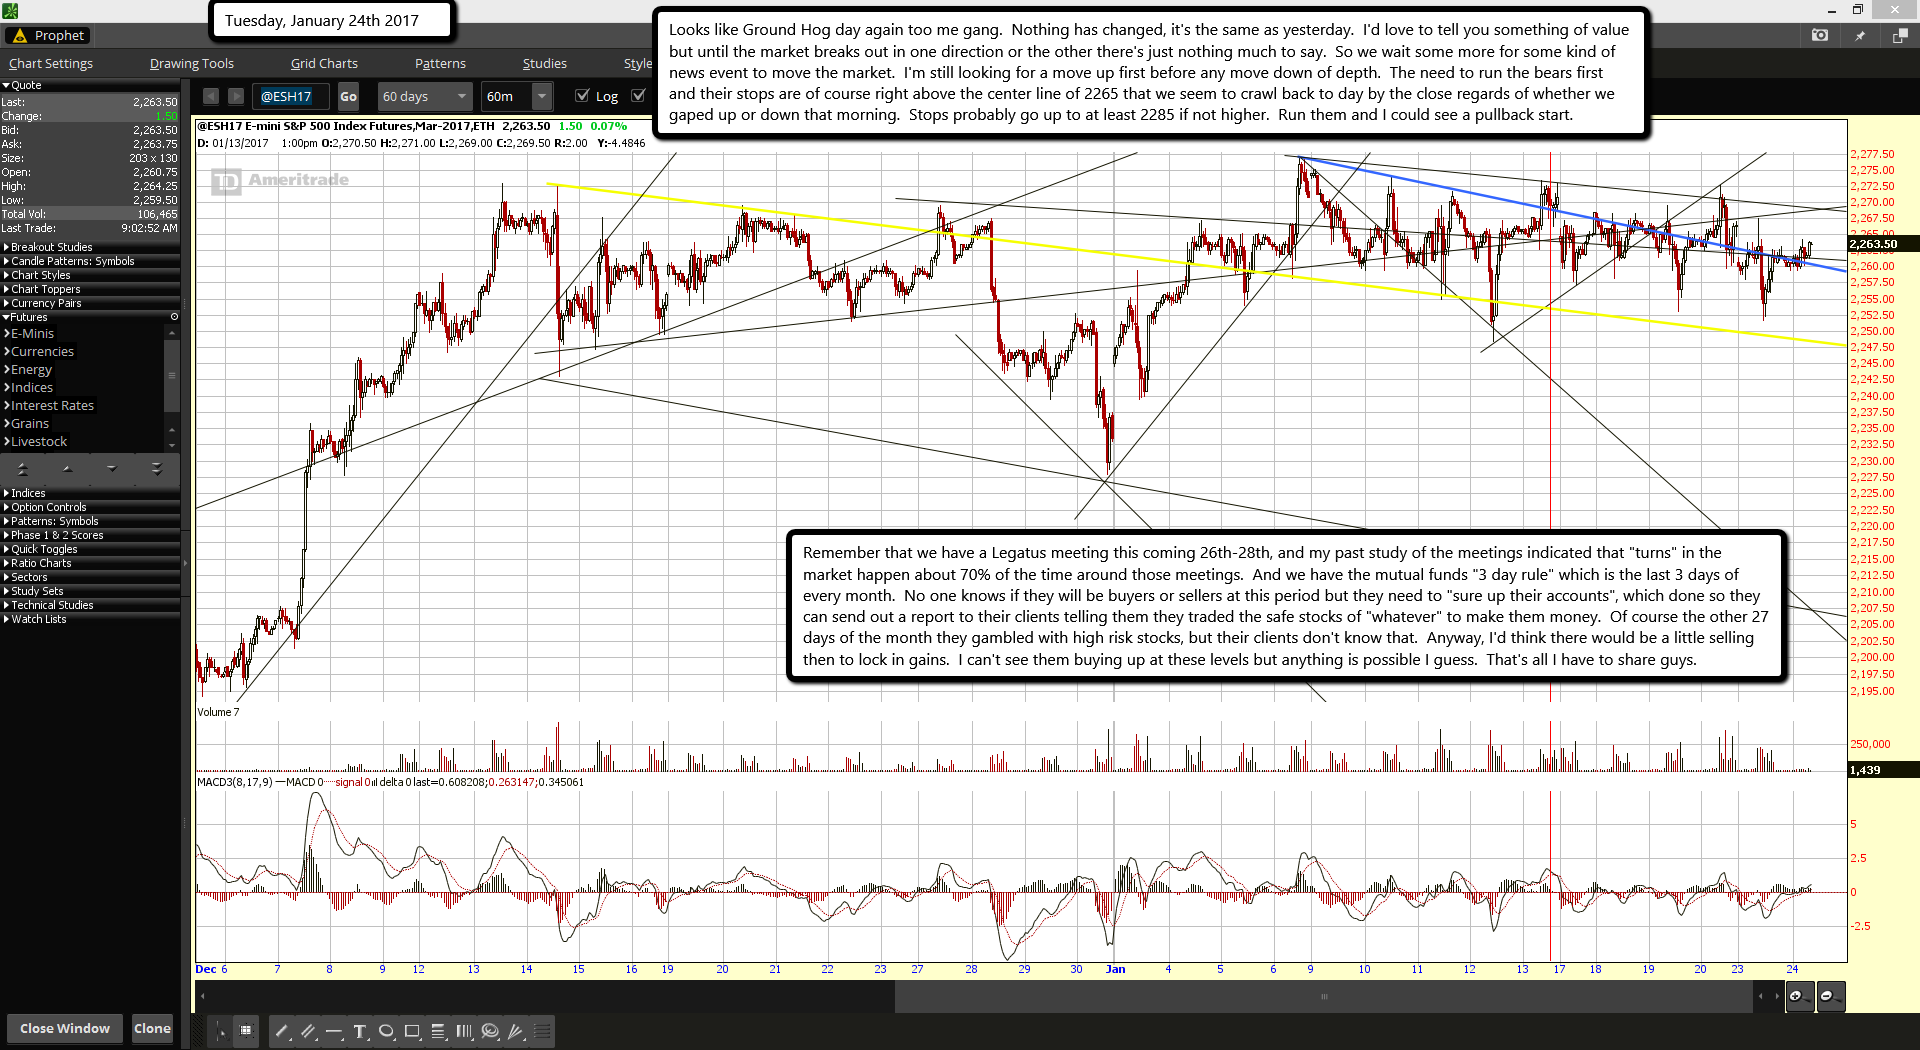
Looks like Ground Hog day again too me gang.  Nothing has changed, it's the same as yesterday.  I'd love to tell you something of value but until the market breaks out in one direction or the other there's just nothing much to say.  So we wait some more for some kind of news event to move the market.  I'm still looking for a move up first before any move down of depth.  The need to run the bears first and their stops are of course right above the center line of 2265 that we seem to crawl back to day by the close regards of whether we gaped up or down that morning.  Stops probably go up to at least 2285 if not higher.  Run them and I could see a pullback start.

Remember that we have a Legatus meeting this coming 26th-28th, and my past study of the meetings indicated that "turns" in the market happen about 70% of the time around those meetings.  And we have the mutual funds "3 day rule" which is the last 3 days of every month.  No one knows if they will be buyers or sellers at this period but they need to "sure up their accounts", which done so they can send out a report to their clients telling them they traded the safe stocks of "whatever" to make them money.  Of course the other 27 days of the month they gambled with high risk stocks, but their clients don't know that.  Anyway, I'd think there would be a little selling then to lock in gains.  I can't see them buying up at these levels but anything is possible I guess.  That's all I have to share guys.

ES Morning Update January 23rd, 2017

0

9a0c1947-6d2b-4f73-9f00-2da34d57e48b

Well guys, I'd love to tell something new but nothing has changed.  The market is still in a sideways chop pattern and has yet to breakout or breakdown.  It's dipped a few points this morning but there's no sign that this is going to be some big move down yet.  And every dip seems to be bought up as no one wants to sell yet I guess.  The only hope for the bears is probably going to be the last 3 days of the month when the mutual funds could do some selling to lock in some gains.  Other then that, today might just be another boring day.

It does have a bear flag on the futures so possibly we'll drop a little more today.  But I just can't see much right now.  If we revisit that 2253 low from 1/19 that would be the first support.  After that we have the 2248 low from 1/12 as support.  Basically I just don't see anything to give us any big move up or down yet.  If we drop to one of those support levels by the close today then I'd guess that we'll rally back up from that level on Tuesday.  However, keep in mind that the market has been repeatedly coming back to that 2265 level everyday by the close.  So it's more likely to see that happen versus a closing low at one of those support levels.  Overall this market is just in a pause mode as the bulls rest a bit and the bears sleep.  So it's still a "buy the dip" market until it's not... and I don't know when that is going to end.

ES Morning Update January 20th, 2017

0

c31d1287-79a2-4598-8bf3-58f12d474676

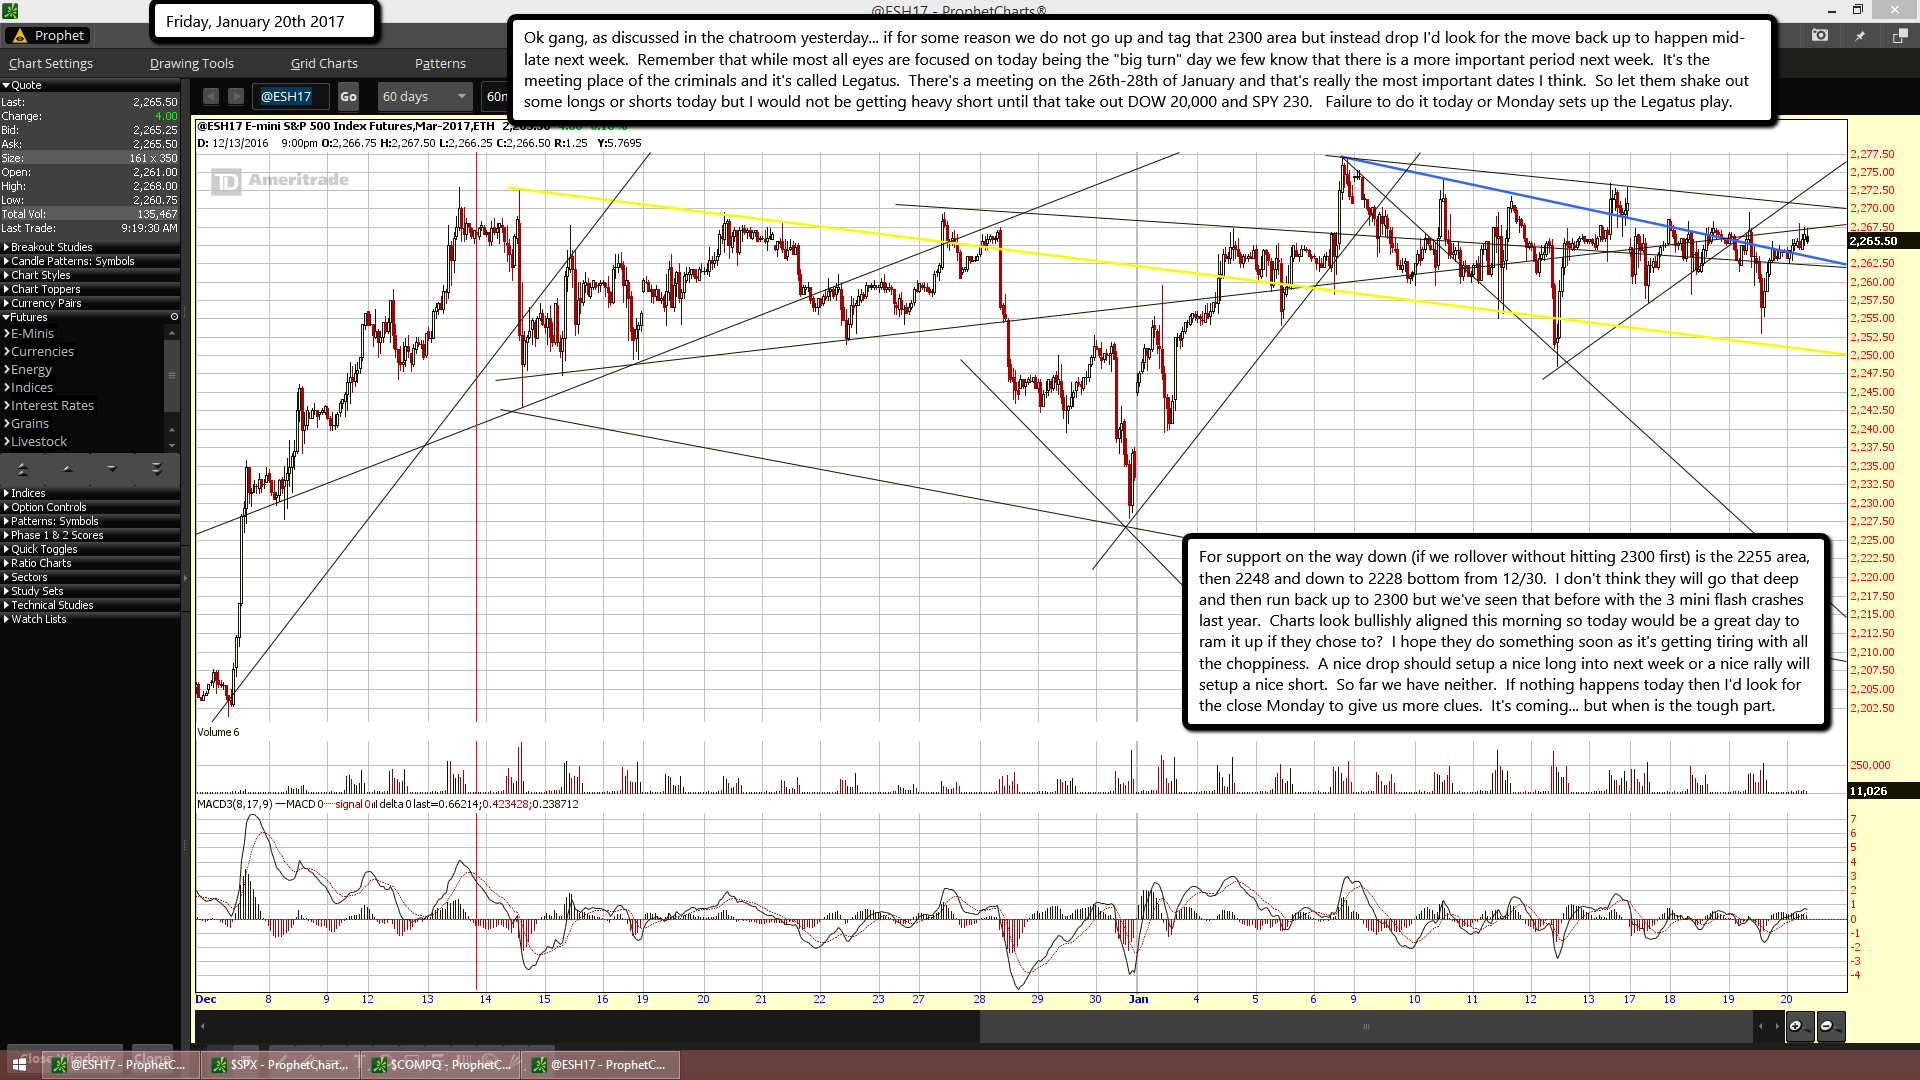
Ok gang, as discussed in the chatroom yesterday... if for some reason we do not go up and tag that 2300 area but instead drop I'd look for the move back up to happen mid-late next week.  Remember that while most all eyes are focused on today being the "big turn" day we few know that there is a more important period next week.  It's the meeting place of the criminals and it's called Legatus.  There's a meeting on the 26th-28th of January and that's really the most important dates I think.  So let them shake out some longs or shorts today but I would not be getting heavy short until that take out DOW 20,000 and SPY 230.   Failure to do it today or Monday sets up the Legatus play.

For support on the way down (if we rollover without hitting 2300 first) is the 2255 area, then 2248 and down to 2228 bottom from 12/30.  I don't think they will go that deep and then run back up to 2300 but we've seen that before with the 3 mini flash crashes last year.  Charts look bullishly aligned this morning so today would be a great day to ram it up if they chose to?  I hope they do something soon as it's getting tiring with all the choppiness.  A nice drop should setup a nice long into next week or a nice rally will setup a nice short.  So far we have neither.  If nothing happens today then I'd look for the close Monday to give us more clues.  It's coming... but when is the tough part.

ES Morning Update January 19th, 2017

0

dfd56ccd-0200-42a4-ac83-cc6a74b0bd90

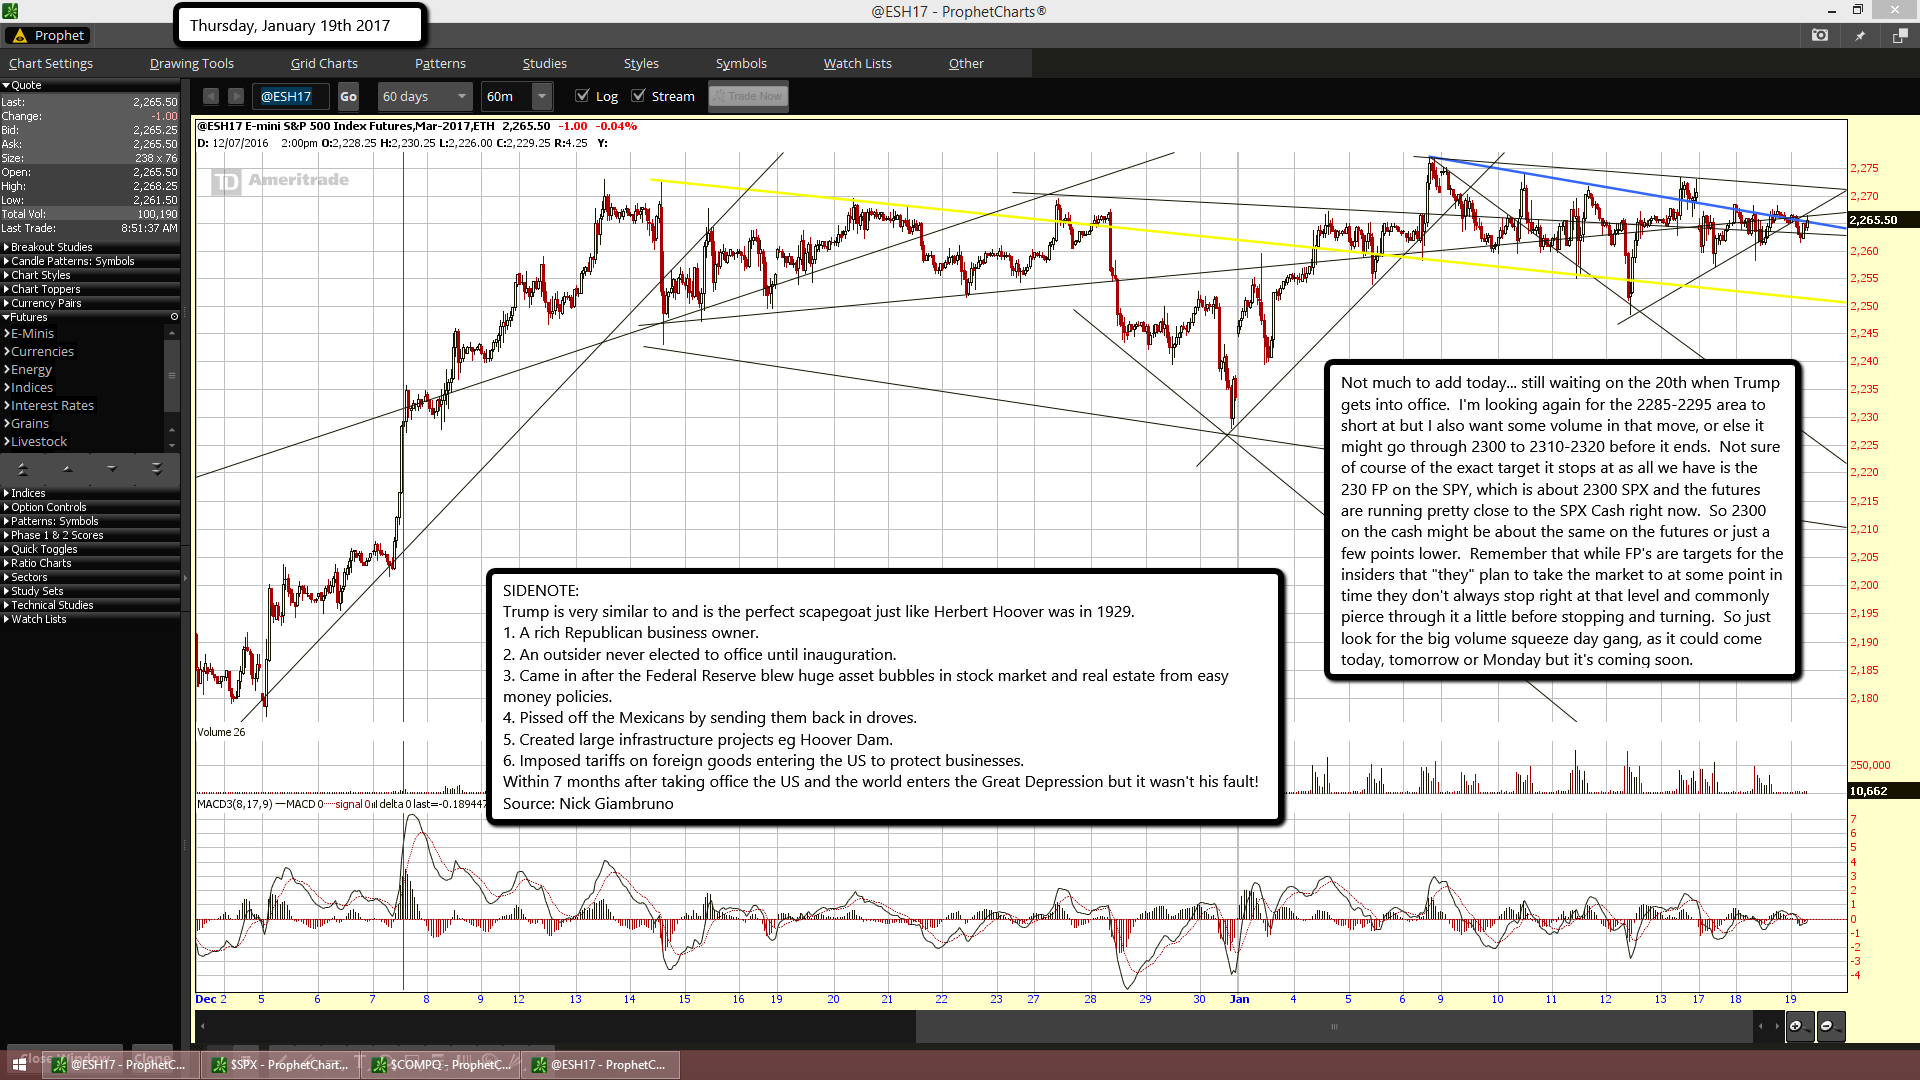
Not much to add today... still waiting on the 20th when Trump gets into office.  I'm looking again for the 2285-2295 area to short at but I also want some volume in that move, or else it might go through 2300 to 2310-2320 before it ends.  Not sure of course of the exact target it stops at as all we have is the 230 FP on the SPY, which is about 2300 SPX and the futures are running pretty close to the SPX Cash right now.  So 2300 on the cash might be about the same on the futures or just a few points lower.  Remember that while FP's are targets for the insiders that "they" plan to take the market to at some point in time they don't always stop right at that level and commonly pierce through it a little before stopping and turning.  So just look for the big volume squeeze day gang, as it could come today, tomorrow or Monday but it's coming soon.

SIDENOTE:

Trump is very similar to and is the perfect scapegoat just like Herbert Hoover was in 1929.
1. A rich Republican business owner.
2. An outsider never elected to office until inauguration.
3. Came in after the Federal Reserve blew huge asset bubbles in stock market and real estate from easy money policies.
4. Pissed off the Mexicans by sending them back in droves.
5. Created large infrastructure projects eg Hoover Dam.
6. Imposed tariffs on foreign goods entering the US to protect businesses.
Within 7 months after taking office the US and the world enters the Great Depression but it wasn't his fault!
Source: Nick Giambruno

ES Morning Update January 18th, 2017

0

9a1935ff-e158-4044-9a67-56bd2edc1de9

Looks like we made that right shoulder yesterday and rallied up from it into this morning.  I'm still not expecting some huge move up today as we are 2 days away from the 20th when Trump takes office.  It's pretty clear that the market is waiting on that event so until then it's likely to stay rangebound again today.

The MACD is around the zero level which gives me little clues to the direction.  I think it will grind up a little early in the day and rollover a little later in the day.  Overall though the price level is probably not going to change much.  Maybe up 4-5 points to down 4-5 points?  Just a whole lot of nothing I guess?

The forecast for today... same as it was yesterday.  LOL!  Basically I'm still waiting on the Trump breakout this Friday to look for a short.  Since I'm not too much into daytrading (I do from time to time, but rarely... especially when the range is so tight) I'm not doing anything until I see a better opportunity.

ES Morning Update January 17th, 2017

0

3cd9662c-d692-4963-9b44-14a7315ab6e7

Hope everyone had a nice holiday.  Now it's back to the grind it seems.  But fear not as the market doesn't look like it's going to do much until it's closer to the 20th when they swear in Trump as president.  So from now until then I'm not expecting much downside or upside.  Of course I don't know the exact day they will breakout to the upside and tag that 2300 level (or get really close?) but it's acting like it wants to do on Friday and use the "news" of the new president as the reason for the rally.  If it happens before then I'm ok with that too as I'm just looking for a good short entry and once the bears' that are short over the current zone (about 2260-2270) get taken out then the market should be ready for a nice correction into February.

On the short term we have a nice little move down this morning already in process.  Possibly this is to make a right shoulder of an inverted head and shoulders pattern?  The head is of course at that 2250 area low on the 12th and the left shoulder around 2255 from the 11th.  If this move down takes out the head then the pattern has failed and we'll look for something else.  But right now I don't see it as this appears to be just a small pullback to reset the overbought short term charts before another move back up.  It might take awhile for the bottom to form today but we should be turning back up at some point.  I would not play it unless I see this 60 minute charts get oversold (it NOT) and the 2260 (maybe the 2255?) area hold.  I'm more inclined to sit on my hands today and see what happens.  The charts are overbought and this move down should be happening.  There's currently NO sign of the MACD's turning back up.  Therefore I don't go long.  I'd rather wait for the rally to end and short it.  I don't see myself doing much until then, and I expect this chop to continue until Friday.

ES Morning Update January 13th, 2017

0

97e9bad0-1d23-4501-b724-809b25ec37af

Welcome to Friday the 13th!  A day where freaky things can happen.  Unfortunately I don't see much happening the market this morning, so I guess it will have to happen outside of our playground.  There's nothing much to add this morning that hasn't been said already.  Yesterday had a nice drop for what was probably some kind of C wave down and then we rallied the rest of the day.  I was slightly bullish but never took any position.  Got that call wrong early on as it clearly went against my thoughts that we'd bounce up and down between about 2260-2270.

But if you would have slept through the day you would have been fine at the close as everything that was lost early on was recaptured later that day, closing around the same level we started off at.  This 2265 area has been a point of interest for over 2 weeks now, which makes it hard to make any forecasts when it's Ground Hog Day over and over again.  At some point soon we'll breakout to the upside or downside, but I honestly can't tell you "when" based on the charts as they are clearly bearish on the big picture (daily) but refuse to breakdown... or breakout.

This basically leaves one to guess on possible "days of importance" where news event can move the market, and/or FP's (fake prints) where the insiders are told where "they" plan to take the market to at some point in the future.  For the FP's we have the old one from November 13th, 2015 showing 230 on the SPY and the recent one from last week showing 219.26 (which never happened that day... hence the reason it's likely a FP signal for the insiders).

For days of importance, we of course have the 20th next week when Trump comes into office.  He will be 70 years, 7 months and 7 days old... which could refer to the old movie "Unstoppable" from a few years back with the runaway train that had the number 777 on it?  Maybe Trump is the unstoppable person?  Rituals are done all the time the market but I'm only one person that can't possibly catch them all.  After that we have the all important "Legatus" meeting where all the criminals that rule the world meet together to plan/agree/execute what dirty evil deeds they have on their agenda.

Of course they are never for the benefit of us sheep but always for their benefit.  Naturally this includes "turns" in the stock market but doesn't always mean that.  Sometimes it's just a plan to steal money outright like they did with the Cyprus bank robbery some years back.  Just demand payment on a loan to bankrupt the country and "BAM" you stole everything from them!  Anyway, it's hard too know what they have planned but I fully expect to see more of these quick "Flash Crashes" or "Limit Down" days this year... just like last year, only likely worst this time.

For the short term forecast... none.  There's no clear direction today that I can see.  I'm waiting on that 230 print or something clearer in the charts to show up.  Have a great weekend!

ES Morning Update January 12th, 2017

0

a57207bc-3a56-4d42-b3b2-0f29120504a8

After-hours yesterday there was a nice FP on the SPY showing 226.45 and low and behold it looks like we are going to open around that level... LOL!  Chart-wise the cash index looking slightly bullish today on the open but could delay any breakout move up for another day.  The "Full Stochastic" on the SPX Cash are overbought up near the 80 level and have backed down a little over the last few days.  However, they are trying to hook back up.  This supports the thought that they still might go up to that 2300 level before any real correction starts.  The MACD's are still drifting lower too from peaking just under the 30 level back in December.  The Histogram bars have come up from the -8 area to the -2 area, so there's still some room for them to hit zero where turns commonly happen.

Now the ES Futures are harder to read on the short term as they are mixed this morning but slightly bullish.  However, their daily chart looks similar to the SPX Cash index... bearish but could support another move up.  This is clearly a game of "plug the holes" for SkyNet as rotates around to support quick drops where the market wants to tank but has someone save it every day on each drop.  We all know the target is the 230 FP on the SPY as it was told to us back in November of 2015.  We also know the next downside target is the new FP from last week of 219.26 on the SPY.  The question of course is... "when"?  So people think the market will sell off in front of the January 20th swearing in of Trump but so far that hasn't happened.  There still another week left of course so we don't know yet if the correction will be before it or after it.

My thoughts are that we need a big volume up day to take out all the bears with stops overhead.  There's been almost 2 months of sideways action in the 2250-2275 area and a whole lot of stops could have accumulated 10-30 points over that zone.  Take them all out in one day (and hit the 230 SPY print) and I'm a mega-bear.  Otherwise we are just stuck in a range where the 2265 level seems to be the middle point and magnet that the futures go back to each day after going below it or above intraday.  That leaves the market available for day-traders only as most swing traders just can't seem to make a profit from such crazy moves.

Today's forecast... more of the same.  Wild moves up and down but it's looking more and more like we'll see some squeeze up to the 2300 area soon, whether that's today, tomorrow or Monday I just don't know?  Resistance is still overhead from the falling blue trendline around 2270 and support is at 2260... not a game I want to play.  I'm just a patient bear setting on my hands right now.

s2Member®