Sunday, July 26, 2026
Home Blog Page 69

ES Morning Update October 14th 2016

0

2df05099-d7b0-4c1d-a69a-6ab4460405c9

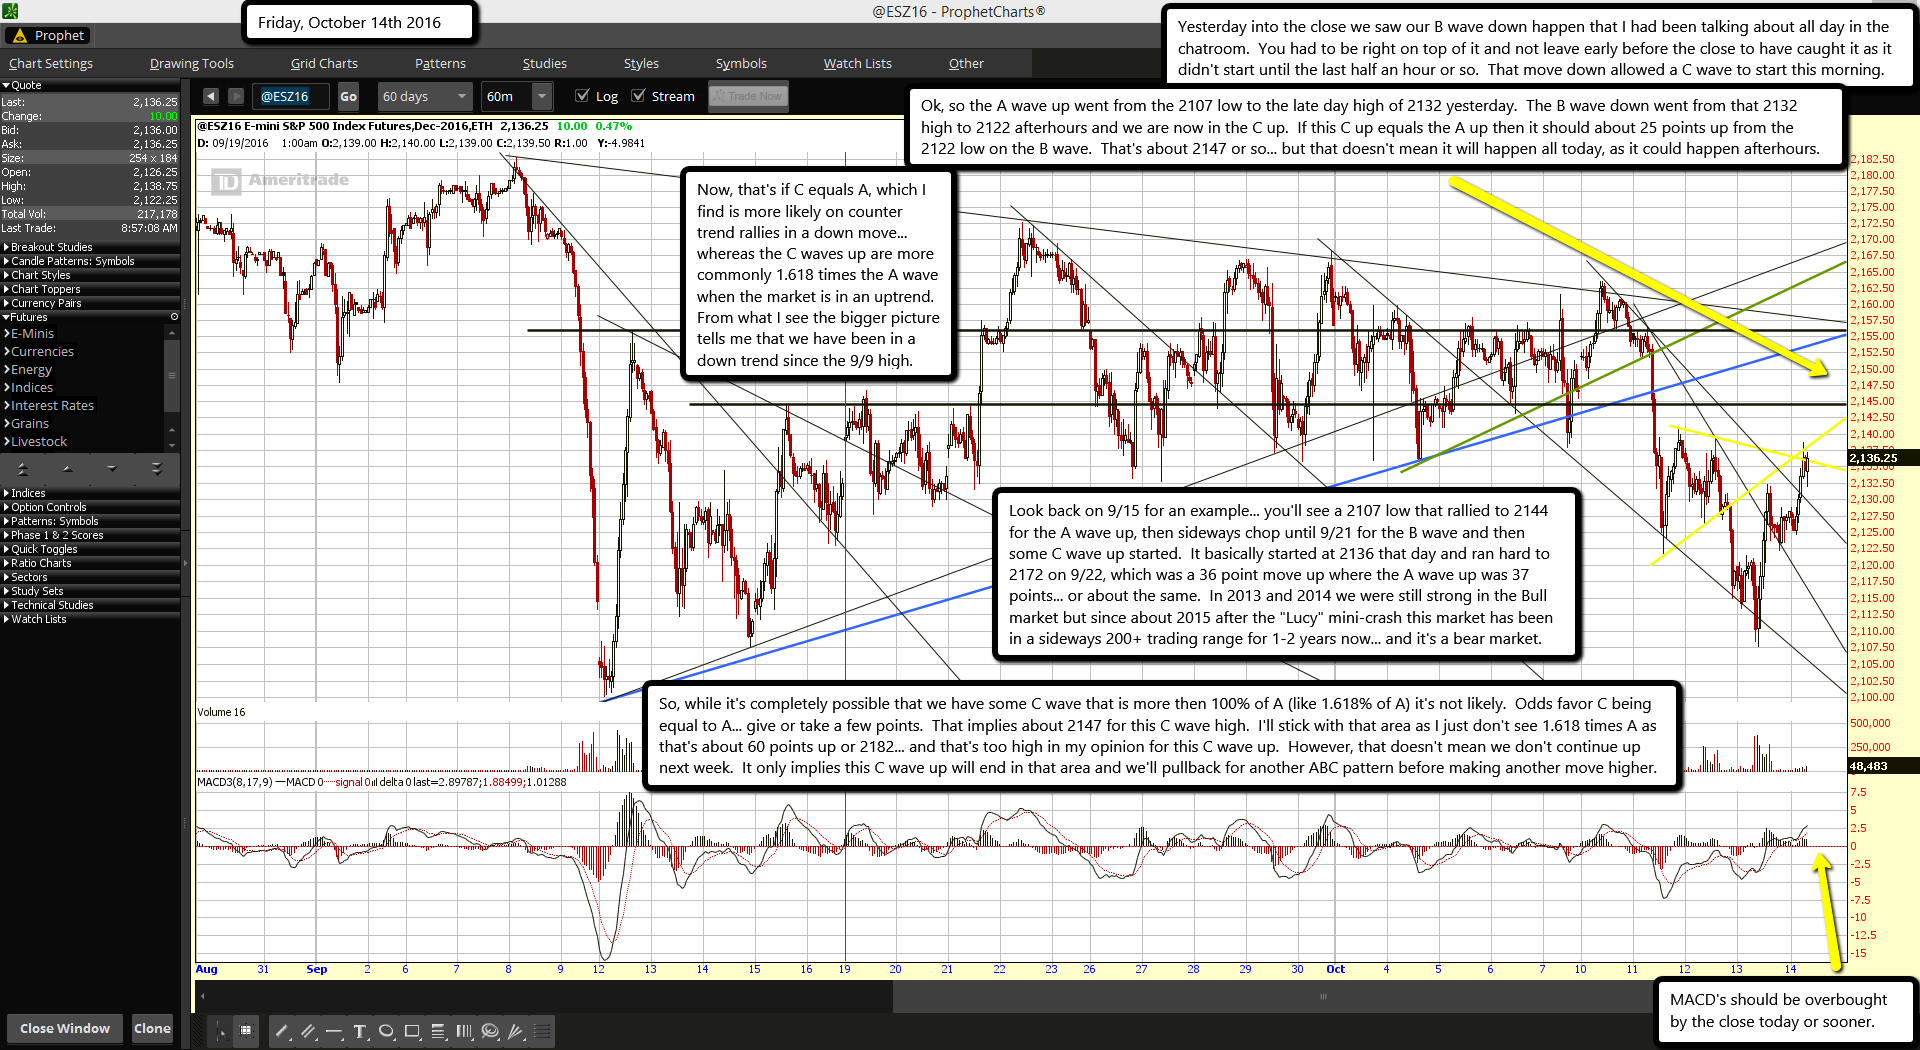
Yesterday into the close we saw our B wave down happen that I had been talking about all day in the chatroom.  You had to be right on top of it and not leave early before the close to have caught it as it didn't start until the last half an hour or so.  That move down allowed a C wave to start this morning.

Ok, so the A wave up went from the 2107 low to the late day high of 2132 yesterday.  The B wave down went from that 2132 high to 2122 afterhours and we are now in the C up.  If this C up equals the A up then it should about 25 points up from the 2122 low on the B wave.  That's about 2147 or so... but that doesn't mean it will happen all today, as it could happen afterhours.

Now, that's if C equals A, which I find is more likely on counter trend rallies in a down move... whereas the C waves up are more commonly 1.618 times the A wave when the market is in an uptrend.  From what I see the bigger picture tells me that we have been in a down trend since the 9/9 high.

Look back on 9/15 for an example... you'll see a 2107 low that rallied to 2144 for the A wave up, then sideways chop until 9/21 for the B wave and then some C wave up started.  It basically started at 2136 that day and ran hard to 2172 on 9/22, which was a 36 point move up where the A wave up was 37 points... or about the same.  In 2013 and 2014 we were still strong in the Bull market but since about 2015 after the "Lucy" mini-crash this market has been in a sideways 200+ trading range for 1-2 years now... and it's a bear market.

So, while it's completely possible that we have some C wave that is more then 100% of A (like 1.618% of A) it's not likely.  Odds favor C being equal to A... give or take a few points.  That implies about 2147 for this C wave high.  I'll stick with that area as I just don't see 1.618 times A as that's about 60 points up or 2182... and that's too high in my opinion for this C wave up.  However, that doesn't mean we don't continue up next week.  It only implies this C wave up will end in that area and we'll pullback for another ABC pattern before making another move higher.

Goldman Sachs wants to consolidate your credit card debt – is this a sign that a stock market crash is coming?

0
Traders work at the Goldman Sachs Group Inc. booth on the floor of the New York Stock Exchange (NYSE).

Goldman Sachs will begin lending money to regular people Thursday, after almost 150 years of avoiding them like the plague. The company that made its name as a banker to big business, government and the rich is launching Marcus, a new consumer finance business named after the bank's founder, Marcus Goldman.

The move has been long anticipated — last spring, Goldman hired an executive from credit card company Discover to lead the new consumer lending business. Since then, Goldman has gone on a hiring spree, plucking talent from the online lending company Lending Club and picking up a former Consumer Financial Protection Bureau official to make sure it stays out of trouble with the regulators.

The first offering from Marcus will be loans for consumers wanting to pay off their credit card debt. The loans, of up to $30,000, will come with fixed interest rates and terms of two to six years. The market for these credit card consolidation loans is highly competitive, and puts Goldman head to head with the biggest online "marketplace lenders" like Lending Club and Prosper. About 60% of Lending Club's loans, the company says, are for refinancing existing loans or paying off credit cards.

Marcus's annual rates will range from 6% to 23%, according to information published Thursday morning on its website. And while Goldman hasn't disclosed exactly how the loans will be underwritten, Marcus says in a disclosure that the rates will depend on borrowers' credit score, credit history, and how long the loan's term is. Marcus's website says that "only the most creditworthy applicants qualify for the lowest rates." Online lending businesses that offer relatively large unsecured loans traditionally target borrowers with good credit, so that they can offer lower rates than credit cards.

But Goldman has hinted that despite some similarities to how other online lenders work, it may have some distinct advantages.

Online lenders like Lending Club have to raise huge amounts of capital or borrow money from investors like hedge funds to be able to pay for all those loans they dish out to customers. Goldman happens to have plenty of money on hand, and can easily fund a consumer lending business. And unlike large banks, Goldman doesn't offer credit cards, meaning the conflict of offering both credit and a loan to pay it off isn't an issue.

At first, Goldman says the loans will be offered to "millions of prospective customers," who will receive an invite in the mail. (Despite being internet-based businesses, big online lenders are massive users of direct mail marketing). Stephen Scherr, the Goldman Sachs executive who heads up its chartered bank and is the company's chief strategy officer, said at a conference last month that Goldman would use a "conventional setup for customer acquisition."

According to the New York Times, the choice of the name Marcus name was the subject of "much internal discussion," and beat out "Samuel," which was the first name of Samuel Sachs, the bank's co-founder. The single first name, reminiscent of startup health insurer Oscar, online mattress retailer Casper or student debt refinancing company Earnest, is "intended to convey a tech-era trendiness from a company that is not known for its youthful bona fides," the Times reported.

"For many who manage debt payments on high-interest rate credit cards, a straightforward personal loan is a better solution," Marcus chief Harit Talwar said in a statement. "Marcus offers an option for consumers who are searching for a simpler alternative to credit card borrowing, where rates can change and multiple fees can be charged."

The lending business is not the company's only foray into Main Street banking. Goldman previously bought GE Capital's online consumer banking business, acquiring some 150,000 accounts and later relaunched and rebranded it as part of GS Bank in April. The bank acquired $8 billion worth of deposits and $8 billion of certificates of deposit as part of the deal, and has since added on some $3 billion more, Scherr said last month.


My thoughts...

If Goldman is now going to lend to the sheep (aka... us, the dumb public) then you know it's a sign that a major top in the stock market is coming soon as that's what happened with the real estate bubble in the end as well.  If you remember you couldn't qualify for crap back in 2002 without a perfect credit score, 5-10% down payment, 3-5 years at the same job (with tax returns... no "independent contractors"), but by 2005 that all changed.

You could walk in to a mortgage on a new home with no down payment, no tax returns, no proof a income, and a horrible credit score.  If you could fog a mirror you were approved.  Of course it topped out and ended around January of 2007 and then the stock market crashed later that year.

Clearly this is a major sign that Goldman is planning on pumping up the stock market for one final wave up of buying... but it will be the sheep buying it as Goldman Sucks sells into it.  They know the crash is coming and the exact date I'd bet.  But, I don't see this lasting 2 years like the real estate bubble did... instead I'd give it 6-9 months tops.

Red

ES Morning Update October 13th 2016

0

7113100a-3603-4646-8018-c1505392f0aa

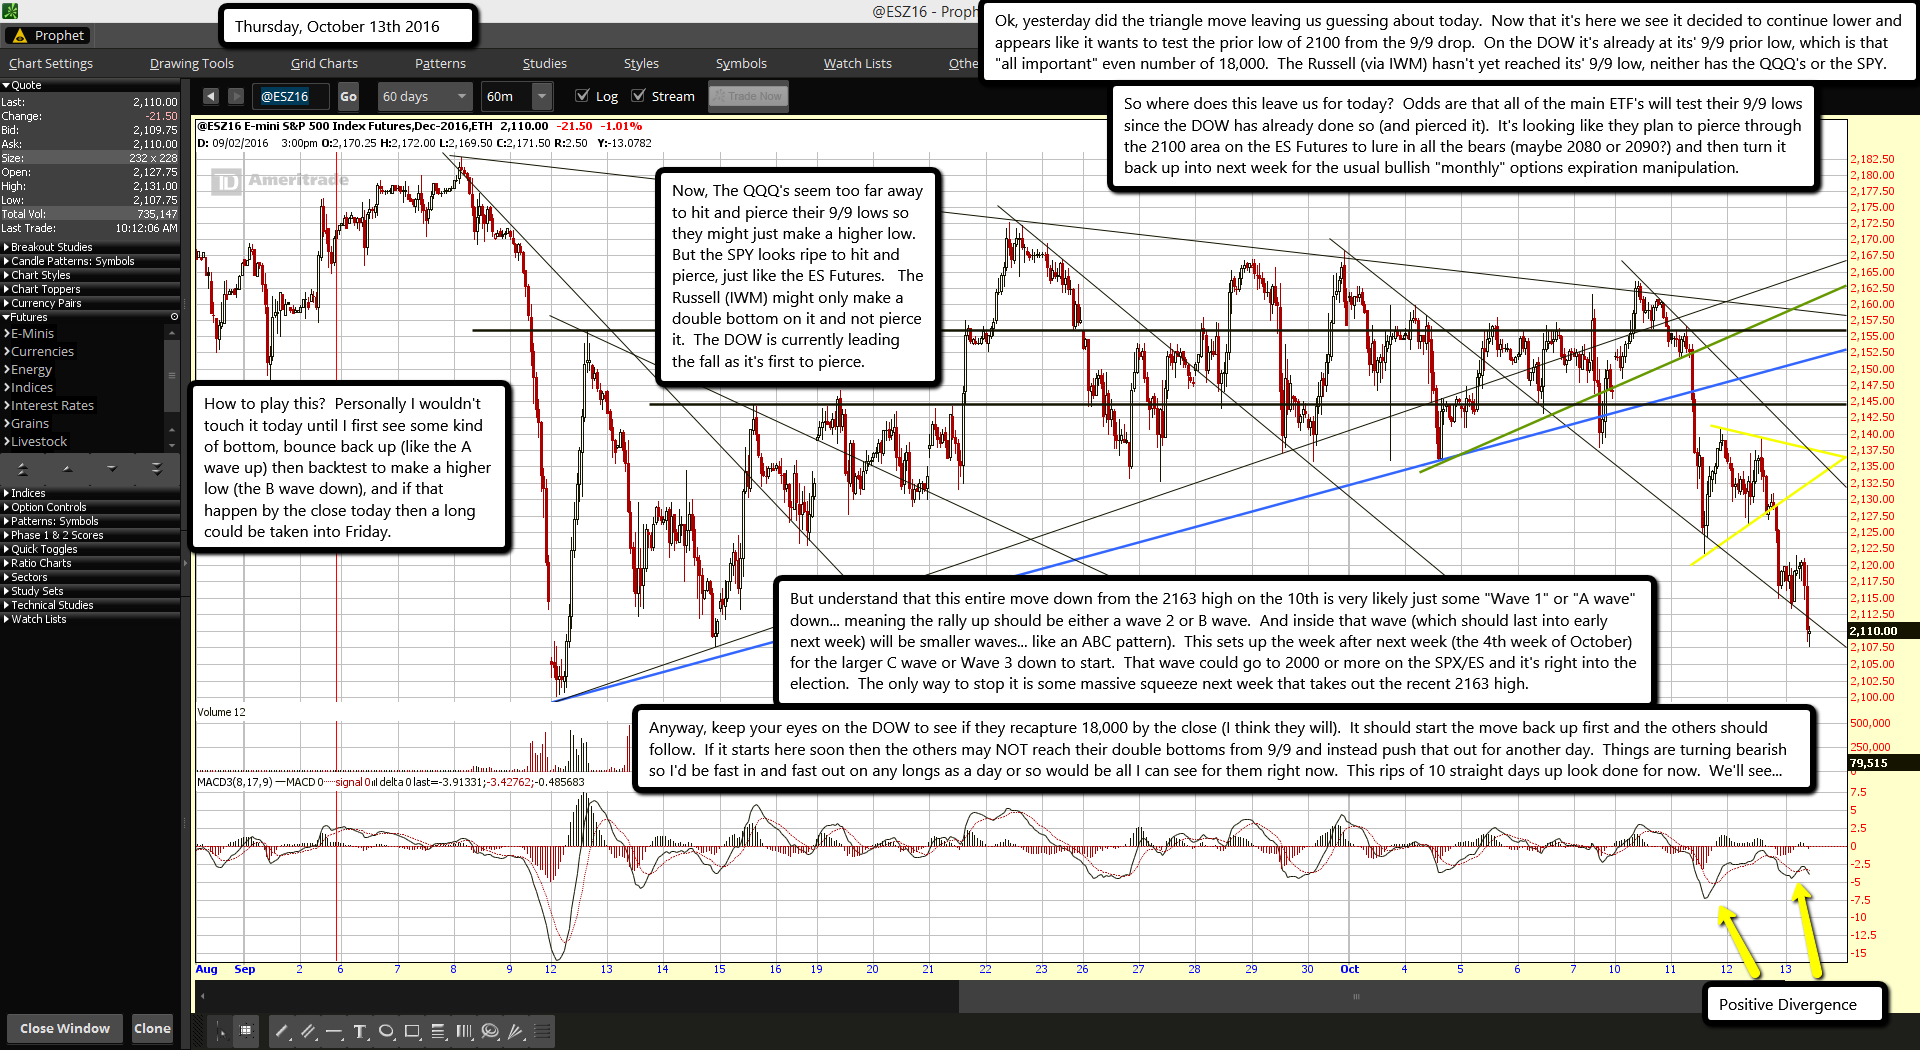
Ok, yesterday did the triangle move leaving us guessing about today.  Now that it's here we see it decided to continue lower and appears like it wants to test the prior low of 2100 from the 9/9 drop.  On the DOW it's already at its' 9/9 prior low, which is that "all important" even number of 18,000.  The Russell (via IWM) hasn't yet reached its' 9/9 low, neither has the QQQ's or the SPY.

So where does this leave us for today?  Odds are that all of the main ETF's will test their 9/9 lows since the DOW has already done so (and pierced it).  It's looking like they plan to pierce through the 2100 area on the ES Futures to lure in all the bears (maybe 2080 or 2090?) and then turn it back up into next week for the usual bullish "monthly" options expiration manipulation.

Now, The QQQ's seem too far away to hit and pierce their 9/9 lows so they might just make a higher low.  But the SPY looks ripe to hit and pierce, just like the ES Futures.   The Russell (IWM) might only make a double bottom on it and not pierce it.  The DOW is currently leading the fall as it's first to pierce.

How to play this?  Personally I wouldn't touch it today until I first see some kind of bottom, bounce back up (like the A wave up) then backtest to make a higher low (the B wave down), and if that happen by the close today then a long could be taken into Friday.

But understand that this entire move down from the 2163 high on the 10th is very likely just some "Wave 1" or "A wave" down... meaning the rally up should be either a wave 2 or B wave.  And inside that wave (which should last into early next week) will be smaller waves... like an ABC pattern).  This sets up the week after next week (the 4th week of October) for the larger C wave or Wave 3 down to start.  That wave could go to 2000 or more on the SPX/ES and it's right into the election.  The only way to stop it is some massive squeeze next week that takes out the recent 2163 high.

Anyway, keep your eyes on the DOW to see if they recapture 18,000 by the close (I think they will).  It should start the move back up first and the others should follow.  If it starts here soon then the others may NOT reach their double bottoms from 9/9 and instead push that out for another day.  Things are turning bearish so I'd be fast in and fast out on any longs as a day or so would be all I can see for them right now.  This rips of 10 straight days up look done for now.  We'll see...

ES Morning Update October 12th 2016

0

d4e788ec-a15a-4d31-8165-e79c9cd5a500

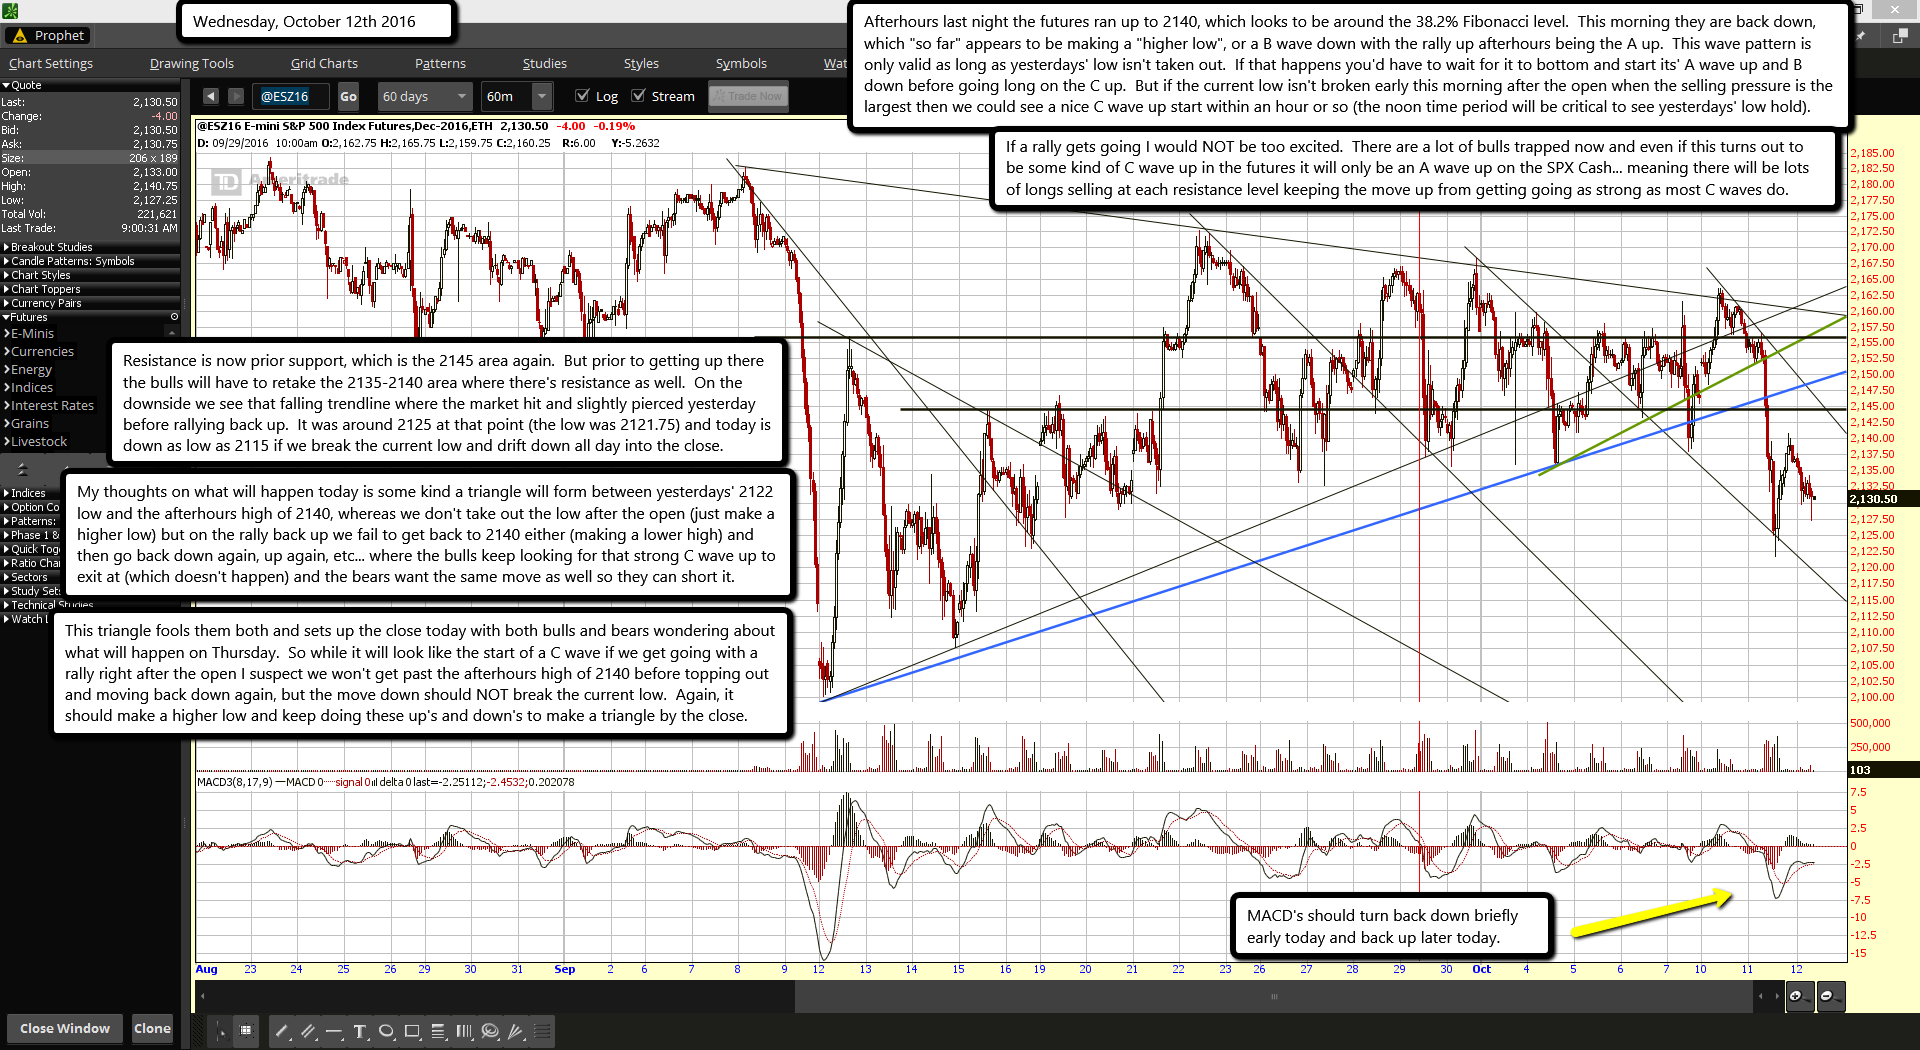
Afterhours last night the futures ran up to 2140, which looks to be around the 38.2% Fibonacci level.  This morning they are back down, which "so far" appears to be making a "higher low", or a B wave down with the rally up afterhours being the A up.  This wave pattern is only valid as long as yesterdays' low isn't taken out.  If that happens you'd have to wait for it to bottom and start its' A wave up and B down before going long on the C up.  But if the current low isn't broken early this morning after the open when the selling pressure is the largest then we could see a nice C wave up start within an hour or so (the noon time period will be critical to see yesterdays' low hold).

If a rally gets going I would NOT be too excited.  There are a lot of bulls trapped now and even if this turns out to be some kind of C wave up in the futures it will only be an A wave up on the SPX Cash... meaning there will be lots of longs selling at each resistance level keeping the move up from getting going as strong as most C waves do.

Resistance is now prior support, which is the 2145 area again.  But prior to getting up there the bulls will have to retake the 2135-2140 area where there's resistance as well.  On the downside we see that falling trendline where the market hit and slightly pierced yesterday before rallying back up.  It was around 2125 at that point (the low was 2121.75) and today is down as low as 2115 if we break the current low and drift down all day into the close.

My thoughts on what will happen today is some kind a triangle will form between yesterdays' 2122 low and the afterhours high of 2140, whereas we don't take out the low after the open (just make a higher low) but on the rally back up we fail to get back to 2140 either (making a lower high) and then go back down again, up again, etc... where the bulls keep looking for that strong C wave up to exit at (which doesn't happen) and the bears want the same move as well so they can short it.

This triangle fools them both and sets up the close today with both bulls and bears wondering about what will happen on Thursday.  So while it will look like the start of a C wave if we get going with a rally right after the open I suspect we won't get past the afterhours high of 2140 before topping out and moving back down again, but the move down should NOT break the current low.  Again, it should make a higher low and keep doing these up's and down's to make a triangle by the close.

Los Angeles Seeks Changes at Banks After Wells Fargo Scandal

0

Los Angeles Councilman Paul Koretz is introducing legislation that would require banks working with the second-largest U.S. city to adhere to responsible practices such as barring sales goals, which have been criticized for leading to the bogus account scandal at Wells Fargo & Co.

In the motion Tuesday, the city would add such consumer protections to its requirements when it solicits proposals from financial institutions for banking services.

The measure, which the council and mayor must approve, doesn’t go as far as other places, such as in Illinois and California, by suspending Wells Fargo from working with the city. But it characterizes the bank’s sales targets as harmful to the community as the firm seeks to repair its battered reputation.

 "By incentivizing bank workers to sell more loans and credit cards regardless of the need or quality of those financial products, Wells Fargo’s business practices posed a risk to consumers across the entire financial sector," the motion said.

Settlement’s Fallout

Wells Fargo in September agreed to pay $185 million to resolve claims that employees opened accounts consumers didn’t know about to boost sales tallies. It has since eliminated the goals. Federal prosecutors in New York and San Francisco have opened criminal inquiries. Wells Fargo already faces a raft of lawsuits by fired or demoted workers, customers and investors.

Santa Cruz County Supervisors on Tuesday voted to bar the bank from new business with the California county for a year, according to the clerk’s office. California, Illinois and Chicago are severing business ties with the bank, while Seattle booted the firm from an upcoming bond issue.

The Los Angeles move would be the first to address the practice of sales goals, according to a statement from the Committee for Better Banks, an organization backed by labor groups that’s pushing for the change.

New York’s financial regulator on Tuesday warned state-chartered banks not to link incentives with metrics such as new accounts unless they manage the risks effectively.

Wall Street stocks slide, dollar hits eight-month high

0

Slumping crude prices and a dour start to Wall Street's corporate earnings season pulled down U.S. and European equities on Tuesday, while the dollar hit an eight-month high on increasing bets U.S. interest rates will rise in December.

Wall Street fell more than 1 percent as shares of aluminum producer Alcoa (AA.N) and diagnostics test maker Illumina (ILMN.O) plunged, with worries over the make-up of the U.S. Congress after November's election also weighing on stocks.

Alcoa shares tumbled 11.4 percent and Illumina plummeted 24.8 percent, casting a pall over the market. Wall Street's "fear gauge," the CBOE Market Volatility index .VIX, jumped almost 24 percent at one point and ended the day up 15 percent.

Investors were also jittery about earnings to be reported on Friday by Wells Fargo (WFC.N) and Citigroup (C.N), according to brokerage Seaport Global.

The UK benchmark FTSE 100 equity index .FTSE reversed course after it set a record intraday high that was helped by further sterling weakness.

The British pound has lost more than 4 percent of its value against the dollar over the past week as investors fret about a "hard exit" by Britain from the European Union.

In the United States, investors were looking to Wednesday's release of minutes from the Fed's policy-setting meeting in September for signs of a December interest rate hike.

The futures market perceives a roughly 70 percent chance that the Fed will lift rates in December, a view that pushed the benchmark 10-year U.S. Treasury yield US10YT=RR to a more than four-month high.

"Recent data on jobs, manufacturing and services growth have shown compelling strength that could greenlight a U.S. rate hike by the end of the year," said Joe Manimbo, senior market analyst at Western Union Business Solutions in Washington.

The dollar index, which measures the greenback against six major currencies, was up 0.74 percent at 97.651 .DXY after hitting 97.731, its highest since late July.

The euro fell to more than a two-month low against the dollar and was last down 0.72 percent at $1.1057 EUR=. Against the yen, the dollar was down 0.14 percent at 103.43 JPY=.

Crude prices retreated from one-year highs on concerns a proposed production cut by the world's largest oil exporters might not be enough to reduce a global glut.

The International Energy Agency said it was unclear how rapidly global oil supply could fall in line with demand even if Russia and OPEC agreed on a steep enough cut.

Brent crude oil LCOc1 settled down 73 cents at $52.41 a barrel and U.S. West Texas Intermediate crude CLc1 slipped 56 cents to settle at $50.79.

The Dow Jones industrial average .DJI closed down 200.38 points, or 1.09 percent, to 18,128.66. The S&P 500 .SPX fell 26.93 points, or 1.24 percent, to 2,136.73 and the Nasdaq Composite .IXIC lost 81.89 points, or 1.54 percent, to 5,246.79.

The market is in a corrective phase, with overvalued dividend stocks being sold, said Rahul Shah, chief executive of Ideal Asset Management.

"If we grind forward like this and you have overvalued sectors come down and undervalued sectors rise, you could set the base for a market that could have a strong rally in the future," Shah said.

In Europe, the pan-regional FTSEurofirst 300 index .FTEU3 fell 0.6 percent to close at 1,342.19. MSCI's all-country stock index .MIWD00000PUS fell 1.18 percent.

Weaker commodity stocks weighed in Europe. The STOXX Oil & Gas index .SXEP fell 1.5 percent, making it the region's second-biggest sector loser after the STOXX Basic Resources index .SXPP, which fell 2.1 percent as metal prices retreated.

The 10-year U.S. Treasury note fell 8/32 in price to yield 1.7638 percent.

ES Morning Update October 11th 2016

0

082087ac-abbe-449a-9190-be2fec320896

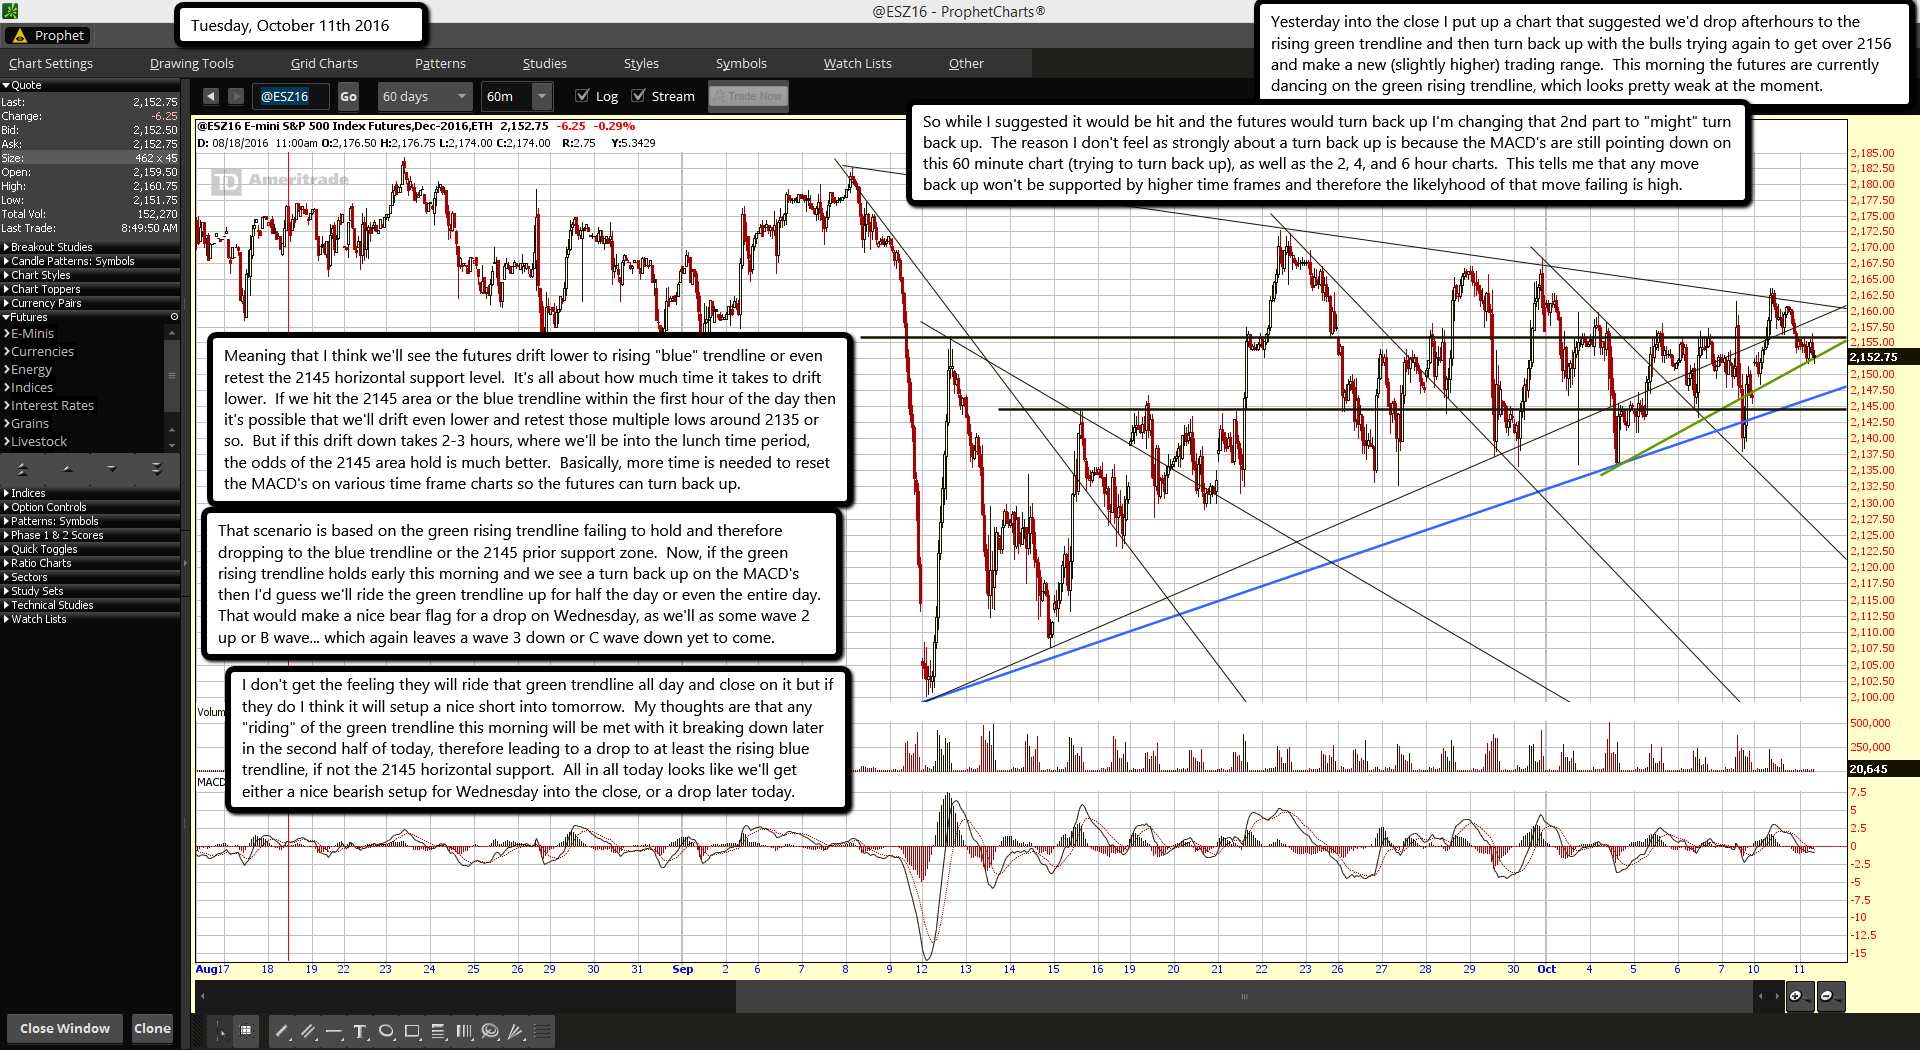
Yesterday into the close I put up a chart that suggested we'd drop afterhours to the rising green trendline and then turn back up with the bulls trying again to get over 2156 and make a new (slightly higher) trading range.  This morning the futures are currently dancing on the green rising trendline, which looks pretty weak at the moment.

So while I suggested it would be hit and the futures would turn back up I'm changing that 2nd part to "might" turn back up.  The reason I don't feel as strongly about a turn back up is because the MACD's are still pointing down on this 60 minute chart (trying to turn back up), as well as the 2, 4, and 6 hour charts.  This tells me that any move back up won't be supported by higher time frames and therefore the likely-hood of that move failing is high.

Meaning that I think we'll see the futures drift lower to rising "blue" trendline or even retest the 2145 horizontal support level.  It's all about how much time it takes to drift lower.  If we hit the 2145 area or the blue trendline within the first hour of the day then it's possible that we'll drift even lower and retest those multiple lows around 2135 or so.  But if this drift down takes 2-3 hours, where we'll be into the lunch time period, the odds of the 2145 area hold is much better.  Basically, more time is needed to reset the MACD's on various time frame charts so the futures can turn back up.

That scenario is based on the green rising trendline failing to hold and therefore dropping to the blue trendline or the 2145 prior support zone.  Now, if the green rising trendline holds early this morning and we see a turn back up on the MACD's then I'd guess we'll ride the green trendline up for half the day or even the entire day.  That would make a nice bear flag for a drop on Wednesday, as we'll as some wave 2 up or B wave... which again leaves a wave 3 down or C wave down yet to come.

I don't get the feeling they will ride that green trendline all day and close on it but if they do I think it will setup a nice short into tomorrow.  My thoughts are that any "riding" of the green trendline this morning will be met with it breaking down later in the second half of today, therefore leading to a drop to at least the rising blue trendline, if not the 2145 horizontal support.  All in all today looks like we'll get either a nice bearish setup for Wednesday into the close, or a drop later today.

Global debt at record high says IMF

0

Worldwide public and private debt is at an all-time high, posing a substantial impediment to getting global economic growth back to normal, the International Monetary Fund has said.

The easy money policies of the world's top central banks has fed the problem, stoking a private-sector credit binge in China and rising public debt in some low-income countries, the IMF said in a new report.

Meanwhile, slow economic growth is making it hard for both companies and countries to cut their debt burdens - a process that can also drag on growth momentum because deleveraging companies slow spending and investment.

Without deleveraging, however, countries run the risk of fresh financial crises that can turn into deep recessions, the IMF's Fiscal Monitor report says.

"For a significant deleveraging to take place, restoring robust growth and returning to normal levels of inflation is necessary," the fund said.

Getting there requires governments to stimulate growth though investment, certain fiscal and business reforms, and targeted programs to help heavily indebted companies lower their debts.

"Global debt is at record highs and rising," the IMF's Fiscal Affairs Department chief Vitor Gaspar said.

Public and private debt -- excluding the financial sector's - at the end of last year hit $152 trillion, with around two-thirds owed by the private sector, the report said.

Measured against the size of the world economy, it rose from less than 200 percent of global GDP to 225 percent over the 15 years to 2015.

Debt at such levels while economic growth remains tepid heightens the risk of financial crises, Gaspar said.

"High debt levels are costly as they often end up in financial recessions that are deeper and longer than normal recessions," he said in comments accompanying the report.

Moreover, "excessive private debt is a major headwind against the global recovery and a risk to financial stability."

While central banks have had to cut interest rates to support the recovery from the 2008 financial crisis, that has encouraged the debt pileup, the report said.

Dealing with the problem requires governments to implement well-calibrated programs to reduce private debt -- by cleaning up poor balance sheets of European banks and non-financial companies in China.

"Generally, where the financial system is under severe stress," the report said, "resolving the underlying problem quickly is critical."


IMF singles out Australia as global debt levels hit $US152 trillion

The International Monetary Fund has singled out Australia as one of few countries where debt is increasing and bucking the global trend.

In its latest Fiscal Monitor, the IMF says after the global financial crisis, government debt in advanced economies rose rapidly, while private debt reached a turning point in 2012.

Australians are accumulating debt at a 'fast pace', the IMF has warned.
Australians are accumulating debt at a 'fast pace', the IMF has warned.  Photo: Chris Hopkins

The largest reductions since were posted by those countries that entered the crisis with high debt levels.

"In some cases, however, private debt has continued to accumulate at a fast pace - notably, Australia, Canada and Singapore," it said in the report released in Washington on Wednesday."

Gross debt in the non-financial sector has more than doubled in nominal terms since the turn of the century, reaching $US152 trillion ($199 trillion) last year, and it's still rising, the International Monetary Fund said.

At a staggering 225 per cent of world GDP, non-financial sector global debt is at an all-time high.

The figure includes debt held by governments, non-financial firms and households.

Two-thirds, amounting to about $US100 trillion, consists of liabilities of the private sector which can carry great risks when they reach excessive levels, it warns.

At a staggering 225 per cent of world GDP, non-financial sector global debt is at an all-time high.
At a staggering 225 per cent of world GDP, non-financial sector global debt is at an all-time high. Photo: Louise Kennerley

"Resolving the 'private debt overhang' is ... not easy in the current global environment of low nominal growth," the IMF admits.

Slow global growth is making it difficult to pay off the obligations, "setting the stage for a vicious feedback loop in which lower growth hampers deleveraging and the debt overhang exacerbates the slowdown," said the Washington-based fund.

"Excessive private debt is a major headwind against the global recovery and a risk to financial stability," IMF fiscal chief Vitor Gaspar said in prepared remarks. "History has taught us that it is very easy to underestimate the risks associated with private debt during the upswing."

Much of the borrowing dates back to the boom in private debt that preceded the 2008 financial crisis, according to the IMF. While households and companies in advanced economies started to retrench following the crisis, the deleveraging has been uneven and in some instances debts kept rising, Gaspar said. Bad debts have ended up on government balance sheets.

There's no consensus on what levels of debt-to-GDP should be the considered alarming, the IMF said. However, financial crises tend to be associated with excessive private debt in both advanced and emerging economies, the fund said. In addition, research has shown that high debt is linked with lower growth, even when a crisis is avoided.

ES Morning Update October 10th 2016

0

2d474f51-4e4a-4fa1-b8bf-0bf2a0e8d1eb

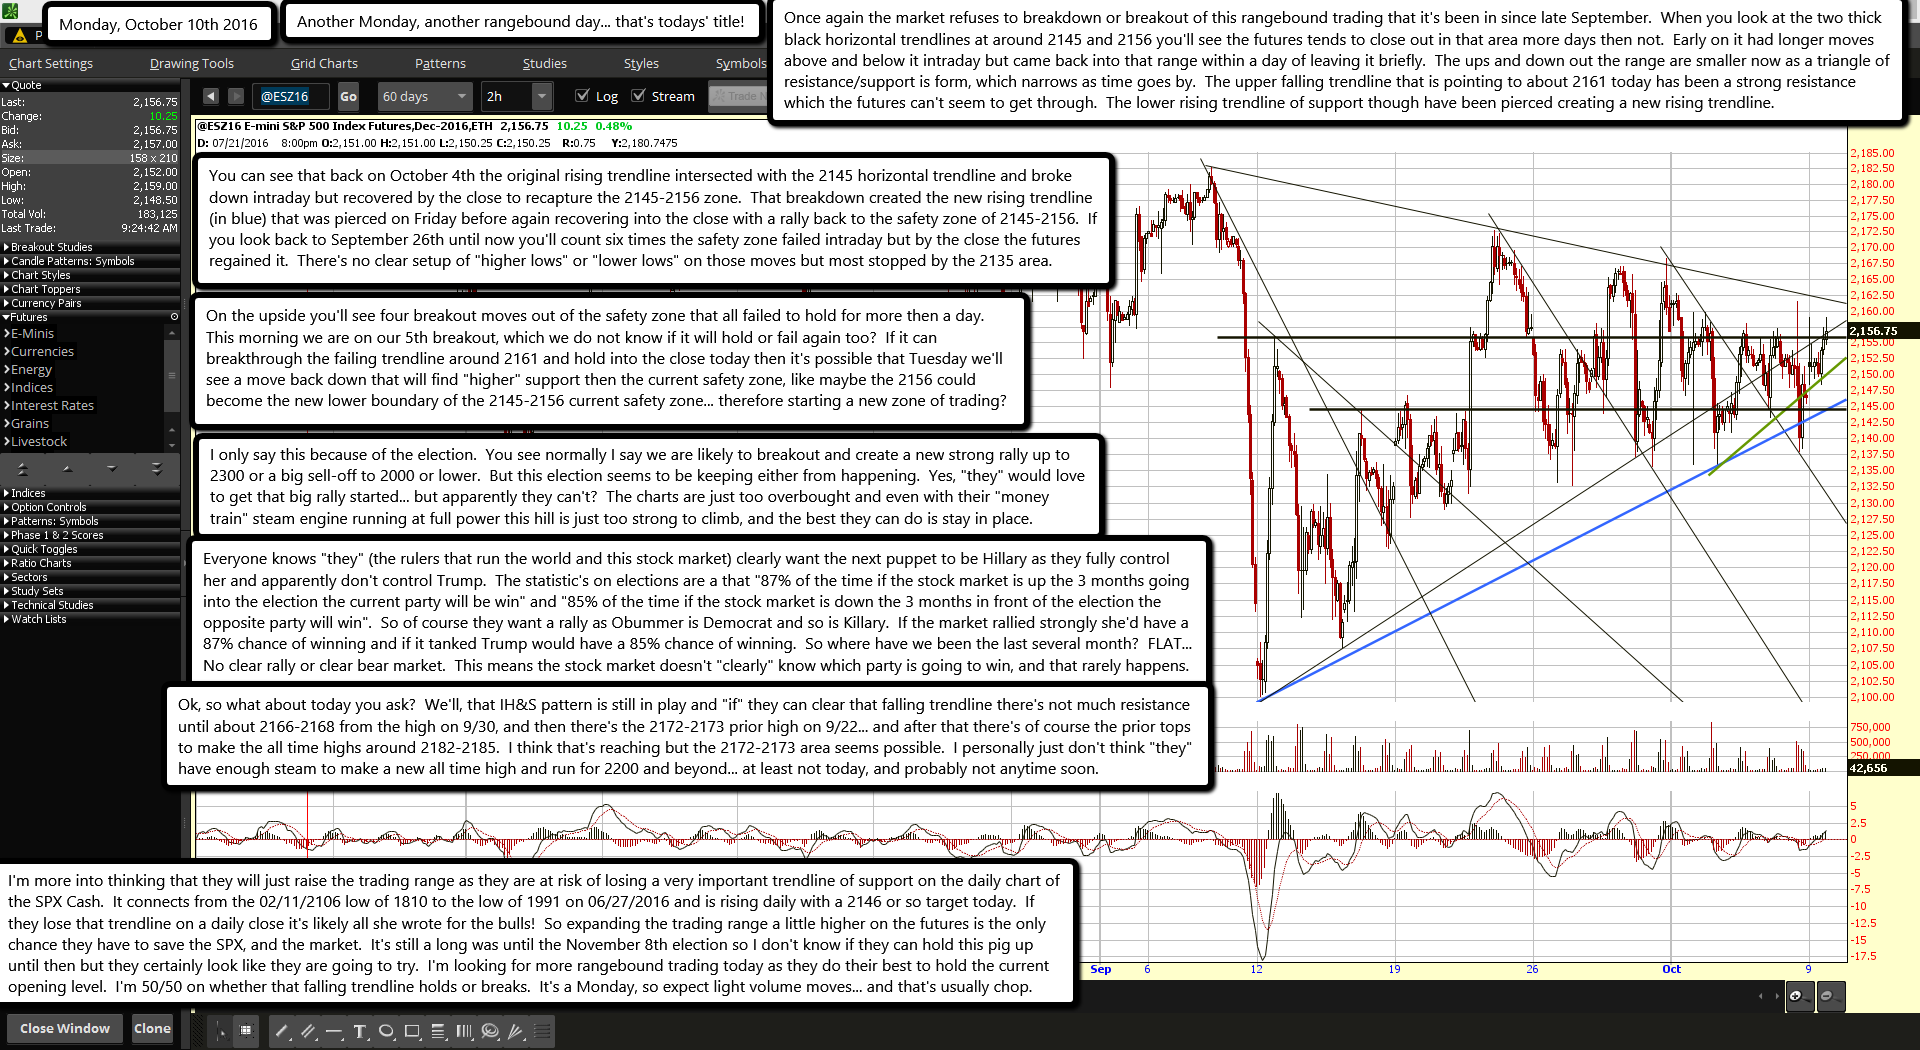
Another Monday, another rangebound day... that's todays' title!

Once again the market refuses to breakdown or breakout of this rangebound trading that it's been in since late September.  When you look at the two thick black horizontal trendlines at around 2145 and 2156 you'll see the futures tends to close out in that area more days then not.  Early on it had longer moves above and below it intraday but came back into that range within a day of leaving it briefly.  The ups and down out the range are smaller now as a triangle of resistance/support is form, which narrows as time goes by.  The upper falling trendline that is pointing to about 2161 today has been a strong resistance which the futures can't seem to get through.  The lower rising trendline of support though have been pierced creating a new rising trendline.

You can see that back on October 4th the original rising trendline intersected with the 2145 horizontal trendline and broke down intraday but recovered by the close to recapture the 2145-2156 zone.  That breakdown created the new rising trendline (in blue) that was pierced on Friday before again recovering into the close with a rally back to the safety zone of 2145-2156.  If you look back to September 26th until now you'll count six times the safety zone failed intraday but by the close the futures regained it.  There's no clear setup of "higher lows" or "lower lows" on those moves but most stopped by the 2135 area.

On the upside you'll see four breakout moves out of the safety zone that all failed to hold for more then a day.  This morning we are on our 5th breakout, which we do not know if it will hold or fail again too?  If it can breakthrough the failing trendline around 2161 and hold into the close today then it's possible that Tuesday we'll see a move back down that will find "higher" support then the current safety zone, like maybe the 2156 could become the new lower boundary of the 2145-2156 current safety zone... therefore starting a new zone of trading?

I only say this because of the election.  You see normally I say we are likely to breakout and create a new strong rally up to 2300 or a big sell-off to 2000 or lower.  But this election seems to be keeping either from happening.  Yes, "they" would love to get that big rally started... but apparently they can't?  The charts are just too overbought and even with their "money train" steam engine running at full power this hill is just too strong to climb, and the best they can do is stay in place.

Everyone knows "they" (the rulers that run the world and this stock market) clearly want the next puppet to be Hillary as they fully control her and apparently don't control Trump.  The statistic's on elections are a that "87% of the time if the stock market is up the 3 months going into the election the current party will be win" and "85% of the time if the stock market is down the 3 months in front of the election the opposite party will win".  So of course they want a rally as Obummer is Democrat and so is Killary.  If the market rallied strongly she'd have a 87% chance of winning and if it tanked Trump would have a 85% chance of winning.  So where have we been the last several month?  FLAT... No clear rally or clear bear market.  This means the stock market doesn't "clearly" know which party is going to win, and that rarely happens.

Ok, so what about today you ask?  We'll, that IH&S pattern is still in play and "if" they can clear that falling trendline there's not much resistance until about 2166-2168 from the high on 9/30, and then there's the 2172-2173 prior high on 9/22... and after that there's of course the prior tops to make the all time highs around 2182-2185.  I think that's reaching but the 2172-2173 area seems possible.  I personally just don't think "they" have enough steam to make a new all time high and run for 2200 and beyond... at least not today, and probably not anytime soon.

I'm more into thinking that they will just raise the trading range as they are at risk of losing a very important trendline of support on the daily chart of the SPX Cash.  It connects from the 02/11/2106 low of 1810 to the low of 1991 on 06/27/2016 and is rising daily with a 2146 or so target today.  If they lose that trendline on a daily close it's likely all she wrote for the bulls!  So expanding the trading range a little higher on the futures is the only chance they have to save the SPX, and the market.  It's still a long was until the November 8th election so I don't know if they can hold this pig up until then but they certainly look like they are going to try.  I'm looking for more rangebound trading today as they do their best to hold the current opening level.  I'm 50/50 on whether that falling trendline holds or breaks.  It's a Monday, so expect light volume moves... and that's usually chop.

ES Morning Update October 7th 2016

0

0f4c46bf-5eba-4c04-8cff-997538697032

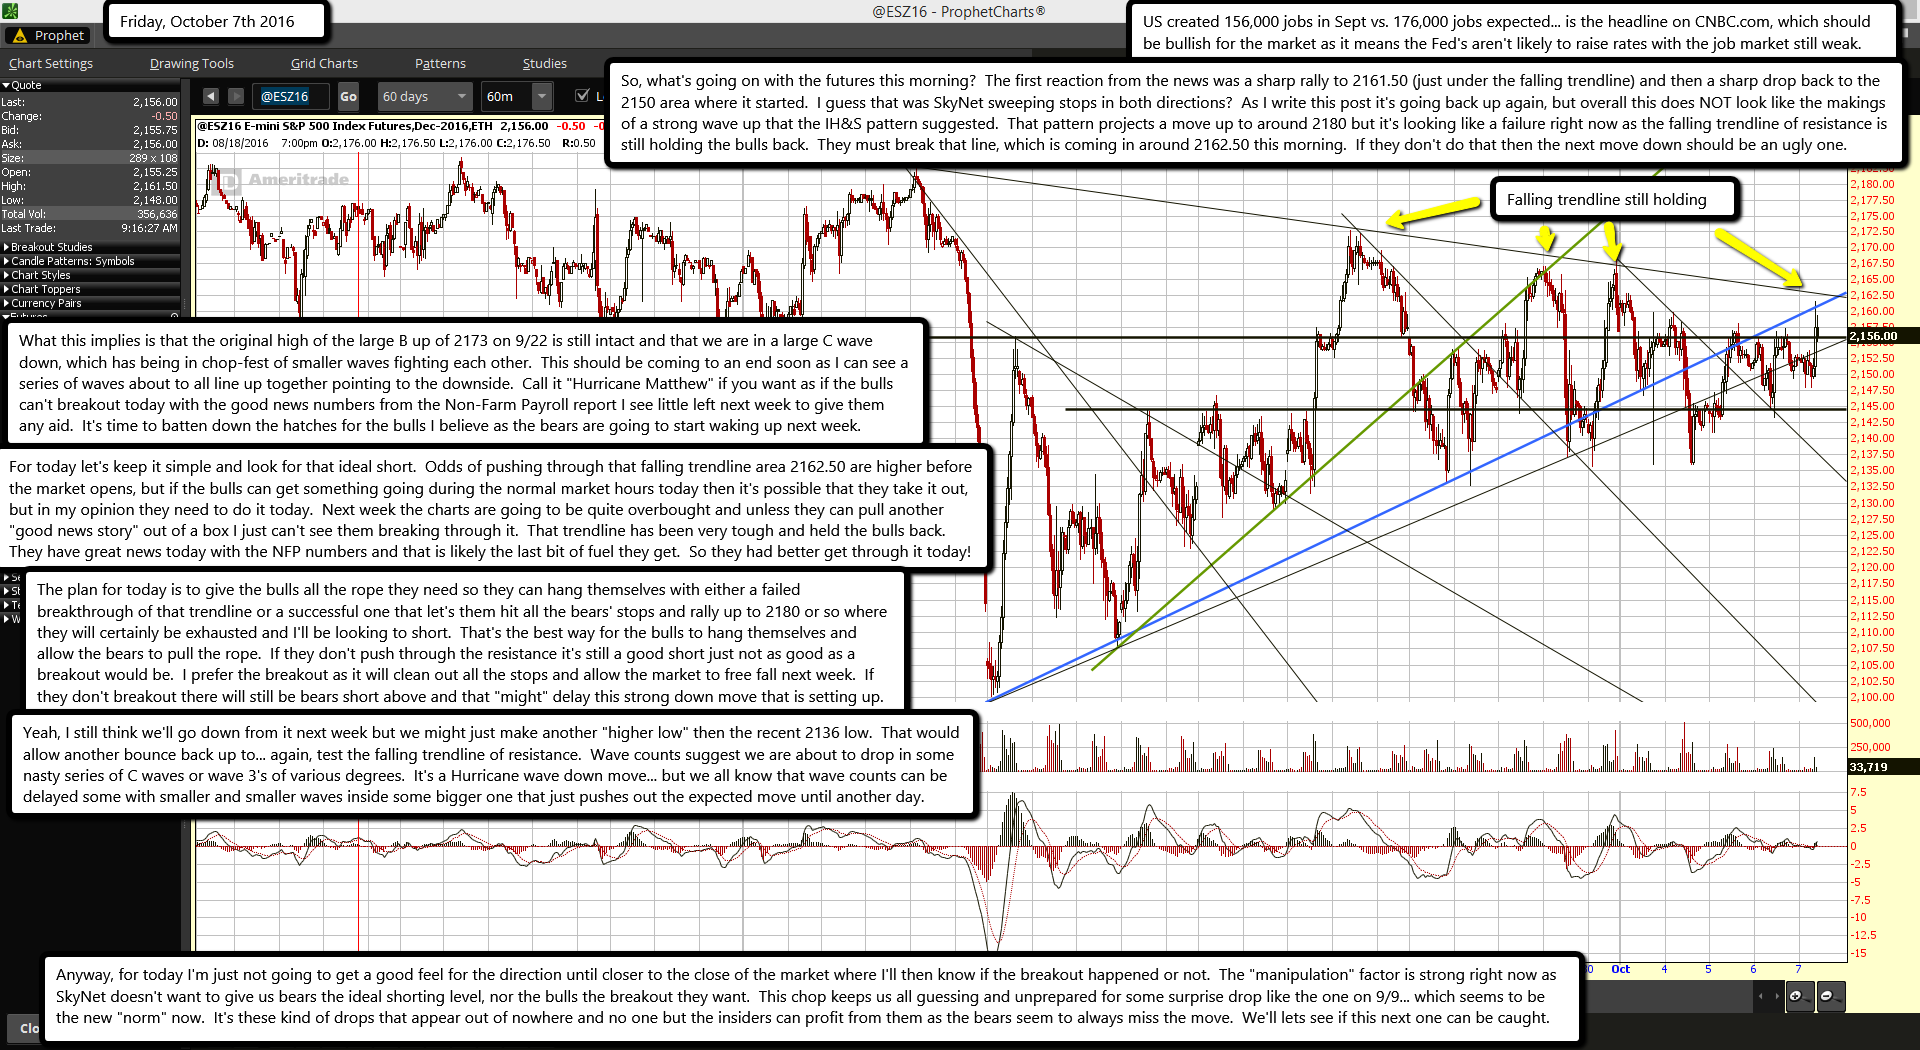
US created 156,000 jobs in Sept vs. 176,000 jobs expected... is the headline on CNBC.com, which should be bullish for the market as it means the Fed's aren't likely to raise rates with the job market still weak.

So, what's going on with the futures this morning?  The first reaction from the news was a sharp rally to 2161.50 (just under the falling trendline) and then a sharp drop back to the 2150 area where it started.  I guess that was SkyNet sweeping stops in both directions?  As I write this post it's going back up again, but overall this does NOT look like the makings of a strong wave up that the IH&S pattern suggested.  That pattern projects a move up to around 2180 but it's looking like a failure right now as the falling trendline of resistance is still holding the bulls back.  They must break that line, which is coming in around 2162.50 this morning.  If they don't do that then the next move down should be an ugly one.

What this implies is that the original high of the large B up of 2173 on 9/22 is still intact and that we are in a large C wave down, which has being in chop-fest of smaller waves fighting each other.  This should be coming to an end soon as I can see a series of waves about to all line up together pointing to the downside.  Call it "Hurricane Matthew" if you want as if the bulls can't breakout today with the good news numbers from the Non-Farm Payroll report I see little left next week to give them any aid.  It's time to batten down the hatches for the bulls I believe as the bears are going to start waking up next week.

For today let's keep it simple and look for that ideal short.  Odds of pushing through that falling trendline area 2162.50 are higher before the market opens, but if the bulls can get something going during the normal market hours today then it's possible that they take it out, but in my opinion they need to do it today.  Next week the charts are going to be quite overbought and unless they can pull another "good news story" out of a box I just can't see them breaking through it.  That trendline has been very tough and held the bulls back.  They have great news today with the NFP numbers and that is likely the last bit of fuel they get.  So they had better get through it today!

The plan for today is to give the bulls all the rope they need so they can hang themselves with either a failed breakthrough of that trendline or a successful one that let's them hit all the bears' stops and rally up to 2180 or so where they will certainly be exhausted and I'll be looking to short.  That's the best way for the bulls to hang themselves and allow the bears to pull the rope.  If they don't push through the resistance it's still a good short just not as good as a breakout would be.  I prefer the breakout as it will clean out all the stops and allow the market to free fall next week.  If they don't breakout there will still be bears short above and that "might" delay this strong down move that is setting up.

Yeah, I still think we'll go down from it next week but we might just make another "higher low" then the recent 2136 low.  That would allow another bounce back up to... again, test the falling trendline of resistance.  Wave counts suggest we are about to drop in some nasty series of C waves or wave 3's of various degrees.  It's a Hurricane wave down move... but we all know that wave counts can be delayed some with smaller and smaller waves inside some bigger one that just pushes out the expected move until another day.

Anyway, for today I'm just not going to get a good feel for the direction until closer to the close of the market where I'll then know if the breakout happened or not.  The "manipulation" factor is strong right now as SkyNet doesn't want to give us bears the ideal shorting level, nor the bulls the breakout they want.  This chop keeps us all guessing and unprepared for some surprise drop like the one on 9/9... which seems to be the new "norm" now.  It's these kind of drops that appear out of nowhere and no one but the insiders can profit from them as the bears seem to always miss the move.  We'll lets see if this next one can be caught.

Pentagon paid PR firm $540mn to make fake terrorist videos

0

© Thaier Al-Sudani

The Pentagon paid a UK PR firm half a billion dollars to create fake terrorist videos in Iraq in a secret propaganda campaign exposed by the Bureau of Investigative Journalism.

PR firm Bell Pottinger, known for its array of controversial clients including the Saudi government and Chilean dictator Augusto Pinochet’s foundation, worked with the US military to create the propaganda in a secretive operation.

The firm reported to the CIA, the National Security Council and the Pentagon on the project with a mandate to portray Al-Qaeda in a negative light and track suspected sympathizers.

Both the White House and General David Petraeus, the former general who shared classified information with his mistress, signed off on the content produced by the agency.

The Bell Pottinger operation started soon after the US invasion of Iraq and was tasked with promoting the “democratic elections” for the administration before moving on to more lucrative psychological and information operations.

Former employee Martin Wells told the Bureau how he found himself working in Iraq after being hired as a video editor by Bell Pottinger. Within 48 hours, he was landing in Baghdad to edit content for secret “psychological operations” at Camp Victory.

The firm created television ads showing Al-Qaeda in a negative light as well as creating content to look as though it had come from “Arabic TV”. Crews were sent out to film bombings with low quality video. The firm would then edit it to make it look like news footage.

They would craft scripts for Arabic soap operas where characters would reject terrorism with happy consequences. The firm also created fake Al-Qaeda propaganda videos, which were then planted by the military in homes they raided.

Employees were given specific instructions to create the videos. “We need to make this style of video and we’ve got to use Al-Qaeda's footage,” Wells was told. “We need it to be 10 minutes long, and it needs to be in this file format, and we need to encode it in this manner.”

The videos were created to play on Real Player which needs an internet connection to run. The CDs were embedded with a code linking to Google Analytics which allowed the military to track IP addresses that the videos were played on.

https://en.wikipedia.org/wiki/Bell_Pottinger

According to Wells, the videos were picked up in Iran, Syria and the US.

"If one, 48 hours or a week later shows up in another part of the world, then that’s the more interesting one,” Wells explained.“And that’s what they’re looking for more, because that gives you a trail.”

The Pentagon confirmed the PR firm did work for them under the Information Operations Task Force (IOTF) creating content they say was “truthful”. The firm also worked under the Joint Psychological Operations Task Force (JPOTF). The Pentagon said it could not comment on JPOTF operations.

US law prohibits the government from using propaganda on its population, hence the use of an outside firm to create the content.

Documents show the Pentagon paid $540 million to Bell Pottinger in contracts between 2007 and 2011, with another contract for $120 million in 2006. The firm ended its work with the Pentagon in 2011.

In 2009, it was reported that the Pentagon had hired controversial PR firm, The Rendon Group, to monitor the reporting of journalists embedded with the U.S. military, to assess whether they were giving "positive" coverage to its missions.

It was also revealed in 2005 that Washington based PR company the Lincoln Group had been placing articles in newspapers in Iraq which were secretly written by the US military. A Pentagon investigation cleared the group of any wrongdoing.

ES Morning Update October 6th 2016

0

2a687827-59de-45b2-b5de-5dfeaa897f13

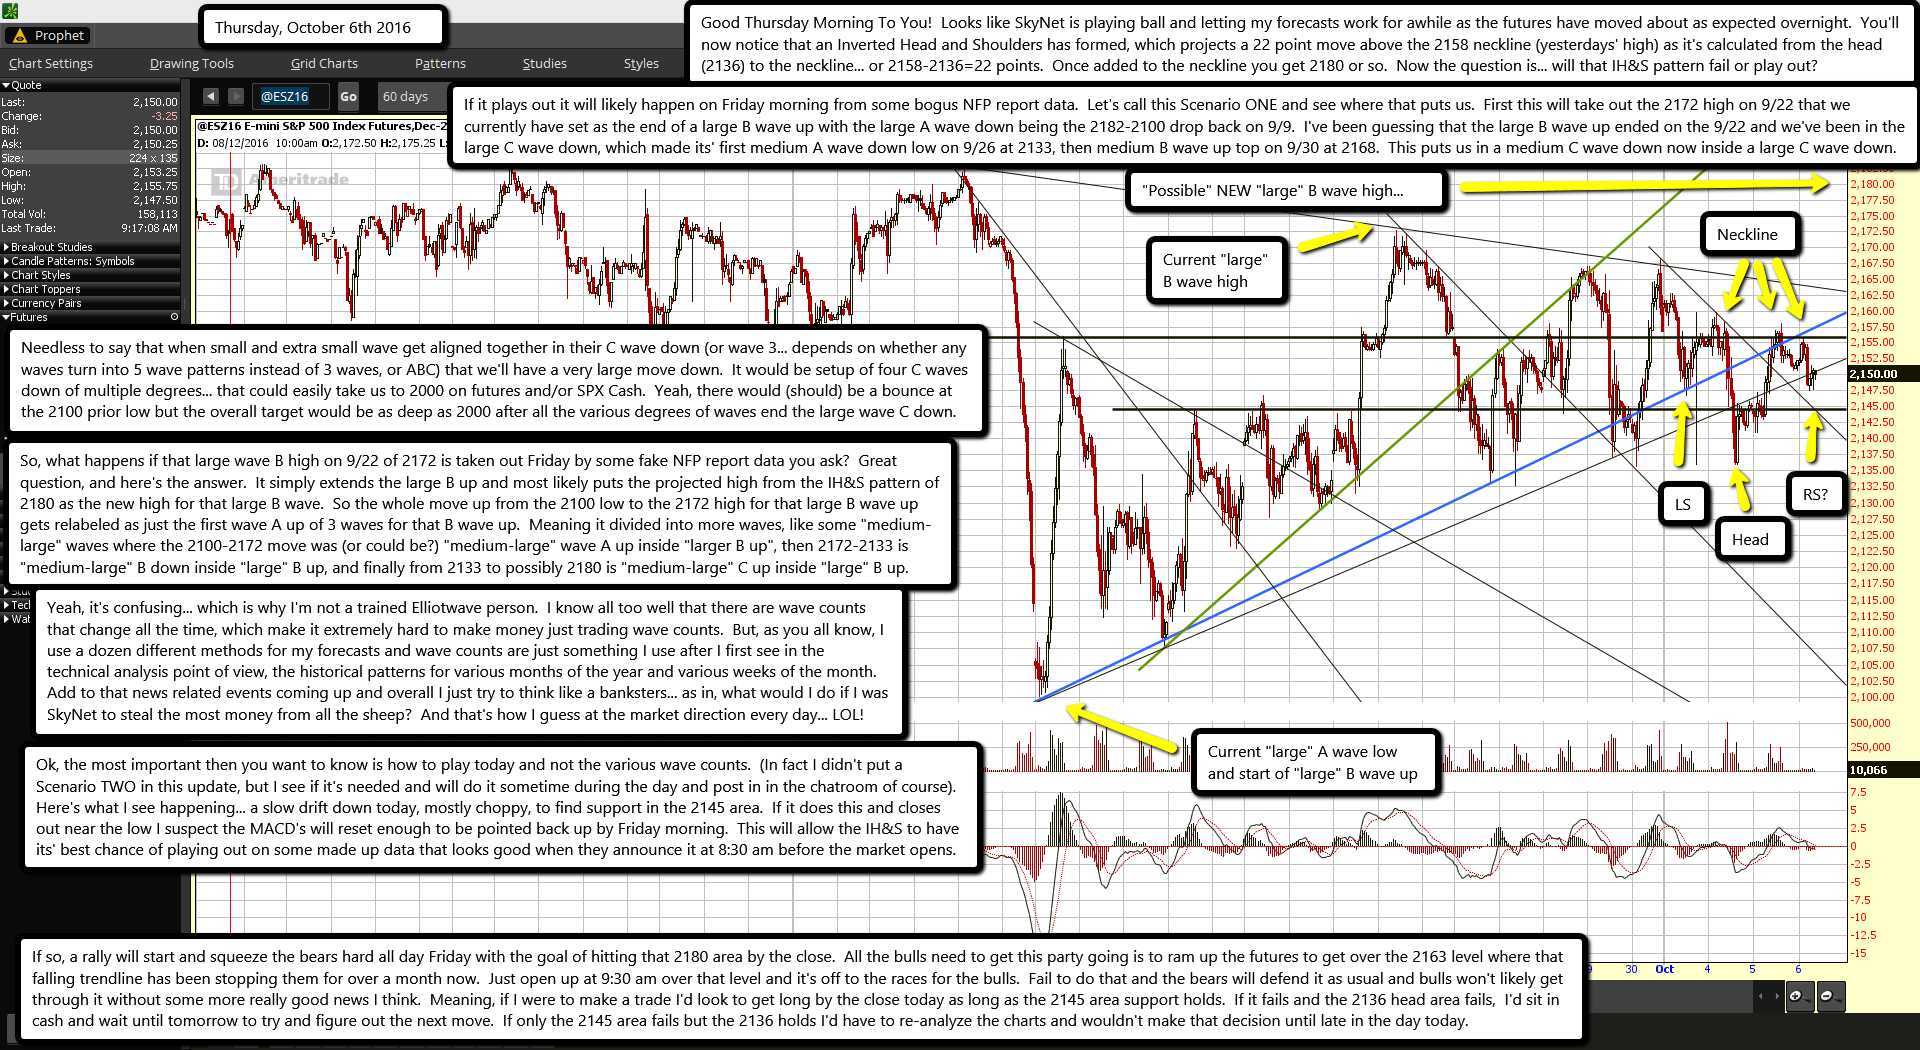
Good Thursday Morning To You!  Looks like SkyNet is playing ball and letting my forecasts work for awhile as the futures have moved about as expected overnight.  You'll now notice that an Inverted Head and Shoulders has formed, which projects a 22 point move above the 2158 neckline (yesterdays' high) as it's calculated from the head (2136) to the neckline... or 2158-2136=22 points.  Once added to the neckline you get 2180 or so.  Now the question is... will that IH&S pattern fail or play out?

If it plays out it will likely happen on Friday morning from some bogus NFP report data.  Let's call this Scenario ONE and see where that puts us.  First this will take out the 2172 high on 9/22 that we currently have set as the end of a large B wave up with the large A wave down being the 2182-2100 drop back on 9/9.  I've been guessing that the large B wave up ended on the 9/22 and we've been in the large C wave down, which made its' first medium A wave down low on 9/26 at 2133, then medium B wave up top on 9/30 at 2168.  This puts us in a medium C wave down now inside a large C wave down.

Needless to say that when small and extra small wave get aligned together in their C wave down (or wave 3... depends on whether any waves turn into 5 wave patterns instead of 3 waves, or ABC) that we'll have a very large move down.  It would be setup of four C waves down of multiple degrees... that could easily take us to 2000 on futures and/or SPX Cash.  Yeah, there would (should) be a bounce at the 2100 prior low but the overall target would be as deep as 2000 after all the various degrees of waves end the large wave C down.

So, what happens if that large wave B high on 9/22 of 2172 is taken out Friday by some fake NFP report data you ask?  Great question, and here's the answer.  It simply extends the large B up and most likely puts the projected high from the IH&S pattern of 2180 as the new high for that large B wave.  So the whole move up from the 2100 low to the 2172 high for that large B wave up gets relabeled as just the first wave A up of 3 waves for that B wave up.  Meaning it divided into more waves, like some "medium-large" waves where the 2100-2172 move was (or could be?) "medium-large" wave A up inside "larger B up", then 2172-2133 is "medium-large" B down inside "large" B up, and finally from 2133 to possibly 2180 is "medium-large" C up inside "large" B up.

Yeah, it's confusing... which is why I'm not a trained Elliotwave person.  I know all too well that there are wave counts that change all the time, which make it extremely hard to make money just trading wave counts.  But, as you all know, I use a dozen different methods for my forecasts and wave counts are just something I use after I first see in the technical analysis point of view, the historical patterns for various months of the year and various weeks of the month.  Add to that news related events coming up and overall I just try to think like a banksters... as in, what would I do if I was SkyNet to steal the most money from all the sheep?  And that's how I guess at the market direction every day... LOL!

Ok, the most important then you want to know is how to play today and not the various wave counts.  (In fact I didn't put a Scenario TWO in this update, but I see if it's needed and will do it sometime during the day and post in in the chatroom of course).  Here's what I see happening... a slow drift down today, mostly choppy, to find support in the 2145 area.  If it does this and closes out near the low I suspect the MACD's will reset enough to be pointed back up by Friday morning.  This will allow the IH&S to have its' best chance of playing out on some made up data that looks good when they announce it at 8:30 am before the market opens.

If so, a rally will start and squeeze the bears hard all day Friday with the goal of hitting that 2180 area by the close.  All the bulls need to get this party going is to ram up the futures to get over the 2163 level where that falling trendline has been stopping them for over a month now.  Just open up at 9:30 am over that level and it's off to the races for the bulls.  Fail to do that and the bears will defend it as usual and bulls won't likely get through it without some more really good news I think.  Meaning, if I were to make a trade I'd look to get long by the close today as long as the 2145 area support holds.  If it fails and the 2136 head area fails,  I'd sit in cash and wait until tomorrow to try and figure out the next move.  If only the 2145 area fails but the 2136 holds I'd have to re-analyze the charts and wouldn't make that decision until late in the day today.

ES Morning Update October 5th 2016

0

1d3b52b1-07c2-4893-8be3-953848092bbb

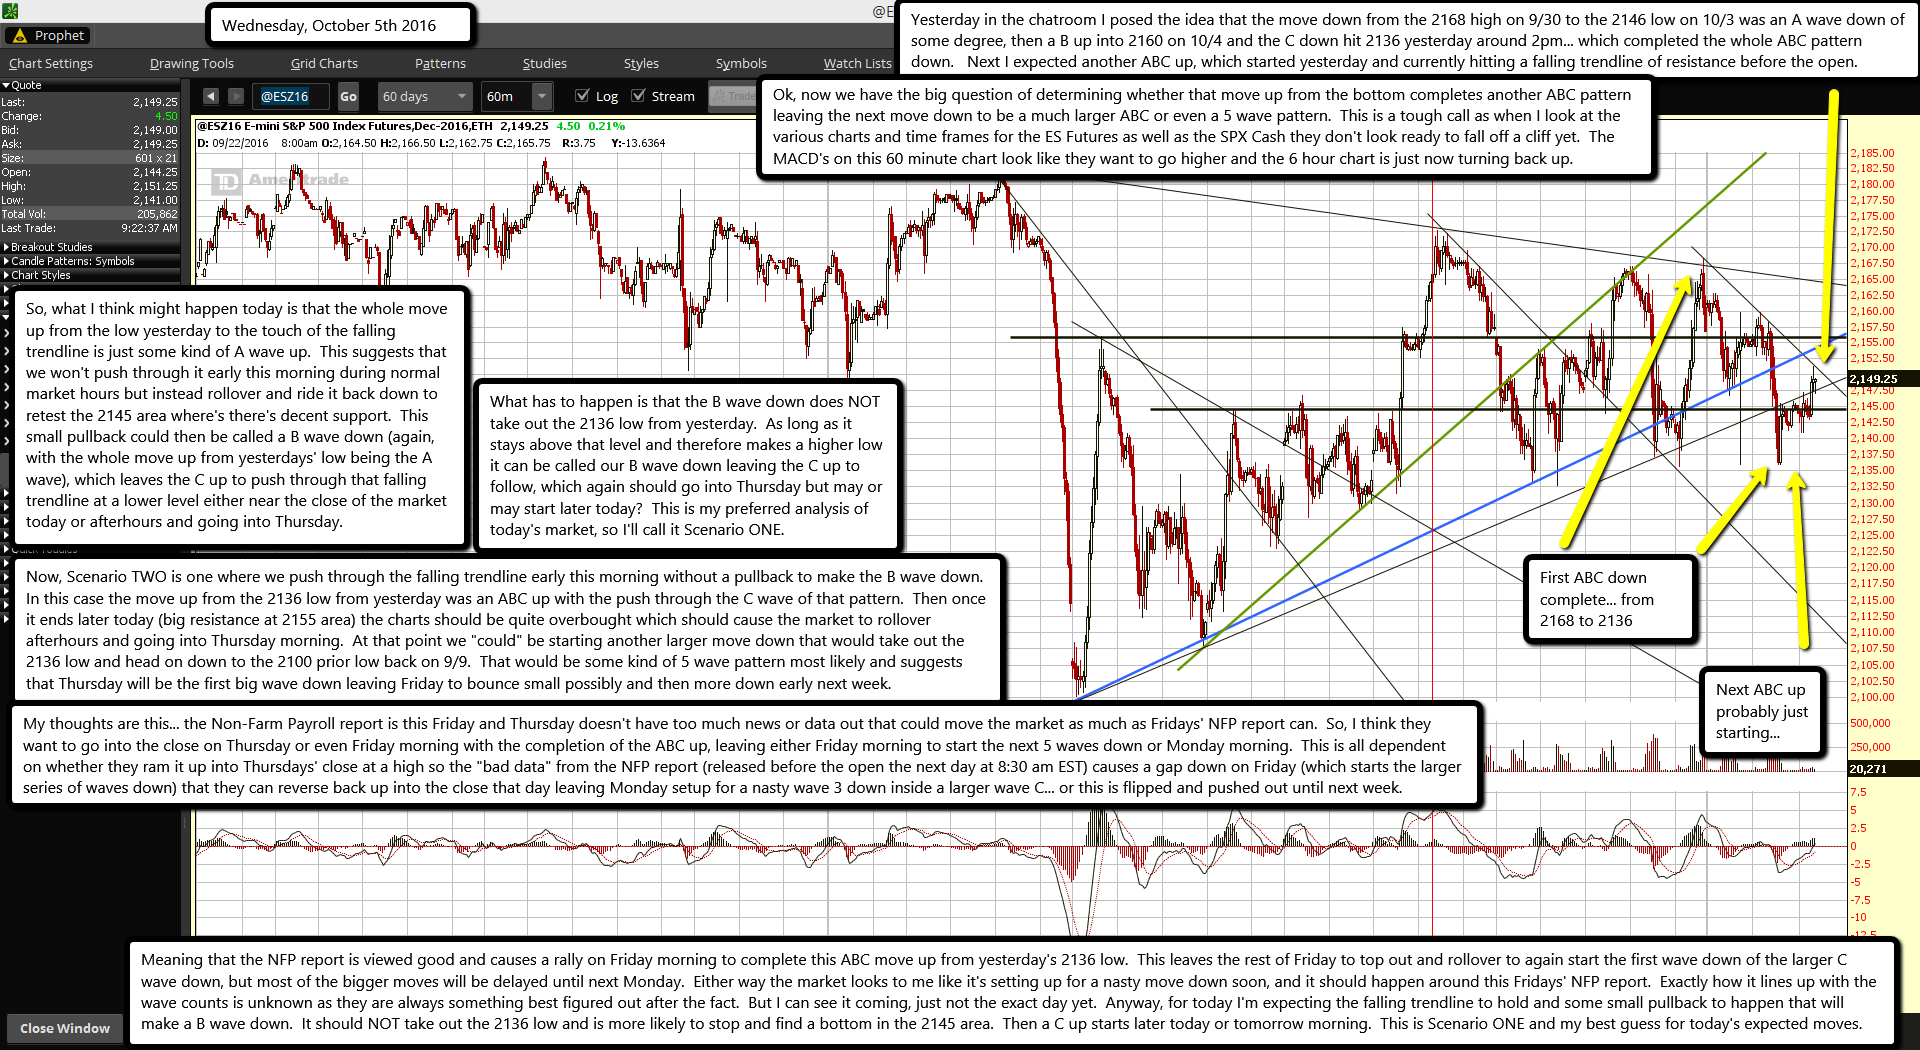
Yesterday in the chatroom I posed the idea that the move down from the 2168 high on 9/30 to the 2146 low on 10/3 was an A wave down of some degree, then a B up into 2160 on 10/4 and the C down hit 2136 yesterday around 2pm... which completed the whole ABC pattern down.   Next I expected another ABC up, which started yesterday and currently hitting a falling trendline of resistance before the open.

Ok, now we have the big question of determining whether that move up from the bottom completes another ABC pattern leaving the next move down to be a much larger ABC or even a 5 wave pattern.  This is a tough call as when I look at the various charts and time frames for the ES Futures as well as the SPX Cash they don't look ready to fall off a cliff yet.  The MACD's on this 60 minute chart look like they want to go higher and the 6 hour chart is just now turning back up.

So, what I think might happen today is that the whole move up from the low yesterday to the touch of the falling trendline is just some kind of A wave up.  This suggests that we won't push through it early this morning during normal market hours but instead rollover and ride it back down to retest the 2145 area where's there's decent support.  This small pullback could then be called a B wave down (again, with the whole move up from yesterdays' low being the A wave), which leaves the C up to push through that falling trendline at a lower level either near the close of the market today or afterhours and going into Thursday.

What has to happen is that the B wave down does NOT take out the 2136 low from yesterday.  As long as it stays above that level and therefore makes a higher low it can be called our B wave down leaving the C up to follow, which again should go into Thursday but may or may start later today?  This is my preferred analysis of today's market, so I'll call it Scenario ONE.

Now, Scenario TWO is one where we push through the falling trendline early this morning without a pullback to make the B wave down.  In this case the move up from the 2136 low from yesterday was an ABC up with the push through the C wave of that pattern.  Then once it ends later today (big resistance at 2155 area) the charts should be quite overbought which should cause the market to rollover afterhours and going into Thursday morning.  At that point we "could" be starting another larger move down that would take out the 2136 low and head on down to the 2100 prior low back on 9/9.  That would be some kind of 5 wave pattern most likely and suggests that Thursday will be the first big wave down leaving Friday to bounce small possibly and then more down early next week.

My thoughts are this... the Non-Farm Payroll report is this Friday and Thursday doesn't have too much news or data out that could move the market as much as Fridays' NFP report can.  So, I think they want to go into the close on Thursday or even Friday morning with the completion of the ABC up, leaving either Friday morning to start the next 5 waves down or Monday morning.  This is all dependent on whether they ram it up into Thursdays' close at a high so the "bad data" from the NFP report (released before the open the next day at 8:30 am EST) causes a gap down on Friday (which starts the larger series of waves down) that they can reverse back up into the close that day leaving Monday setup for a nasty wave 3 down inside a larger wave C... or this is flipped and pushed out until next week.

Meaning that the NFP report is viewed good and causes a rally on Friday morning to complete this ABC move up from yesterday's 2136 low.  This leaves the rest of Friday to top out and rollover to again start the first wave down of the larger C wave down, but most of the bigger moves will be delayed until next Monday.  Either way the market looks to me like it's setting up for a nasty move down soon, and it should happen around this Fridays' NFP report.  Exactly how it lines up with the wave counts is unknown as they are always something best figured out after the fact.  But I can see it coming, just not the exact day yet.  Anyway, for today I'm expecting the falling trendline to hold and some small pullback to happen that will make a B wave down.  It should NOT take out the 2136 low and is more likely to stop and find a bottom in the 2145 area.  Then a C up starts later today or tomorrow morning.  This is Scenario ONE and my best guess for today's expected moves.

ES Morning Update October 4th 2016

0

137cd3f3-cb62-404f-ab69-365bdf238c2f

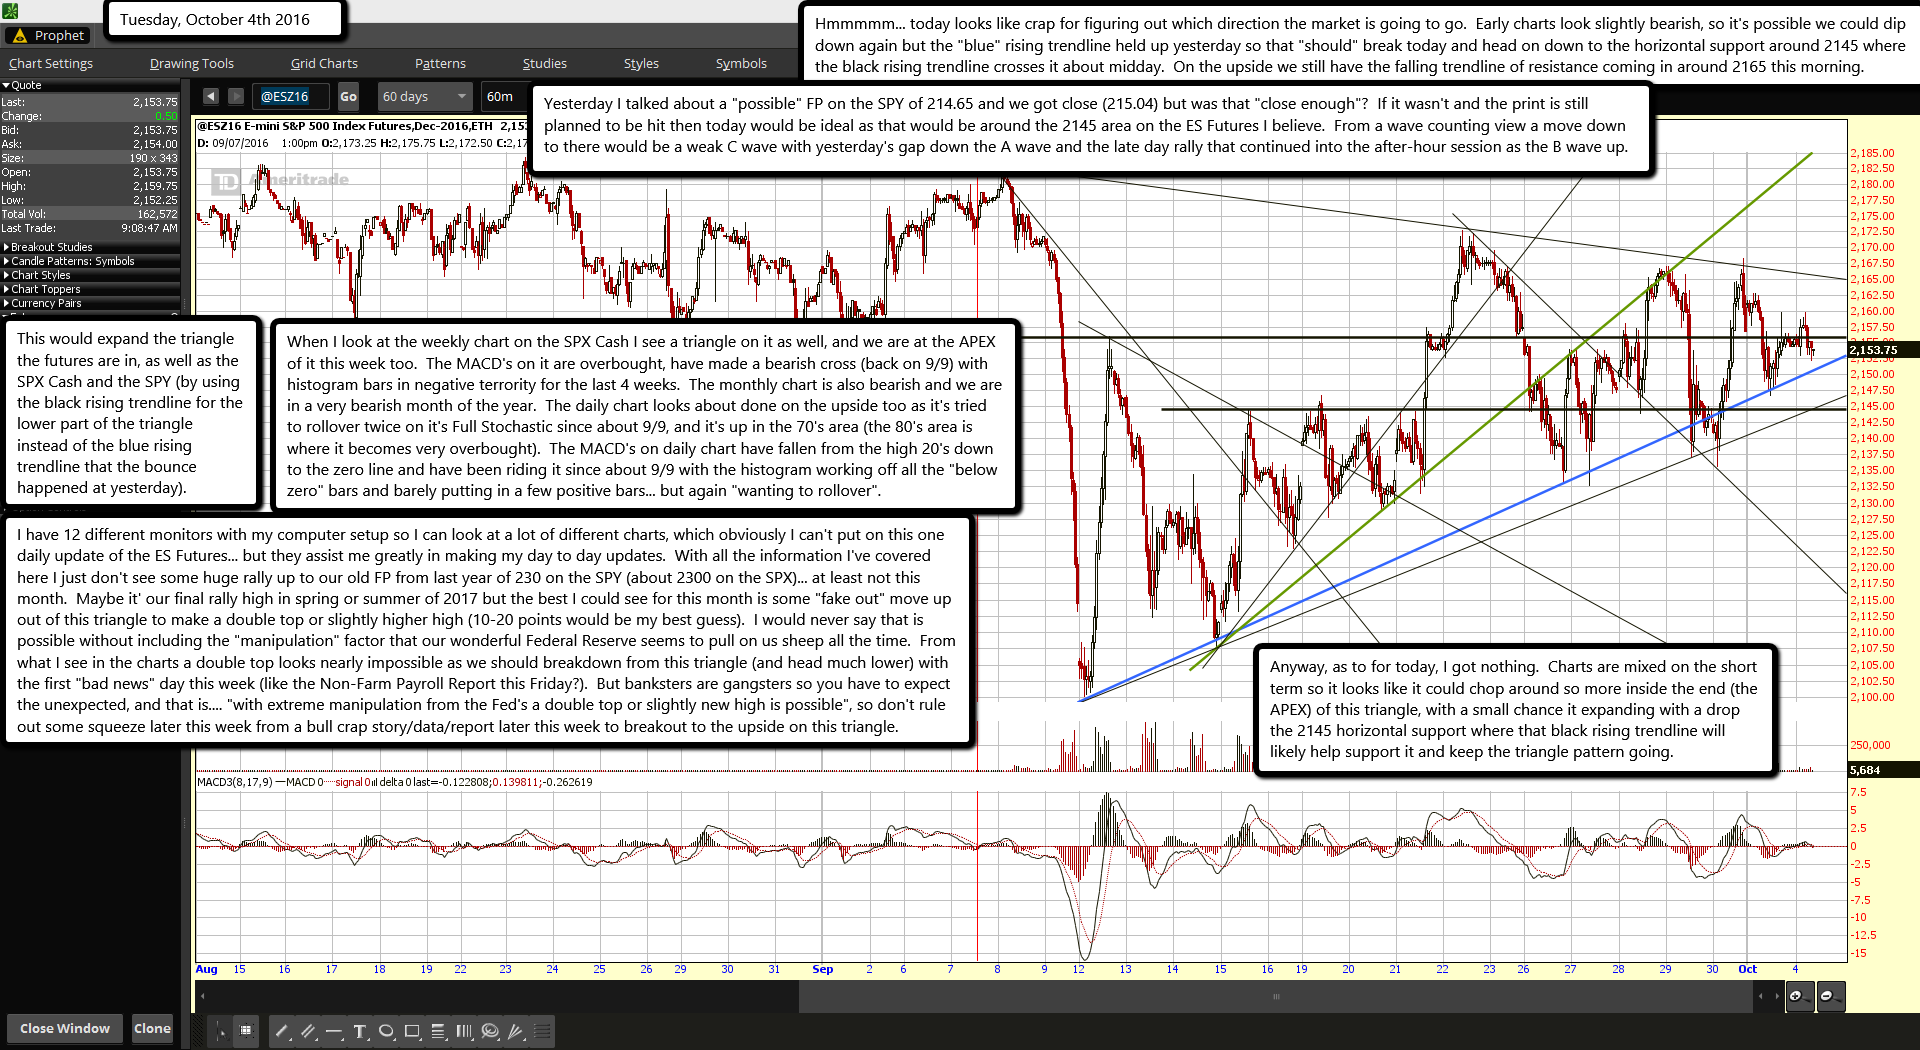
Hmmmmm... today looks like crap for figuring out which direction the market is going to go.  Early charts look slightly bearish, so it's possible we could dip down again but the "blue" rising trendline held up yesterday so that "should" break today and head on down to the horizontal support around 2145 where the black rising trendline crosses it about midday.  On the upside we still have the falling trendline of resistance coming in around 2165 this morning.

Yesterday I talked about a "possible" FP on the SPY of 214.65 and we got close (215.04) but was that "close enough"?  If it wasn't and the print is still planned to be hit then today would be ideal as that would be around the 2145 area on the ES Futures I believe.  From a wave counting view a move down to there would be a weak C wave with yesterday's gap down the A wave and the late day rally that continued into the after-hour session as the B wave up.

This would expand the triangle the futures are in, as well as the SPX Cash and the SPY (by using the black rising trendline for the lower part of the triangle instead of the blue rising trendline that the bounce happened at yesterday).

When I look at the weekly chart on the SPX Cash I see a triangle on it as well, and we are at the APEX of it this week too.  The MACD's on it are overbought, have made a bearish cross (back on 9/9) with histogram bars in negative terrority for the last 4 weeks.  The monthly chart is also bearish and we are in a very bearish month of the year.  The daily chart looks about done on the upside too as it's tried to rollover twice on it's Full Stochastic since about 9/9, and it's up in the 70's area (the 80's area is where it becomes very overbought).  The MACD's on daily chart have fallen from the high 20's down to the zero line and have been riding it since about 9/9 with the histogram working off all the "below zero" bars and barely putting in a few positive bars... but again "wanting to rollover".

I have 12 different monitors with my computer setup so I can look at a lot of different charts, which obviously I can't put on this one daily update of the ES Futures... but they assist me greatly in making my day to day updates.  With all the information I've covered here I just don't see some huge rally up to our old FP from last year of 230 on the SPY (about 2300 on the SPX)... at least not this month.  Maybe it' our final rally high in spring or summer of 2017 but the best I could see for this month is some "fake out" move up out of this triangle to make a double top or slightly higher high (10-20 points would be my best guess).  I would never say that is possible without including the "manipulation" factor that our wonderful Federal Reserve seems to pull on us sheep all the time.  From what I see in the charts a double top looks nearly impossible as we should breakdown from this triangle (and head much lower) with the first "bad news" day this week (like the Non-Farm Payroll Report this Friday?).  But banksters are gangsters so you have to expect the unexpected, and that is.... "with extreme manipulation from the Fed's a double top or slightly new high is possible", so don't rule out some squeeze later this week from a bull crap story/data/report later this week to breakout to the upside on this triangle.

Anyway, as to for today, I got nothing.  Charts are mixed on the short term so it looks like it could chop around so more inside the end (the APEX) of this triangle, with a small chance it expanding with a drop the 2145 horizontal support where that black rising trendline will likely help support it and keep the triangle pattern going.

ES Morning Update October 3rd 2016

0

d6d49e44-eba3-4f09-98a6-e19fa00ebbdf

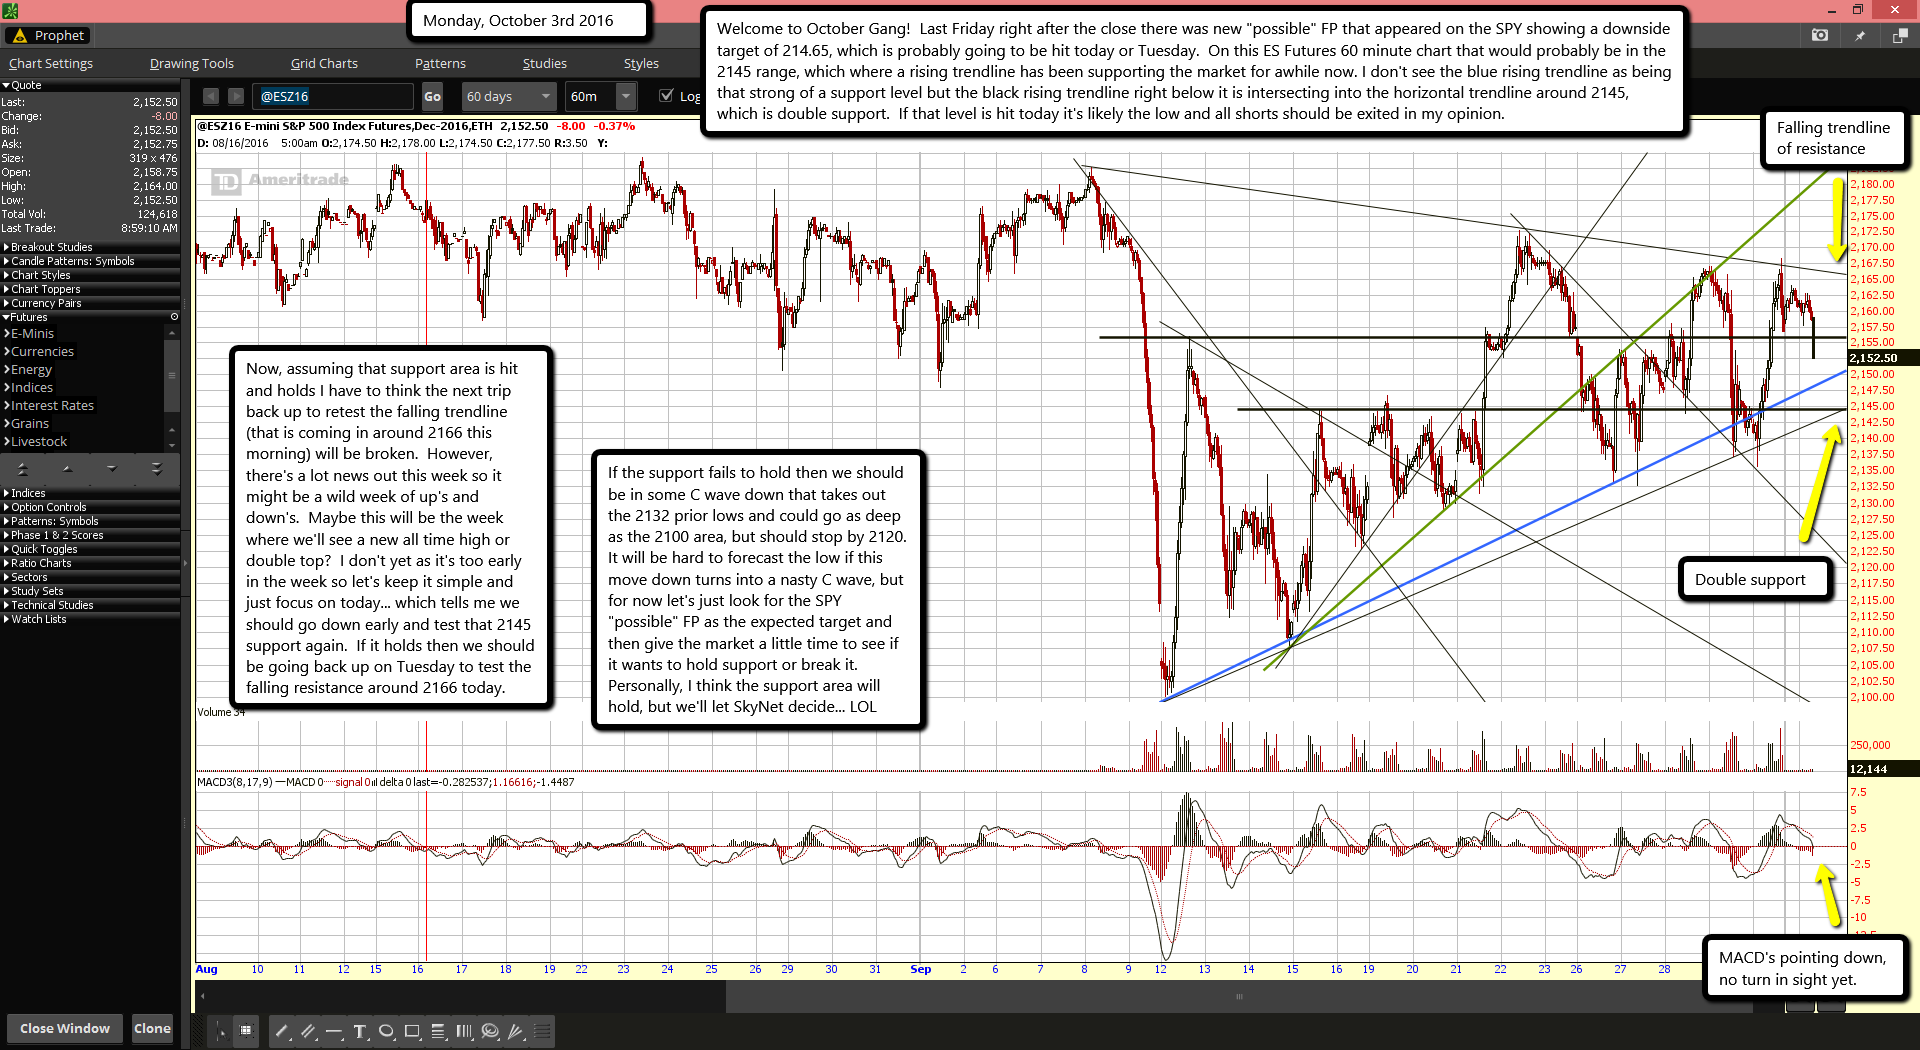
Welcome to October Gang!  Last Friday right after the close there was new "possible" FP that appeared on the SPY showing a downside target of 214.65, which is probably going to be hit today or Tuesday.  On this ES Futures 60 minute chart that would probably be in the 2145 range, which where a rising trendline has been supporting the market for awhile now. I don't see the blue rising trendline as being that strong of a support level but the black rising trendline right below it is intersecting into the horizontal trendline around 2145, which is double support.  If that level is hit today it's likely the low and all shorts should be exited in my opinion.

Now, assuming that support area is hit and holds I have to think the next trip back up to retest the falling trendline (that is coming in around 2166 this morning) will be broken.  However, there's a lot news out this week so it might be a wild week of up's and down's.  Maybe this will be the week where we'll see a new all time high or double top?  I don't yet as it's too early in the week so let's keep it simple and just focus on today... which tells me we should go down early and test that 2145 support again.  If it holds then we should be going back up on Tuesday to test the falling resistance around 2166 today.

If the support fails to hold then we should be in some C wave down that takes out the 2132 prior lows and could go as deep as the 2100 area, but should stop by 2120.  It will be hard to forecast the low if this move down turns into a nasty C wave, but for now let's just look for the SPY "possible" FP as the expected target and then give the market a little time to see if it wants to hold support or break it.  Personally, I think the support area will hold, but we'll let SkyNet decide... LOL

Deutsche Bank’s Clients Take Steps to Cut Exposure – Wall Street Journal

0

Some Deutsche Bank AG clients, among them several big and influential hedge funds, have moved to pull billions of dollars from the bank amid concerns about its stability and their exposure, said people close to clients and the bank.

The funds have taken steps to withdraw securities or cash from the bank, dial back their trading activities or both, the people said. They include AQR Capital Management LLC, Capula Investment Management LLP, Citadel LLC, Luxor Capital Group LP, Magnetar Capital LLC and Millennium Management LLC.

Shares in the bank dropped as much as 8% in early trading in Frankfurt on Friday before recovering to trade up 0.8% in the afternoon.

The bank’s U.S.-listed shares rallied nearly 7% in early trade.

Image result for Deutsche

The amount of assets recently withdrawn or earmarked for potential withdrawal is in the billions of dollars, one of the people said. That is a small piece of the hundreds of billions in balances analysts say Deutsche Bank has in its so-called prime-brokerage business alone—and a tiny fraction of its more than $600 billion in customer deposits overall.

Still, the retreat by clients is a sign of nervousness about Deutsche Bank’s ability to weather its challenges, some of which are specific to the bank and others wrought by economic conditions plaguing European banks as a group.

The client moves, which have mounted in recent days, don’t mean the hedge funds have stopped doing business with Deutsche Bank, but that they have taken steps to transfer some of their accounts, financing arrangements and trading to other banks as questions about Deutsche Bank’s capital position have intensified, the people said.

Bloomberg News reported earlier Thursday that some Deutsche Bank clients have moved derivatives holdings to other firms this week, citing an internal bank document.

“Our trading clients are amongst the world’s most sophisticated investors,” Deutsche Bank said in a statement. “We are confident that the vast majority of them have a full understanding of our stable financial position, the current macroeconomic environment, the litigation process in the U.S. and the progress we are making with our strategy.”

Beyond hedge funds, executives and salespeople also have tried to ease the concerns of investment-bank and wealth-management clients, people involved in discussions with the bank said.

John Cryan, the lender’s chief executive, was in New York this week, and met with clients amid a swirl of negative news about the bank.

Besides emphasizing Deutsche Bank’s creditworthiness and liquidity, executives and client-relationship managers this week told wealth-management clients, for example, that the bank’s operations aren’t affected by fluctuations in its stock price, the people said.

Several hedge-fund managers said their hands were being forced by their own investors’ drilling them about whether some of their holdings could get caught up at Deutsche Bank should the firm run into deep trouble.

Many said they were reminded of the 2008 financial crisis, when big hedge funds pulled accounts from prime brokers at firms like Bear Stearns, helping precipitate their decline. “That is at the back of everyone’s minds,” said one hedge-fund manager whose firm has dialed back its exposure to Deutsche Bank recently.

Deutsche Bank has repeatedly said those concerns aren’t justified. Banking analysts say that liquidity—the availability of ample, easy-to-sell securities and other funding to satisfy client obligations—isn’t a pressing problem: Deutsche Bank has more than €220 billion (about $246.8 billion) of liquidity reserves.

It also has a formidable backstop in the European Central Bank, which provides huge quantities of liquidity on permissive terms. Through an emergency program orchestrated by the ECB, national central banks in the eurozone can lend yet more—the Bank of Greece provided around €90 billion of emergency liquidity to Greek banks in crisis last year.

But the lack of a convincingly profitable strategy and waning shareholder confidence in the bank are big problems, analysts and investors say. Poor financial results and costly potential fines eat into the bank’s capital cushion, which is already thinner than many of its peers. Fears that the bank might be forced to raise capital, hurting existing shareholders by diluting their stakes, have weighed on shares. The decline in share price, in turn, makes it more difficult to raise fresh capital.

Deutsche Bank’s situation has been complicated by thorny politics at home. German Chancellor Angela Merkel and other government officials have faced relentless questions about their appetite for bailing out Deutsche Bank, should it need a rescue.

Ms. Merkel has for years taken a hard-line stance criticizing taxpayer bailouts of European banks, pressing southern European countries to impose losses on bondholders before taxpayer-financed rescues come into play. Post crisis European rules, many written at Germany’s instigation, make it hard for countries to sail to the rescue of a hometown bank.

Mr. Cryan this week said the bank has neither asked for nor needs a government bailout. A spokesman for Ms. Merkel said there was “no need for such speculation” about state aid for Deutsche Bank, responding to a German magazine report that Ms. Merkel had ruled out providing the bank with government assistance.

Deutsche Bank has been under pressure all year, the epicenter of continent wide worries about European banks’ performance and resilience in the face of a weak economy, low interest rates and flagging business.

The concerns picked up two weeks ago when The Wall Street Journal reported that the U.S. Justice Department floated the idea of Deutsche Bank paying $14 billion to settle a series of high-profile mortgage-securities cases. The bank responded by saying it had no intention to pay “anywhere near” that amount, and said its negotiations with the Justice Department were just starting.

The disclosure sparked fears that Deutsche Bank might have to mount a painful capital hike. Bank executives have repeated to investors, clients and employees—and publicly—that the lender has adequate capital and has no plans to sell shares.


Ex-Deutsche Bank Executives Among 13 Charged in Paschi Probe

Six current and former managers of Deutsche Bank AG -- including ex-asset and wealth management head Michele Faissola -- along with former executives at Nomura Holdings Inc. and Banca Monte dei Paschi di Siena SpA were charged in Milan for colluding to falsify the accounts of Italy’s third-biggest bank and manipulate the market.

A judge in Milan approved a request by prosecutors to try 13 bankers on charges over separate derivative transactions Paschi arranged with the securities firms, said a lawyer involved in the case, who attended the closed-door hearing Saturday, where the decision was announced.

The charges deal another blow to Deutsche Bank, which is seeking to reassure investors and clients that it will be able to withstand pending U.S. penalties over the bank’s sale of mortgage-backed securities and its dealings with some Russian clients. Monte Paschi, the world’s oldest bank, restated its accounts and has been forced to tap investors twice to replenish capital amid a surge in bad loans and losses on derivatives. It’s now attempting to convince investors to buy billions of soured debt before a fresh stock sale.

Deutsche Bank’s shares have slumped 49 percent in Frankfurt this year, swinging wildly last week on news that hedge-fund clients withdrew some funds. Monte Paschi has dropped 84 percent this year amid concern it will struggle to restore profitability and strengthen its finances.

‘No Responsibility’

“We will put forward our defense in court and have no further comment to make today,” Deutsche Bank said in an e-mailed statement.

“I’m convinced that the debate will definitely show that Nomura has no responsibility over Monte Paschi’s false accounting,” said Guido Alleva, a lawyer for Nomura. A spokeswoman for the Japanese bank and a Paschi spokesman declined to comment.

The charges culminate a three-year investigation by prosecutors that showed Monte Paschi used the transactions to hide losses, leading to a misrepresentation of its accounts between 2008 and 2012. The deals came to light in January 2013, when Bloomberg News reported that Monte Paschi used derivatives struck with Deutsche Bank to mask losses from an earlier derivative contract dubbed Santorini.

Faissola, whose roles included overseeing rates and commodities, was put in charge of Deutsche Bank’s combined asset and wealth management division in 2012 when Anshu Jain and Juergen Fitschen took over as co-chief executive officers of the Frankfurt-based lender. Deutsche Bank last October said Faissola would leave after a transition period, and John Cryan has replaced Jain and Fitschen as CEO.

Former Deutsche Bank managers Michele Foresti, who oversaw rates and European credit flow trading, and Ivor Dunbar, former co-head of global capital markets, also were also indicted.

Monte Paschi’s former executives Giuseppe Mussari, Antonio Vigni and Gianluca Baldassarri and Nomura’s former bankers Sadeq Sayeed and Raffaele Ricci also will face trial for allegedly obstructing regulators after the investigation revealed that the 2009 deal, dubbed Alexandria, was designed to disguise losses from a previous investment.

Monte Paschi asked for a plea-bargain agreement in July. The lender said at that time that the request was agreed to with prosecutors in the Milan investigation, and if accepted by the judge the bank will need to forfeit 10 million euros ($11.2 million) and pay a fine of 600,000 euros. A decision is expected on Oct. 14.

Deutsche Bank’s Dario Schiraldi, Matteo Vaghi and Marco Veroni as well as Monte Paschi’s Daniele Pirondini and Marco Di Santo will go to trial, which is scheduled to begin on Dec. 15.

U.S.: Wells Fargo illegally repossessed 413 service members’ cars

0

Wells Fargo will pay $24 million to settle allegations that it mistreated members of the military -- including illegally repossessing their cars.

The bank, already reeling from a scandal over fake accounts, will pay $4.1 million to settle Justice Department charges that it seized 413 cars owned by service members without a court order, a violation of federal law.

The Justice Department said the illegal repossessions took place from 2008 to 2015. The first complaint came from an Army National Guardsman in North Carolina who said the bank seized his car while he was preparing to deploy to Afghanistan.

Wells Fargo then auctioned his car and tried to collect a balance of $10,000 from his family, the Justice Department said.

The bank will pay $10,000 to each of the affected service members, plus lost equity in the cars with interest, and repair their credit.

The bank was fined $20 million more by the Office of the Comptroller of the Currency for breaking three provisions of the same law by denying members of the military certain banking protections, including capping their interest rates at 6%. Those violations began in 2006, the OCC said.

Wells Fargo said in a statement that it apologizes for not living up to its commitment of ensuring that all service members "receive the appropriate benefits and protections."

"We have been notifying and fully compensating customers and will complete this work in 60 days," the company said.

News of the penalties came as Wells Fargo and CEO John Stumpf faced the wrath of the House Financial Services Committee at a hearing about the millions of fake bank and credit card accounts, plus claims that it retaliated against whistleblowers.

The company is also facing lawsuits from shareholders, former employees and customers.

ES Morning Update September 30th 2016

0

7ea839f2-52b2-407f-acdb-5eec91fda7cd

Let's start today saying "Shame on you SkyNet for doing my expected move early"... LOL!  On yesterdays' update I said that we were likely having some kind of wave 1 down at the open and that I expected a wave 2 back up the rest of the day and into the close, whereas the wave 3 would happen today.  But we had the wave 2 up around 10 am yesterday to make a high of 2165.75, which was just below Wednesdays' 2167.00 high... and that turned out to be our wave 2 up.  Then the wave 3 down I was expecting for today happened yesterday right after that 10 am high, which bottomed at 2137.25 around 1 pm, then a powerful bounce happened that rallied to a 2153.75 high followed by another move lower into the close.  Early this morning around 3 am we see a new lower low of 2135.75, which should be the 5th wave down to end this whole 5 wave series from the 2167.00 high on Wednesday.

Today we should see the start of a new 3 wave series or an ABC up.  This first rally up from the open should be the A up, and the B down should follow at some point today I believe.  Then the C up would be left for next Monday or after-hours over the weekend?  After that completes we should see another 5 wave series down that should go to retest that 2100 area.  This is first scenario and my preferred count.  It can only be accurate if the rally up for the ABC between today, this weekend and Monday doesn't take out the 2167.00 high on Wednesday.  If that happens the wave count is wrong completely.

Scenario two (if 2167.00 gets taken out) is that whole series of 5 waves down from the Wednesday high to this mornings' low is a larger wave 4 down and that the move up starting today is a larger wave 5 up.  However, most wave 2's and 4's only have 3 waves in them (ABC), not 5 waves like yesterday.  But I will note that while the ES Futures had 5 complete waves the SPX/SPY only show 3 waves, or an ABC down.  Meaning it is possible, but doesn't seem to have high odds considering other factors.  One of which is that we are in the month of October, which is where many crashes happen... not too bullish there.  There's the SPX Cash charts on the 60 minute, daily and weekly that all show negative divergences in overbought areas.  It doesn't mean for sure that they can't get more overbought an make a new squeeze higher... maybe a new all time high even?  But it does make it harder.  So Scenario two is possible, and should be watched closely if that 2167 level is taken out.

So, the things to look for today are early weakness or strength.  If this first wave up this morning is strong and gets anywhere in the 2160-2165 area it should top out and allow the wave down later (into the close probably) to happen.  I'd be a little worried if it did that, unless the wave down was strong too and retested the 2145 zone (but of course didn't break this mornings' 2135 low).  A strong up and weak down would make me feel like the next up would be even stronger and would take out 2167 and therefore make another run for a new all time high over the weekend and early next week.  This would be Scenario two where the move up from 2135 starts a 5th wave up to new highs with the Wednesday 2167 high to today's' 2135 low was some 4th wave down.

Now, if the wave up is strong (again, maybe topping in the 2160-2165 area) and the wave down is strong (like the 2145 area but not below the 2135 low) then that leans more toward an ABC wave pattern up with the A up and B completing today and C up to stay just under the 2167 high to happen over the weekend and/or Monday morning.  Again, this is going to be a day where you have to just "feel" the strength or weakness in the market to have a better chance at forecasting the next big move.  I'm leaning toward Scenario one but I'm no fool as if I see 2167 taken out then the bear squeeze could be on and a new all time high is on the way.  Oh, of course if the wave up this morning at the open is weak and the wave down is weak... meaning we chop around a lot today, then that should setup the wave C up into Monday, which again shouldn't take out 2167 and would then be the first Scenario.

Here's another reason I think we'll see the first Scenario isn't of the second... the oil news trick!  On Wednesdays' update I was talking about a possible wave 3 or C up to happen that day.  We chopped around almost all day and I was beginning to think I was completely wrong.  But then around 2 pm we saw a big squeeze start that took out the 2155 resistance and rallied into the close hitting the 2167 high.  At the same time oil rallied hard, along with all the oil stocks, which make up the DOW, SPX, etc... meaning the oil move rallied the SPX up too.

Why did this happen you ask?  We'll I saw a wave 3 or C setting up for that day so I was expecting it, but in order it to happen our government needed to release some "well timed" news story about oil production cuts from OPEC... how conveniently released!  LOL!  It's always in the charts beforehand, and the news is timed to be released when the setup appears.  However, while oil ripped up on Wednesday creating the squeeze on the SPX at the same time you'll notice that Thursday morning oil make another higher high around 10 am then it's close on Wednesday while the SPX Cash and the ES Futures only made a lower high... aka, the wave 2 up that topped at 2165.75 and then setup the nasty wave 3 down right afterwards.  This tells me the oil story isn't strong enough to keep a rally in the SPX going as it must have used up all its' energy squeezing out shorts on Wednesdays' late day rip.  That's just another thing to think about when guessing on whether Scenario one or two is in play today and into Monday.  Either could happen and you now know what to look for...

ES Morning Update September 29th 2016

0

1be7c4e4-306c-4cf6-9d28-47fd5e5069ed

Ok guys, yesterday I speculated on some kind of wave 3 or C wave up that should develop and take us up to the falling trendline that was coming in around 2167, and I thought the 2145 support area would hold on a move down.  Both of those things happened but I have to admit I was having my doubts as the move up didn't start until late in the day.

Anyway the move up didn't quite reach the falling trendline as it got stopped by the rising trendline (in green) around 2165 or so.  This morning we see that the futures climbed a little more after-hours and have rolled over this morning and dropped back to horizontal support where it appears to be bouncing from a little right now.

Alright here's the new speculate... we rally back up a little today to either retest the overnight high (2167), make a slightly higher high or slightly lower high, and that completes the rally from the 2133 low.  Now, if it's a higher high then the move up yesterday was some kind of wave 3, the move down this morning was a wave 4 and the up move later today would be the wave 5... which probably started at the 2133 low on 9/27, and all 5 of those waves are some larger C wave up.  If on the other hand we make a lower high later today then the overnight high of 2167 ended the entire rally from the 9/26 low of 2133, with that first move up to 2154 being some larger A wave up, then down to 2133 on the 9/27 for the larger B wave down and the entire rally from there until last night's high being the larger C wave up.  That means this current move down this morning is some kind of smaller wave 1 down and the lower high later today the smaller wave 2 up.

Ok, as you can see either wave count suggests a move down on Friday with the "higher high" scenario leaving Friday open to create the smaller wave 1 down and smaller wave 2 up and close out this week looking pretty good for the bulls (still down on Friday though, just not huge).  The other scenario of a "lower high" implies Friday will have the smaller wave 3 down and that could easily take us to revisit the horizontal support around 2145 and the rising blue trendline around the same level currently.

On the larger picture... the 9/9 drop was probably some large A wave down and the entire rally up to the 2171 high on 9/22 was likely a large B wave up.  That means we are in the larger C wave down currently and its' first wave 1 down ended at the 2133 low on 9/26 and this entire move up from there is just a wave 2 inside that larger C wave down.  This wave 2 up has broken down into many smaller waves as I've already covered.

What's next is the start of a wave 3 down (which should breakdown into 5 smaller waves) that's inside a large C wave down.  When completed this wave should be some multiple of its' A wave down, which was about 82 points (2182 high to 2100 low).  The multiple's for C waves are common Fibonacci numbers like 1.0, 1.618, 2.0 and 2.618 (others too of course but those extension are most common).  So, if C = only a 1.0 extension then a drop from say 2167 would take us to 2085.  If C = 1.618 of A then that's 132 points down or 2035.  I won't do the 2.0 and 2.618 as those numbers are quite scary.

The only wildcard here that will those these wave counts out the window is if we take out the 2172 high on 9/22, which simply means we are still in the large B wave up and haven't started the C wave down yet.  Of course if we take out the 2182 all time high then all the wave counts are wrong.  So for today we bears want a rally into the close to stay under 2172 and preferably under 2167 too... but as long as 2172 isn't taken out we have a very nice looking short coming.  The depth of it's first move on Friday will be determined by the "higher high" or "lower high" move up today.

If we don't bounce today but instead drift lower into the 2155 support area (or deeper, like into the 2145 zone) then I would not chase it as it would likely just be a wave 1 down and then the wave 2 up should happen on Friday, where I'd want to short for the best entry.  But I think we'll make our wave 2 up later today into the close setting Friday up for a nice fall.  Bottom line is... wait for the bounce to short at.

Deutsche Bank shares plummet to record low as Merkel rules out bailout

0

Shares in Germany’s largest bank have hit rock bottom on Monday as Chancellor Angela Merkel reportedly refused to provide Deutsche Bank state aid in its legal battle with the United States Department of Justice (DoJ).

© Kai Pfaffenbach
Deutsche shares fell as much as six percent to €10.67 in early Monday trading, the worst performance since 1992.
The bank has lost over 52 percent of its value since January and over 56 percent in the last twelve months. Earnings per share fell as much as €6.

The collapse has been prompted by a report in the German magazine Focus that said Chancellor Angela Merkel has ruled out any state assistance for the bank next year.

Merkel also declined to provide help to Deutsche Bank in its legal battle with the DoJ. The Frankfurt-based lender may be fined up to $14 billion over its mortgage-backed securities business before the 2008 global crisis, the magazine reported. The article said Merkel made her views clear in talks with Deutsche CEO John Cryan.

Deutsche Bank has denied that Cryan asked for state support from Berlin, CNBC reported on Monday.

The Bundestag expects a “fair outcome” to the US probe, the Finance Ministry said on September 16. The bank has refused to pay the US government and is seeking a reduced penalty. Deutsche has said a settlement between $2 billion and $3 billion would be more reasonable, as it had already paid $1.9 billion in 2013 to settle similar accusations, the Wall Street Journal reported in September.

If the settlement ranges from $3 billion to $3.5 billion, it would leave room to settle other legal issues, while any additional $1 billion fine would erode 24 basis points in the bank’s capital, JPMorgan Chase said.“Clearly headlines around the DoJ settlement and those $14 billion continue to weigh on the stock,” Daniel Regli, an analyst at Main First, said in an interview with Bloomberg.

“Nobody believes that they will end up paying that amount, but for some investors it might be a concern that even the German government is discussing Deutsche Bank’s situation," the analyst added.

The Deutsche Bank stock sell-off has affected other banks on Monday morning, with all lenders on the Euro Stoxx bank index losing. The index was down 1.74 percent.

European markets were sharply lower as well, as France’s CAC 40 was down 1.8 percent, while Germany's DAX was off 1.5 percent and London's FTSE 100 was 1.2 percent lower.


Deutsche Bank refuses to pay $14bn US penalty

Germany’s biggest bank says it won't pay a $14 billion US Department of Justice (DoJ) fine for selling mortgage-backed securities that contributed to the 2008 financial crisis.

“Deutsche Bank has no intent to settle these potential civil claims anywhere near the number cited. The negotiations are only just beginning. The bank expects that they will lead to an outcome similar to those of peer banks which have settled at materially lower amounts,”Deutsche Bank said in a statement on Friday.

The Wall Street Journal reported the DoJ is demanding $14 billion in compensation to settle a set of high-profile mortgage-securities probes stemming from the financial crisis.

The bank’s spokesman confirmed in July settlement negotiations were underway, but the size of the potential penalty was unknown before today.

The amount is almost equal to Deutsche’s market cap. As a result, the share price of the German bank plummeted over eight percent on Friday, dragging the country's stock market half a percent lower. Friday's slump added to the 45 percent drop in the bank's stock since January and a 53 percent slump over the last twelve months.

View image on Twitter

Bank of America paid $17 billion to settle a similar probe in 2014. Goldman Sachs agreed to reimburse $5.1 billion earlier this year over troubles with mortgage-backed securities that were sold to investors as high-quality debt.

In 2014, the DoJ demanded Citigroup pay $12 billion for selling low-grade mortgage-backed securities, but the fine was cut to $7 billion.

Barclays, Credit Suisse Group, UBS and Royal Bank of Scotland face similar investigations and could also be penalized by US authorities.

s2Member®