Sunday, May 11, 2025
Home Blog Page 15

ES Morning Update March 4th 2024

0

We got the rally last Friday to the 5146 level from my short term Fibonacci Extension Target, which I'm going to abbreviate to just FET going forward. Now looking back in time from my post I did on the 161.8% extension it's common to see exactly what we saw last week. What I mean is that there was a run up to "almost hit the FET", then a small pullback, and final a hit and pierce of the FET.

We saw that happen last week with the first high of 5123, which was the one that fell shy, then the pullback, and finally the rally up to pierce the FET of 5146 on Friday. Now that was a short term FET, and since that pattern has completed now we should pullback some early this week before the next rally up to the next FET of 5190, which is close to another FET at 5225, so somewhere in that zone would be the next high before another small pullback or pause happens.

The levels that I calculated those price points from, (chart above), for the FET of 5190, was using the 4866 low on 1/31/24 to the 5066 high on 2/12/24, which projects a 161.8% extension high of 5190. The other FET of 5225 was calculated from the 2/21/24 low of 4959 to the recent high of 5123 on 2/23/24.

Those two are close to each other so somewhere in that range would be the next upside zone where the rally expected next week should end at and pullback or pause again. Meaning we should "pause" Monday and/or Tuesday of this week (possible pullback to 5110 or less?) and then start the next move up for the two FET's at 5190-5225 the rest of the week.

That should take us into the week of OPEX (next week), which is where the pullback for Small Wave 4 should happen.  That would leave Small Wave 5 up into the following week, and interestingly we have an FOMC meeting on Wednesday, March 20th... right in front of the turn date on March 22nd. Very nice timing for sure.

My best guess would again be to see a "pause" on Monday and Tuesday that week (18th/19th), and then a last squeeze back up into Friday the 22nd to reach the biggest FET I have, which was calculated from the 3502 in October of 2022 and the 4634 high on 7/27/23, which projects a 161.8% level of 5334. That... in my opinion is "The Big ONE", and should be the point where we see a nice pullback of 300-500 points from.

I'm thinking it will complete a Large Wave C (or 3?), which should produce a 5-10% pullback (if L3) or "the top" if LC... which would mean a much, much larger drop. I don't think it will be that way because I don't see any negative divergence yet on the weekly chart, but there's really no way to know until it happens. Here's my new adjusted wave count...

The big thing I've changed is that I removed the Tiny Waves 1-5 and just marked them as Small Waves. It suggests the 5066 high on 2/12/24 ended Small Wave 5 up, and Medium Wave 3 up. Then the pullback afterwards completed Medium Wave 4, and now we are in Medium Wave 5 up, which will have five small waves inside it.

My best guess is that we started Small Wave 3 up inside Medium Wave 5 last Friday, and that it will end in the 5190-5225 zone. Then a small pullback for Small Wave 4 the first couple of days next week, and the final Small Wave 5 up into Friday, March 22nd. That should complete Medium Wave 5, inside Large Wave C (or 3?) which is where the best sell should come from.  Here's a close up of the waves...

I think that on Friday we started Small Wave 3 up inside Medium Wave 5, which probably will end by this Friday.  The small intraday pullback on Thursday was likely a Tiny Wave 2, with Tiny Wave 3 up afterwards.  Any pullback today should be Tiny Wave 4, then Tiny Wave 5 should reach the 5190-5225 zone.

It's at that point where we could see a similar choppy sideways pullback the first 2-4 days of next week for Small Wave 4 that could look like Small Wave 2 did from it's 5123 start on 2/23 to the 5060 low on 2/29... only it will be shorter in time I think.  It should be the move into the FOMC next Wednesday the 20th.  Then something Powell says can be blamed for the final rally up into Friday toward FET of 5334.39 to complete all the waves.

The drop afterwards could be a large one.  I don't know how much but could be something similar to the July top (LA or L1) down to the October low (LB or L2).  That drop was from 4634.50 to 4122.25, which was a 11% pullback.  If we reach 5334.39 then 11% would be 590 points down roughly.  I doubt if it repeats like that but it's something to remember.  I lean toward 300-500 points at most.  We'll see.

Have a blessed day.

ES Morning Update March 1st 2024

0

We got an early pop yesterday after the PCE data came out, which really wasn't important but the market was setup for a move up and it just used that data as a catalyst to rally. But it failed to hold and dropped back to negative midday after that 20 point pop, and then it went back up into the close to around the same zone.

The market is close to a bottom as that pop and retrace was back test of the falling channel the market has been in since the high. This tells me that today or Monday we should see another multi-day rally of 100+ points. Possibly it starts today, it's hard too know for sure? We got close to the 5050 zone yesterday with a hit of 5060, which might be "close enough", suggesting any pullback today might be just a higher low.

I posted the chart above in the chatroom yesterday, which is a fake print on the QQQ, and low and behold it was hit and pierce around the open before a reversal back down midday, so it was a "signal" that it would be a point of interest where the market would hit and turn from.

Over the many years of tracking FP's I've noticed that the intraday one's don't have any edge for them hitting and reversing back down for days or weeks. They can hit and pause, and the go further in the same direction, or hit and reverse for only an intraday move like yesterday... and then continue in the same direction. The only thing I use them for is to exit positions I'm in that are based on the technicals.

Moving on... another strong rally is close and should go into next week. We should hit my 5146 target, possibly pause there and pullback some. It will be a point to exit longs and wait for a better entry from another move down I think. But I'll have to wait to see how the technicals are when we get there, as it might reach the next target of 5190.

Now as far as wave count goes, if we bottomed yesterday, then that should completed Small Wave 4, which means we are in Small Wave 5 up now. Wave fives can go any amount. They can truncate short, extend to be longer then the wave three, match the wave one... pretty much any amount.

My feeling on it are that we have a target of 5146 with my Fibonacci Extension System, which is the shorter and closer one. Then there's another higher one at 5190, so one of those zone would be a likely top for the coming rally that I'm calling Small Wave 5 right now. If that count is correct then it will complete Medium Wave 3, and from there we should see a decent pullback of 3%+ I'd think.

We have Jay Powell speaking next Wednesday, so possibly we rally up into that date and he causes some small panic for that Medium Wave 4 pullback? But it shouldn't start the bigger pullback I think as it should be followed by Medium Wave 5 up into late March, like "possibly" the 22nd? If that happens we'll complete either a Large Wave C or 5, and with the C the market will have topped and we'll start the bear market.

But I lean toward the 5 because there's no negative divergence on the weekly chart yet, therefore a 5-10% pullback for Large Wave 4 would be more likely. Then a final rally for Large Wave 5 into late summer. Below is a chart I posted in the chatroom yesterday showing that divergences.

It's never a guarantee that we MUST have a negative divergence but usually we have one. Something that could cause that not to happen would be some kind of event (another false flag?), which then we'd get another drop like the COVID crash in 2020. I have no way of knowing if that's going to happen or not, so I will just place my short with the mindset that we will only get a 5-10% pullback, and if it turns out to be more then I'll adapt. We'll cross that road when we get there. For now let's just see if we get the rally up to 5146 or 5190 the next few days.

Have a great weekend.

Have a blessed day.

ES Morning Update February 29th 2024

0

More chop yesterday with a drift lower. It's getting close to the 5050 support zone now, and the RSI is working its' way down closer to oversold. It doesn't have to reach oversold of course as in strong up trends it doesn't get buried below the 30 level, so a bottom is very close now.

It could happen today or it could have been yesterday, but after that I do expect a rally up next week with the target of 5146 for the short term and 5190-5225 ultimately. I'll have to see where the technicals are once the first lower upside target is met, as that might be all we get on the coming rally before another pullback like the current one happens.

It's hard to say until we get there first, and how long it takes to get there is important to as "time" for the strong bullish period the first week of March. If there is enough time left then we could reach the higher level, but if it takes all of next week to reach the lower target then time will run out and we should pullback again the week of OPEX prior to those higher levels being reached.

And while I want to see the March 22nd turn date produce a high that's not known at this point as it could be a bottom? Right now though it does look possible to play out, which will either be the end of Medium Wave 3 (meaning Medium Wave 4 be the pullback, which might just be 3-5%) or the Large Wave C (or 3?), which would should result in a larger pullback, like 5-9% possibly.

Have a blessed day.

ES Morning Update February 28th 2024

0

Pretty much as expected yesterday... a little lower throughout the day and then up into the close.  That bounce was likely a B wave, which clearly ended as we are back down again this morning.  So I have to think we are now in the C wave down of Small Wave 4 and will finish soon, probably in a day or so.

Then we should start Small Wave 5 up to complete Medium Wave 3, which might end by the end of next week? If so, I'd look for Medium Wave 4 to play out during the week of OPEX, which should be followed by Medium Wave 5 up into the turn date on March 22nd.  This is the ideal path but we all know the market rarely plays out like you want it, so I'll just adjust as we go forward.

As for today, I think the upside is limited as we appear to be in a C wave as I said, but it should end today or tomorrow and then we start back up.  My target is 5190-5225 to complete Medium Wave 3.

Have a blessed day.

ES Morning Update February 27th 2024

0

We started the pullback yesterday, which was mostly into the close. I do not know how low it will go as it could be finished now, but the 5050 zone is an important support that would be ideal for a long. However, with yesterday and Sunday being a "turn window" I decided to take a chance and just re buy my previous longs at a cheaper price.

We might go down to that 5050 zone, but if it happens I'll just ride it out as I still think we will rally up into the next turn date on March 22nd. For me, I'm just trying to get another good entry on the longs, which I did, but nailing the exact best spot is impossible. Not much else to add here as the overall trend is still up and that's how I'm trading it.

Have a blessed day.

ES Morning Update February 26th 2024

0

Last Friday played out pretty much as expected, which was a follow through to the upside in the morning and fade back to flat by the close. I said last week that if this happened we would have completed Tiny Wave 1 up inside Small Wave 3, inside Medium Wave 3.  It's always a "best guess" on the smaller degree waves, so I'm going to re-adjust them a little because of how much time is left before the next major turn date on March 22nd (which obviously isn't very much).

I think that early this week we should pullback to around 5050 on the ES.  And since this entire week is normally a bearish period according to the Seasonality Chart, we could see a full week of range-bound moves to shake out both bulls and bears before we start the next trend move up.

Many subdividing waves might be the plan inside these Tiny Waves while the short term overbought charts reset. So even if we put in a low of say 5050 on Monday it could be revisited later in the week to make a higher low of a few points, which would be (again) to shake out bulls and lure in bears. It's the first week of March that is bullish, so that should be where the market starts another squeeze higher I think. Here's the wave count with the new adjustments...

My short term upside target is around 5225, which is based off my 161.8% system, whereas I'm assuming we'll pullback to 5050 this week to allow me to get a projection from the 4959 low on 2/21 up to the 5123 high on 2/23 that would make "the A leg" part of the ABC pattern, which I covered on my weekend update post about the 161.8% extension last weekend.

These "legs" are not my Elliottwave count, but I had to give them some kind of name, so I'm calling them A, B, and C legs to make and complete a pattern. Here's that chart below...

Again, that's not a wave count.  It's just a short term target (probably the first week of March) that once hit will complete a 161.8% pattern.  This pattern can repeat over and over until the end of the multi-month or year rally ends.  When that happens we'll get a big selloff of course, that flips us from a bull market to a bear market... meaning the 200 SMA is lost.

That's not happened yet, so currently I will continue to look for this pattern to give higher highs.  The "shot across the bow" will be when we get 5-9% pullback, like all of those in the past that I covered on that Fibonacci Extension post, as over the past 20 years pullbacks of that percentage usually produced just one more higher high before the market flipped from the bull market rally to a bear market correction.

In conclusion I'm looking for this week to have a choppy downward bias with 5050 as support.  And next week I'm expecting another rally up toward my 5225 target.

Have a blessed day.

ES Morning Update February 23rd 2024

0

The market continued to squeeze higher yesterday putting in a 100+ point move and making a new all time high. Looking back at different wave counts I've done I think the one that we are most likely on right now is the Extended Alternative Bullish Wave Count - February 18th 2024.

On that chart I have Medium Wave 1 topping on 12/29 at 4841, then M2 bottoming on 1/5 at 4702, which puts us inside a Medium Wave 3 up from that low. Small Wave 1 up ended on 2/12 at the 5066 high, and that's where an ABC pullback happened into yesterdays low of 4959. That means we are inside Small Wave 3 up right now. Below is that chart that I did on February 18th.

If I'm right on that count then we will likely subdivide into 5 Tiny Waves inside Small Wave 3 up, which we probably completed Tiny Wave 1 up at yesterdays high. Meaning that we should pullback small (20-40 points?) today and into Monday for Tiny Wave 2, which would be perfect for the turn date on the 25th/26th as then it would indeed put in a low (higher low, but a low never the less).

This would setup the rest of next week for Tiny Wave 3 up, inside Small Wave 3 up, inside Medium Wave 3 up, inside Large Wave C up... to continue the rally higher into March 22nd, the next important turn date. Below is a close up of that chart...

As you can see on that chart I'm not looking for a lot for Tiny Wave 2 into next Monday. From there (if this all plays out as it's always a "best guess") we should grind higher in a Tiny Wave 3 up, then 4 down and 5 up to complete Small Wave 3 up. A pullback for Tiny Wave 4 should follow and then more slightly higher high for Small Wave 5, which will complete Medium Wave 3 up.

This should look a lot like all the prior patterns going back in time that I covered on my "Weekend Update – A Study Of The 161.8 Fibonacci Extension" post, which commonly shows a high for the 161.8% getting "almost" hit, then a pullback, and a final higher high that pierces through it. That will be the S3 high, S4 pullback and Small Wave 5 pierce. Then a good pullback will follow.

I did a projection for the target high using that 161.8% method and it points to 5309, which was created from the 3502 low to the 4619 high. That points to 5309, but I also decide to do another one from the 4122 low (MC of LB) to the 4841 high (S5 of M1), and that projects 5286... so somewhere in that zone is where the top for M3 should appear.

Moving on... after the close we got a FP of 505.76 on the SPY, which I think will be the pullback low for Tiny Wave 2 today, or Monday.

Have a great weekend.

ES Morning Update February 22nd 2024

0

(Post wrote last night)

Yesterday the market drifted lower all day and bypassed the FOMC minutes as it didn't have any real affect, but the earnings from Nvidia after hours causes a nice move back up like I was expecting.

Now we have to see how high this rally goes into this Friday as if we take out that 5059 and 5066 high then the lows are likely in and we will only pullback into the Sunday/Monday turn window (25th/26th) for a higher low. From there we grind higher into the March 22nd turn date to finally top out (hopefully?) before a nice 3-9% pullback. The alternative would be that if we fall to make a higher high by this Friday then I'd lean toward one more drop into this Sunday/Monday for another lower low then last weeks low from the CPI number.

I really don't favor that happening but it could. It would have to go lower then yesterday and after the squeeze up from Nvidia yesterday after the close I really don't put that has happening.

What I think will happen is that we grind higher and pullback small so that the coming turn date gets bypassed... meaning it doesn't make a new high and is simply a down day, which qualifies for it being a "turn" as after that the rest of next week should be up, and I think it continues that grind all the way into the next turn date on March 22nd. The best thing the bulls can do is to "build a base" for several days... meaning "No Breakout" until after this coming Sunday/Monday passes by. Time will tell.

Have a blessed day.

ES Morning Update February 21st 2024

0

From the February 12th high of 5066 the market has been pulling back in what appears to be an ABC move with the 5059 high on the 16th being the B part and the current pullback being the C wave. I don't know if it's finished or not as most C waves subdivide in 5 waves, so the move up from the close yesterday might be just a wave 2 inside that C down... or it ended at low on Tuesday.

The line in the sand I think is the current all time high of 5066 and the 5059 lower high, as if the market rallies up over them today, tomorrow or Friday then obviously the ABC down finished and another strong leg up in the market will be in play. So the 5059 level must hold to keep the bears in control as a lower high below that amount should then be a wave 2 inside the C wave down.

The short term charts are oversold and support a rally today/tomorrow but the daily is still closer to overbought, even with yesterdays pullback, (but the trend is still up). We have  news events like the FOMC minutes from last month coming out today at 2pm, and then NVDA earnings after the close today, that's 2 things that could move the market both directions.

Based on the technicals I'd think that the FOMC would cause a rally up into the close where the 5059 lower high will be the decision level. If it fails to take out that level then the earnings from NVDA after the close could cause the market to gap over it tomorrow, or to reverse back down on Thursday, which could be a wave 3 inside a C wave?

That move might be the move that ends Sunday in the futures or Monday morning to complete all 5 waves in the C wave of the ABC down. But if the 5066 high is taken out then the squeeze up much higher should top us on Friday and then a small pullback in the 25th/26th would be likely I'd think to still make a low in that turn window.

However, if by some crazy move up into a top on Friday, that then goes slightly higher into Sunday/Monday then that "expected" low for the turn window will become a high instead, and sell for a much deeper pullback. I don't think that will happen but it's certainly possible. I lean toward the 5 waves down in the C wave of the ABC down, which should bottom in the turn window, which is my logical thoughts of course.  Oddly my gut tells me we are going to make a new high.

I'm still long and riding it out as I'm still focused on the top into March 22nd, which could be 5200-5300 I think.  Everything this week is done to shakeout bulls and bears alike, so I have to just stand my ground and let the bigger picture play out, which is still up I think.

Have a blessed day.

ES Morning Update February 20th 2024

0

I did a long update over the weekend and posted it Sunday afternoon, so I'll keep this one short and just refer you to read that long update for the bigger picture. For the short term I lean toward an early rally this week up near the all time high, but I think it fails to take it out and instead makes a lower higher.

Odds favor that happening today and then some choppy action the rest of this week that drifts lower, with the bottom being put in next Monday morning (or Sunday night, the 25th). From there it's up to around 5307, which I think will happen into the March 22nd turn date. After that a nice pullback of some decent amount. How much I don't know but I'd think it could be that 7-10% pullback that everyone is looking for, but it might be less... hard to say right now. I covered all the past periods where the pattern appeared and we had different percentages on each one.

It was anywhere from 3% to 9% going back 20 years, so I'd think somewhere in the middle would be the zone. If it's 5% for example then from 5300 we'd pullback to about 5035, but I'd think they might want to pierce through it a little to make everyone think the high is in... which it might be, but studying the past it wasn't the last high the majority of the time. But I'm getting ahead of myself, so let's just focus on the short term. That is up early this week (today) to try and make another higher high, and then down into the 25th/26th.

Have a blessed day.

Weekend Update – A Study Of The 161.8 Fibonacci Extension

0

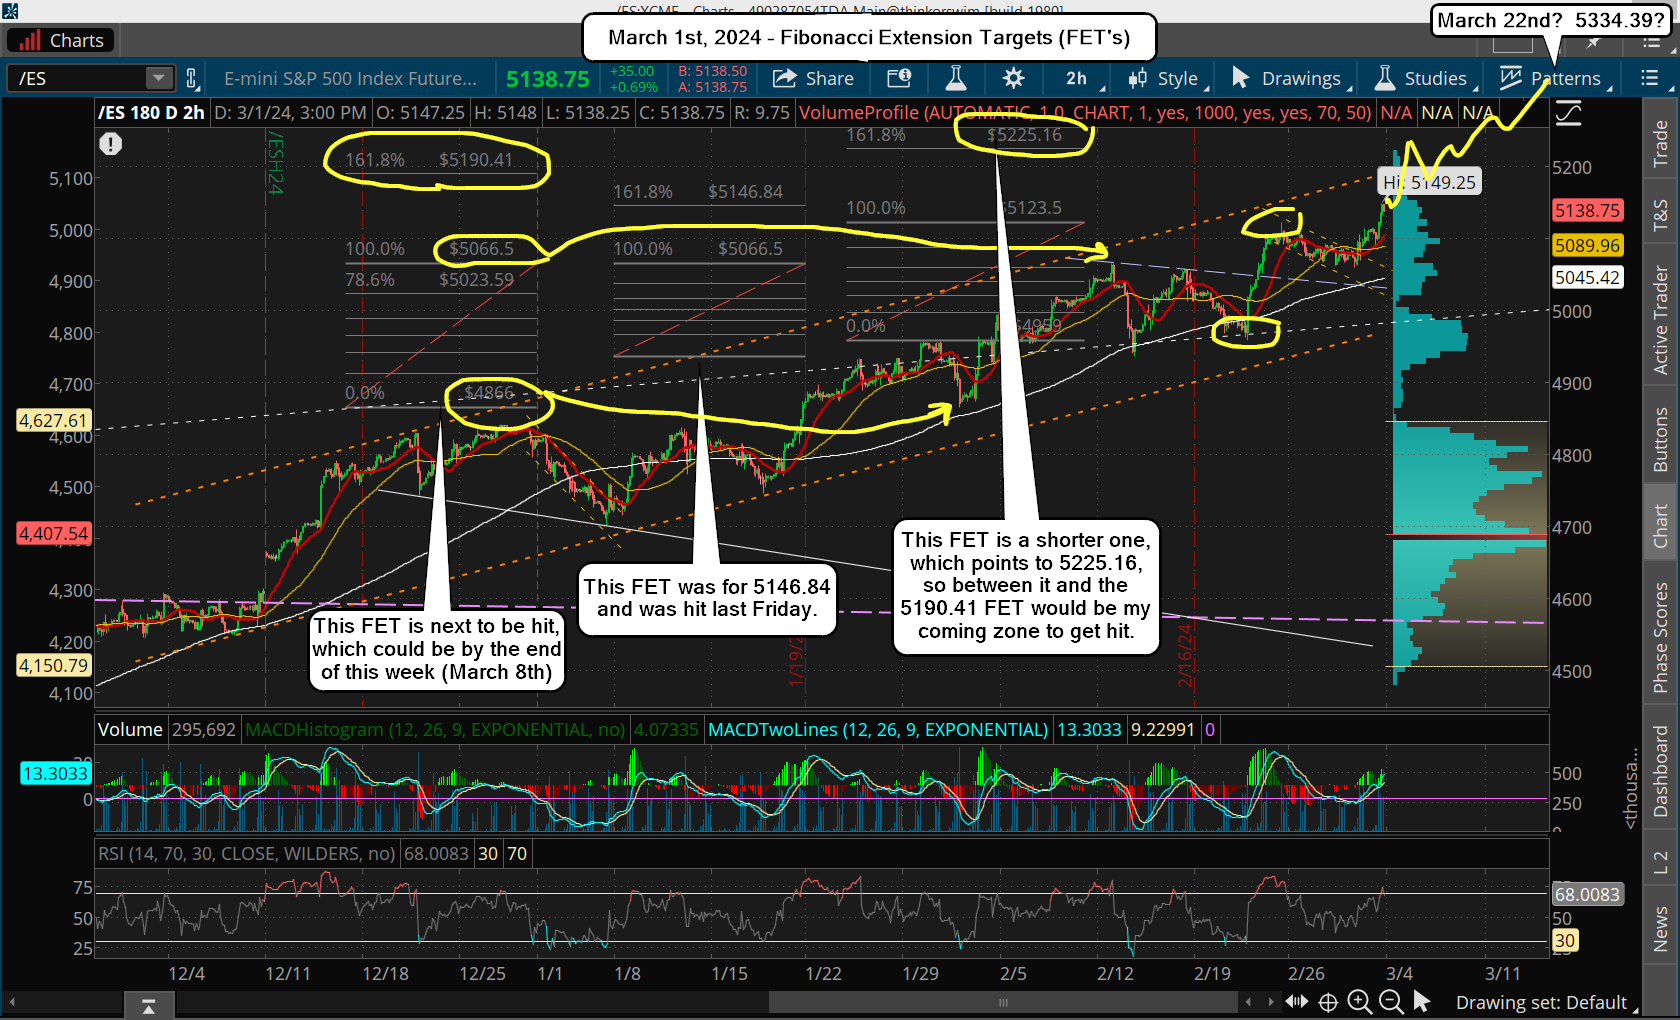
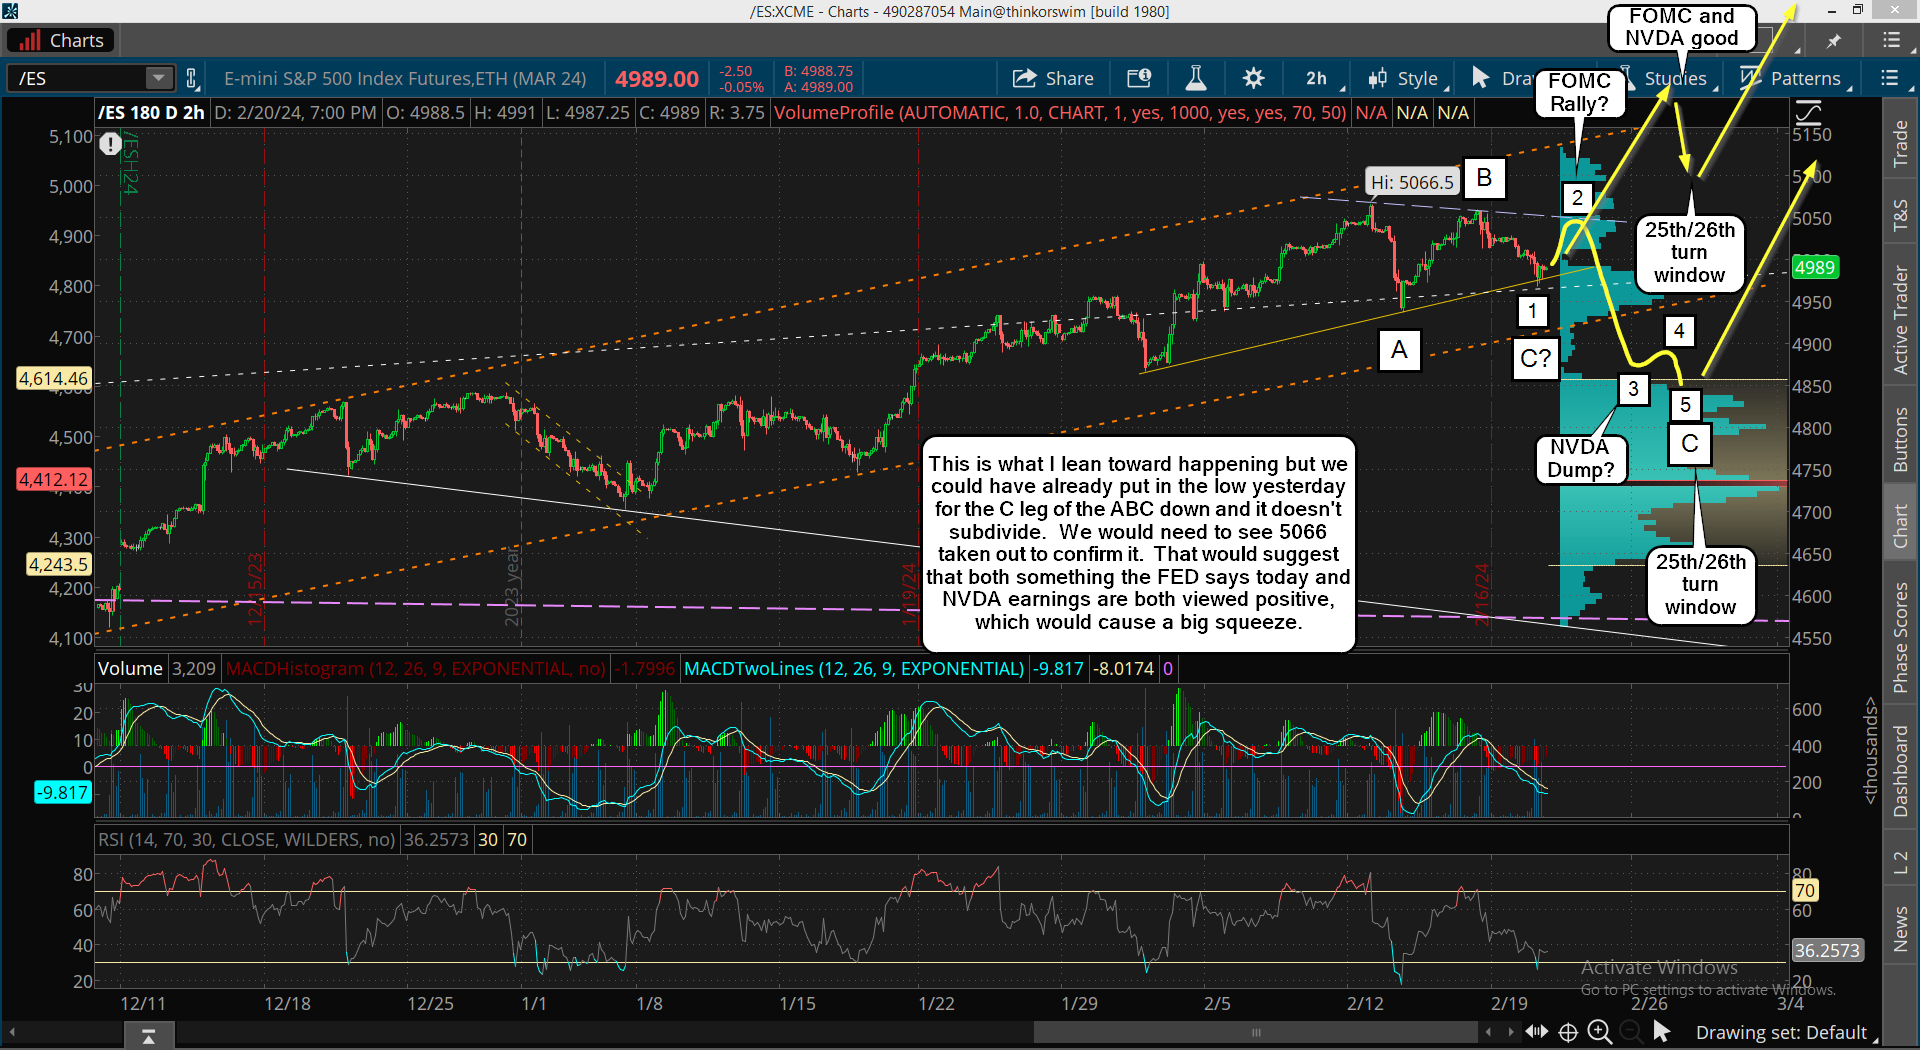
Last week we got close to the 5080-5090 target zone with a high of 5066, and then the pullback started. I'm still not sure which of my wave counts we are on but I lean toward the Alternative Bullish Wave Count, which suggests the smallest pullback of all of them.

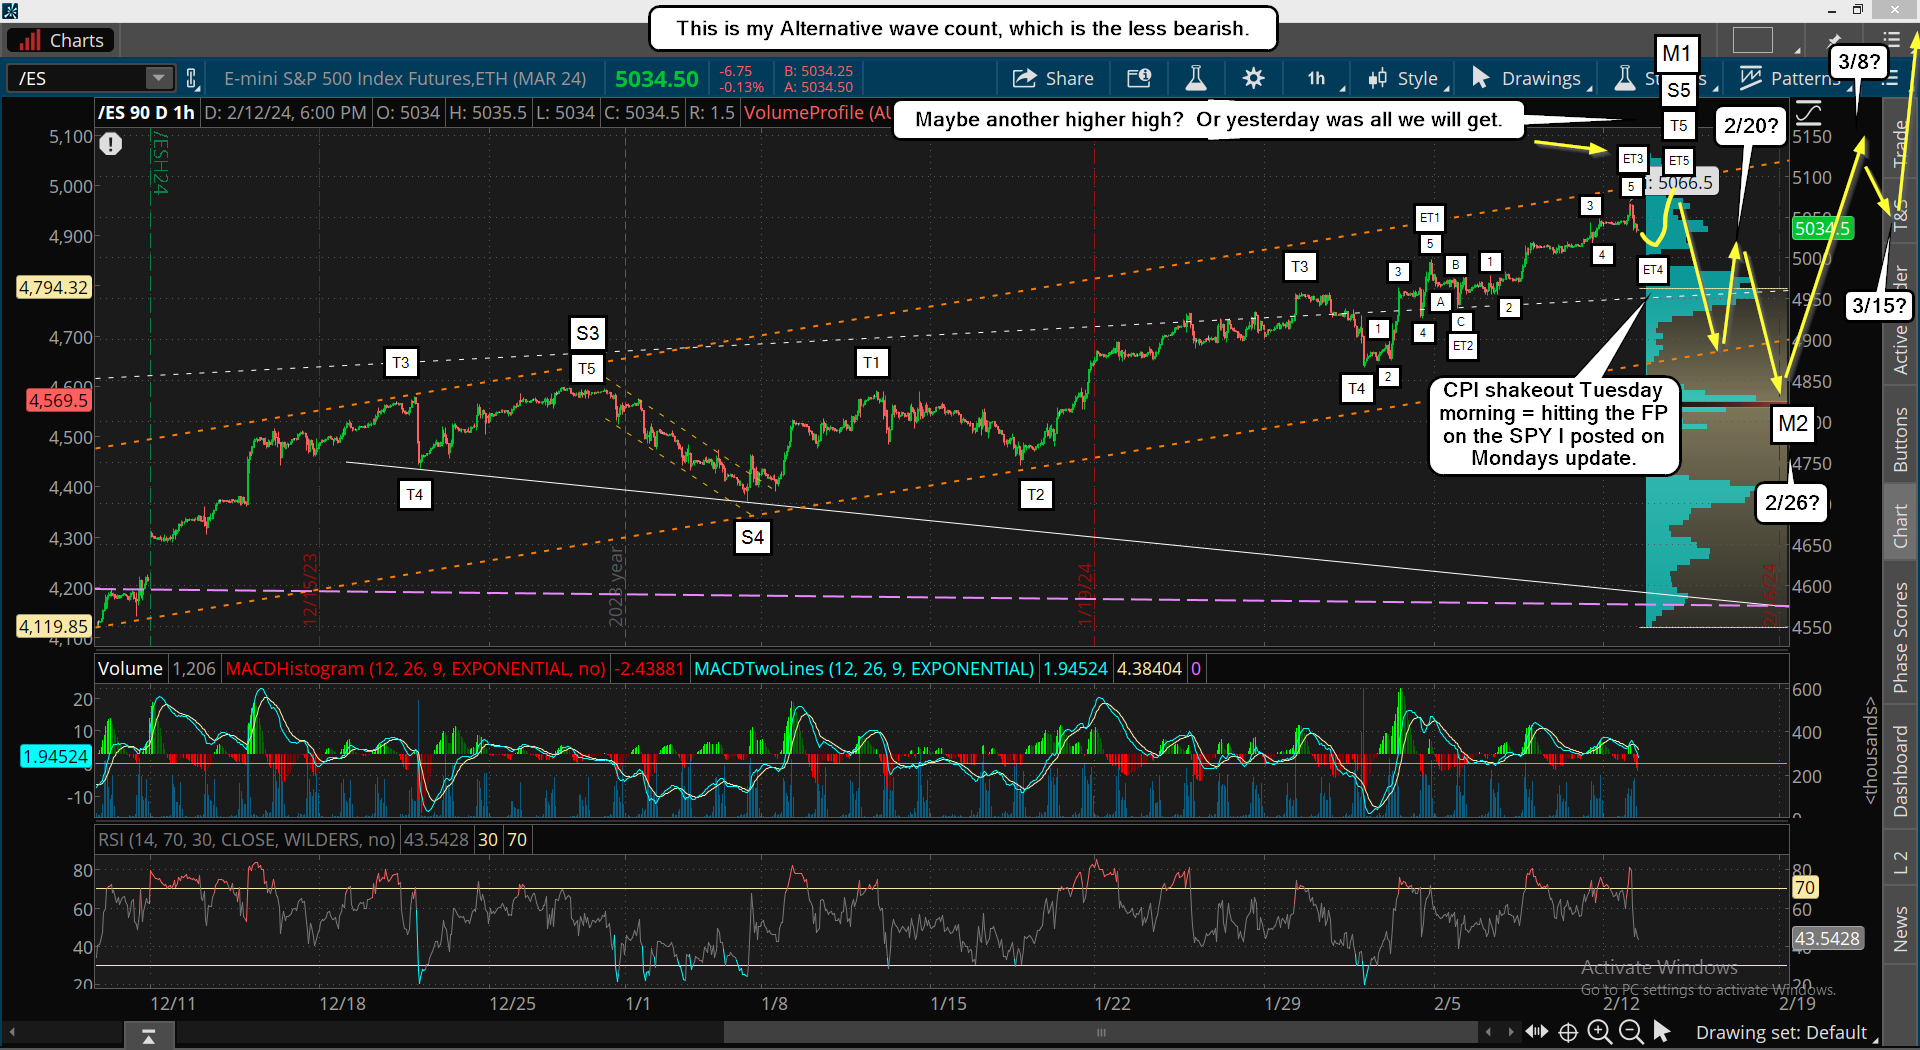
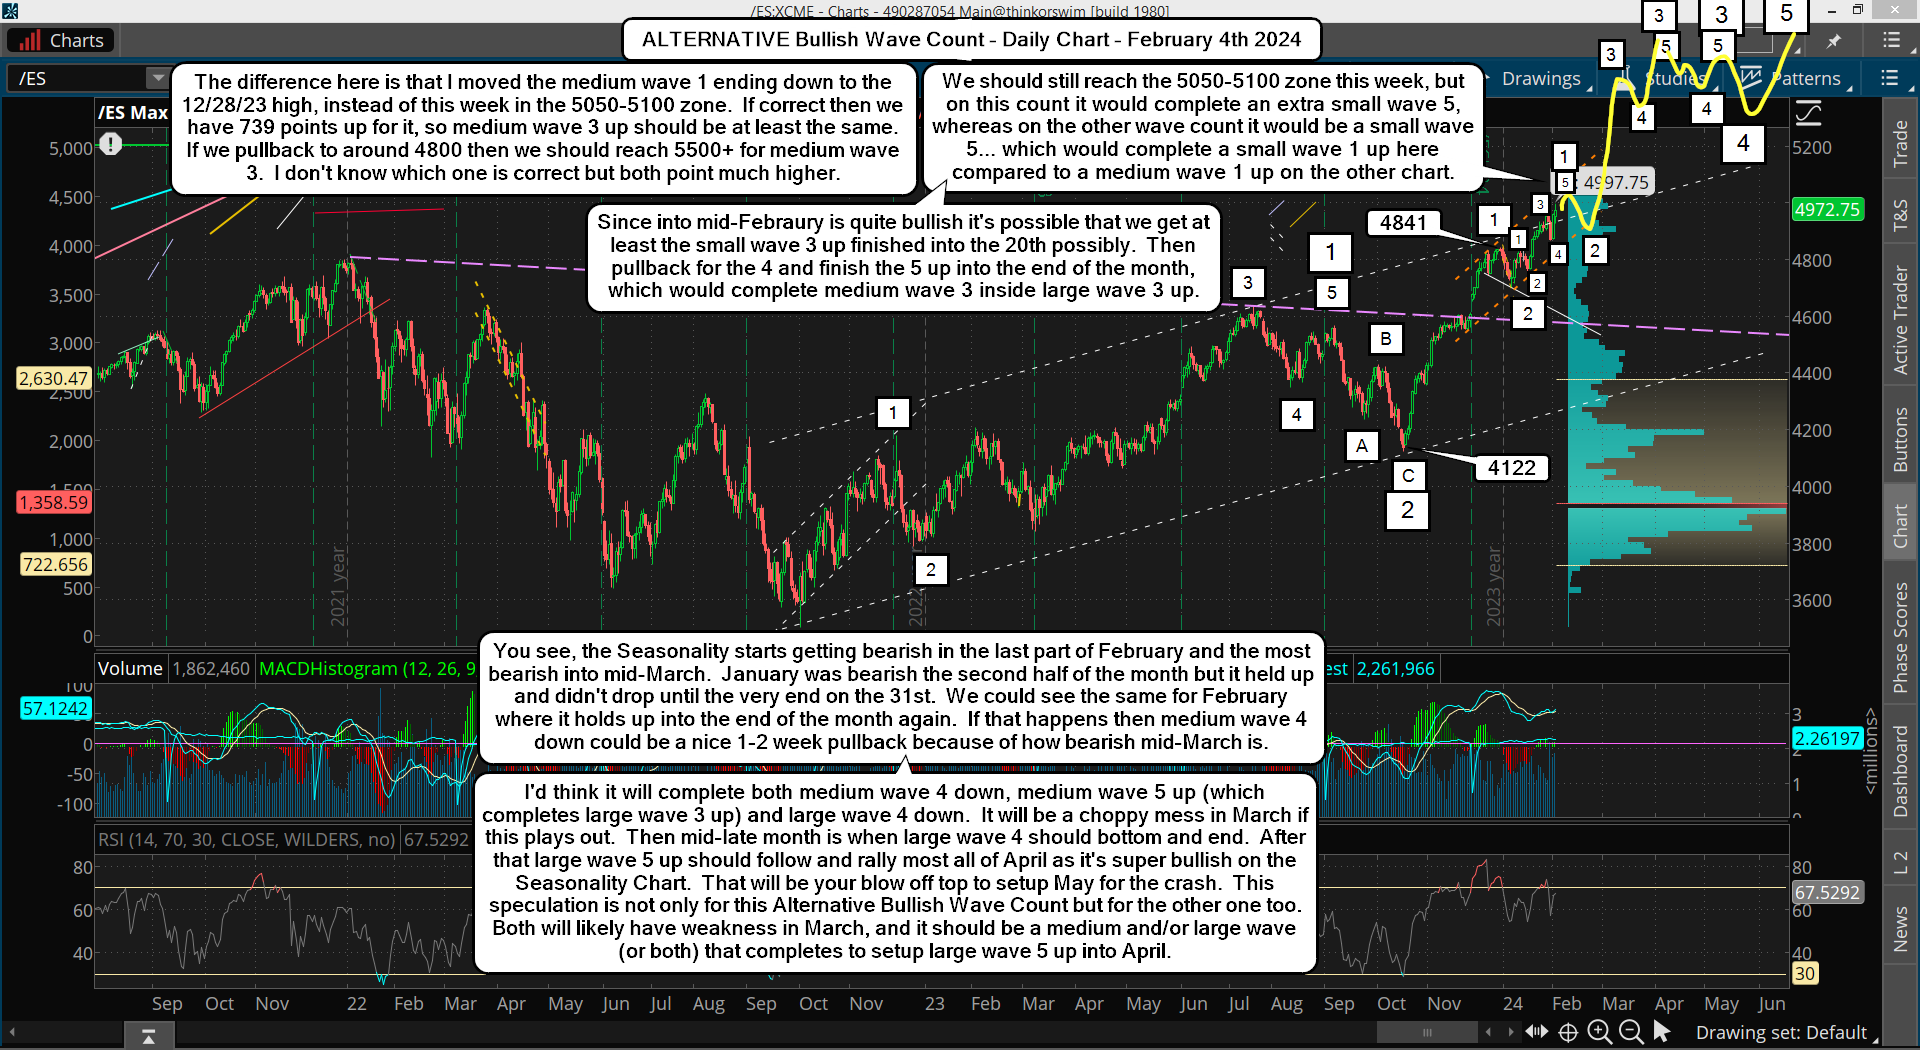
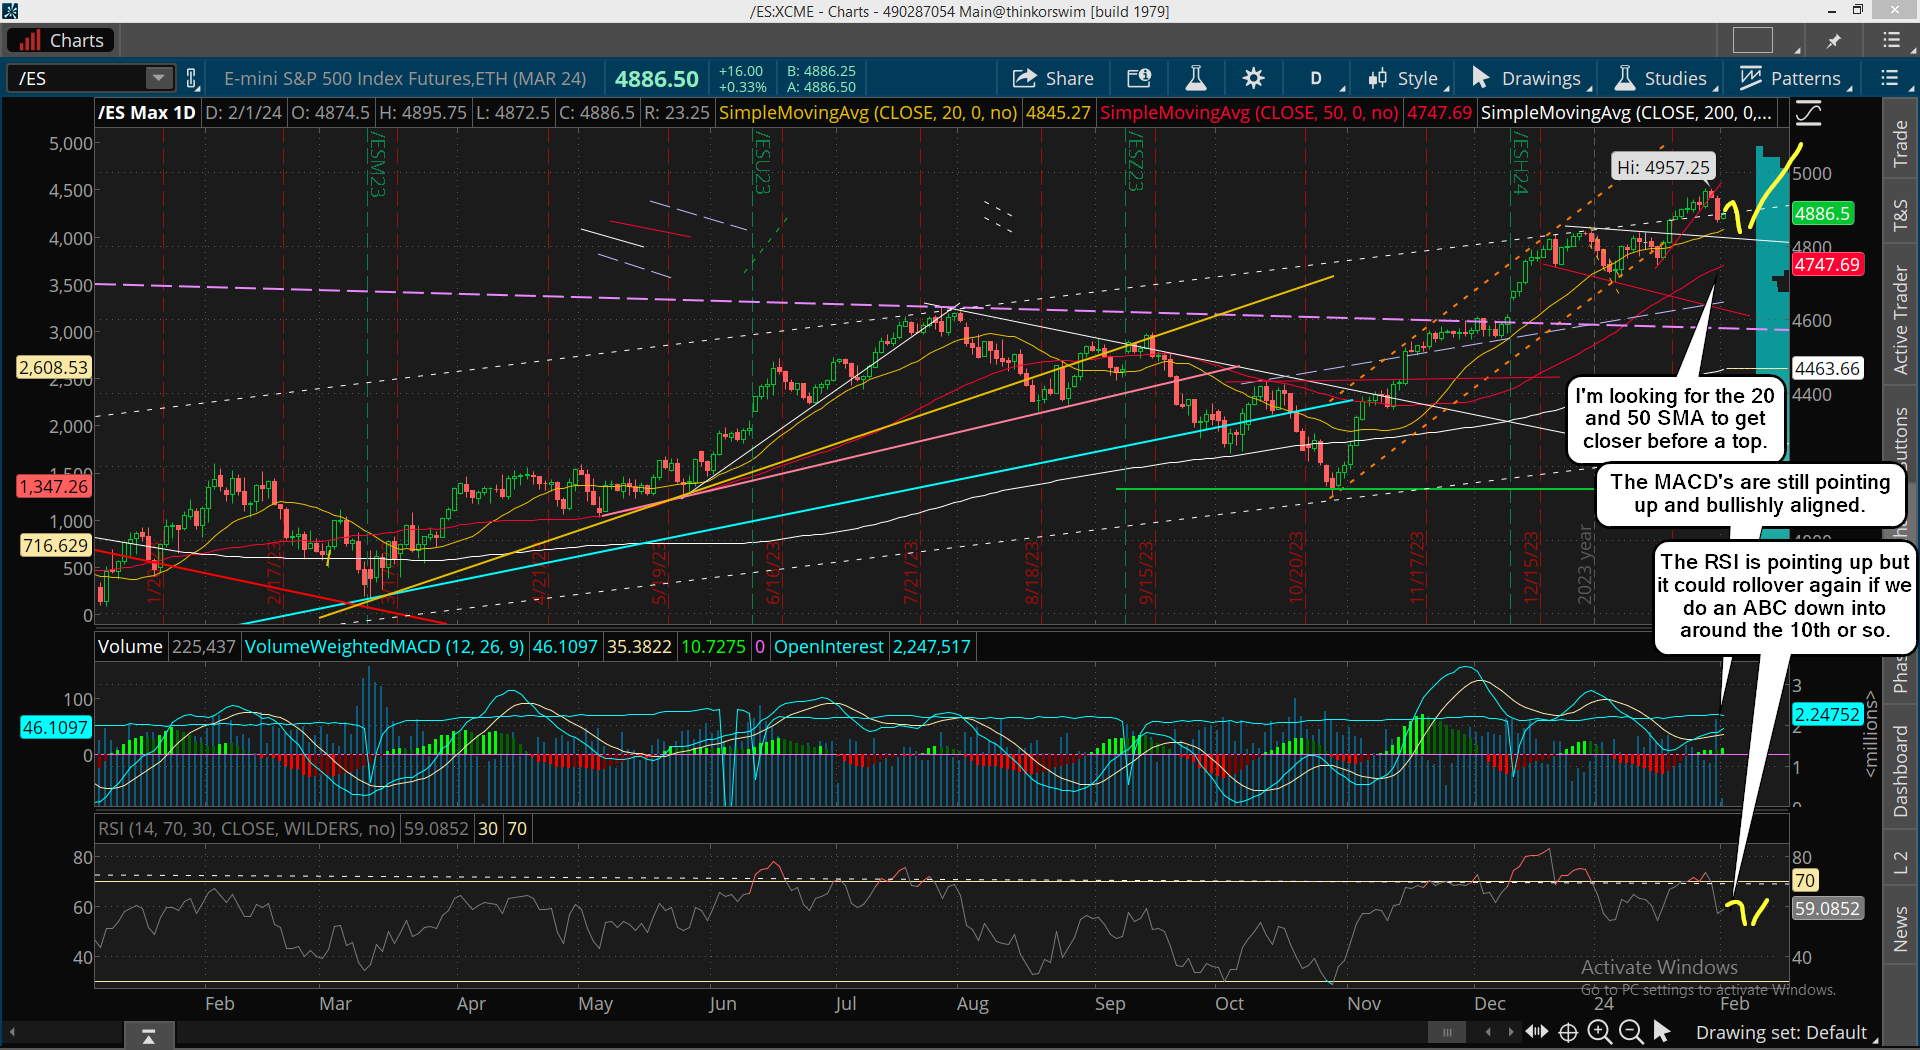
That pullback came last Tuesday after the CPI number wasn't liked by the market, and it "might" have been the end of it, but last Fridays failure to breakout to another new all time high suggest that move down may not be finished and that it will unfold in an ABC pattern. Here's last weeks chart of the Alternative Bullish Wave Count last Monday...

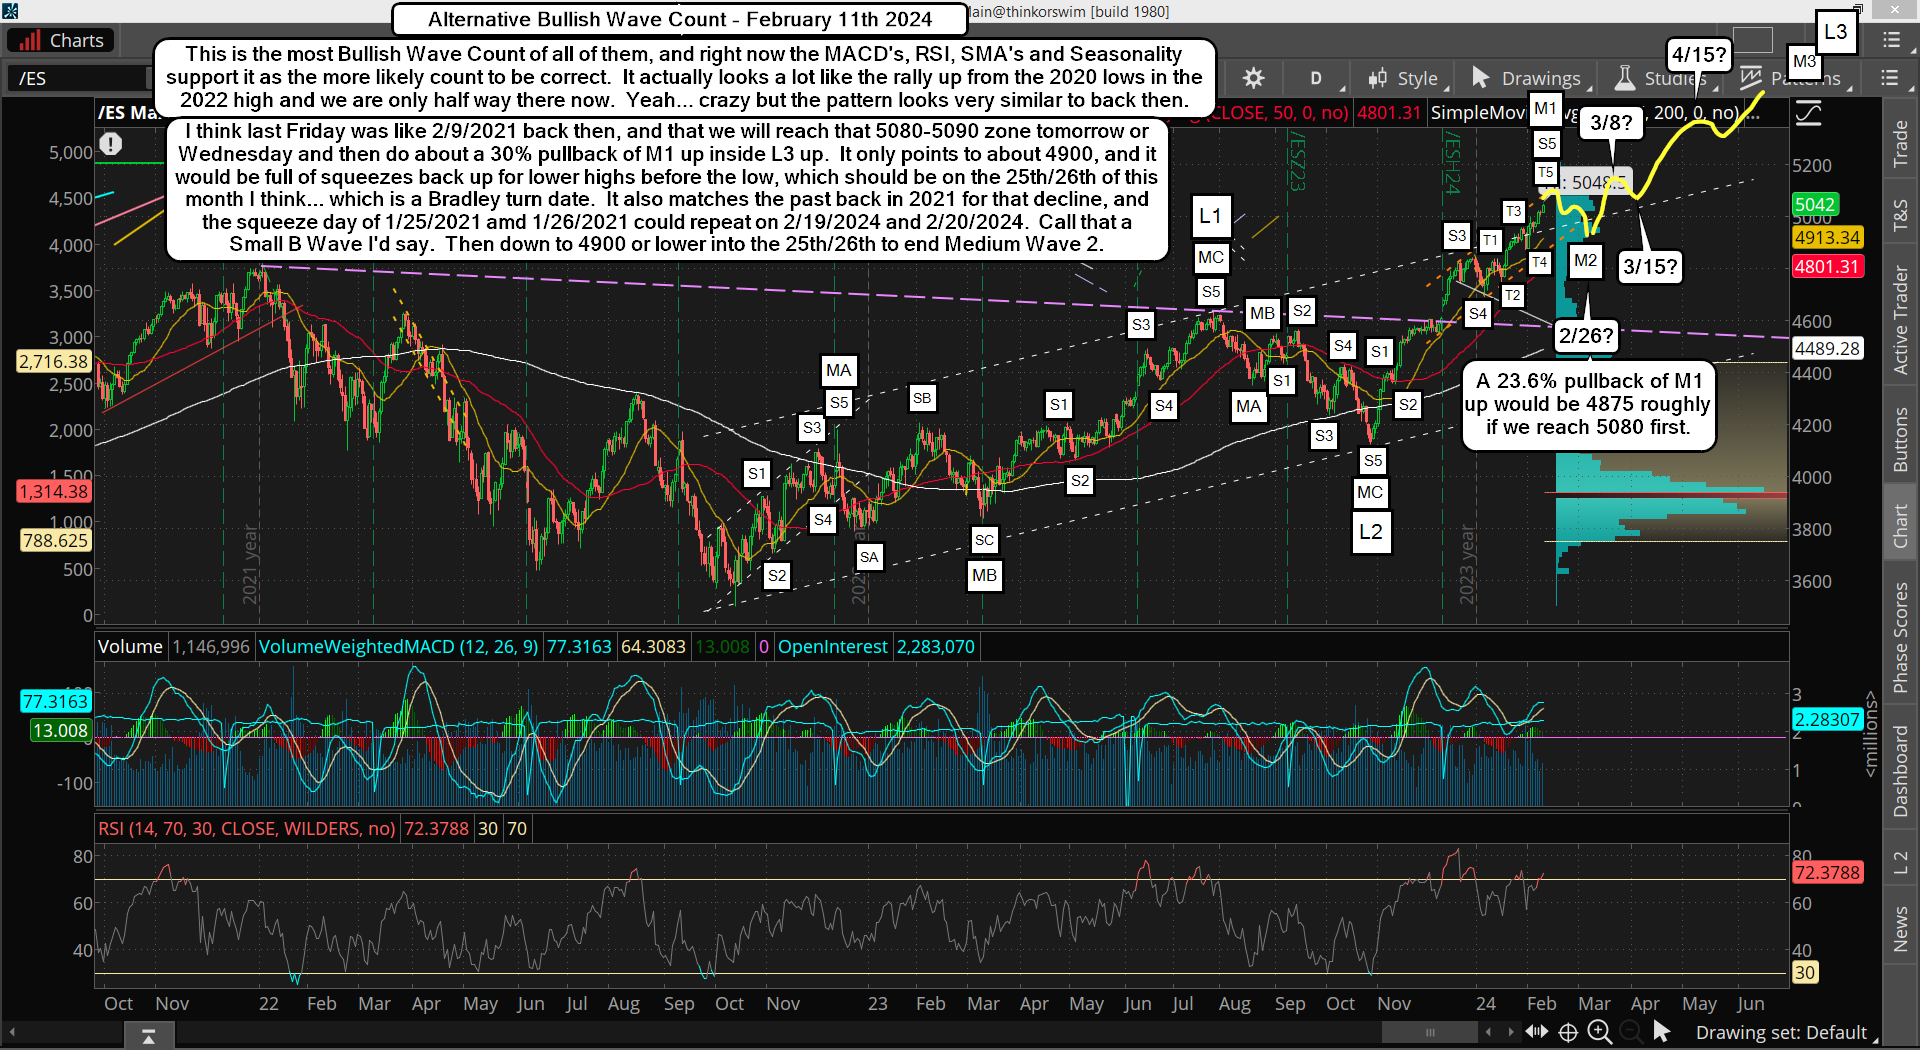
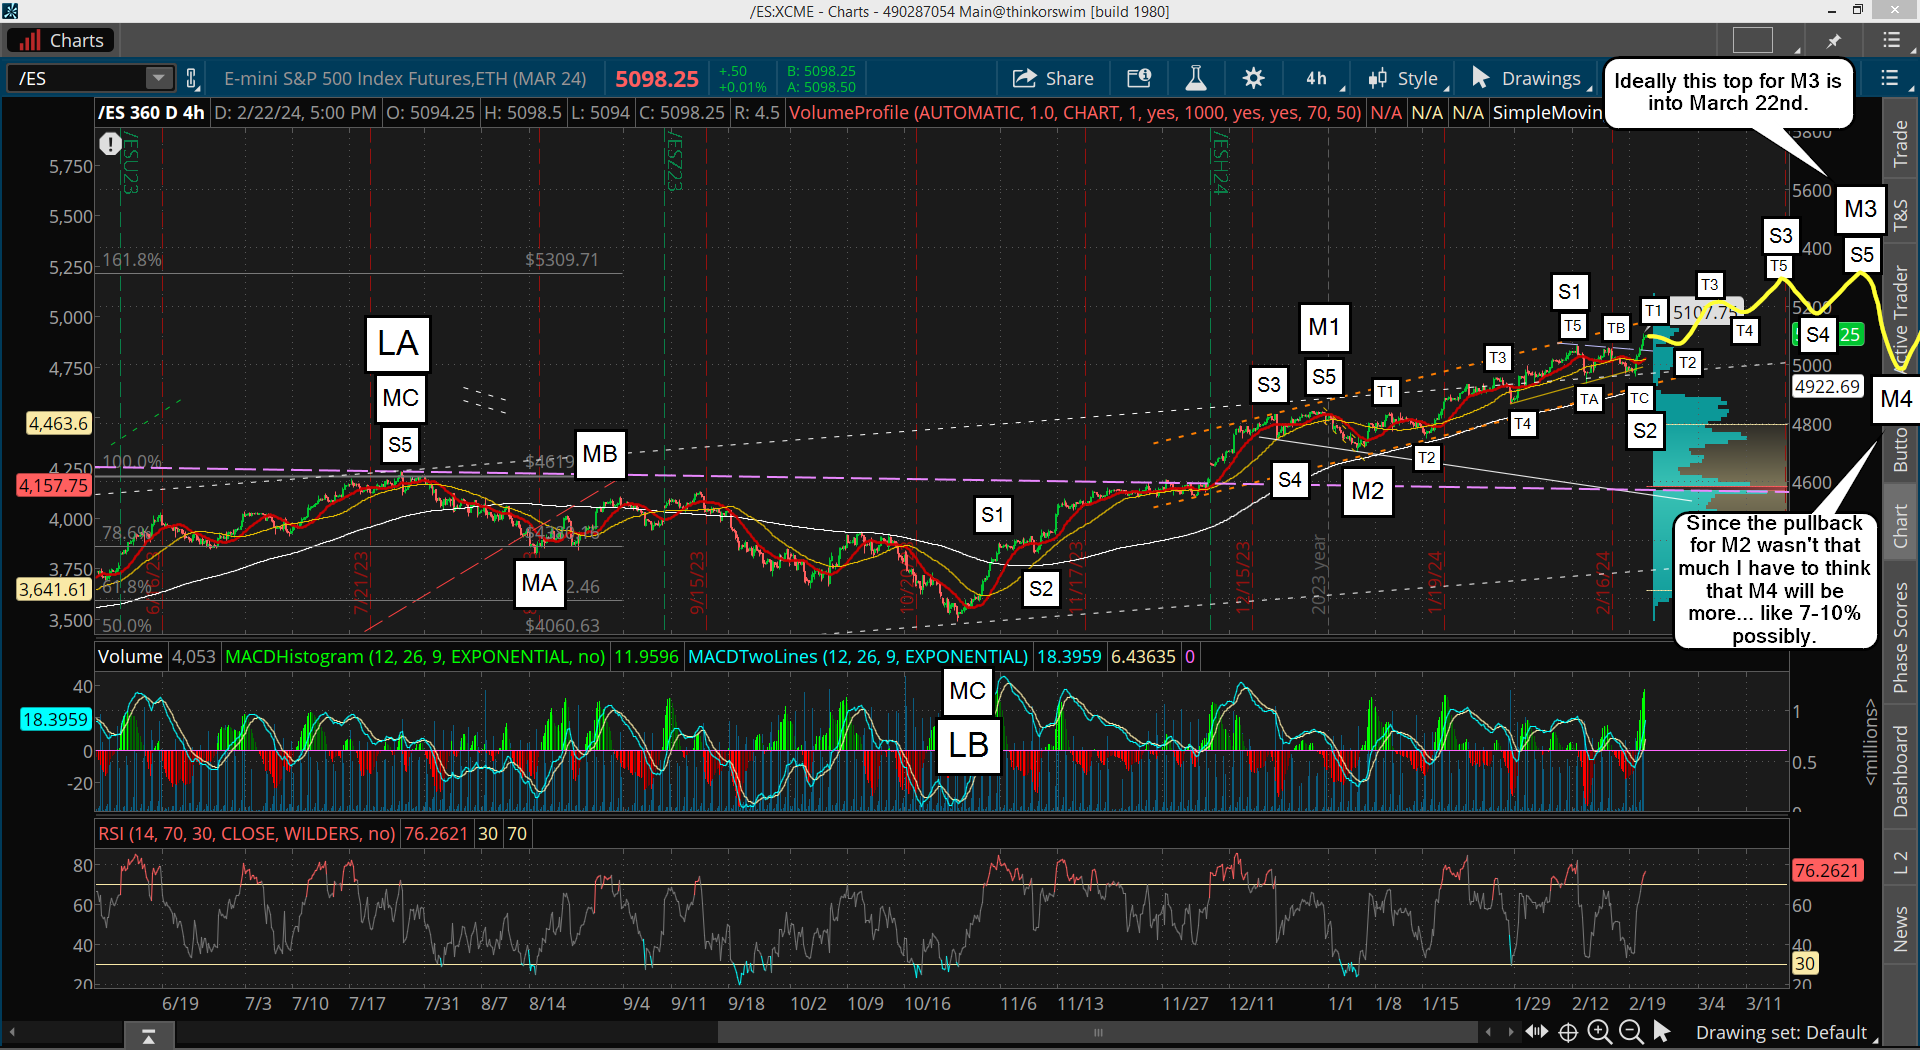
As you can see on that chart I showed M1 to M2 as an ABC down into February 26th, which I think is still very likely to play out. Bulls might try another time to breakout to another higher high early this week but I think it doesn't happen and instead we pullback again and bottom on the 26th to end the pullback for M2 down.

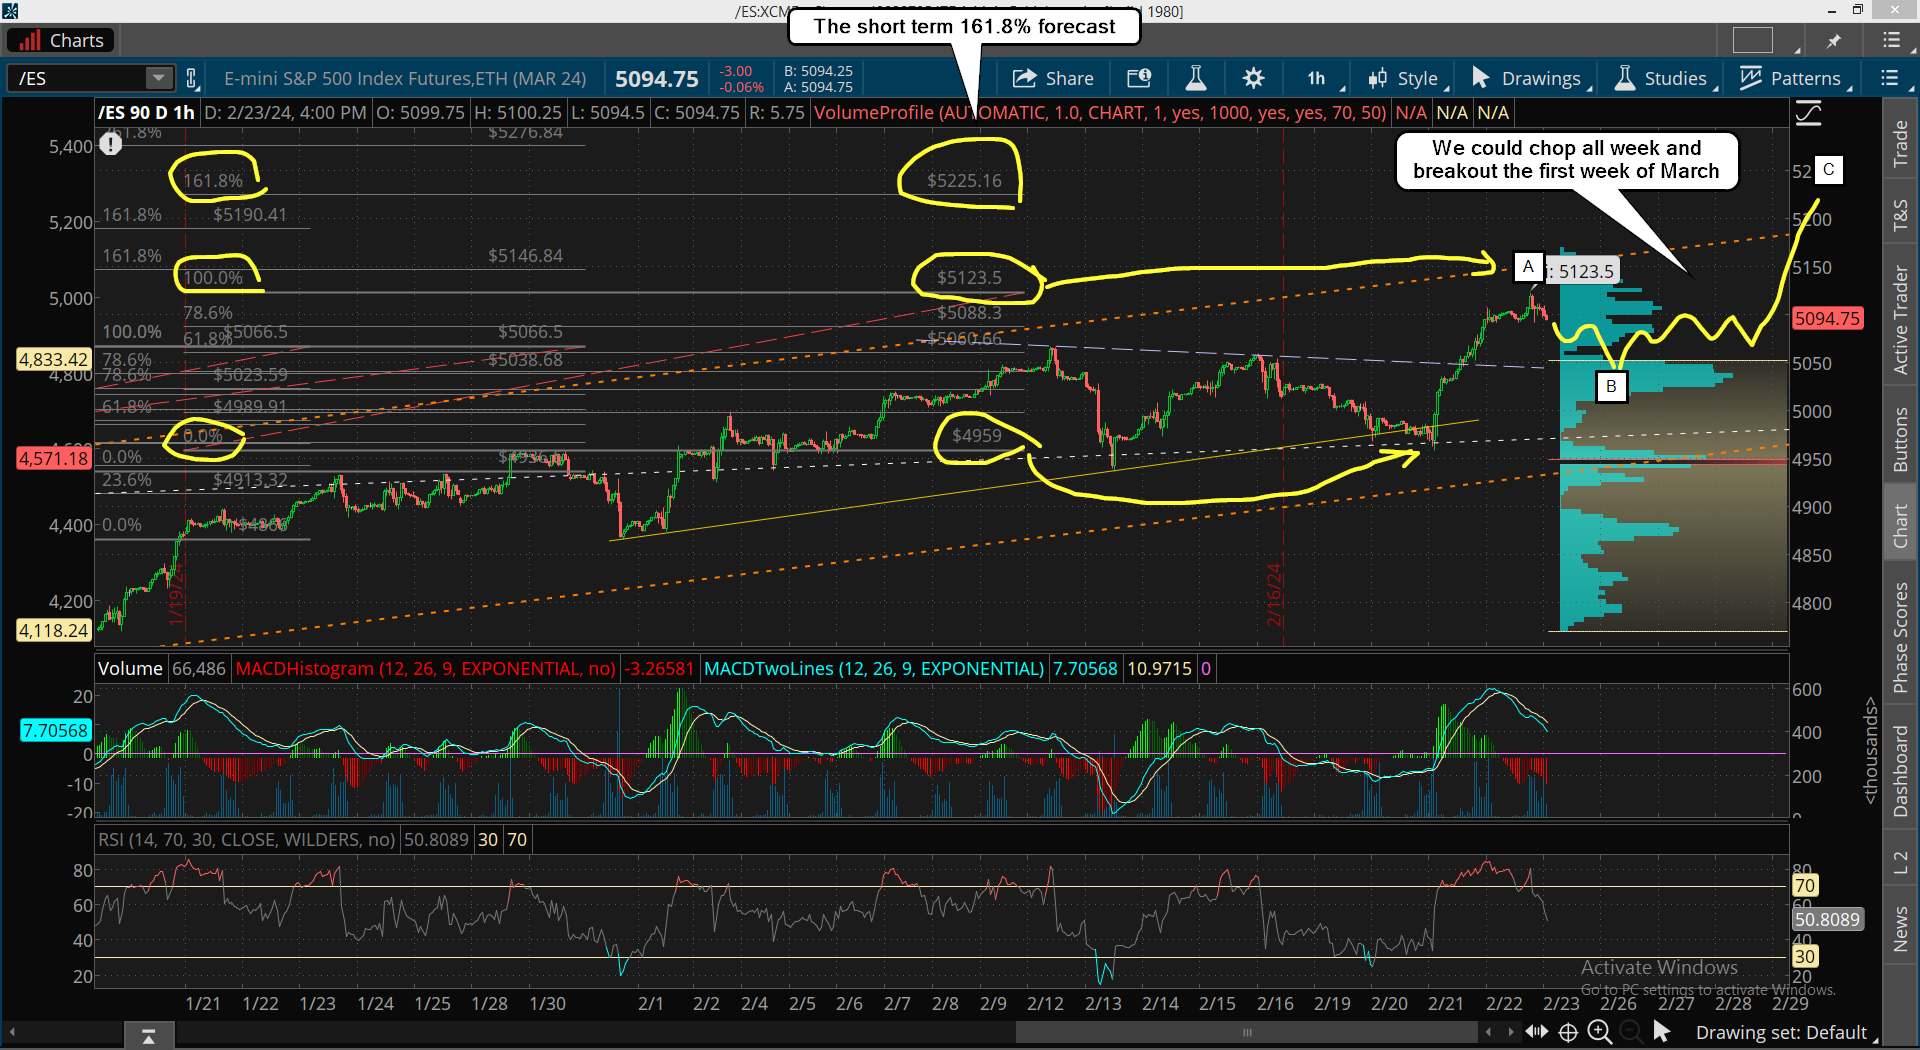
What I don't know is how low that pullback will be? The move down last Tuesday reached a low of 4963 on the ES, so if this is an ABC move down then it should take out that low by some amount.

However, there's nothing to rule out a higher low or a double bottom. The market loves to fool everyone so I just have to focus on the date of the 26th for the low (possibly Sunday the 25th in the futures?). Of course if it's a really nasty drop of 7-10%, likely I've talked about in the past as "possible", then it will be a super strong buy that will take us to new all time highs again very quickly (Low odds in my opinion).

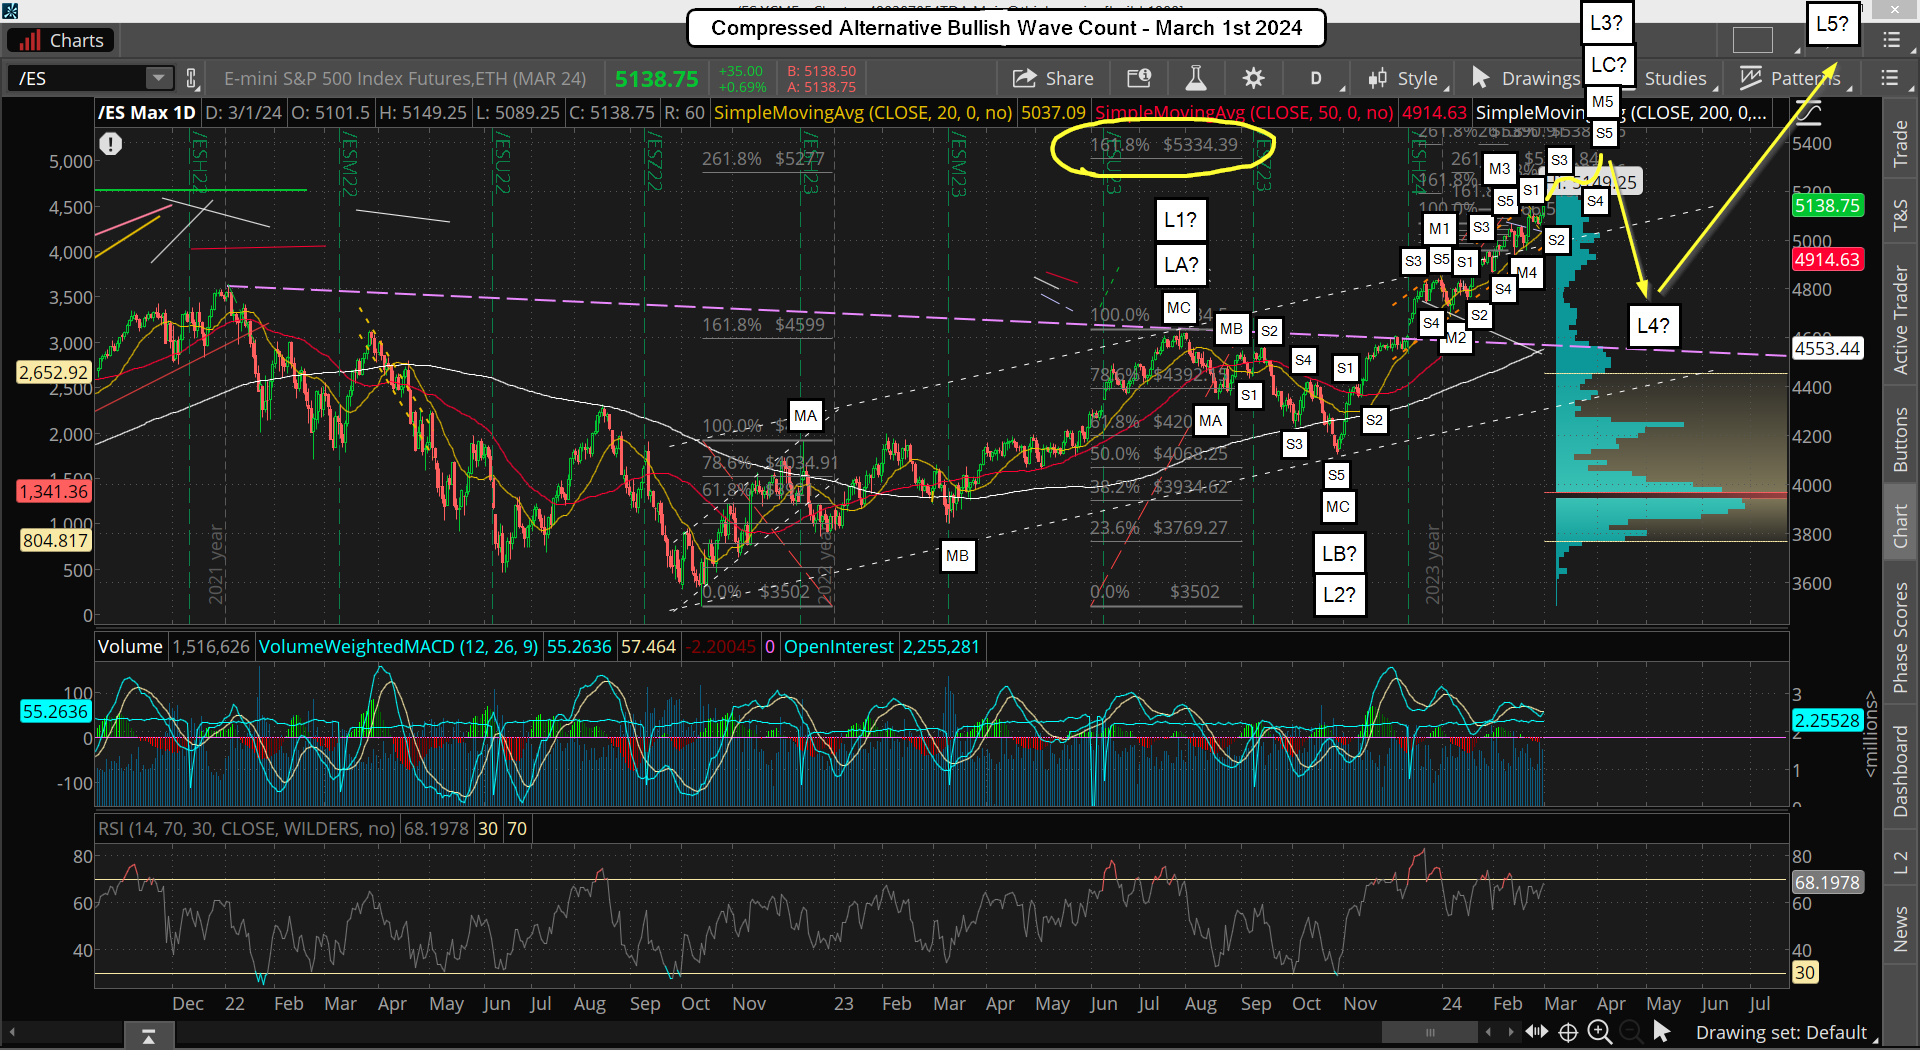
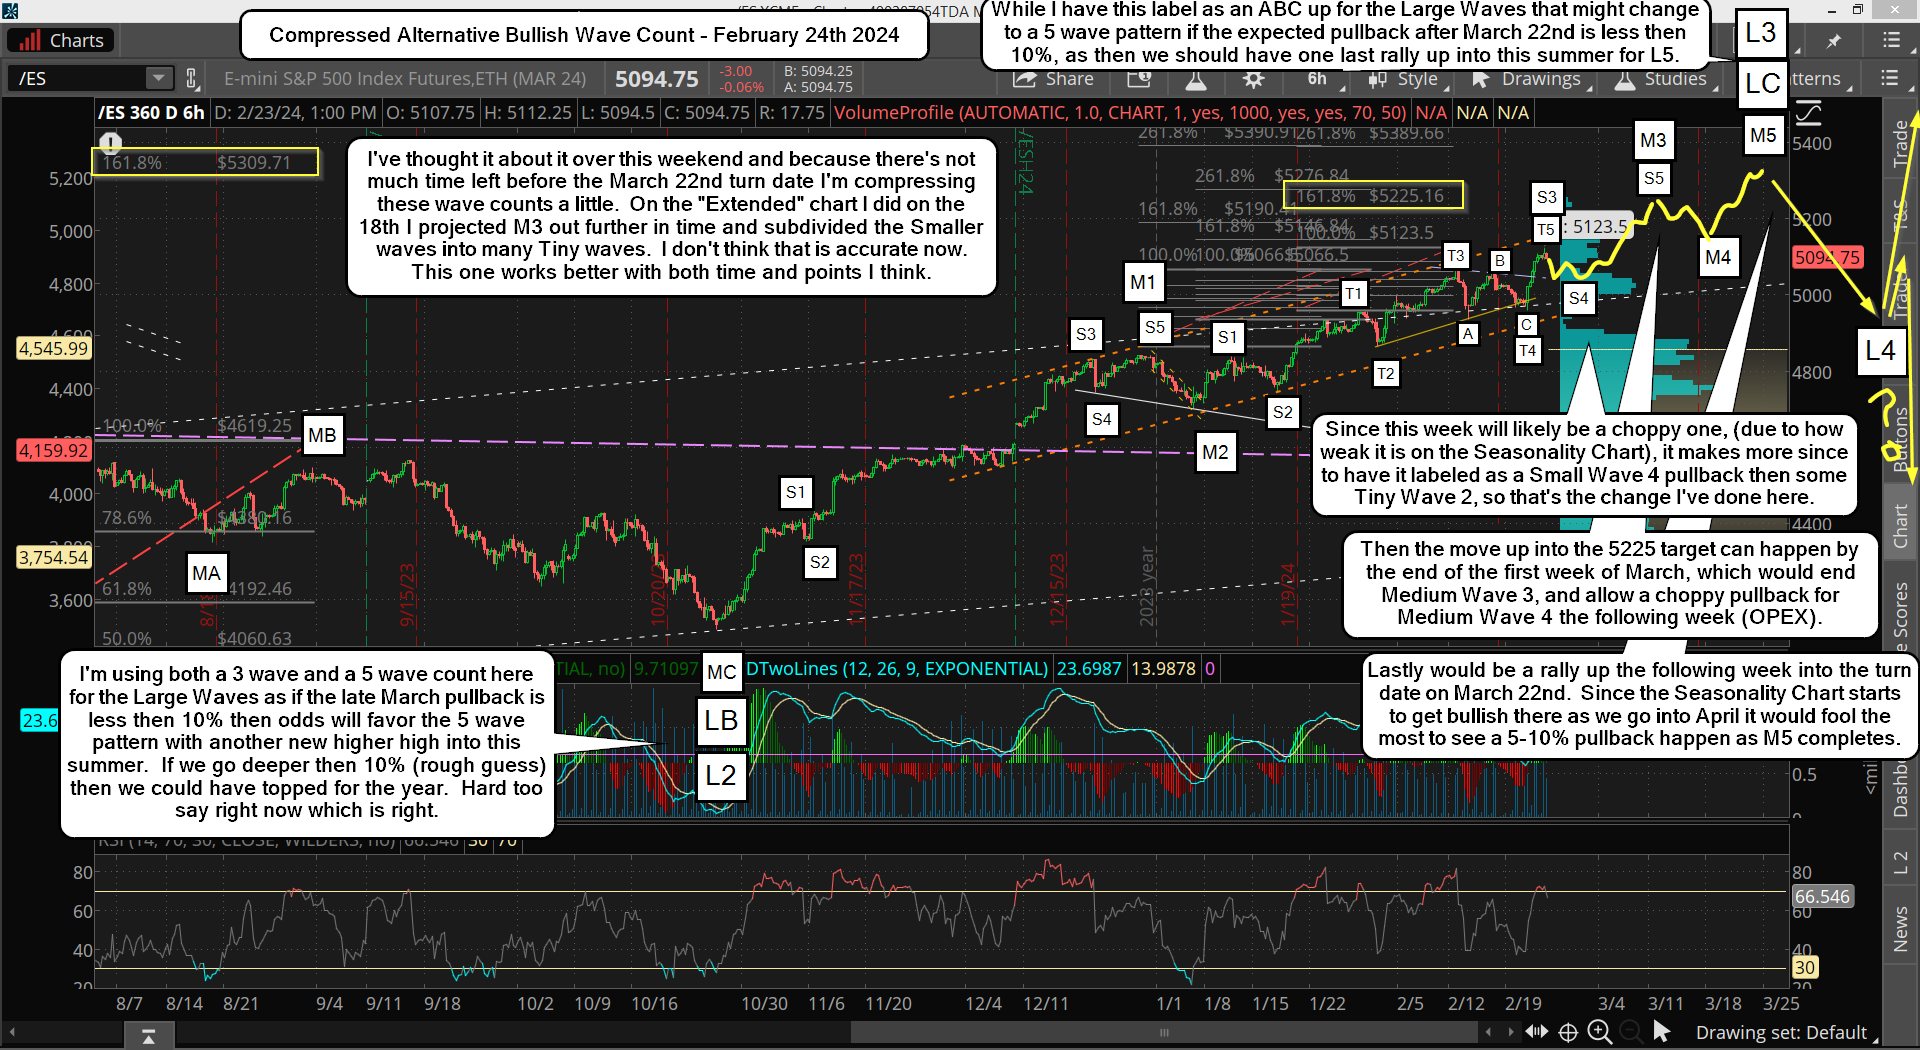
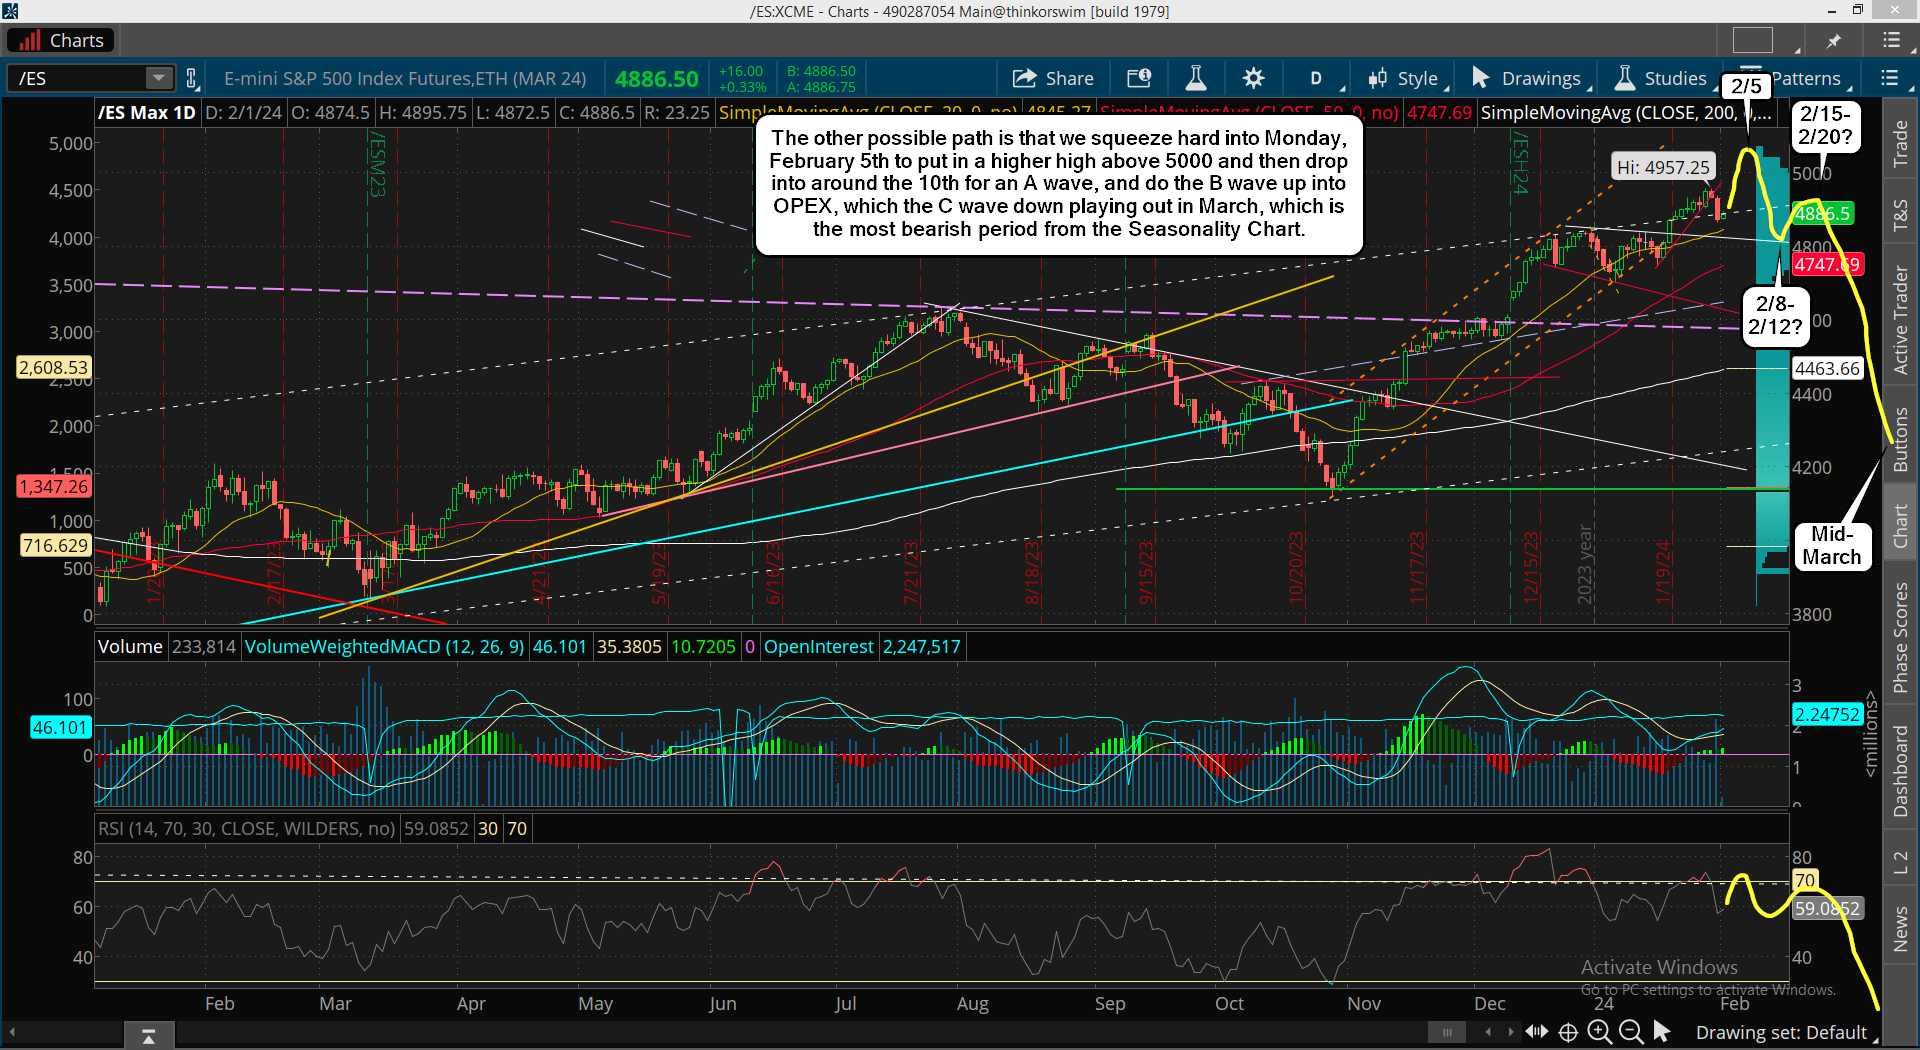
If that happens we could rally all summer and reach 6000, who knows for sure? But if it's a smaller pullback (4850-4900?) then the move up to the new all time high might only last into next month and only reach 5300-5400? Below is the updated Alternative Bullish Wave Count.

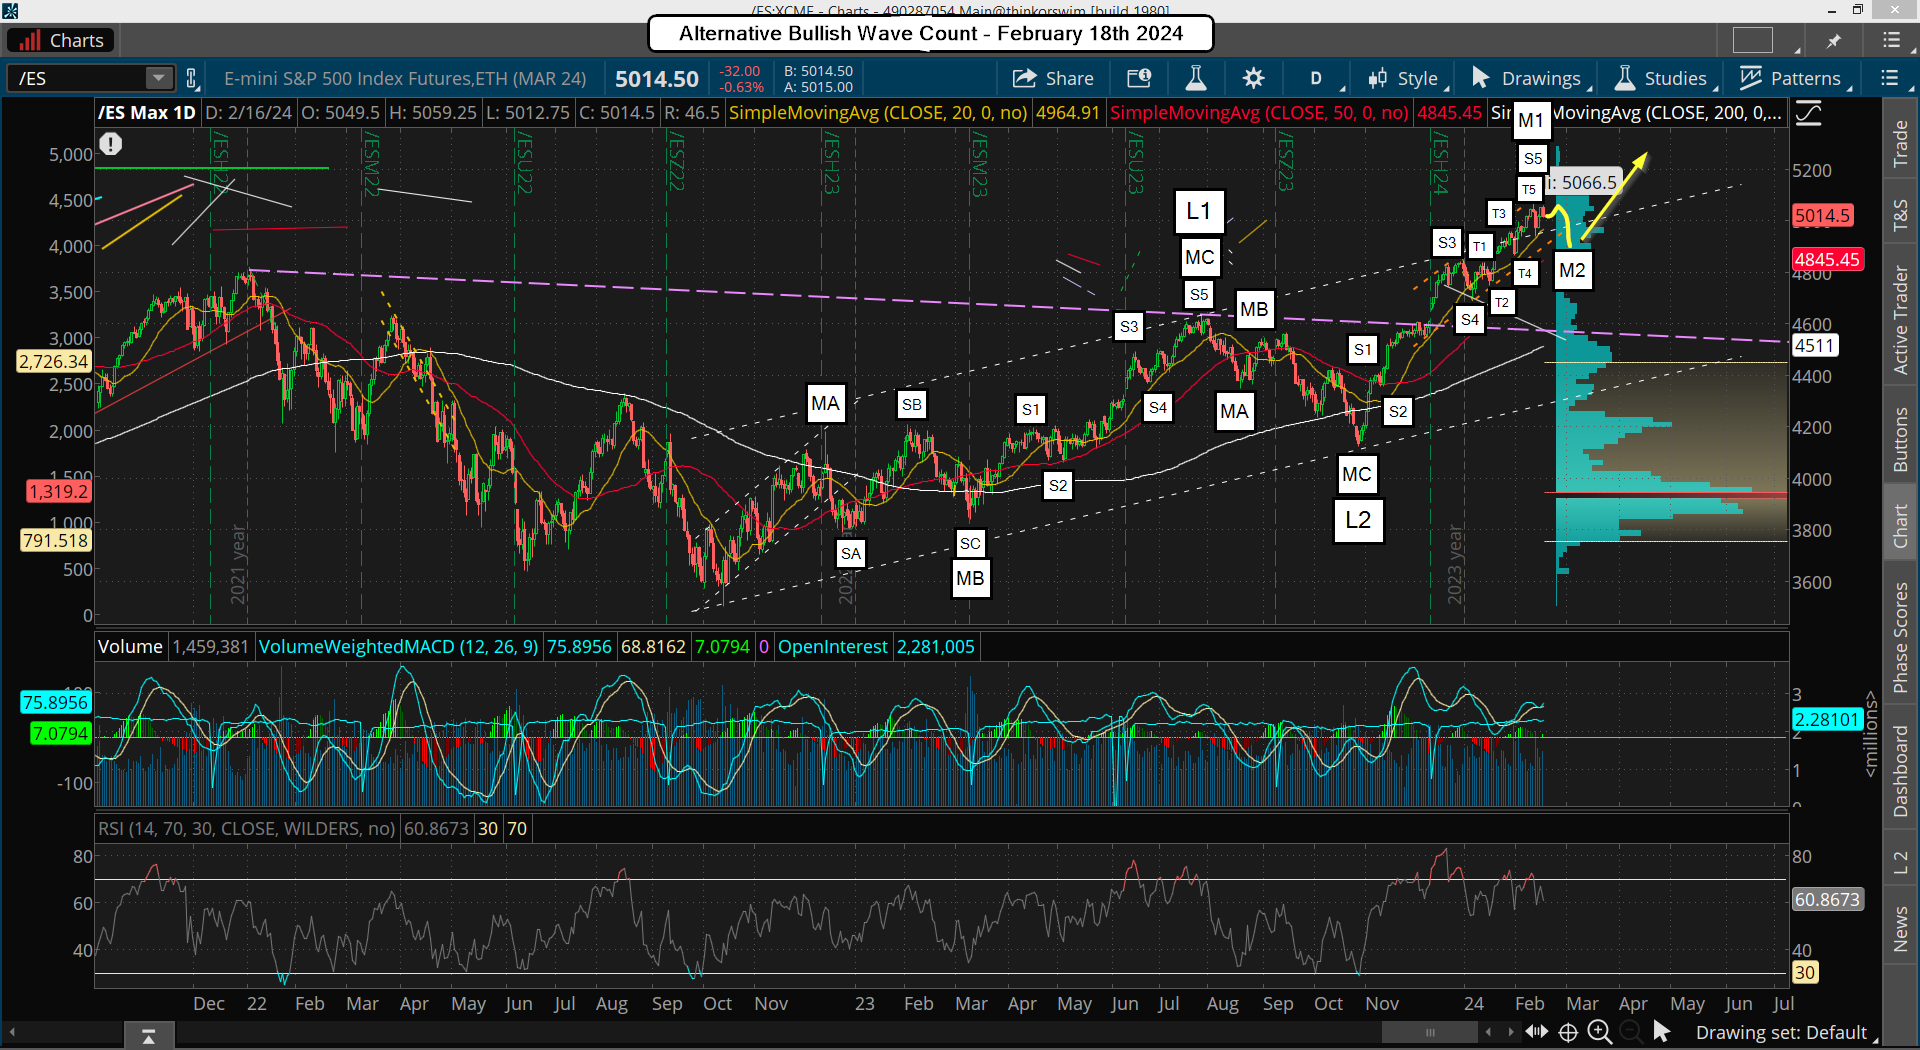
Now I will bring back the First Bullish Wave Count, or the Second Bullish Wave Count if the pullback turns into something much larger then expected, but for now this chart is what I'm focused on. On that chart you can see that I have the coming pullback into the 26th as making a lower low then last Tuesday, which would a nice an clean ABC down for M2... but if that does not happen then I'll relabel the count as M1 having NOT completed last Monday at the 5066 high.

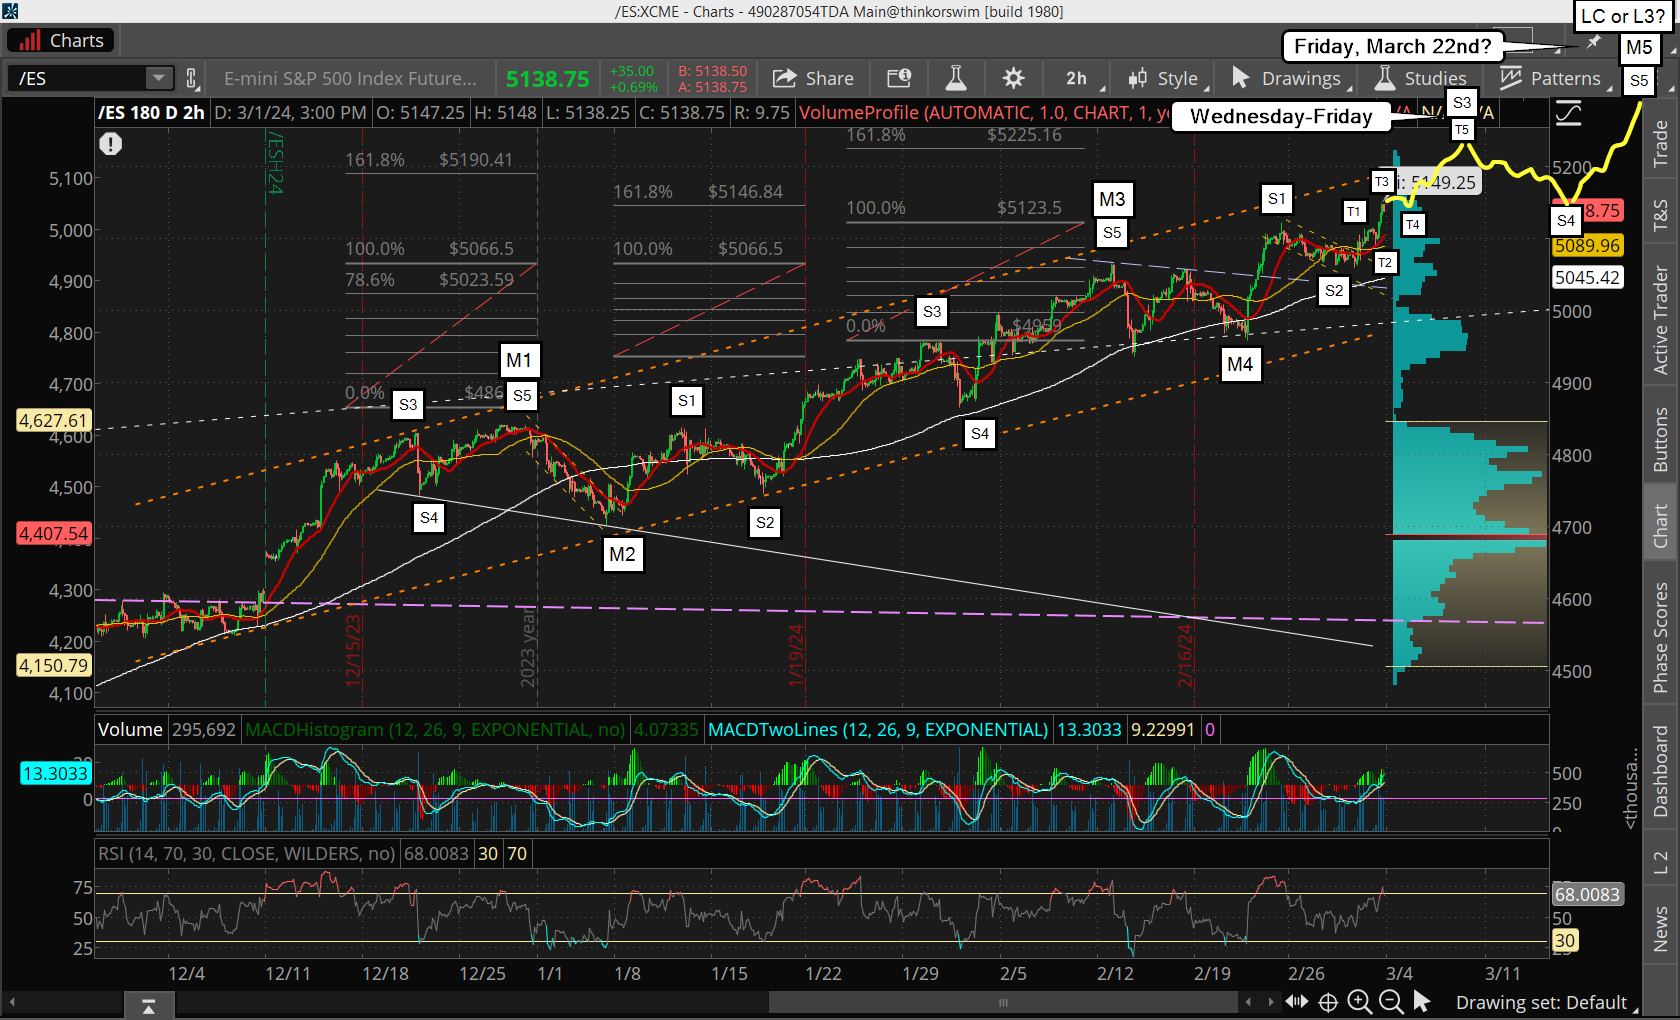
It will mean that the Small and Tiny waves leading up into the high from L2 will we be extending and sub diving further. I do favor that happening actually as there's just something about the positions I've labeled those Small and Tiny waves at that just doesn't look right. Below is a chart of that Extended Alternative Bullish Wave Count exploring that possibility.

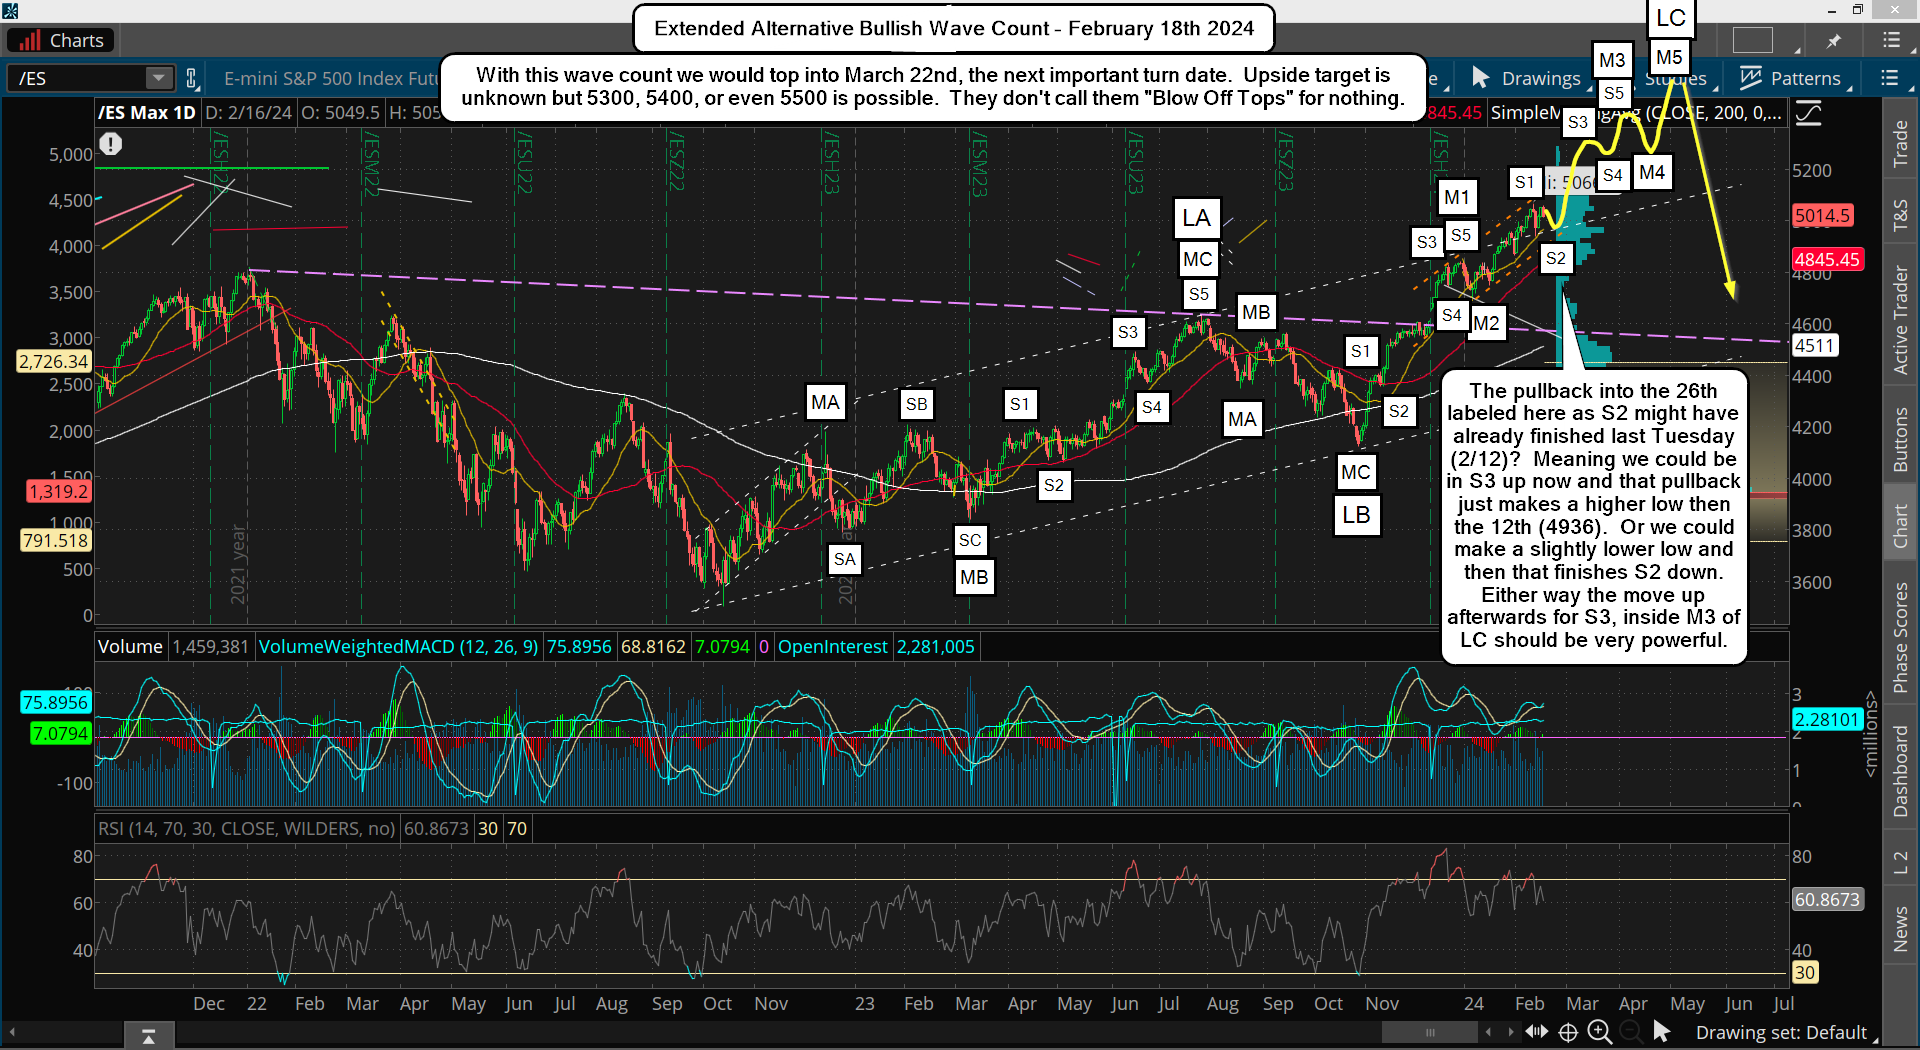
In this chart you'll see I relabeled the Large waves to ABC's instead of 5 wave patterns. I did this because when I looked back in the past it seems that all the recent rallies (last 10+ years) up from important lows unfolded in an ABC pattern. The C wave up always had 5 waves inside, which is normal of course but discovering that the larger waves were in a 3 wave pattern was a shock to me.

I know that Elliottwave talks about 5 waves up and 3 waves down but the facts tell me otherwise. So I'm just using what I see as "factual" from the past to forecast the future, that's why I labeled this chart with an ABC up for the Large waves.

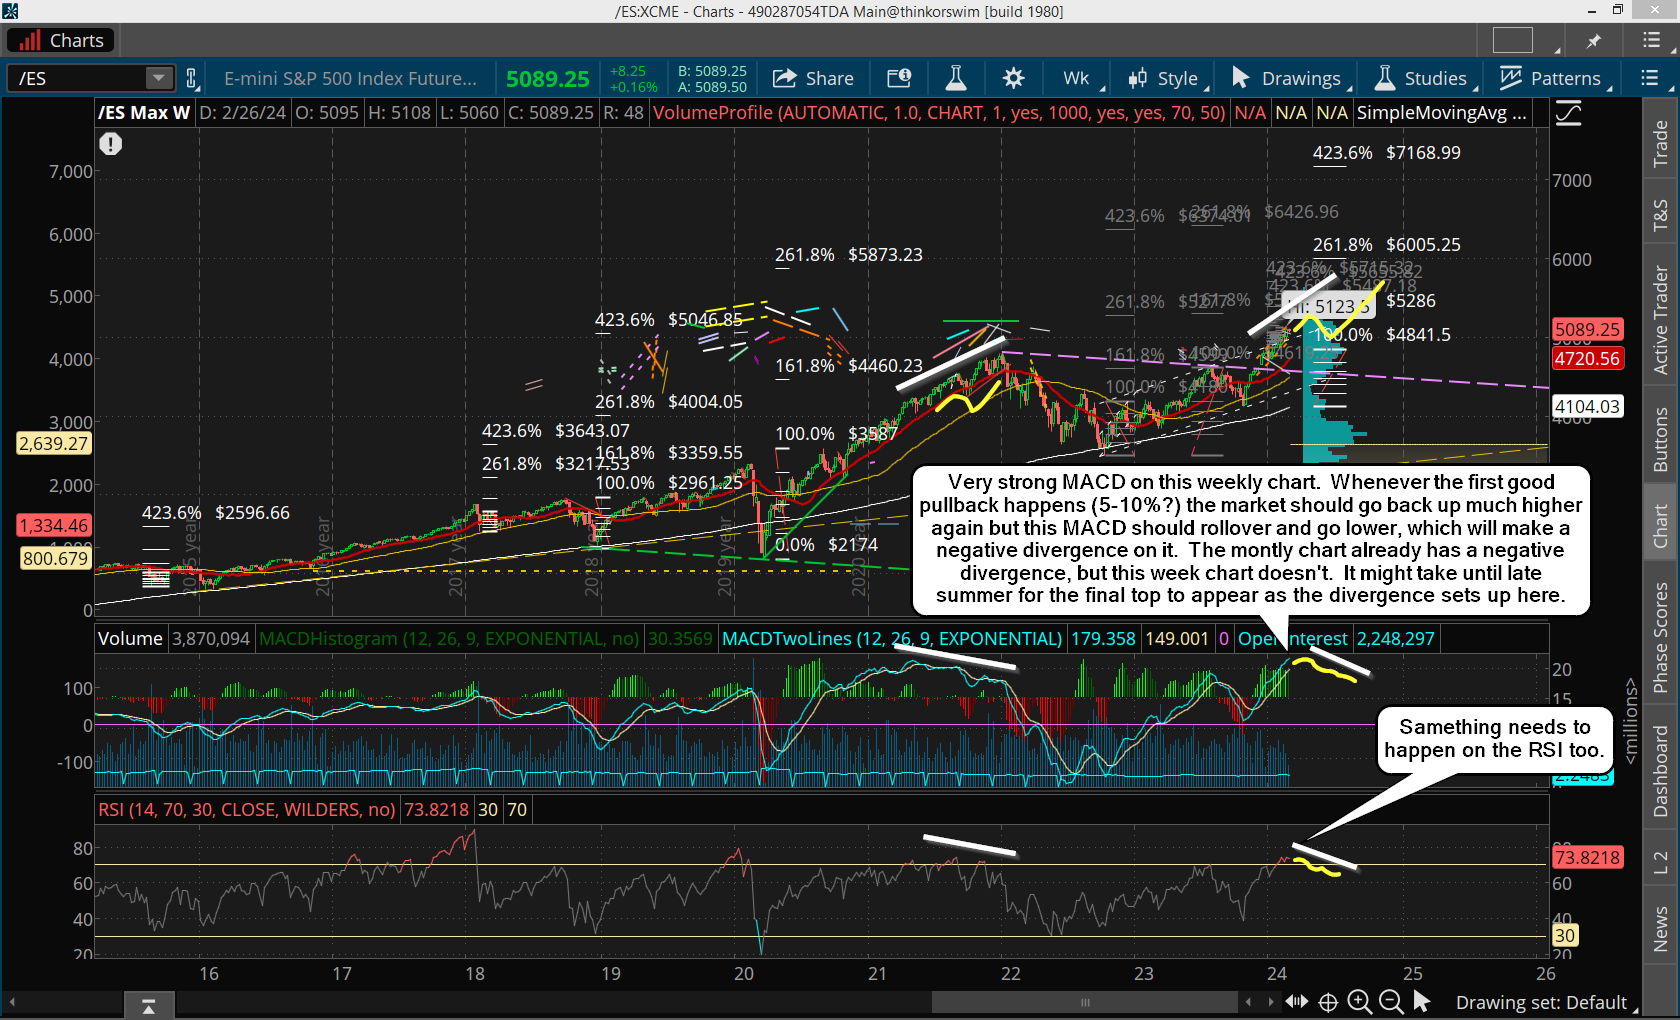
I also noticed that many (most) of the prior patterns over the last 20 years, that did have this ABC up, all rallied about the same amount in percentage terms for that C wave.  What I mean is that when I measure the start of the rally up from the very bottom to the high of the A wave as 100% the point where 161.8% is located at seems to be where the next important top is at, which is the end of the C wave up.  Here's a chart of it...

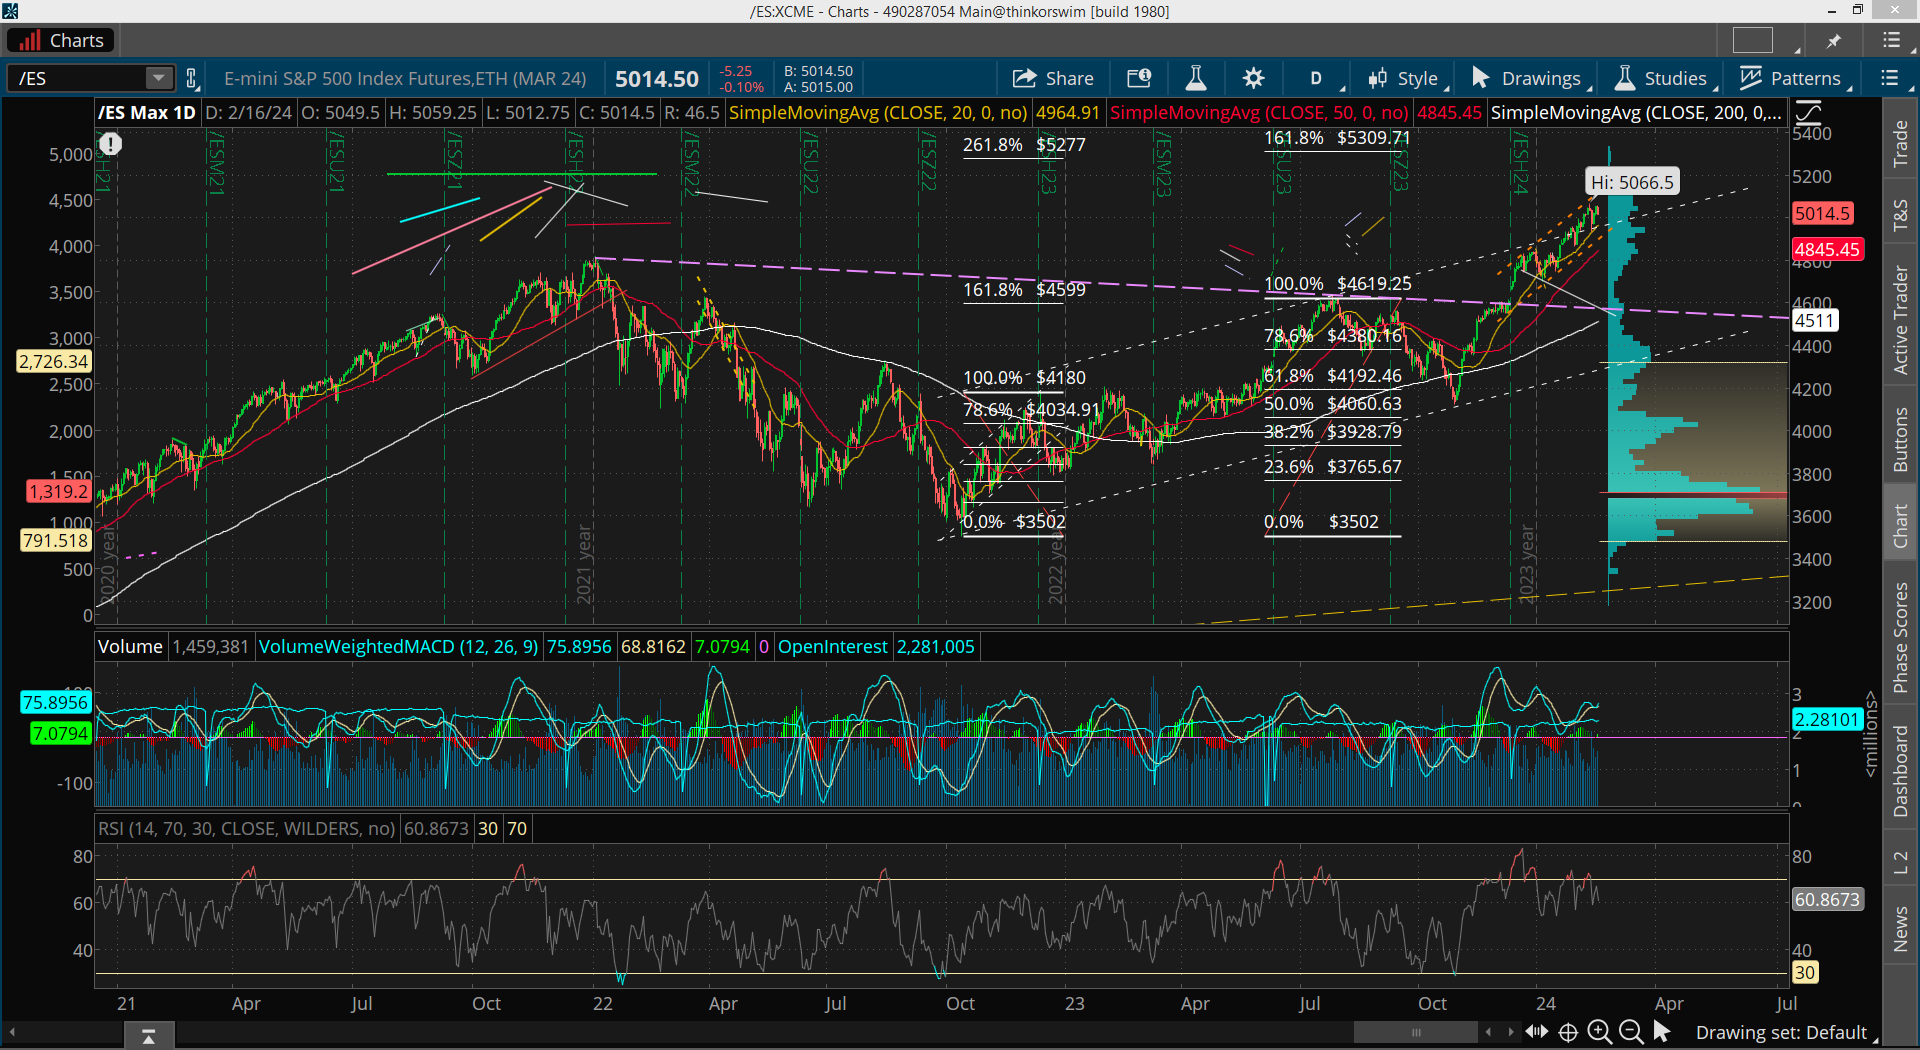
The first rally up from the 3502 in October of 2022 topped at 4180, which was the A wave for that move.  The 161.8% mark of that rally was 4599, and that was the next important high area on 7/31/2023, with an actual high of 4619.25... and that's super close in my opinion.

On my Alternative Bullish Wave Count chart (and Extended) I labeled that A wave as the top of Medium Wave A, and it foretold the top for Medium Wave C extremely well.  Now, that ABC created a Large Wave A (or Large Wave 1, but again, my research says it's an A wave), which when you look at the 161.8% mark of it you get a projection of 5309.71 for the high of Large Wave C.

So, odds are VERY STRONG in my opinion that we reach that level before any rally strong pullback (like 7-10%) happens.  I think we reach it into the March 22nd turn date, (after a small pullback into the February 26th turn date first).

After that pullback I just don't know?  We could do another leg up to 6000 or that could have ended it all and we go down the rest of this year.  Hard to say right now but let's not put the cart before the horse here.  It's better to just get the next big moves correct and worry about every other move when it's closer.

In fact, when I looked at many prior patterns in the past they were mixed on whether or not the final high was in or not.  Sometimes it was the final high, but most of the times it wasn't.  Let's look at those charts now.

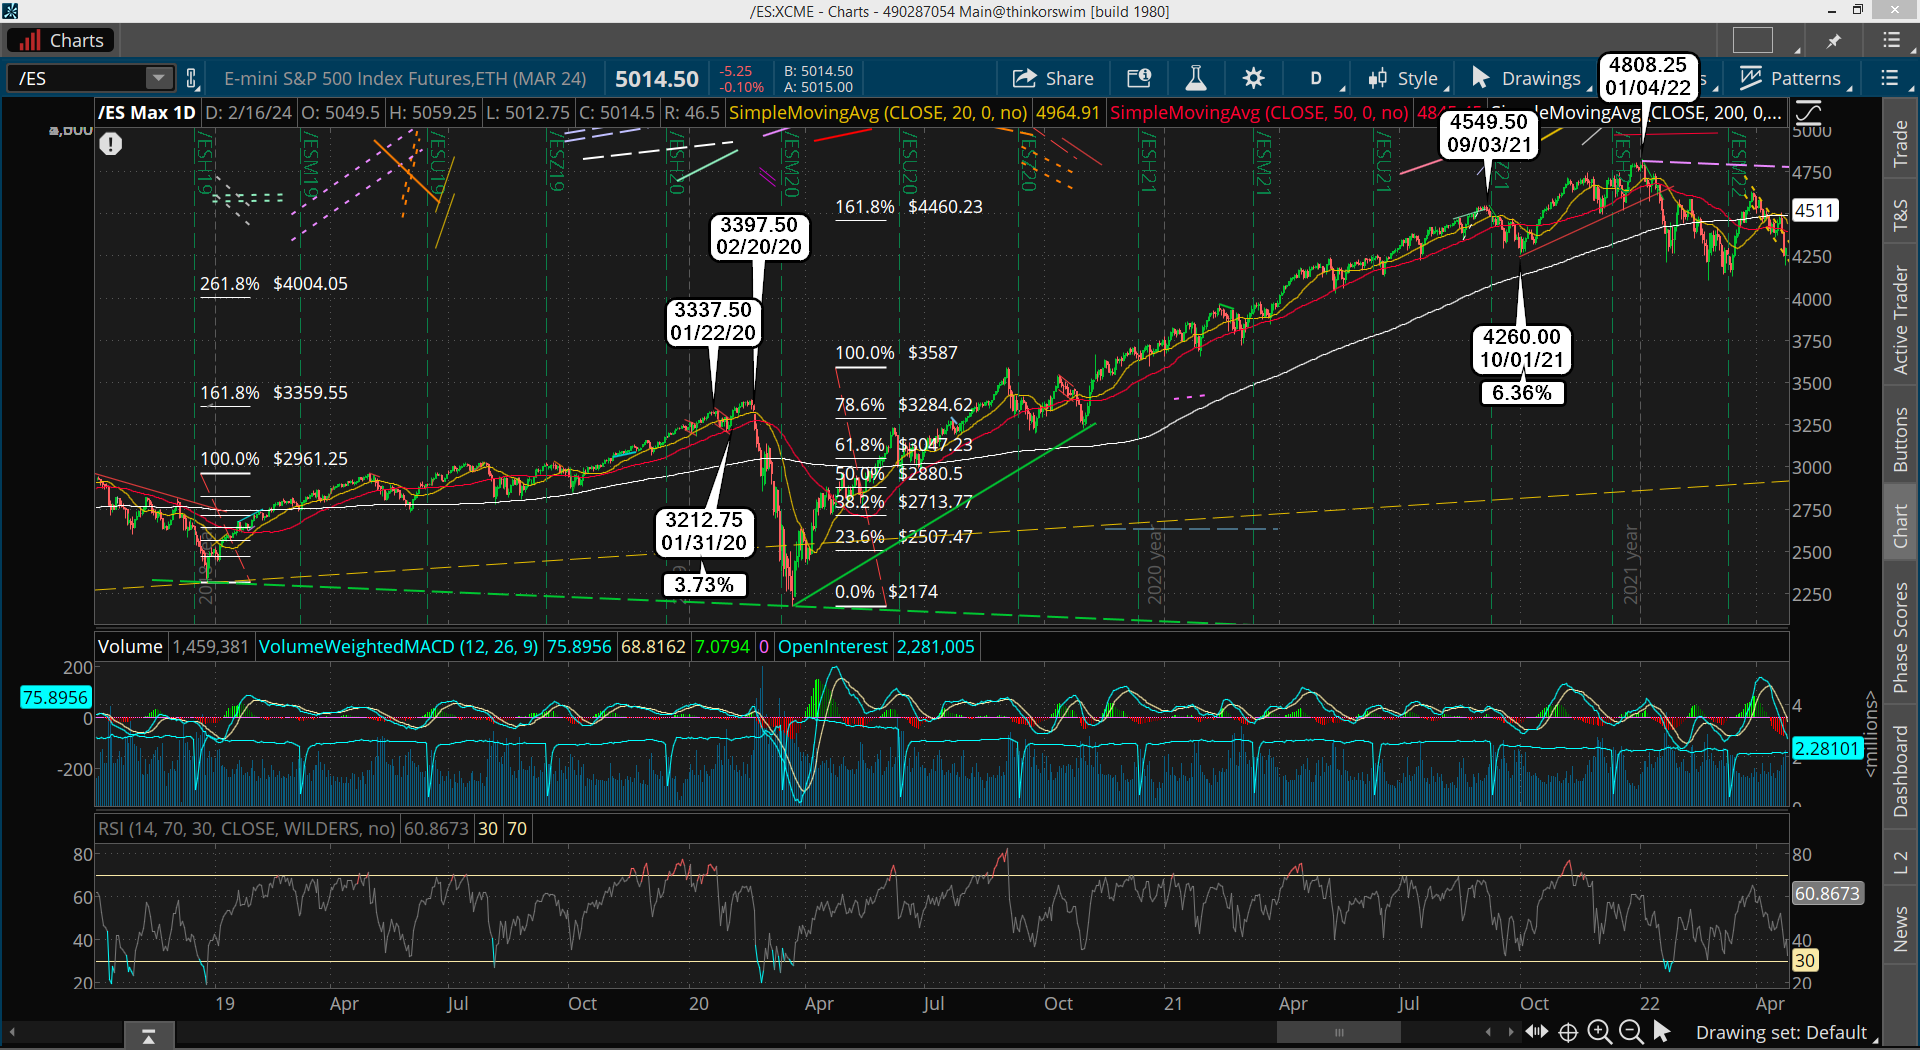
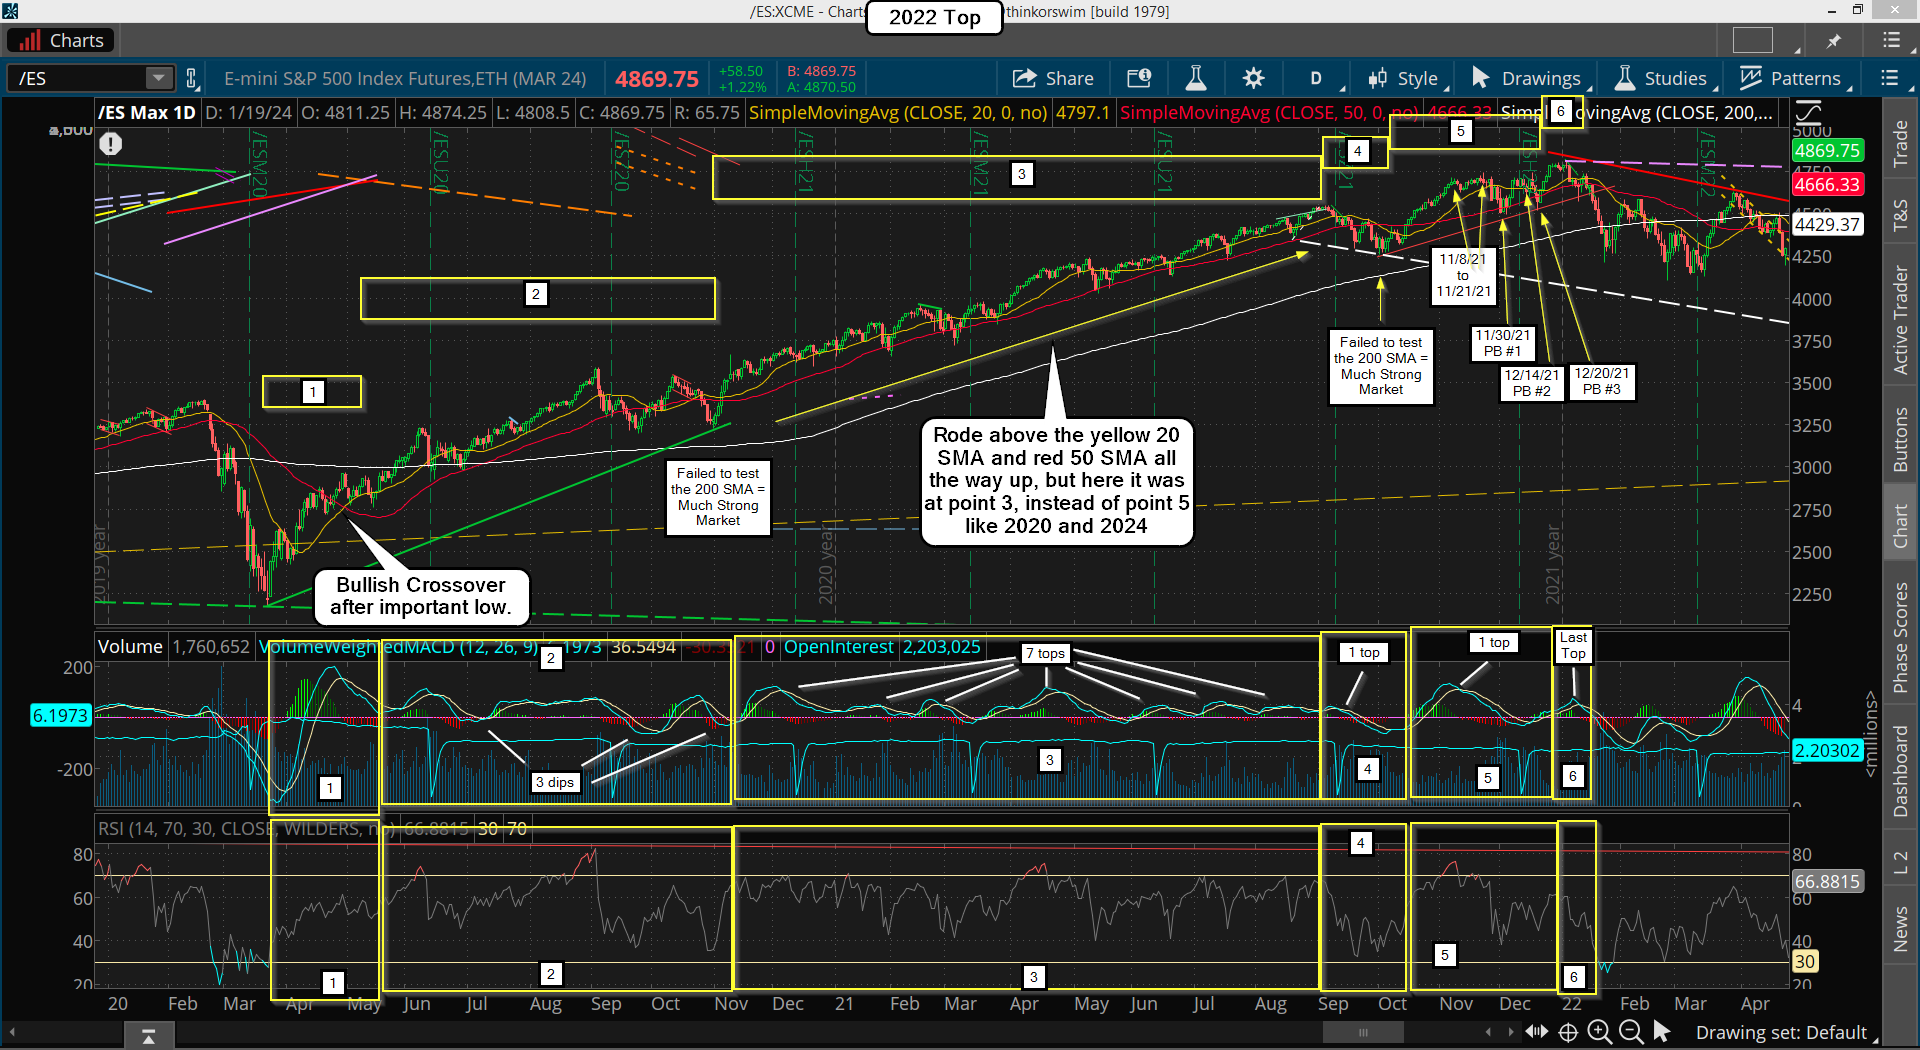
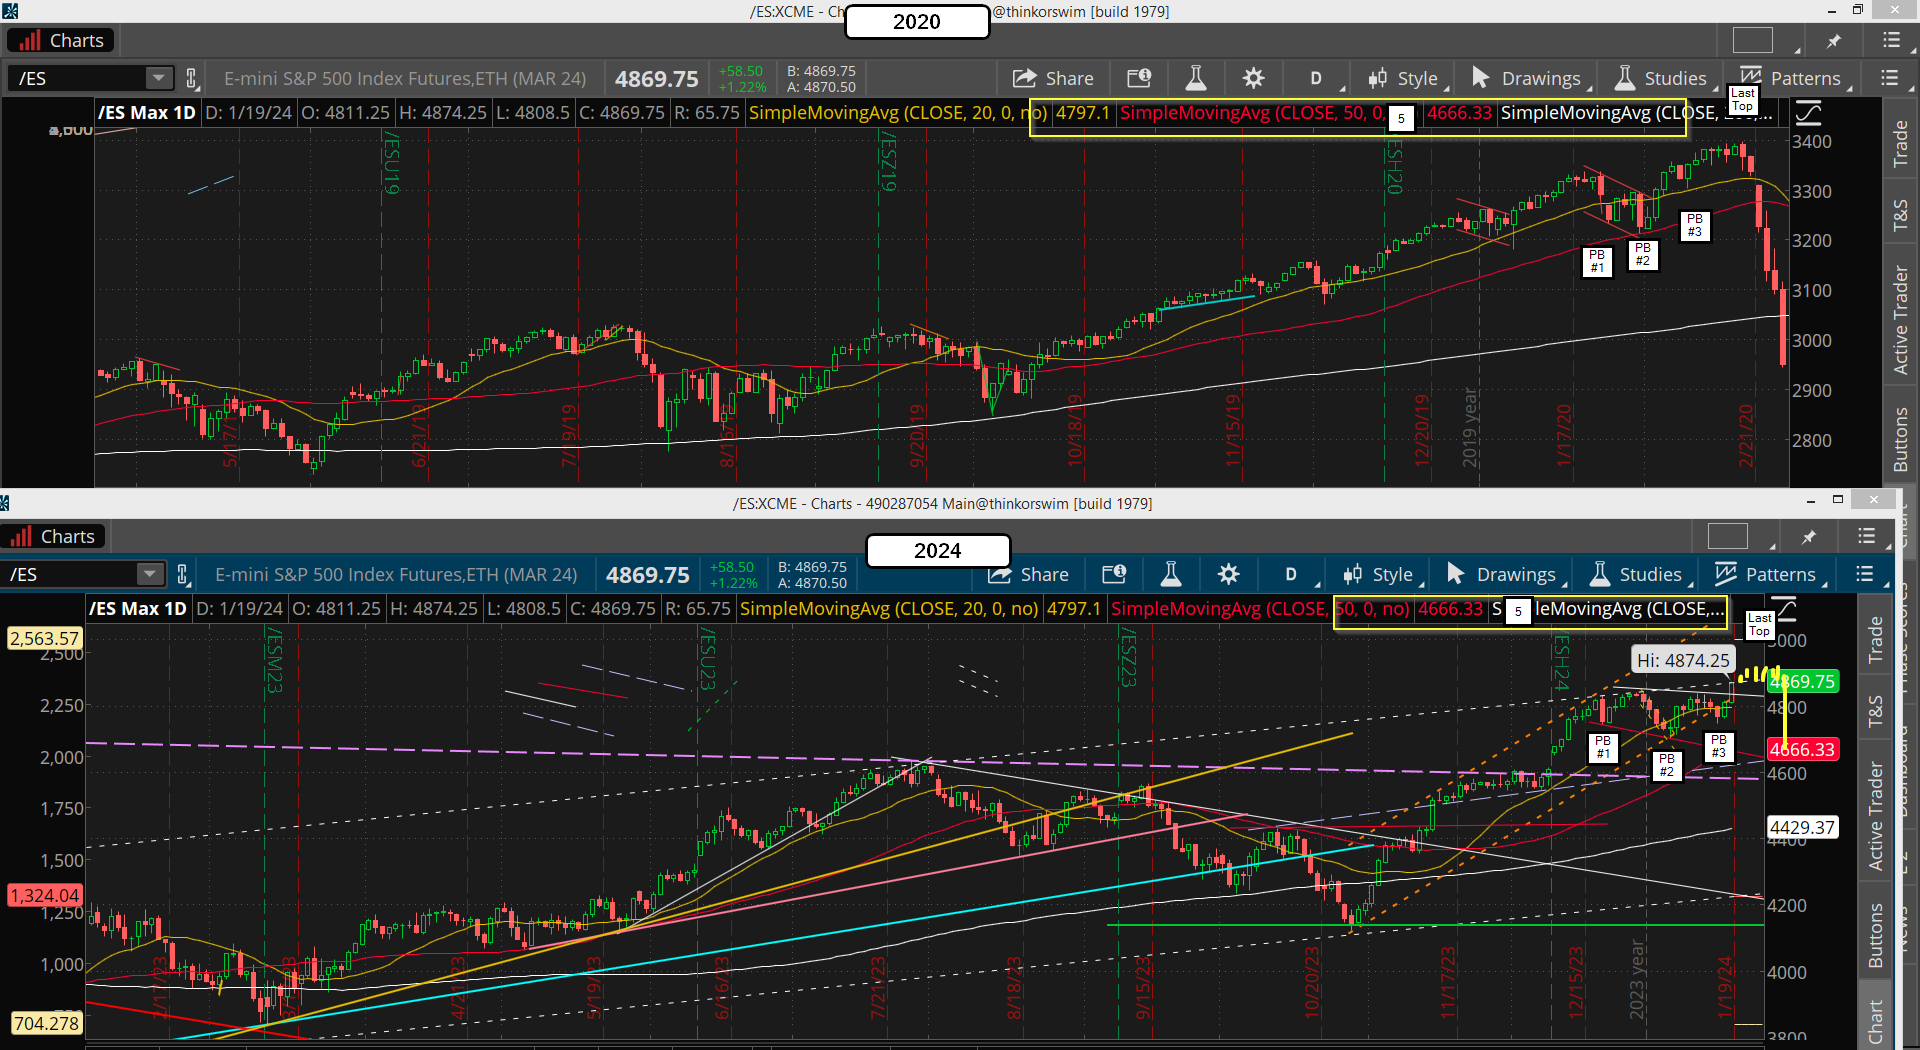
Above we have the 2020 and 2022 chart to study.  On the 2022 part I've marked the first major rally up (the Large A wave) as ending at the 3587 high.  Then when I do the Fibonacci on it the 161.8% level points to 4460.23, which was NOT the last high.  The market fell shy a little at 4549 and then did a 6.36% pullback before another strong and final rally up to the 4808.25 high.

That could be what we see happen this coming March 22nd, where we reach just shy of the 5309.71 projected target and from there we start a 5-10% pullback.  Then back up into April and May for some even higher high, and possibly the final one?

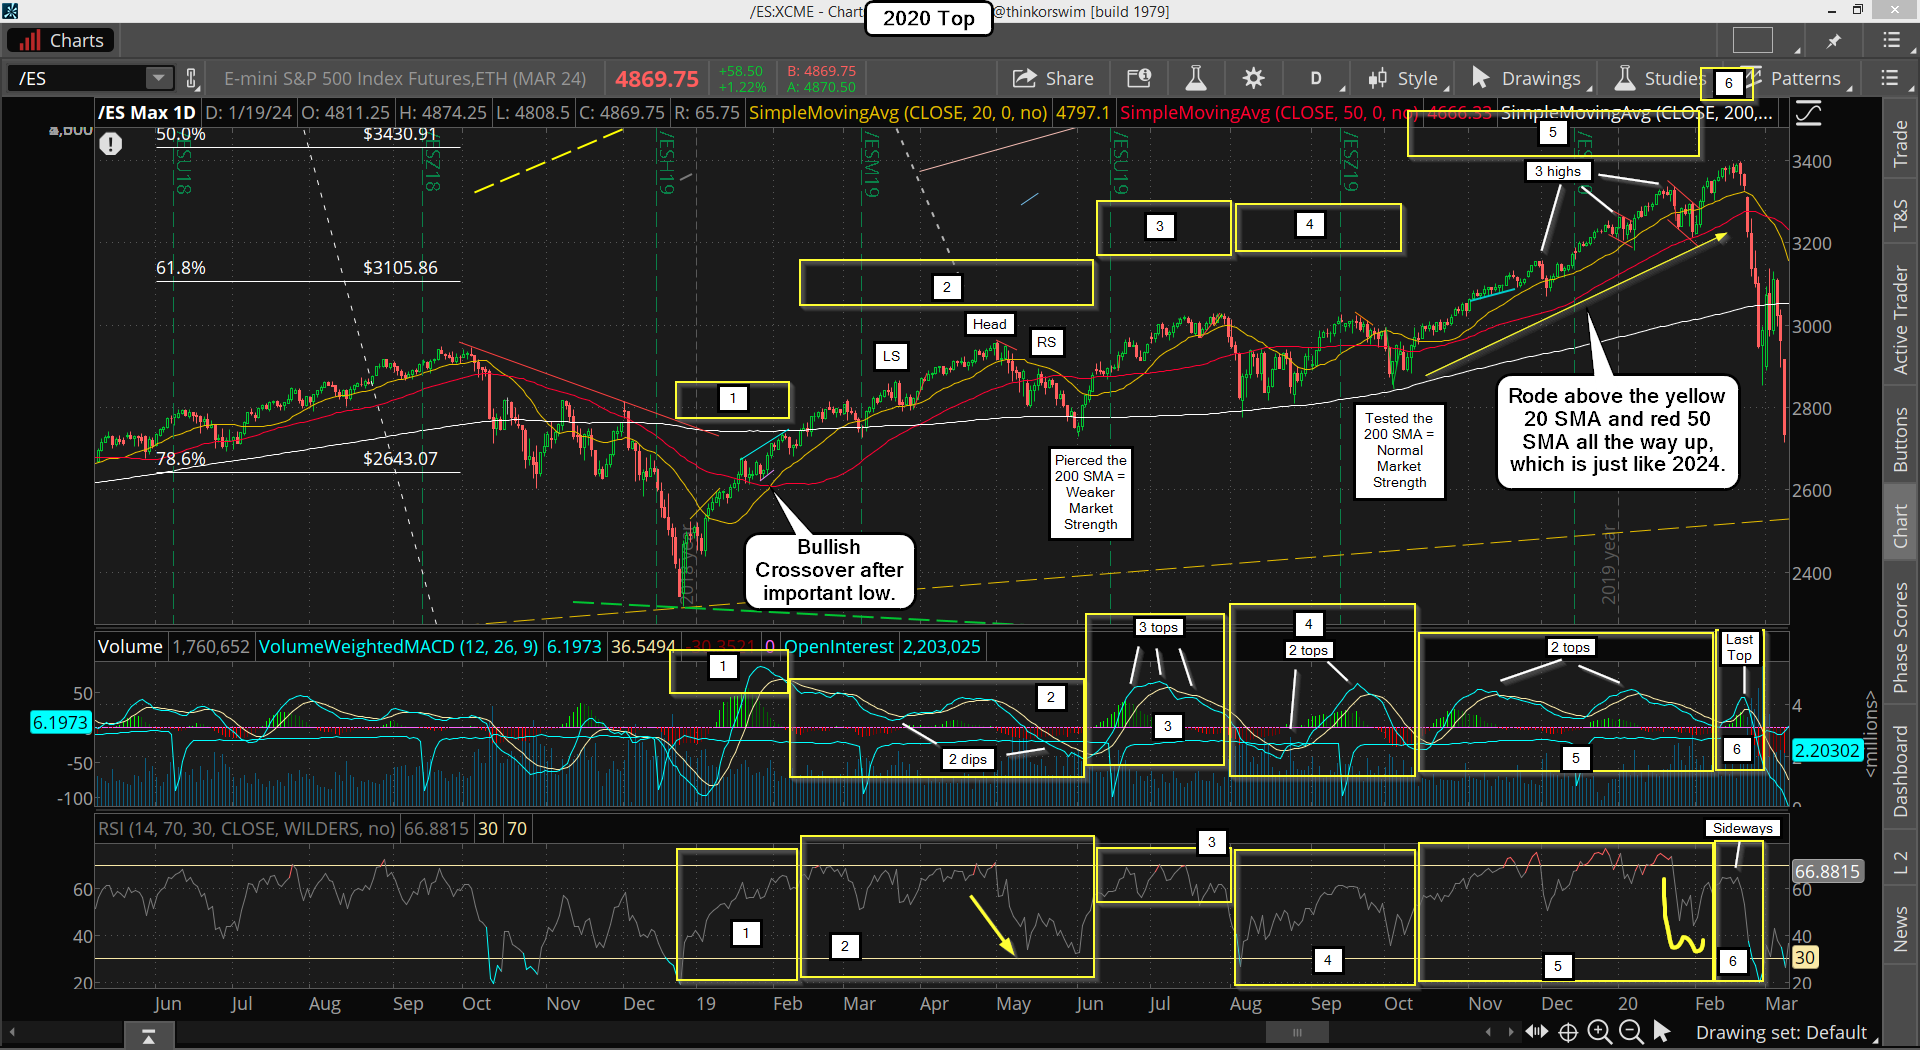
Looking at the 2020 section of the chart you can see the same thing basically, a rally up into the 161.8% area, which stopped shy back then to at 3337.50 instead of the 3359.55 target.  A pullback of only 3.73% then and one more higher high followed.

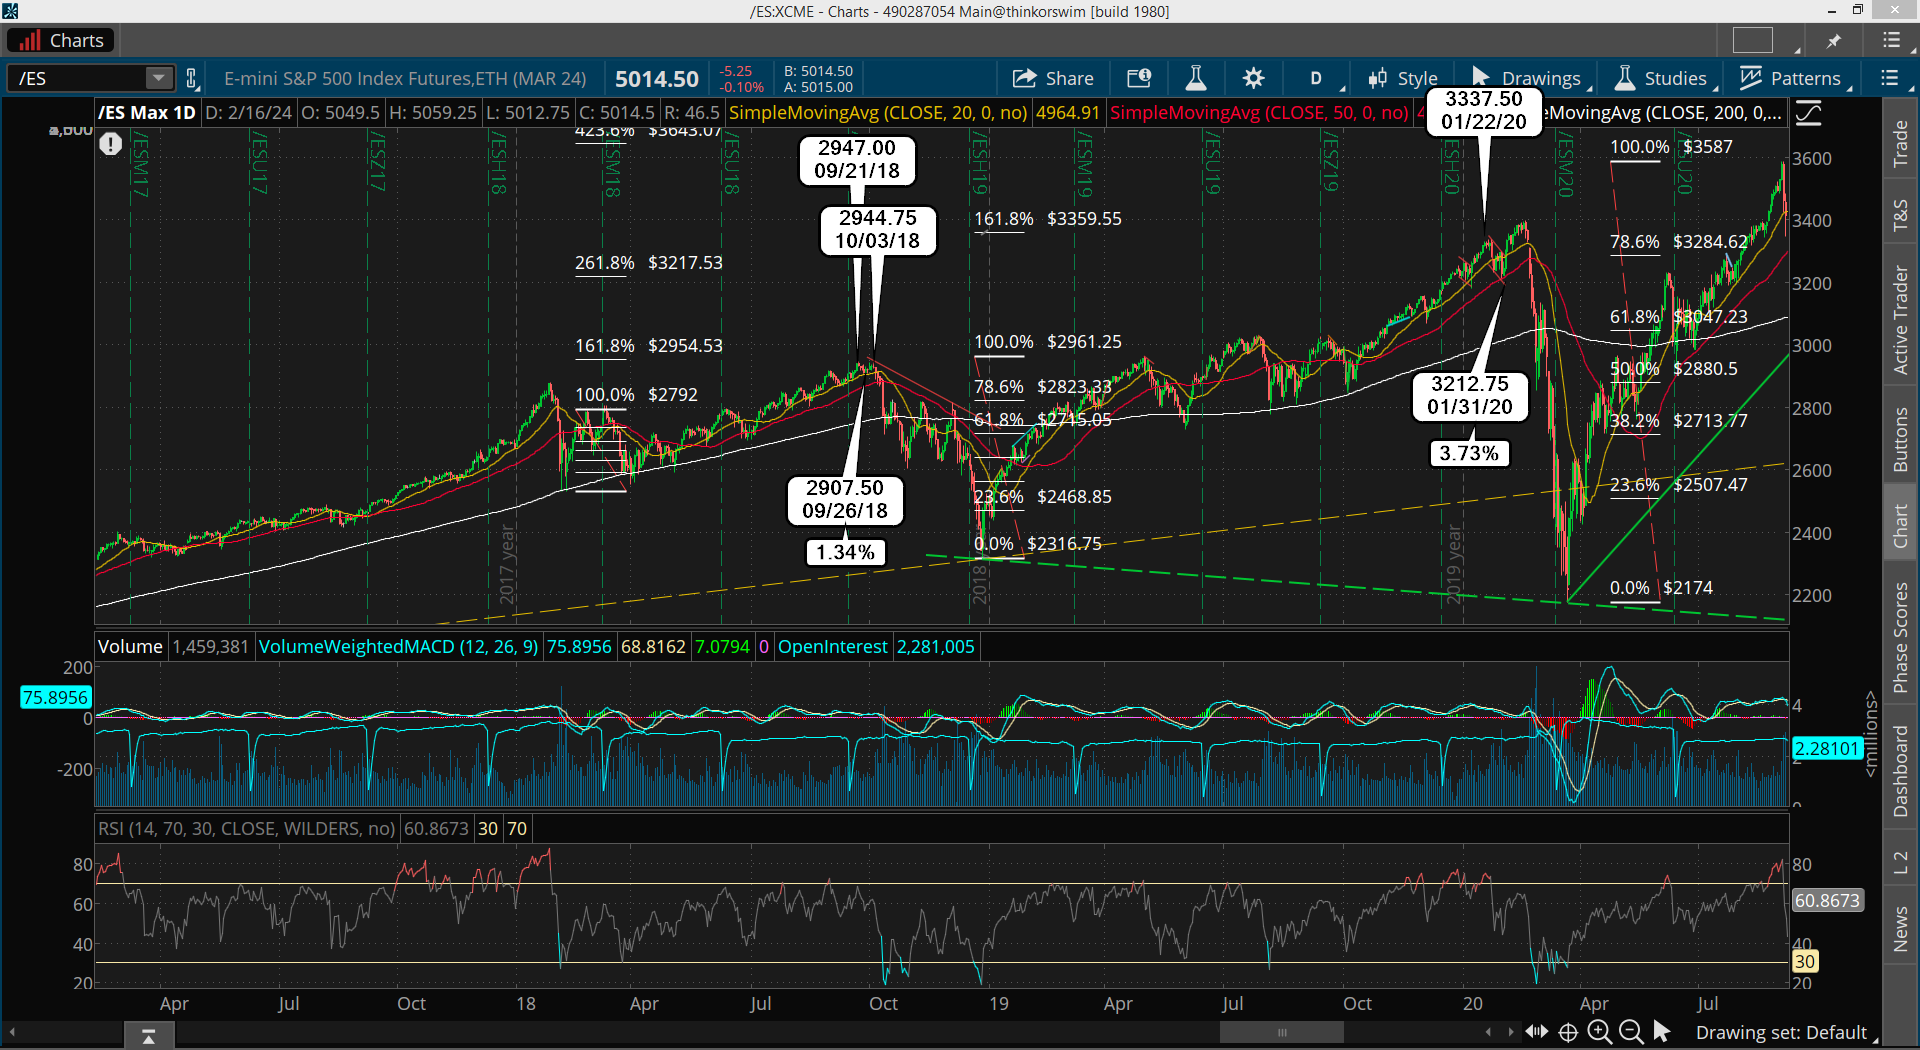
On the next chart (above) I cover the same 2020 period but also the 2018 chart.  You can see that back in the first quarter of 2018 there was an A wave up that topped at 2792, which gave a projection of 2954.53 for the 161.8% target high.  The market rallied all year until it almost reached it on September 21st, pulled back just 1.34% and tried one last time to reach it but couldn't.

What stands out to me is that the market doesn't seem to reach the 161.8% level on the first try but if there's a deep enough pullback (3-6%?) it will reach it and pierce it for that final high afterwards.  The small pullback of 1.34% back then kept it from making that higher high and from there it crashed basically.

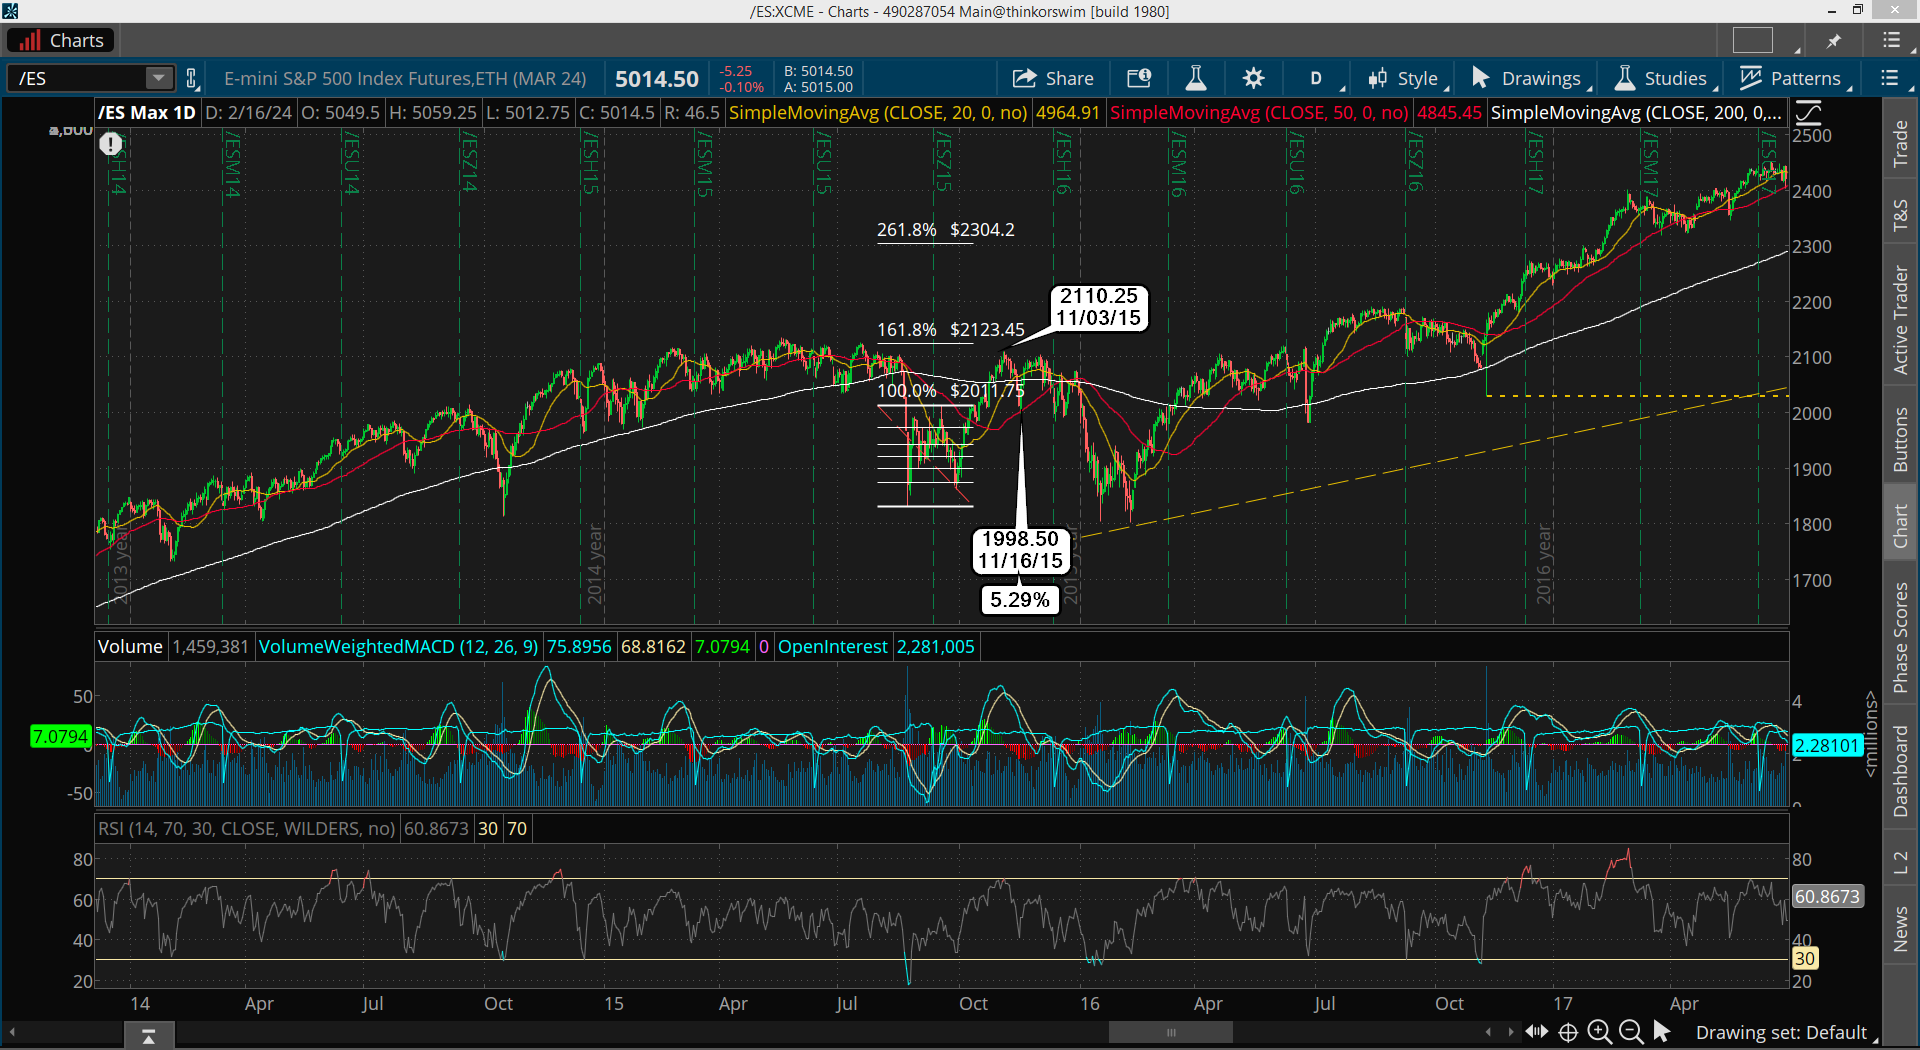
On the next chart (above) we see the 2016 period.  After the Flash Crash in 2015 the market quickly rallied back up to 2011.75 to make the A wave, and that high projected a 2123.45 target for the 161.8% extension.  The market rallied up to 2110.25 on 11/3/15 and fell shy a little to hit it like it has done many times.

It then pulled back 5.29% and made another run back up to tried to make a new higher high.  It failed and caused another large drop into late that year and early 2016.  This seems to be the pattern where if the rally up AFTER the pullback from the 161.8% target FAILS to make a new all time high the drop starts from there for the next larger and longer term correction (months).

If if makes a new higher high the multi month correction starts from that point it seems, but in both cases after that last move up (call it a 5th wave?) there is a very another large drop that follows.

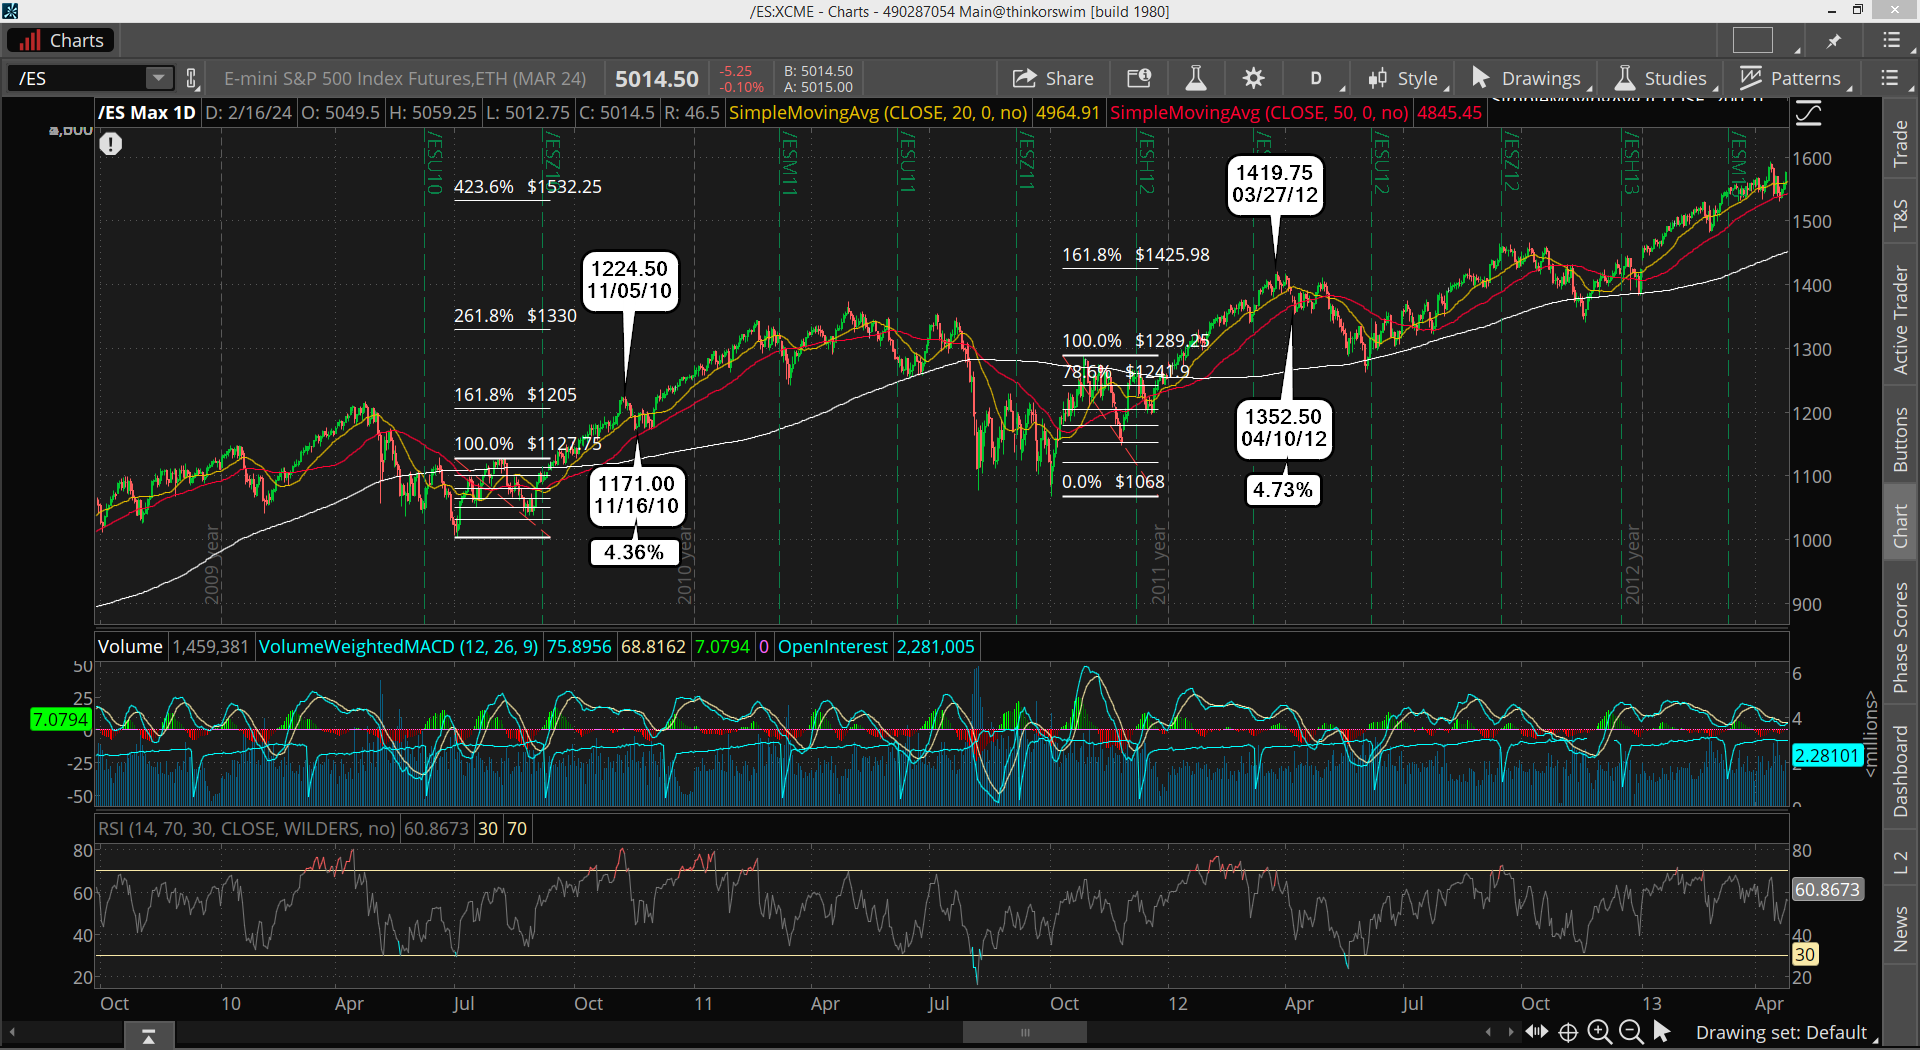
Moving on we now will look at the 2010 and 2012 periods (above).  First we examine the late 2011 rally back up for the A wave, which topped at 1289.25 and projected a 161.8% target of 1425.98.. which once again the market rallied up into it and fell shy hitting 1419.75 on March 27th, 2012.

Then we saw a 4.73% pullback followed by another rally to attempt to make that final higher high.  It failed just like the 2016 one did.  Call it a "Truncated 5th Wave" if you want?  Regardless of what you label it the same result happened... another multi-month deep correction.  It pulled back into the 200 SMA (in white) and found support there to stop the decline.  But it was probably a 40-50% pullback from the 2011 low, so a nice one to trade.

Looking at the 2010 low the first rally up for the A wave ended at 1127.75 and projected a 1205 high for the 161.8% extension.  The market rallied up nicely an pierced that level this time around with a high of 1224.50, and then did a 4.36% pullback.  It held on the 50 SMA (in red), so from there another rally up followed.

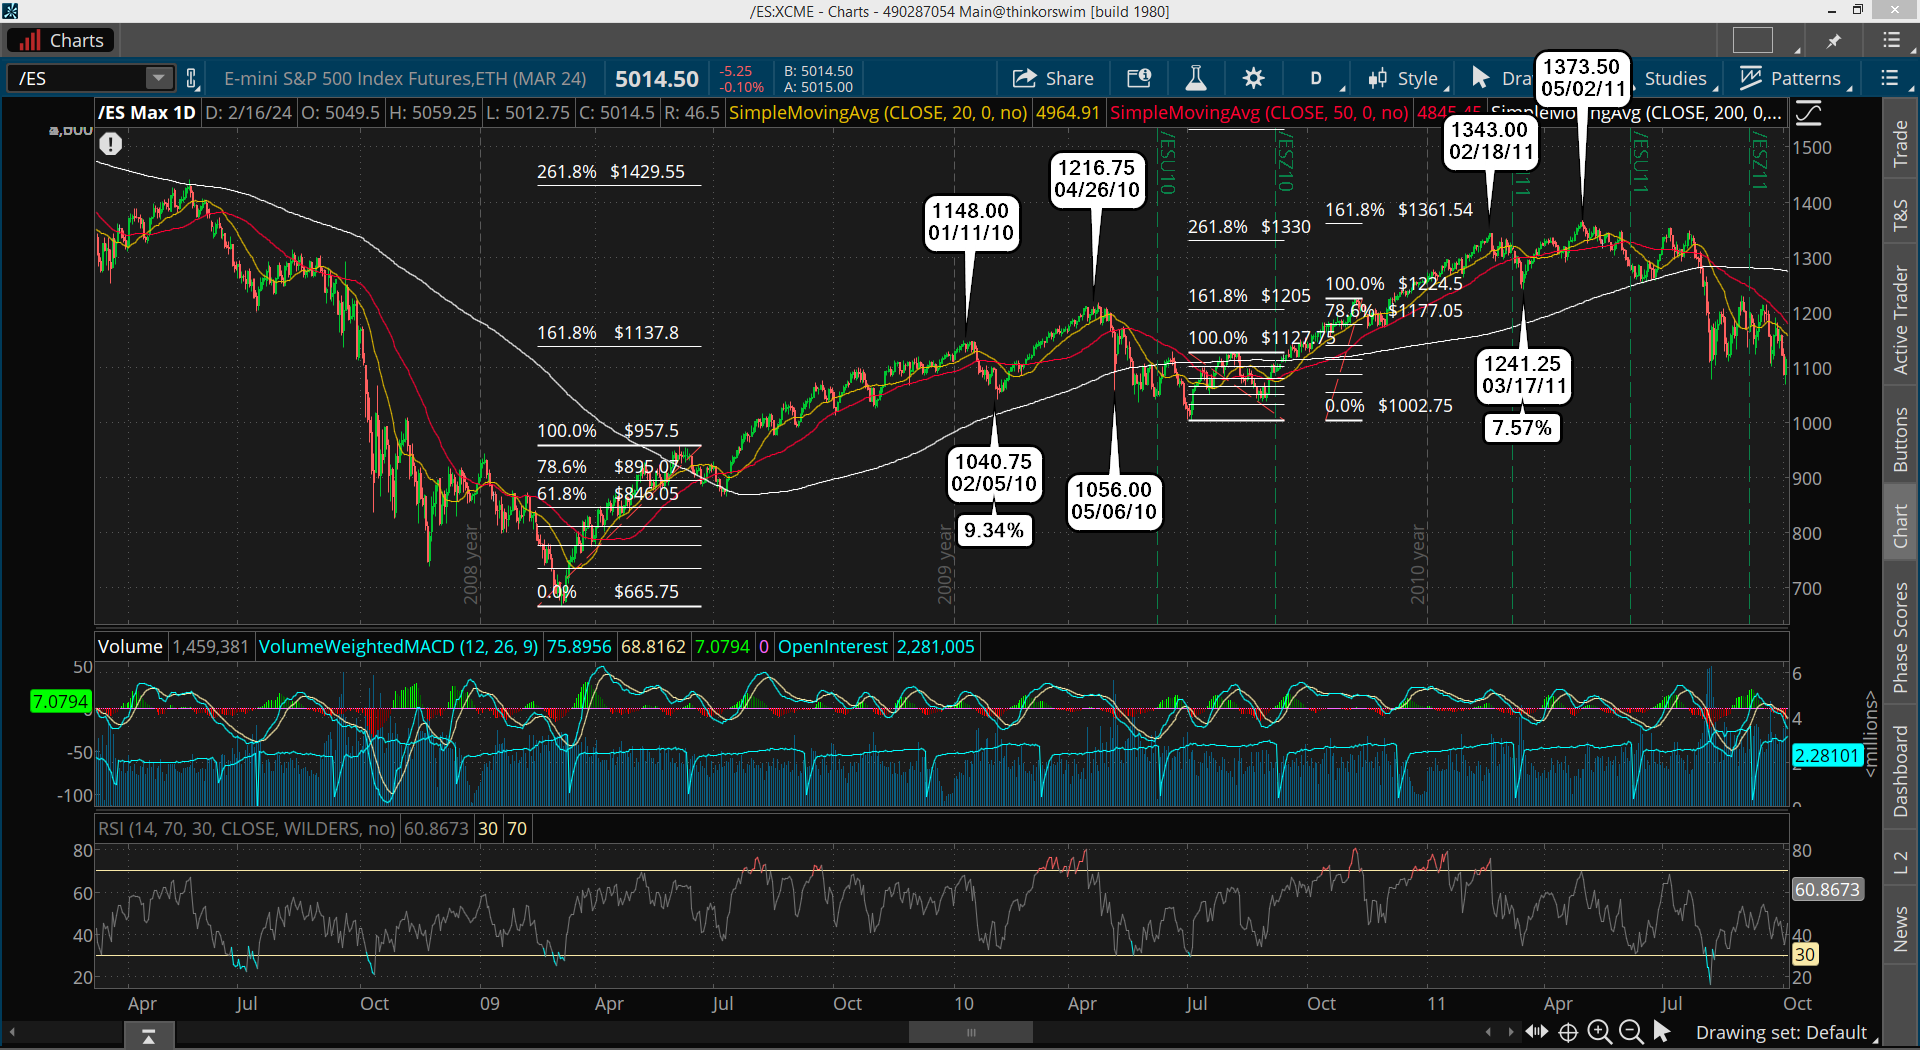
Going back further now we study the 2009-2011 period (above) and you can see that I added the period after that 4.36% pullback to see if the rally that followed could be projected to as well.  I marked the top of that A wave at the 1224.50 high and it projected a 161.8% level of 1361.54, which the market rallied up into 1343.00 on 2/18/11 (fell shy again) before pulling back 7.57%, which then gave the market enough fuel to make another higher high on 5/2/11 of 1373.50 to pierce the 161.8% level successfully.

Looking at the famous 666 low in 2009 we see the A wave high was 957.50 and it projected a 161.8% target of 1137.80 back then.  It was hit and pierced on 1/11/10 and then produced a 9.34% pullback before rallying again into 4/26/10 where a larger multi-month correction followed.

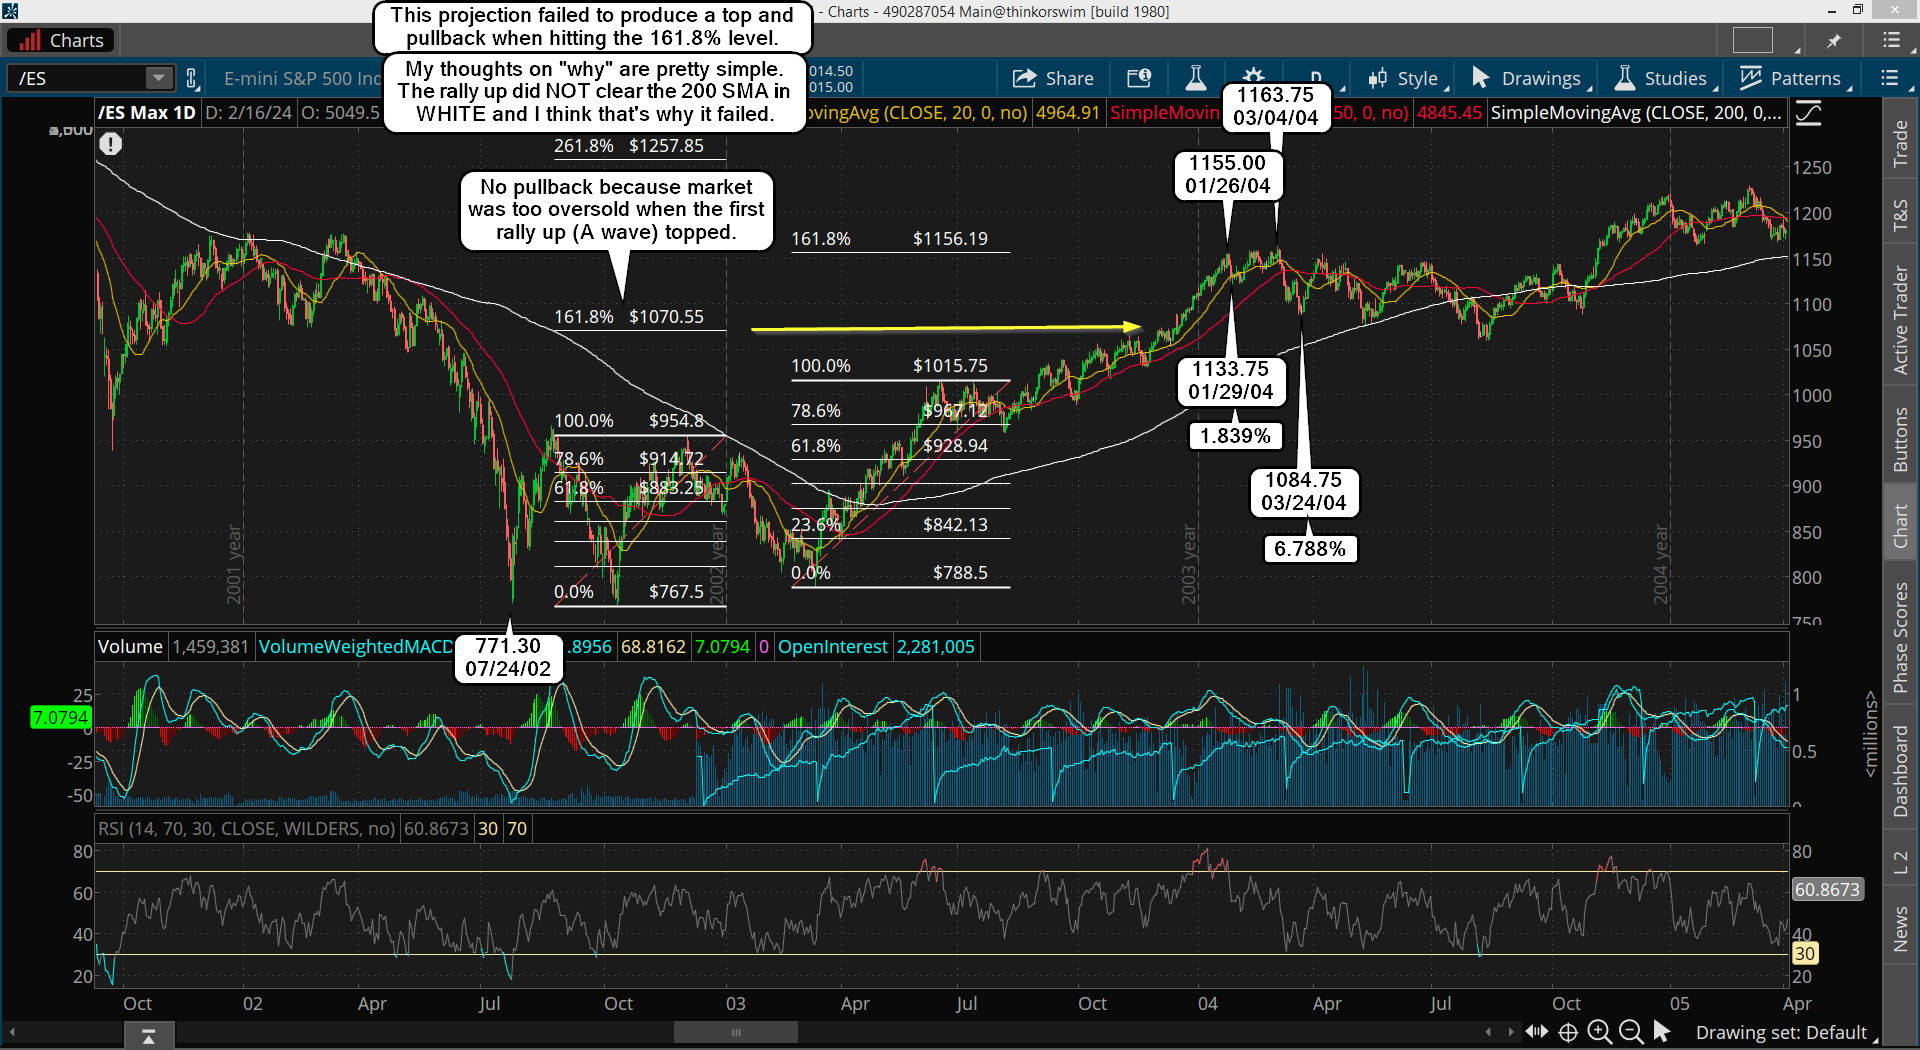
Lastly let's look at the 2002-2004 period (above) to see what happened back then.  I marked two different levels for the high of some A wave up.  The one in 2003 into 2004 worked again as the 1015.75 high for the A wave targeted 1156.19 for the 161.8% extension and the market hit 1155.00 on 1/26/04 falling shy as it seems to do a lot.

Then a small pullback of only 1.839%, followed by a final attempt into 3/4/04 where it pierced it successfully and reached 1163.75 before a multi-month correction started.  It was a slow an drawn out one but the pattern still repeats it seems.

Now looking at the 2009 period the 954.80 high for the A wave projected a target of 1070.55 for the 161.8% extension, which was hit and pierced, but the market continued higher there without doing the typical 3-9% pullback.  I can only think that happened because the market was so oversold on the monthly and weekly charts that there was too much upward pressure to allow such a pullback so early after the 2 year correction ended.


Conclusion...

If after the pullback into the 26th the rally up into March 22nd gets to the 5250-5300 zone a week or so PRIOR to the 22nd, and it pulls back 1-2%, then the move back up might ONLY put in a double top like 9/21/18 and 10/3/18 did (lower high back then, but could be a slightly higher high this time) I'd say we will have topped for the year and will drop hard like 2018 did.

Or... if after the pullback into the 26th the rally up into March 22nd tops inside the 5250-5300 zone on that date then odds suggest we'll pullback some decent amount of 4-10%? and then rally up into April or May for a higher high to end the entire rally up from the 2022 low of 3502.  From there we drop hard the rest of the year.


Have a blessed day.

ES Morning Update February 16th 2024

0

Ok, looks like the pullback is over and we are off to the races on the upside into the next major turn date of March 22nd, which should be the final top for this rally. Next Monday the market is closed for presidents day, so that entire week might have light volume, which favors the bulls of course.

I don't know how high we go but when we top I don't think there will be a single bear left. That will open the door for a crash, and that's very possible if this plays out like I think it will. There is a Lunar Eclipse on March 24th/25th and Full Moon on the 25th, with a Solar Eclipse on April 8th... so everything will be setup for a crash if the market wants to do it.

I don't know what the wave count will be but I'll try to figure it out going into that date over this weekend. It really doesn't matter as I'm sure that once the date arrives I'll be able to look back and figure it out.

I'm quite confident about this next turn date being the final high now, whereas if we had started an 7-10% correction last Tuesday we could have pushed out the last high into August or September, but now that we just had a short lived tiny pullback that ended already it means we are going up into next month for sure, and will drop very hard afterward. If you are a bear it's best to save your cash and wait for March 22nd to arrive.

Have a great weekend.

ES Morning Update February 15th 2024

0

After I wrote yesterdays update I posted on Twitter and in the chatroom that I didn't like the looks of the rally back up and that I was worried that it could kill the bearish case. Meaning that we needed to roll back over yesterday and start the next leg down. That failed to happen as the market chopped all day and rallied up into the close to hit the 5015-5020 zone, which is the "line in the sand" for the bulls versus bears.

Above it and the lows are in with just that one big down day on the 13th, so my turn date put in a low instead of a high like I wanted and thought would happen. The pullback has turned out to be my Alternative Bullish Wave Count that projected the smallest move down it seems.

If you go back and read that Monday update I was looking for about 4875-4900 for the low and we hit 4936 as the low. That wasn't even 23.6%, but it is what it is I guess, but it was the wave count I leaned to the most. I just thought it would last more then a day or so, but they did everything in just 2 days and completed the pullback. So unless the bears and take the market back below the 5015-5020 zone odds are very strong that the low is in now and we are off to new all time highs and beyond again. I'll now be looking for March 22nd as the next possible "turn" in the market, which should be a top I think. We shall see.

Have a blessed day.

ES Morning Update February 14th 2024

0

Ugly day for the bulls yesterday. I thought that maybe we would get a nice bounce back up but it was small and we continued down lower with just a midday small rally. At this point I think the high is in and we are going down for several more days before we get a multi-day good bounce.

I think we bottom into Monday and then have a strong rally up into Tuesday the 20th, but that could extend into Tuesday/Wednesday of next week. That would be a bigger degree B wave I believe and then we get the final C wave down into the 26th to end the correction.

How low you ask? That's a tough one but the 4600 zone is what I'm leaning toward. Maybe we get more, or maybe less, but that's my thoughts on it. I don't think we get much of a rally on the upside until we first go lower. I know that many people are just looking for this to be short lived pullback that is about done, and that we get one more higher high, but I don't see that now.

We got close enough to the 5080-5090 target on Monday and now we should be in a correction mode for several weeks. I've covered all my thoughts in great detail on Mondays update, so not much else to add.

Have a blessed day.

ES Morning Update February 13th 2024

0

Yesterday opened flat, and I thought it would stay that way all day as the market waited on the CPI this morning. But instead we started to rally up and got all the way to 5066.50, which is just shy of the 5080-5090 zone, and could be "close enough"? Meaning I'm not sure if we go any higher on not today? Today is the 13th and is the date I was looking for to mark the top but it yesterday could have been it too.

Here's my best guess on the very short term wave count. Again, it's just a guess, so it's likely wrong. Meaning that we are super close now, and my ET5 might not happen? We could have topped yesterday at ET3, which I'd just relabel to call it ET5.

That is my Alternative Bullish Wave Count, but I really don't know which one we will do? We could be on the First Bullish Wave Count (a medium bearish one) or the Second Bullish Wave Count, which is my most bearish one. It's a toss of a coin here to which one is right, but the important thing is that all three of them are bearish ones, which means we will go down some amount in the next few weeks. Whether or not it's 4%, 7-8%, or 10-12% is what I don't know, but once it starts I should be able to get a better idea of which path we are on. I will just plan for the least bearish Alternative Count and be happy if we see the most bearish.

Have a blessed day.

ES Morning Update February 5th 2024

0

Incredible move on Friday, and we almost hit the 5000 level. It's still coming and probably a whole lot more. While I think we'll see a top between 5050-5100 this week, where a nice pullback happens, I have no idea how deep it will be? Going into mid-February the market is quite bullish on the Seasonality chart, so the pullback could be brief again, just like last week only had some of Tuesday and all of Wednesday down.

This rally has legs for sure and is going higher then I expected, but I'm just going to keep following it up until I see some real signs of a top. Right now I don't see that, but only see resistance in the 5050-5100 zone. The pullback after that area is hit might be just a few hundred points and then back up again.

Remember that there's still no negative divergence on the weekly chart like I had hope would form, but instead it was canceled. Yes, it's still there from the 2018 high and the 2020 top, but that's longer term and isn't accurate enough for the coming weeks ahead. We need to see a top on the RSI here soon, and then the market go higher while the RSI goes lower, and that's just not here yet. Look at the weekly chart below...

Weekly Chart

The RSI went up higher then the previous high the second week of December last year. And the MACD's are still pointing up strongly too, with no weakness in sight. While I still think we can see a short term top soon, the final high could be many weeks away, or even months (but I doubt too many). From what I'm seeing this could continue into March easily, and possibly April. It's unknown right now but I can't get super bearish here as there's nothing but bullish strength still on the weekly chart. And the monthly is also bullish as shown below...

Monthly Chart

The daily is very overbought... sure, but if the weekly and monthly are bullish then the pullbacks from the super hot daily will be short lived. I'd love to see a multi-week drop but that's just not showing up as likely in the technicals right now. I only see short lived pullbacks. Looking at the daily chart I can see that after we get that last spike to 5050-5100 we should have a fast drop to "cool off" the RSI and MACD some.

Daily Chart

I'm going to have to look at the bullish wave count now as all the technicals tell me this market is NOT ready to crash and is going up much higher in a blow off top. I can't just draw what I "want to happen" but MUST draw what the technicals tell me, and they are still quite bullish on the higher time frames.

I mean, how can I just ignore the obvious? All the moving averages (the 20, 50 and 200) are aligned very bullish on the monthly and weekly chart with zero signs of turning bearish. So I have to ignore the bearish noise out there and just let the technicals speak to me. They say that this market is going up higher, and a higher by a lot more. We could be in a larger degree wave 3 up right now, and no one see's it until it's over with. Below is the bullish wave count I'm talking about...

Main Wave Count

Alternative Wave Count

Now I am not an uber bull, and I'd really consider myself more of a bear if I had to label myself anything.  But this is what the wave count suggests, and the technicals back it up.  Plus you have that interview that Steve Bannon did with a hedge guy that said that the Demoncrats are likely pumping money from the Treasury into the Stock Market to try and make Pedo Joe look good.

He also said that smart money is front run the election as they think Trump will win, and that's another reason that we see the market keep going up and up and up.  It all lines up now to having the mega blow off top this year and the crash too.  A friend of mine gave me the chart below a few years ago..

I had forgot about it but just remembered it this weekend and went back and looked at it again.  The thing to note is that the last time the chart looked like this was in 1929... meaning the extremely high peaks on it have not been seen in the last 95 years.  Now make of that what you will but it sure is something you want to put in the back of your mind.

Last, don't forget about the Presidential Cycle.  As one president leaves and another one comes in, which should be Trump, the stock market dumps and history shows you over and over that this pattern repeats.  You can look back at the prior post I did about it here...

https://reddragonleo.com/2023/10/14/the-presidential-cycle-says-no-new-high-this-year/

Biden is leaving, no matter what.  If the Demoncrats succeed in cheating again and install someone else (Gavin Newsom, Micheal Robinson [aka Michelle Obama], or even Nikki Haley) it will still be a new president.  Every time a president in office leaves the market tanks.  And Pedo Joe is not getting a second term... everyone knows that.  So after this last mega rally you can count on a mega crash following it.

Clearly I was wrong on the drop to 3000 on that prior post on it, but the information about the cycle is still correct.  Back then I just thought we would make that lower low first and then rally up into 2026-2027 for the final high.  That's changed now as they have sped it up to make it happen this year.

I wouldn't be surprised if they try to delay the election because of the crash... who knows?  But all the technicals point to a massive final rally up first (the next few months) and then a great depression crash to follow.

Have a blessed day.

ES Morning Update February 2nd 2024

0

We did not make a lower low yesterday, so I have to say that low on Wednesday was the end of an ABC down from the Monday high, with the C part bottoming on Wednesday.  Then after hours the rally continued and it turned into a nasty bear squeeze that made a new all time high on the ES.

So we have two different paths here, depending on whether or not the SPX makes a new all time high at the open too, which is... ONE the entire ABC down was just a larger A wave and that we are in a B wave up now, which would subdivide into another ABC of course.

Posted in the Chatroom Thursday, February 1st, 2024.

If so, then we should make a lower high (on the SPX cash, as again the ES has already made a new high) and then we'll see another drop for the C wave afterwards.

Or TWO, we make a higher high (over 5000) into early next week (probably Monday) to finally end the rally up and allow a multi-day (or week) pullback. It's looking like path TWO at this point, but if it's the first path then we won't see the top until the week of OPEX most likely.

Posted in the Chatroom Thursday, February 1st, 2024.

Meaning the C wave down (after this B wave up finishes today) should drop to 4700-4800 into the end of next week. And from there we rally hard to 5000+ into the middle of this month.  The Seasonality Chart points to a rally up into the 5th or so, which isn't perfect of course, but I have other reasons to think we will turn on Monday. If we are at a top then the turn will be down, and if we pullback into that day then it will be a bottom.

So far it's looking like we'll see the SPX cash make a higher high today, and if that happens it should carry into Monday where I think it tops out and then we start a pullback.


Sidenote:

I was watching Steve Bannon last night on Real America's Voice and he was interviewing a man that ran a hedge fund about the stock market.  He said that there is trillions of dollars in the Treasury Fund that he thinks the Biden administration is pressuring Janet Yellen to put into the stock market to make him look good, which would be to get more votes of course.

Now I just focus on the techincals but they don't ever predict "price"... just suggest when "turns" will happen based on negative or positive divergences on the various time frames, and how the MACD's and RSI's are positioned.  Pattern too is important and Seasonality as well.

So I can't tell you how high we are going but I do see 5000+ very soon, which could be just a small amount over it, or some crazy level of 5300, 5400, or higher, in some blow off top that drag out longer then I'm expecting it too.  I'm really focused on "time" and of course the technicals.  We are very likely going to top out this month as the Seasonality for March is very bearish, so odds of crazy highs are low I think.

Therefore, if there's ever going to be a large drop it likely going to happen in that month, or October, but I do not think it will last into this Fall.  Just like with the 2020 top and crash, which was blamed on COVID, they will find something to blame the coming crash on too... which will be "after the fact" of course.

Getting back to listening to Steve Bannon yesterday evening... he mentioned that if China was to invade or just put a blockade in around Taiwan that would instantly cause a 25% drop in the stock market.  This was his thoughts I believe, but it was just after the interview with the hedge fund guy.

While he's not a financial guy I do agree that shutting down our access to chips from them would cause a massive panic in the market, and let's be real here... if China was ever going to attack them it will be before Biden leaves the basement as they know Trump will not put up with it.  They must attack while Pedo Joe is still in the White House.  By "attack", I don't mean they have to use force and start a war with Taiwan, as it could just be a blockade (which makes more sense as they don't want to destroy their infrastructure).

What am I'm getting at you ask?  I'm saying that we could be in the last stages of a blow off top that could setup a huge crash.  I found the below quote on another site and I want to post it for everyone to to see and make up their own mind on it.  I have not fact checked it, but I have no reason to believe it's not accurate.

"Puetz asks what the odds are that eight of the greatest market crashes in history would accidentally fall within a time period of six days before to three days after a full moon that occurred within six weeks of a solar eclipse? His answer is that for all eight crashes to accidentally fall within the required intervals would be .23 raised to the eighth power less than one chance in 127,000.”

"The tendency has been for the markets to peak a few days ahead of the full moon, move flat to slightly lower –waiting for the full moon to pass. Then on the day of the full moon or slightly after, the brunt of the crash hits the marketplace.”"

So I looked up when the next Solar Eclipse is and put this on a chart for me to remember and note for the future.  That chart is below.

Then I went and looked up when all the coming Full Moons are for this year as you can see from the Solar Eclipse chart there's one this year on April 8th, 2024.  That Full Moon Chart is below...

This tells me that there is a window this year of about 6 weeks in front or after a Solar Eclipse, and since the Eclipse is on April 8th, 2024, that would mean that it could top on the February 24th Full Moon or the March 25th one... that's "if" it's within 6 weeks BEFORE the Solar Eclipse.

If it's with 6 weeks AFTER the Solar Eclipse it could be the April 23rd or May 23rd Full Moon, but not the June 21st as that's more the 6 weeks from the April 8th Solar Eclipse.  The February 24th Full Moon is just a hair over 6 weeks as the 26th would be exactly 6 weeks in front of April 8th.  I'd say that's close enough.

I have to pay more attention to the February and March Full Moons because of how bearish the market is on the Seasonality Chart for the month of March.  Could be be May?  Yeah, I guess?  There's that old saying "Sell in May and Go Away" so that is something to pay attention too as well.

For now though I want to see how high we go into OPEX this month.  February 24th is on a Saturday so Monday the 26th would be the day for the heavy decline to start if it's another Puetz type crash.  All we would need is for China to put a blockade around Taiwan and there's your reason for the crash.

And I believe the he means that the "brunt of the crash" would be equal to the C wave down in Elliottwave as you never see any crashes that happen right from the very top.  Even the 2020 crash had an A down and B up first.  So we could top here in a few days, pull back for the A down into late next week or even into early the week of OPEX.  Then bounce back up for the B wave into the 26th, and that's where the crash would start from.

Have a great weekend.

Weekend Update – Near A MAJOR Top

0

A Total Bust For My Bearish Wave Count!

Back To The Drawing Board...

Ok, so a massive failure the last month with every call I made as I just kept looking for that big leg down to only get a "one day wonder" move (or a few days, but not much in points) and to get reversed back up in the days after with a bear squeeze. A super frustrating month of bad trades and forecasts, which forced me to step back and dig in to researching the past to see where I went wrong and what the "truth" really is for the future.

So I what I did was spend the entire weekend studying the 2020 and 2022 tops from the prior lows of each in the 2 years before. For the 2020 top it started from the 2018 bottom, and for the 2022 top it started from the 2020 low. Then I compared it to the rally from the 2022 bottom to our current top in 2024. I looked at the moving averages, the MACD's and the RSI, as well as patterns they made (Head and Shoulders). And what I found is very interesting. Lets go over it and start with the 2022 top first.

As you can see I have labeled all the periods of importance into 6 areas. I have labeled the MACD's and RSI made notes on some of it. If I would have done this analysis last month I would have figured out that the market wasn't ready for any large drop like I was calling for the past month. I would have seen that "point 5" needed to form and then "point 6", and when I was looking for that large drop at I would has figured out that we were just in the middle of "point 5". Below is the current chart for 2024 with the same labels.

The sideways chop from mid-November 2023 until December 8th was equal to the sideways chop from 11/8/21 to 11/21/21, but back then there was a pullback into 11/30/21 inside "point 5", (PB #1) followed by another push back up to the same spot again, and another drop from 12/16/21 to 12/20/21 (PB #2) for a "higher low", followed by a slightly higher high... and then one last pullback (PB #3) which ended "point 5"... and then a final rally for "point 6".

However, we didn't get that drop after December 8th 2023 (compared to the drop from 11/21/21 to 11/30/21) but instead rallied up to a new all time high. That should have told me that the first pullback wasn't going to happen from a double top sideways zone like 11/8/21 to 11/21/21, but instead will go higher and then do a pullback as the rally up from the October 27th 2023 low was not finished yet.

That pullback finally came on 12/20/23 (PB #1), but was just a "one day wonder"... which I have to list it as similar to 11/22/21 to 12/3/21, not in "time" of course, but it was the first move down after a strong rally up.  That was followed another push back up to retest the resent high on 11/22/21, which put in a lower high on 12/13/21 before dropping lower the next day on 12/14/21 (PB #2), which I would compare to the 1/5/24 low.

Basically, pullbacks number 1 and 2 in both the 2022 chart and the 2024 chart "flipped" in "time" whereas in the 2022 chart PB #1 was a week or so in "time" and "PB #2" was just one day (12/14/21).  On the 2024 chart the opposite happened as "PB #1" was one day (12/20/23) and "PB #2" was a week long.

The last pullback in "point 5" in 2021 (PB #3) was for a higher low (then PB #1), which would be the 1/11/24 to 1/17/24 drop. Obviously this isn't an exact match but the overall pattern is there... they just flip sometimes in "time" or depth.

This leaves one more push up for "point 6", which in 2021 it was another new all time high, and currently here in 2024 we are repeating that move as well. Now... back in 2021 it went sideways up at the top for about a week before rolling over and dropping, so that's possible again this time around.

It won't be an exact match but something similar. Maybe it climbs a little higher in a slow grind day by day this time instead of sideways? I don't know for certain, but this is why I also went back to the 2020 top and studied it... which is in the chart below.

On this chart from 2020 you will notice that "point 5" is longer in "time" then in 2024, but many things are still similar. Like how the rally up rides on top of the 20 and 50 SMA (simple moving averages) and only touches the 50 (red line) at the end of "point 5" in 2020.

Today we haven't yet pulled back that deep to touch it but did pierce the 20 (yellow/gold) at the end of "point 5" on the 2024 chart. I could make the argument that we will have a pullback to touch the 50 SMA soon and then go up for one more higher for "point 6", which is what I'm going to label as "PB #3" and cover shorty.

Note that the MACD's tell another story as in 2020 there were "2 tops" on them inside "point 5" and we currently have "2 tops" completed in 2024, but again... nothing ever matches exactly.

No matter how you look at it we are missing the "Last Top" in "point 6" from 2020, and just looking at the MACD right now it could take 1-2 weeks to "hook it back up" to where we could see a crossover that makes a lower MACD top.

On the 2022 chart there was only "1 top" for "point 5", so a slight difference from it compared to 2020 and 2024.  I do not know how this will unfold as both the 2020 and 2022 charts are very similar to 2024, and both suggest we will need 1-2 weeks to finish "point 6" (or the last pullback of "point 5" on the 2020 chart if I'm wrong on that section being completed?).

Let's go over that now.  On the 2020 chart there was a good pullback for 2 days (1/24/20-1/27/20) and then another good one on 1/31/20, which are "PB #1 and 2".  Therefore I have to adapt (just like I did with PB #1 and 2 on the 2022 and 2024) and label the "one day wonder" pullback on 2/7/20 into 2/10/20 as "PB #3", and say that it's the opposite of the same move on 12/20/23, which was "PB #1" there.

Again, it's flipped around some as back in 2020 the high before "PB #1" was lower then the high before "PB #3" and in 2024 the high before "PB #1" was higher then the high before "PB #3".  Back then, from the 2/10/20 low for "PB #3" the market topped in 10 days on 2/20/20... so will this repeat and top in 10 days from the 1/17/24 low?

On the 2022 chart it topped 14 days after the low, which would be January 31st, 2024.  A lot of things to watch closely in the next 1-2 weeks as both prior patterns suggest we will top out very soon and complete "point 6".

I'll be very focused on seeing if the MACD curls up and gives me a lower peak (I'd want to see them crossover, even if for only a day). And I'll be looking at the RSI to see if it has a similar pattern form compared to "point 5 and 6" on both the 2020 and 2022 chart.

In the end it will be just a "best guess" as there's no perfect repeat of anything in the past, but many times it does "rhyme", and I think one of these prior years will be repeated.

Conclusion:  Bulls want to hold the recent low of 4746 from last Wednesday and go up or sideways the rest of the week for either of my comparisons of the past to play out.  Basically they keep at tight range to form a similar pattern as previously.

If 4746 is lost there's a big risk that the high is "in" and we are starting the down move early (compared to what 2020 and 2022 suggest).  If 4702 is lost (from Friday the 5th) then I'd say there's a 99% chance the high is "in".  Once support is lost it should drop hard and fast and look like a mini-crash.

Lest we not forgot...

The Yahoo site with all the FP's on it, that I usually ignore, has almost come true this time (on the upside at least), for we hit 482.72 on Friday and the triple fake prints on this chart are for 483.07... will the 445.22 FP's be next?

Have a blessed day.

ES Morning Update March 20th 2020

0

Looks like the market is trying to bottom here gang. Yesterday was clearly a much calmer one and today looks like it's starting out that way too. It's Qual Witching (not Triple), where 4 different types of assets classes expire. Historically it's a positive day, and it's starting over that way here before the open. I still don't think this is down on the downside.

There are lower projections still outstanding. Oscar Carboni has 2109 on the ES Futures as his downside target Peter Eliades still has two lower target areas on the Nasdaq (Nasdaq-40 week projection 6166.97-5382.85 and Nasdaq-4 year projection 5308.97-4805.821). I'll include both video's here in this post.

This again looks like the calm before the storm. My best guess is that we'll bottom out next week, or by the end of March. Then the storm happens from April 1st to April 10th (aka, the arrests of the deep state players). During this period I think they will close the stock market.  Again, just a guess and NOT fact. If so, then when it reopens I would not be surprised if a cure isn't announced for the virus.

This could be released during the time I think the market will be closed. If this happens we'll see a huge rally back up start after April 10th (again, this is speculation on the 10 days of darkness during that period). So, prepare yourself according in case this does happen.

Short term I think this bounce will be over with early next week... maybe today? But they might bounce it for several days and start back down after Tuesday or so. I feel a few more days and a little more upside is needed for the short term charts to work off the massively oversold conditions they are in. We might get to 2600-2700, but I don't see much more. There's still a lot of funds trapped and they will keep selling on any move up, so that should limit the rally.

The ES is trying desperately to hold that double bottom low from December 2018, but the DOW already lost it, and so did the Russell. The SPX will lose it too eventually. So with the Nasdaq as it's been the strongest and isn't even down to that 2018 low. Instead it's trying to hold the June 2019 double bottom low. They will break at some point next week I think. Today though looks to be another "calm before the storm" one. Have a great weekend. God is in control, fear not.

ES Morning Update March 19th 2020

0


Looks like the market this morning is going to open without another limit up or down move... LOL. These are Biblical times we are in and no amount of technical analysis or elliottwave can predict it. But we do know that government has tons of power to control the market if they really want too. We know that many, many times in the past the Fed's would step in at some point to stop a decline. Recently they have injected some large sums of money into the it but it's not had the same effect. It's just got too far out of control it appears, and no amount of money can save it... or can it?

I get the feeling that's just not the case. Instead, I think the government is waiting until the market has cleaned out all the fraud and corruption from various hedge funds and companies, like maybe JPmorgan with their silver manipulation, or Goldman Sachs? I don't know for sure of course but I do think that at some point the government will come into the market with bailout of certain key companies (airlines), and direct buying of stocks.

But first I think Trump and his team are using this event to clean out the evil. He seems to know when the stock market is going to bottom as he tweeted back in 2018 at the December lows that stocks look like a good buy here. Recently he said "this is the calm before the storm" (at 24:40 into this video), which tells me the stock market might calm down here and do some kind of bounce for a few days or more. But it also tells me that once the calm period is over with the storm will be when the market drops again, which could be before, during or after the April 1st to 10th period as that's being referred to now as the "10 days of darkness" where mass assets are going to happen.

I don't know if it's true or not but the facts we have at hand right now do support it. I mean, we do have cities on lock down and area in quarantine. So this event really could happen. Therefore if we get a bounce of any kind in the coming days (during this calm period) we shouldn't think that the low is in and should look to short it.

There are lower levels forecast-ed by Peter Eliades a (from yesterdays morning update), so unless the rally is huge, with the Nasdaq getting up over 8000 or so, then we should expect any rally to just be a bounce before another drop. I'd talk about technical and wave counts if it worked, but this isn't your normal correction. It's historic, and has never happened ever in the stock market... not even in 1929 or 1987. So during this calm period lets see if the market can get a bounce. God bless everyone, and may Trump succeed in arresting the deep state satanists.

s2Member®