Sunday, August 23, 2026
Home Blog Page 122

One More Day UP…

81

Is all I see...

Gang, I think tomorrow will go up and hit the 113.02 spy FP that Anna caught at 8-9am Tuesday morning.  I see the same print in the afterhours session again.  This confirms to me that we are going to hit that target tomorrow sometime.  After that, I think we will sell off on Thursday and Friday... possibly hitting that other FP of 107.35 from a week or so back.

But, if we hit that target on Friday, get out of your shorts.  The weekly is still pointing up, and next week is opx week.  Both of those factors mean we will likely have a bullish week into opx Friday.  You know how they like to squeeze the shorts during that period.

However, the week after opx could be the start of something beautiful... if you're a bear of course 🙂  While it could chop sideways a little more and even be pushed out right up until the September 9th start of the Legatus meeting, it could still start to sell off some before it.

The charts will give us clues when we get there, but for tomorrow I expect a move up to 113.02 and then selling on Thursday and Friday.  I'm keeping this post short as I'm tired and today was my birthday too.  I'm 46, look like 36, and feel like 56... LOL

Red

Weekend Update…

104

Monday update (for Tuesday)...

Nothing really has changed today, so I see no reason to make a new post.  The market is just waiting on the Fed's meeting at 2:30 pm est tomorrow.  After that, we should see some volatility in the market.  Which way is anyone's guess at this point.  I'd be afraid to go short with such light volume, and I'd be more afraid to go long because the market is in a topping process right now.

I certainly don't know how much further we have to go up, but until it shows a clearer picture, staying out of it is much safer.  As you can clearly see, the daily chart is still going up, and so is the weekly.  Until at least the daily starts to roll over, I just can't see any selling sticking.

Even if you miss the first wave down, getting short on the wave 2 retracement top is a better spot to be at anyway.  So, be patience bears... and let the smoke clear after the Fed meeting.  Sometimes the first move is a fake one.  Not always of course, but a quick move down after the meeting could be bought back up by the dip buyers.  It might be best to wait a little awhile before making a move.

Either way, a big move is coming soon... down or up is still unknown.  I still feel that we will go down to that 107.35 FP sometime this week, but I also think we won't start a serious sell off until early September.

Red

-------------------------------------------------------------------------------------------------------------

Back to business as usual...

Yes, it seems that some things change and others stay the same.  The market is the one that stays the same, while the overall economy changes from bad to worst.  No matter how bad the unemployment is... it's just ignored.  There's just no worry in the market place, as it's totally disconnected from the real world.  So, the rally will likely continue.

But don't worry bears, your day will come... and soon.  First however, I think we will head on down to the 107.35 spy FP sometime next week.  Will it be after the Fed meeting on Tuesday?  Who knows?  If the market rallies up into the meeting, then I'd say yes...  but if it falls into the meeting, then we would expect a rally out of it.

While I still don't know if we are going up to DIA 118.16 into the Legatus pilgrimage in September, or down to the DOW 8300 print... the meeting will be a turning period.  I have to say that I'm bearish next week, as I'm still looking for 107.35 spy to be hit, but after that... I'll have too re-evaluate.

The weekly chart really should put a few positive histogram bars in, before it rolls over again.  Of course it doesn't have too, but my feelings are that it will... and that's mainly because of the timing of the issue.  The pilgrimage is just a month away now, and that's just enough time to put in a few positive weeks.

Because the market has rolled over on the month chart now, I don't think they will have the money available to take it back up if they go down to the 8300 dow print first.  Once this market finally starts to head down that low, I don't think we will see the April high again for quite some time.

I have many down side prints, and even without them... the stimulus money has run out.  Even if they throw more money at the market, it's not going to have the same effect as it did in March of 2009.  The most we could expect is a wave 2 back up to put in a lower high... not a new bull market.

Plus, look at this from a political point of view.  Hold the market up until September, as that's only one month away from the November elections.  Lot's of campaigning will be all over the news, as both sides run ad's 24/7... which means that a market that is selling off hard won't get as much air time as it normally would.

The ol' "look here at my right hand, while I'm robbing you with my left" distraction.  The public won't pay too much attention as the market sells off.  The media will say it's just an overdue correction.  Spin, spin, spin...  you know the game by now.

So that you all don't fall for the bear trap next week, remember the election is right around the corner.  I think most people have us pulling back to the 1090 area, and then rallying higher.  But, I believe the 1070 area will be hit... mainly because they told us it will.  DUH!

Besides that, the 1090 area is too obvious.  It would only allow the bulls a better spot to go long.  Not many bears would go short at that level, as it's not a major break of the horizontal support line coming in there.  But, if you break that support, then the bears will jump on and the bulls will sell out.

Of course once the 107.35 spy print is hit, I expect it to reverse back up and squeeze the bears out... which should also give it enough fuel to take out the 1130 area and probably the 1150 area too.  Let's also not forget that we are 2 weeks away from August option expiration.

If you go down next week, get a bunch of bears short, then you know they will rally into the follow opx week... making all the "puts" expire worthless.  Same game, different month.  As much as we'd like to believe that the market isn't manipulated, anyone reading this blog long enough knows that I've given you plenty of proof that it "IS" 100% controlled.

While they still follow what the charts say, whenever they are at the end of an up or down move... they can always stretch it out a little bit longer then you might expect.  That's how they stay rich... by tricking you out of your hard earned dollars.

Every move is planned out months and years in advance folks.  That's what the Legatus Pilgrimage's and Bilderberg meetings are about.  It's up to us to figure it out of course, but never forget to expect the unexpected... in this case, a hard rally back up, after a sell off to the 1070 area.

That would trick a lot of bulls and bears I do believe.  I'm still 70-80% bears for next week, as I was for this past Friday too.  But after the FP of 107.35 (or 107.12?) is hit, I'll probably be leaning bullish at that time.  Unless some other clues come up that change my outlook, I'm expecting the 1130 area to be taken out with a run higher to take out the next major resistance at 1150 spx.

How high, I don't know? But it's going to be more about the time factor then the actual price level.  I expect the top to be put in right before or during the pilgrimage (which again is... September 9th-20th).  Then I'll start looking for the move down to DOW 8300 to happen.

Ok, for Monday I see us going up and possibly hitting the 1131 level ahead of the Fed meeting on Tuesday.  But at some point during the week we should see a move down to the 1070 area.  Probably after the meeting, but that's just guessing.  Either way, a move down like that would give the bears a nice dinner to eat.  Just don't drop the fish in your mouth when you look at your reflection in the water, thinking there is a bigger fish just below you.

Good luck everyone.

Red

Special Video Update…

65

Time to piece it all together...

Ok, I did some brain storming and I see 2 possible outcomes ahead.  One has us going up to DIA 118.16 and topping out around September 9th-20th as that's when the Legatus Meeting is happening for this fall.  The last meeting was February 4th-6th, 2010... and that's when we bottomed out.  They injected stimulus package part two, and up the market went until the April high.

So, do we go up first... maybe?  But that would setup the market for a huge crash down, from a much higher level.  While it's possible to go up into the Legatus Pilgrimage this fall, I tend to think we are going down into that time frame, and will hit the 8300 print during that event.

Once we hit it, we should go back up for a wave 4 for a little while, and then back down again into the December 7th time frame.  This would put the SPX at 725 or so, and should complete wave 5 down of a larger wave 1 move.  We should go up into next year, but at some point within the next few years, we are going to reach our final bottom of 20.16 SPY.  (How's that for scary?)

So, when will DIA 118.16 be hit, and will it?  Once inflation comes into play, we could see Dow 38,000 like Mahendra predicts.  Who knows that far down the line?  But for now, let's focus on tomorrow and the next few weeks first.

Tomorrow is a huge day in the market, and should it be bad jobs data then I could easily see the 107 area FP hit all in one day.  I'm 70-80% bearish right now, but only based on my gut feelings (which are wrong a lot... LOL), not because the charts, which still look bullish.  Plus the fall pilgrimage could be a high this time... not a low.  And don't forget that the DIA 118.16 will eventually play out.  Will we do it now, while we are close to it?  Or, is it for next year some time?

I'm leaning toward the downside first, with the 107 FP being tomorrow's target.  This is just speculation here folks... the charts are still bullish.  If we go down, then I'd expect a bounce at that level.  At that point I'd have too look at the charts again to see if we are going to continue down, or turn back up and go for 118.16 dia.

If we go up tomorrow, then we could be going to the 118.16 print into the September 9th-20th time frame.  The charts can roll over at any time right now.  They are still bullish, but at extreme levels right now.  This is a very tricky place to be in, as that weekly chart tells me that we are going up to 118.16 FP first... which would set up a once in a lifetime shorting opportunity during the fall pilgrimage.

But other things tell me we are going to sell off first.  I have no idea which one is right, but I cover both in the video... and focus on the bearish case the most.  Just don't rule out the bullish case here, as the charts are not supporting my bearish case right now.

So be prepared to go long up to dia 118.16 into September the 9th-20th... should the charts push up higher.  I'm bearish by nature, and it clouds my judgment sometimes... so don't take again as "written in stone"...

Good luck to everyone...

Red

Up Or Down Next?

132

WEDNESDAY UPDATE (for Thursday, August 5th, 2010)

Well,

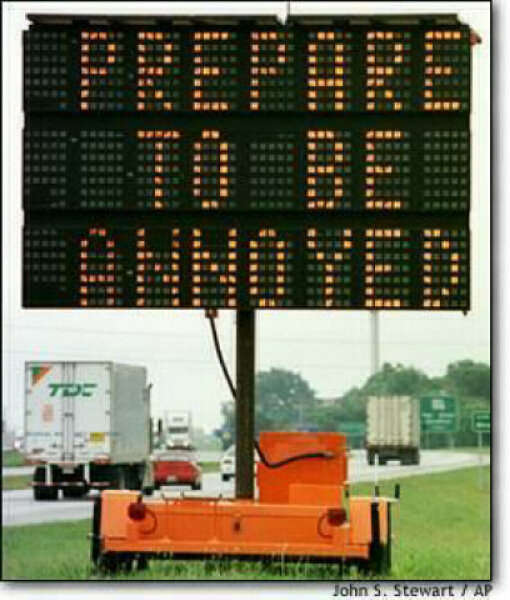
I'm officially annoyed, are you?

Red

-----------------------------------------------------------------------------------------------------

I have NO Idea...

Sorry folks, but today end with a lot of mixed signals.  The 60 minute chart is finally rolling over as the histogram bars are now at the zero mark and ready to cross down.  But, the overall price level simply traded sideways to slightly down.  That's call a "Bull Flag" pattern, and could easily play out tomorrow morning.

However, when a pattern fails, it commonly makes a big move in the opposite direction... meaning down!  We still have the FP prints of 107.12 spy and 107.35 from last week, but we don't know when they are going to play out?  If we start back down tomorrow, then we could easily hit that target by this Friday.

But, that daily chart is still rising right now, and the weekly is also pushing up higher too.  While the daily is overbought, it's still not showing any signs of turning back down yet.  Some people have August 6th as a turn date, so we could chop around here until then.

I could easily see a move down into tomorrow morning, and then a rally back into the afternoon.  With that 60 minute chart just now getting ready to go negative, I think it will only put in a small tower below zero and rise back up into tomorrow's close.  This would allow it to put in a smaller histogram tower above zero, forming a negative divergence on the chart.

That would set up Thursday as a possible big down day as the 60 rolls back down in the morning on the bad jobs data.  By that time, the daily could also be rolling over a little too.  But understand this, it is common to see a higher price level with a second lower high on the histogram tower of any chart.  Meaning... while we could sell off early tomorrow morning, the afternoon rally could push us up toward that 1131 level (or more), as it squeezes all the shorts that just piled on.

Be cautious about going short right now, as no selling is likely to stick until the daily chart rolls over.  That might not happen until this Friday... or even next week?  With the weekly pushing up the daily, it's hard to see any selling stick yet.  We need the daily to start turning down first, and then I think the weekly will follow it.

So for tomorrow, if will sell off in the morning, look for the 60 minute chart to start to turn back up and then bail on your shorts.  Usually all the action happens within the first 1-2 hours of the day, so that's when I'd expect the selling pressure to lighten up a little.

A move down to fill the gap at 1105 spx would be my likely guess for a downside target.  That would also hit the rising trendline that supporting this whole move up from the 1010 lower.  If that line breaks, then the market should fall hard.  But on the first hit of that trendline, I'd expect a bounce from it.

This all assumes the government doesn't release some bogus news or data tomorrow morning to cause a gap up to fulfill the bull flag.  From a technical point of view, it's not really a good bull flag on the 60 or 15 minute charts.  And on the daily chart, it needs another 2-3 days of sideways trading to be called a bull flag.  So while it looks like a bull flag, I don't think it actually meets all the proper qualifications.

Anyway, that's about the best guessing I can do for you...

Red

P.S.  Since the government has super computers telling them all the technicals in the market, releasing good job's data (bogus numbers of course) would allow the technicals to play out to the upside.  Basically, with the daily still pointing up, and the weekly too, whatever news they release will determine "When" they both roll back over.  Good news means they will likely extend into overbought territory more.  Bad news means they roll over at any point now.

Weekend Update…

102

MONDAY Video Update...

--------------------------------------------------------------------------------------

Bullish or Bearish?

While the jury is still in determining the market direction from here, I'm leaning bearish at this point.  However, I do see Monday as an UP day, but after that I think the overall week will be down.  For the upside, I don't have anymore short term prints except the 111.28 spy print that I posted Friday.

Since that was an intraday print, it should be hit within 1-2 days... meaning Monday, (since it failed to hit there on Friday).  That would also be right at the falling channel's upper trendline (shown on the 60 minute chart).  I don't have any other upside prints except the longer term print of DIA 118.16 (about 11,800 Dow), which is a long ways away right now.

But on the downside, I have a short term print of 107.12 spy from a week ago, and Anna caught it again on the intraday chart on Thursday, further confirming the accuracy of the print.  The level she seen was 107.35 spy, so I'm pretty sure we will see that level next week some time.

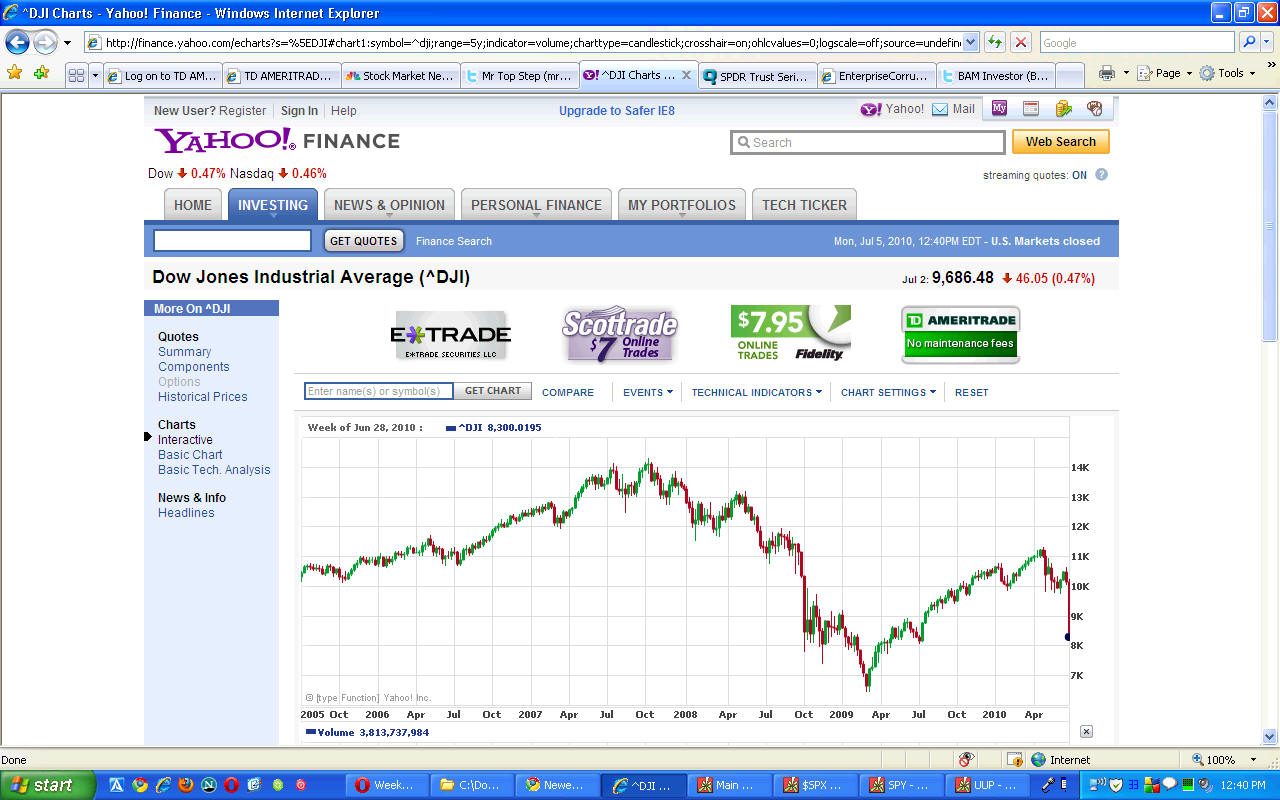
On a longer term, I have the Dow 8300 print from several weeks back.  So when will that play out?  If that weekly chart rolls over next week (which could happen if we close down around the 107 level next week), then we could hit that low within a few weeks.

I don't for sure yet, as until the weekly chart rolls over (the daily too of course, and I expect that to happen early next week on it), it's still possible for the market to go up more.  But, I'm 70-80% bearish for next week, and I do expect that 107 FP area to be hit before next Friday.

At that point, I'd need to look at the charts again to see what the weekly chart does.  Again, if it rolls over, the market is toast!  That 8300 Dow will be upon us before the end of August.  And, there's enough important data coming out next week that could easily cause the sell off to happen.

On Tuesday we have Personal Income and Personal Spending, which will move the market one way or the other.  On Thursday we have Continuing Claims and Initial Claims out, and finally Friday has the Unemployment Rate, Hourly Earnings, and Consumer Credit... all are "market movers"!

There are plenty of reasons to blame the sell off on next week, as I really can't see all of those reports being positive and causing another move up in the market.  This leads me more and more bearish, as I just don't think the weekly chart has enough juice left for a breakout move to the upside.  Especially now that the daily has ran out of steam too.

So from a technical point of view, the weekly and daily charts are running on empty for power now.  I'd say they've used up 90% of their juice, and could roll over at any time now.  The monthly is still bearish, and only took a "pause" period last month, which still didn't do any damage to the overall trend down.

And of course from a "news point of view", next week could scare a lot of bulls from staying long.  We all know that the market is manipulated and 100% controlled (you should know that, if you are a regular reader), which means they could make all the reports look positive, by getting out their erasers and changing the data.

But, they also follow technical patterns too... especially on the larger time frame charts, as they are just too hard to manipulate.  The intraday moves don't take as much money to control, as turning around the Titanic would (meaning the monthly charts' down trend)!

Ok, so Monday I'm looking to go up to that 111.28 print by the close.  Then I'm looking for the 60 minute chart too have peaked out, and the daily to get even closed to have a bearish cross on the MACD lines.  Since Tuesday starts out the week with the first of many reports that can move the market, I'd expect that to be the start of move down toward our 107 area FP.

The market moves fast on the way down, so who knows how fast it could hit that target low?  Bad news on Tuesday could cause us to hit that level before the Thursday news, because traders will be selling in fear that the job's data will be horrible.  The old "buy the rumor, sell the fact", or in this case... "sell the rumor, MAYBE? buy the fact".

That's my crystal ball reading for next week...

Red

Is It Over Yet?

61

Maybe for a day or two I believe...

But the selling isn't done completely.  While I think we will close positive tomorrow, after a morning sell off, next week should start out down.  The charts tell me that these last 3 down days were likely the start of a wave 1 move, with the close of tomorrow being the start of a wave 2 back up.

However, I do think we could sell off in the morning first, and then rally the rest of the day... closing positive at the end. The downside target tomorrow isn't known, but certainly the 1085-1090 area is the first area I'd expect hit.  If that breaks, then a move down to our 107.12 (Anna got 107.35) spy FP would be the next area of support.

If we do go down that far tomorrow morning, then you definitely should expect a move back up throughout the rest of the day to occur.  We have a 69% chance of closing green according to Cobra's after the bell report.  That makes a lot of sense too me, as the 60 minute chart needs to work off the oversold conditions it now has.

So, where ever we open at tomorrow morning, any selling should be short lived as the 5 and 15 minute charts bottom out and move back up throughout the rest of the day.  Looking at the afterhours prints for clues, I see a 111.28 spy print showing up as a "high" now, but we haven't been there.  Is that another FP, telling us the closing level tomorrow?  Could be?

That would certainly be a positive close, if we went back up there into the afternoon session tomorrow.  If that's the case, then I can't see the 107 area being hit tomorrow morning, but instead the first support area of 1085-1090 spx.  So, for you bears, look for the selling to stop after the first 1-2 hours in the day.

And, since tomorrow is Friday, it could stop within the first hour as the traders leave early for the weekend.  While it would be great to see the 107 area hit tomorrow morning, I'm giving it low odds right now.  Let's see how fast it moves to the double bottom area first (from today's low), then we can see if it going to break that support or bounce and move back higher the rest of the day.

A quick move down (with volume) would indicate it is likely to break support, but if it takes its' sweet time, and doesn't hit that area until the 10:30-11:00 am time frame, then it will likely hold, and a move back up would be expected.  Hope this makes sense to you guys...

Red

Upside Target Met?

294

Update for Thursday...

Put simply... possible move down at the open, and a slow grind back up in the afternoon until the close.

Red

-------------------------------------------------------------------------------------------------------------------------

We hit a high of 112.37 SPY today... is that enough?

It's hard to say yet if today's high fulfills our 112.41 FP, but tomorrow should be the last attempt higher. Since the 15 minute chart is in negative territory and ready to roll back up tomorrow, there could be one more gap up, or flat open and a quick run up to fulfill the print exactly.

However, many times in the past I've noticed that they either fall short a little or pierce through it a little... and then reverse directions. And, since today traded mostly sideways, it formed a bull flag on the lower time frame charts. That would support a possible quick move up tomorrow morning, and then selling off the rest of the day.

Either way, a turn back down in the market should be no more then 2 days away, with it starting as early as tomorrow. Our downside target is the 107.12 spy area (or the 107.35 print Anna caught today), once the selling begins. Since nothing news worthy is out tomorrow, we might have to wait until Thursday to see the selling begin.

So hang in there bears, your dinner should be ready soon.

Red

Weekend Update…

474

Monday Update...

No reason to another long post, as nothing much changed today.  As I said in the video's, we are either going up to 112.41 spy or down to 107.12 spy.  It looks like we are going up first.  Once 112.41 is hit, I expect it to pull back from there and head down some into the rest of the week.

We could choppy around that area for awhile, as I'm not expect it to just fall off a cliff... back down to 107.12, as that might takes some time.  It might not happen at all, as I'm not exactly sure on the accuracy of that print?  But regardless of the downside target, the upside one should be hit very soon now... as we are within spitting distance of it.

Red

-----------------------------------------------------------------------------------------------------------------------------

The bulls are back in town!

Yes my dear reader, it looks like the low is in for awhile, as the bulls are back, and they mean business.  Last week I got trick by seeing what I wanted to see... the bearish side.  I was bearish again after the previous Fridays' huge drop on opx week.  Then another small sell off on Wednesday of this week, as Bernanke spooked the market.

It was looking like the bulls were done as they hit the the top trendline of the falling channel since the April highs, and failed again at it.  But on Thursday, the PPT came to the rescue and rallied the market hard on horrible economy data and various earnings reports.

The 1060 level held strong as thousands more lose their jobs and can't find work.  So instead of gapping down on Thursday morning, we gapped up and never looked back.  Go Bulls, you crack head sons of b's....  Manipulation at it's finest!  Clear and simple!  There was absolutely NO reason to go up, and a thousand reason to tank, but the operators do what they do best... steal the little guys money!

It's funny how the previous week I was bullish, and then fell into my own trap on the big sell off days that happened.  It played out exactly as I stated it would during the previous weeks' video's.  But this week I was dead wrong on my bearish view.  I should have given that weekly chart more attention, as it was clearly telling me that the trend is UP now.

I ignored it this weekend, and only focused on the daily, 60 and 15 minute charts... which was a clear mistake, as the weekly keep supporting all those charts, by not allowing them to roll over as I thought they would.  So in the end, even though this Thursday was pure manipulation by the PPT, the weekly chart did support a move up for this week... just not a 300 point, shove it down your throat and make you choke on your shorts kind of move.

However, we must always remember that the market is designed to fool you and steal your money.  It's just a big casino created by the crooks, to rob the little guy.  How else can they keep the world in slavery, but to lie, steal, cheat, arrest, murder, belittle, frame, assassinate, embarrass, etc... you get the picture.

But one day we'll all be gone to that happy place in the sky they call heaven... where we can play funner games like sword fighting with Angels (and Demons too I guess?).  Ahhhh... what fun that will be.  Let's just hope they have some other type of gambling there... maybe Bingo or something?  LOL

Moving on now...

Next week should be interesting as we still have the FP of 112.41 spy (about 1120 spx) which hasn't been filled yet.  Then I seen one on Thursday of this week, showing 107.12 spy... meaning that we will probably go up to the 112.41 print first, and then back down to 107.12 to fill the gap made on Thursday morning of this week.

Will it play out like that?  Who knows, but it seems logical for that to happen.  That doesn't mean we can't go down to 107.12 first and then squeeze on up to 112.41 by the August opx... which is entirely possible.  We all know how they like to run the market high during opx week, so they don't have too pay out on all the shorts in the market.

So, if we fall first, then the buy area should be that gap fill area of 107.12, and then the opx high should then be the 112.41 print.  The weekly chart is pushing up hard now, so we could be going up for several months now, as I stated in my video's from the previous weeks (of course I ignored all that this week... duh).

If that's the case, then the final high should be the DIA 118.16 print... which could be hit in late September, just after the crooks cash there bribery, robbery, payoff, etc... checks through the Vatican banks (the only banks in the world that don't report anything to anyone).

This is during the September 9th-20th annual Pilgrimage of the Legatus Group.  During these events, the thugs that rule the world make decisions on where they plan to take the market next.  The last Pilgrimage was held earlier this year February the 4th-6th... which marked the bottom of a sell off.

What followed was a bear whipping that lasted 3 months.  They must have turned on the money tree after that meeting, at rallied like the sell off never happened.  Of course that event was planned many months in advance, and the bottom was told to everyone with the FP I got back in January, showing 1047 on the spx, when it really closed around 1140 something that day.

That was my first experience with a FP, and when it hit that 1044.50 intraday low on February the 5th, and had a massive reverse (that didn't stop until the April high), I got burnt and lost a bunch of money on that move.  I learned then that the market was 100% controlled, and manipulated to take everyones' money.

Now I pay very close attention to those FP's, and important meetings by the crooks that run the world.  The Illuminati have a public face, and that's when they get together in the Bilderberg group and have meetings.  Policy changes are done there, and decisions are made as to where to take the market next.

The private face of the Illuminati is through the Legatus group, where they poses a good church going people, all getting together to celebrate God... it's all B.S.!  The group is nothing but a place for all the crooks to get together and funnel all the money tell stole through the Vatican, the most corrupt and evil organization on earth.

These are the people that are using "The Book of Dead" to bring forth demons from other dimensions and other times.  Most people (that study that stuff, I don't... but keep my ears open a little), say that these demons are Reptilian Aliens that are in the lower levels of Vatican City.

Well, I don't know about that... but I do know that when the Illuminati get together, either through their more pubic face in the Bilderberg Group, or their less know private face in the Legatus group... the market changes direction!  So, should we continue up until the fall event is over, you can look for a nice crash following it.

However, we have that Yahoo FP of Dow 8300 from a week or two ago (which could be but up to trick the masses, as I'll gotten some feathers ruffled from postings all these FP's lately... meaning that it's Fake FP, put up to deceive us).

And currently, the charts don't support a move down to that area now, as the weekly is pushing up the market pretty hard now.  But, should we take out the 1010 spx low next week, (not likely), or next month, then I'd say we will go to 8300.

The timing of these FP's are always unknown.  We only know that once we are headed in that direction, and get close to that target, look for a reversal when it's hit.  So, for next week I believe we will go down and hit the 107.12 print first and then rally back to 112.41 by August opx.

I'm just guessing of course, as forecasting this market is like trying to pick winning lottery tickets sometimes.  But, the weekly chart says we go up for the next few months.  However, the daily is overbought and should roll over next week... which is the reason I think we go down first and back up into opx week... which is traditionally bullish anyway.

Hope that helps give you a longer term view, as the short term is pretty clouded right now.  Some choppy waters lay ahead I believe.

Good luck to all you bears, and bulls too of course (as we all have to be fed straw from our masters from time to time.  After all, it's better then starving like the bears do).

Red

Wow! What A Rally!

2,253

It's Over Now... The Bears Are All Done!

Rally, Rally, Rally... Go Bulls!  Of course you know I'm joking now, as I'm a bear by nature.  And today certainly put a hurting on the bears.  It took me totally by surprise, as the charts looked very bearish yesterday.  That goes to show you that just as soon as you think you've figured it out... they change the game plan.

I honestly have no clue about tomorrow, but I'd expect a "pause" day, as that's what usually follows a big move up (or down).  Since we have now clearly broken outside the falling channel from the April high, I'd say we are going up next week too.

We still have a 112.41 spy print too be filled, and if this rally is going to continue, we'll be there in no time flat.  Just layoff some more people, cut back on earnings forecasts, talk bad about the economy... and we'll rally to the sky.  LOL.  But serious, is this the most screwed up market you have ever seen?  Nothing about today was bullish... absolutely NOTHING!

It was 100% manipulated to squeeze out the shorts... and boy did it ever work!  And shorts left now are broke, and homeless.  I hope all you bear survived it!

Ok, on to tomorrow...

The gap up and sideway trading is a major bull flag.  So, if it plays out, we should open and go higher tomorrow too.  Personally though, I think we will pull back a little, to retest the falling trendline around 1080 area now.  Then a bounce from there to start the next move up should occur.

This all assumes that "they" want to rally the market up higher, and aren't just tricking the bulls right now.  The charts could be read either way, so I can see lot's of bullishness in them and still find some bearishness too.  Basically, if the market doesn't confirm tomorrow, and sells off further then the 1080 backtest area (putting in back inside the channel), then we are still in "whipsaw" alley.

However, it's looking more and more like a new up trend should start now.  With all the bearish news out there, and we still rally on it... that has too tell you that we're not likely going back down anytime soon.

But, they did leave a gap around that 1070 level that will need too be filled... eventually!  Not that it's any comfort for the short term bears, but if you hold long enough we will revisit that gap and fill it.

Well, that's about all the bad news I can stand for today (at least for the bears), so I'll close in saying that I really don't know what tomorrow will bring...

Red

Bernanke Speaks And The Markets Sell Off…

301

Oh NO!  What Did I Say Wrong?

You gotta love it!  Just as soon as Ben Bernankes' FOMC minutes are released, the market tanks.  Of course from a technical point of view, it was ready to sell off anyway... but someone has to be blamed, right?  LOL.  Well, tomorrow should also be a down day too, as the 60 minute chart has now rolled over and is ready to cross the zero level.

The daily chart put in a lower histogram tower, and the MACD lines are getting closer to crossing back down again.  The weekly is now sitting with a topping tail on its' candle, but of course the week hasn't ended yet... so that could all change.

The 15 minute chart is oversold and pointing slightly back up, but the 5 minute is over bought... meaning that any move back up will be short lived, as both charts re-align themselves to point back down at the same time.  With the 60 minute chart putting downward pressure, I can't really see the 15 minute chart pushing the market back up very far.

The sideways action for the last couple of hours put in a bear flag on the 5 and 15 minute charts.  While it's possible that we go up a little, allowing the 15 to work off its' oversold condition, we could just as easily continue to fall lower while it does it.

Overall, we are still in the falling channel, and until we get outside it... I'm bearish.  I was short term bullish last week, but today turned me to short term bearish.  I'm not sure how far we will sell off too, but we should see some more downside for at least tomorrow morning.

Red

Did The Bears Get Fired Today?

77

Didn't Obama say we're creating more jobs?

Hmmm... If so, then they must all be bull jobs and not bear jobs as the market rallied hard today, although the crooked banks still can't seem to make a profit... even with FREE Money!  Man, if they ever do make a profit, the market will be at 12,000 Dow in no time!

LOL... I'm just venting as usual, and laughing at how controlled the market really is.  It has nothing to do with the real world,  but instead trades off the charts only... and only uses the news to have something to blame the rally or sell off on.  I said yesterday that we could rally back up to 1080-1085 area, and we did.

Are we done yet?  I'm not sure, as I don't know if the print I got of 109.79 spy is real (or Memorex... LOL)?  If it's a real Casper, then that should be our final high tomorrow before resuming the journey back down.  It's best explained in video, as we have two possibilities now... one UP and one Down.

The upside targets are 109.79 spy, and 112.41 spy (which I believe the first one will be hit tomorrow, but the higher one might not be hit for awhile.  I'm still bearish right now, and only bullish for another day or so).  The downside target is Dow 8300... when?  If we start falling back down this week, then within 2-4 weeks would be I estimate.

Red

Weekend Update…

153

MONDAY UPDATE:

Not much changed today, as we had a slightly positive day as I expected.  The high was around 1075, which isn't quite as high as I'd like to have seen.  I'd like to see a back test of the falling trendline (1080-1085) from the April high before another move down starts.

In this 60 minute chart you can see that the MACD is trying to curl back up, and the histogram bars have now moved up from oversold territory to the zero line.  I'd like to see it go up and make a smaller histogram tower then the previous one, putting in a negative divergence on the chart.

That could push up the market to the 1080-1085 level that I'm looking for, before more selling happens.  We might not get it if Goldman Sachs doesn't do a good enough job of lying about their earnings?  The high could already be in for the week?  Hard too say... but the charts tell me we need to push up a little more tomorrow first.

We'll see I guess...

Red

----------------------------------------------------------------------------------------------------------------------------

The Sh*nola About To Hit The Fan!

Sorry for the bluntness... but sometimes you need too make a point stand out.  Next week is looking like a slaughter house for the bulls, as a big move down is likely coming.  While anything is possible, the odds of next week rallying hard like this past week... are slim and none.

Last week I really was expecting it to close out positive, as it appeared that they wanted to take the market up to the 112.41 spy FP from a week back or so.  But, the large sell off on Friday changed everything.  Had they really wanted to take the market up for awhile, they would have closed Friday flat to slightly down.

This now tells me that the big boys are short again, and plan on taking her down below the 1010 bottom.  This next move down is likely to be some kind of wave 3 of 3 of 3... in Elliottwave terms.  Again, I'm no expert in EW, but anyone can count it after the fact... and that's exactly what I see coming next week.

Monday has a 66% chance of being an UP day, according to Cobra's statistics (see his blog for more detail.  It's listed in my blogroll).  Plus, the 60 and 15 minute charts are pretty oversold now, and need to reset themselves.  This will likely take all day Monday and possibly early Tuesday too?

Since the first major earnings announcement (from any company that can move the market) is from Goldman Sachs at 8:30am on Tuesday and then Apple after the market closes, you shouldn't expect an major selling on Monday.  If Goldman reports like CitiGroup and Bank of America did on Friday... it's going to get ugly!

Then you have Baidu on Wednesday after the bell, and Amazon and Microsoft on Thursday... also after the bell.  These are the major movers for next week.

Of course I don't know what they will say, but Apple has reception problems on the antenna of their new iPhone... which tells me they aren't going to rally the market.  Goldman is likely to report similar to the other banks... meaning they meet estimates, but have a negative future outlook.  I don't know about Baidu or Microsoft, but the charts of both companies look exactly like the rest of the market... ready to roll over and tank!

At this point, I really can't see anything but a huge sell off coming.  I'm trying too be neutral here, and look for both bullish and bearish points of views, but this looks very bearish too me next week.  I was bullish all this past week, and did fairly well on my calls.  I was wrong on Friday closing between 108 and 109 spy, but I did call for the day to be a down day.

No one can get them all right, and I'm not one to overlook my bad calls... believe me, I've made many.  I'm getting a lot better at reading the charts, and they tell me that disaster is coming!  Throw in a 106.66 closing price on the SPY and a 109.99 high and you'll have a devil of a time convincing me that we are going back up next week.

Good luck to those brave bulls that went long over the weekend.  You have a 66% chance of an UP day Monday, but I wouldn't push my luck after that... as there's nothing bullish in the charts for next week.

(Major FP in 2nd Video)

Red

P.S. This oil disaster isn't getting better...

Watch this video too...

Bears Get Tricked Again…

127

Man!  I almost had that fish...

PLEASE DON'T FORGET TO VOTE ON THE NEW POLL DOWN THE PAGE IF YOU HAVEN'T ALREADY... 

Down we go in the morning to fill the gap, then rally back to close positive.  The bears that went short at the low today just got squeezed hard as the market rallied back into to close.  While we came just a hair shy of the FP of 110.67 spy, I believe we will hit it tomorrow... probably on a gap open.  Then possibly sell off a little the rest of the day, closing tomorrow slightly negative.

I think tomorrow will close below 110 spy, and above 109 spy (probably closer to 109).  Basically, I'm looking for a "gap up and crap" day tomorrow.  They need out of this falling channel, and Friday is the perfect day to gap up above the channel resistance trendline.

Once outside of it, they can fall back down and retest the trendline (at a lower point as the day goes on), which will allow them to close below 110 and still stay outside the channel.  That will allow for next Monday or Tuesday to go up too.

While I think next week could end up DOWN, I do expect them to at least rally up a little further before this rally takes a nice correction.  The move down today could have been the "B" wave down, in an ABC move up?  That means we should go up to the 112.41 FP next week to complete the "C" wave.

I'm just guessing at the Elliottwave counts, because I don't really know it too well... but it seems logical.  I know the "C" wave is supposed too be longer then the "A" wave, and a move to 112.41 wouldn't be very much further.  Meaning, if it quit there, and turned back down for a nice down leg, that "C" wave wouldn't be as long as the "A" wave, but again... I'm not an expert in EW stuff.

But back tomorrow, I'm expecting a slightly down day, around the 109 spy for the close.

Red

No Recession Anymore…

393

Update for exciting Thursday...

Red

P.S.  Please answer NEW POLL... Thanks

--------------------------------------------------------------------------------------

The correction is over now...

Yeah right... and I've got some ocean front property for sale in Kansas too!  Once again, the run up into opx week has started off with a bang.  Will it continue until Friday?  Probably not much high, but not much lower either I'm afraid.  This light volume period that we are in now, will allow them to easily gap up over resistance levels by running it up in the pre-market session first just like they did today.

So while there still might be a pullback, I think the 1040 level is off the table now.  Maybe we dip to 1060 for the "B" wave down, but it may not happen until after opx is over.  We could chop sideway until then, and sell off a little bit this week and a little bit more early next week.

However, the big concern is whether or not that week chart continues to roll back up, putting in higher lows on the histogram bars.  That could mean that we aren't going to go down below the 1010 low for awhile.

If so, then we could just sell off next week, and rally the next few weeks after that (and maybe go for the DIA 118.16 print?).  Now I don't know if that's going to happen or not, but the weekly is looking like it wants to roll back up.  So, just keep your eye on that chart, for it would likely put a limit on the downside for now... at least until it turns back down again.

Moving on to tomorrow...

The daily chart is still moving up, but the ADX line is falling now.  It's losing strength... finally!  The negative and positive DI line are converging together now, which means it should be choppy in the market for the next few days.  No major moves up or down should be expected during this criss-cross period.

The 60 minute chart is losing steam too, after putting in a much smaller histogram tower then the previous one.  With the larger amount of open interest on the 107 spy put (289,000), I'd say that we will not go below 107 before this Friday.  And, since the call side has 110,000 contracts at the 110 level, I'd also say we close below that level on Friday too.

Split the difference and you are looking at 108-109 spy level on Friday.  Which really makes more sense if they plan on dropping back a little early next week to maybe 1060 spx... (1040 would be a gift to the bears, and could halt the up move?), before a move up to 112.41 next week.  I'm not ruling out the possibility that we hit 112.41 spy by this Friday, but the odds are decreasing because the daily chart is losing steam.

So, my best guess for tomorrow is a slightly down day (not likely lower then 1080 area) or flat.  But I don't expect too much more on the upside without a "pause" day or slight pullback at this point.

Good Luck to everyone...

Red

Weekend Update…

538

Monday Update for Tuesday...

Red
-------------------------------------------------------------------------------------

Bullish OPX Week?

Most option expiration weeks are bullish, and I expect this one too be so as well (barring another false flag event, or planned default of some country of course).  We are in the light volume season of the summer months now, and the market can easily be control now with a lot less money... aka Free Printed Money given to the PPT.

So, the question is... which way do they want to take the market?  I think they want to take it up for awhile, as the media is still very bearish (at it seems that way to me).  I'm looking for a small pullback early in the week (Monday and possibly Tuesday too), and then a move higher or sideways the rest of the week.

The daily chart supports a move up this week, but how far is anyone's guess?  Many say it will go to the next Fib. Level of 1085 or so, and others say about 1100.  I think we will go to 112.41, either by the end of this week or the next.  I think we are in a larger wave 2 up on the weekly chart now, and that would support a higher move up then just the Fib. Levels.

However, it could take 2-4 weeks to get up there... should it not put in a lower low on the histogram bar for the weekly chart to discredit this analysis.  The monthly is still bearish, which certainly confirms that we are moving down overall.  But, we should have rallies back up within the shorter time frames of course.

I'm not too good a counting elliottwaves, but if the weekly chart did complete a 5 wave down pattern, to form a larger wave 1 down, then we could be in larger wave 2 up now.  If so, then several weeks of grinding higher is going to be needed to shake off the bearishness that is still out there.

We already had one week of a rally, and this week up could be enough to satisfy a larger wave 2 up in that week chart, but it could drag out for a third or fourth week.  I don't think it will, but I do think that the 112.41 spy print will be hit before another serious move down will start.

If that target is hit this week, then I can see another larger move down starting the following week.  So, while I do believe we will close this week out positive, it might only get to either the 1085 Fib. Level, or the 1100 Level by this coming Friday.  That would mean that the following week would be needed to hit the 112.41 spy target (about 1120 spx).

On a shorter time frame, I think we could go down on Monday and early Tuesday, and then up into Friday.  The 1060 area would be a very shallow pullback, but with no selling pressure yet, that could be all we get?  The 1040 level is more likely, and should be the pullback low.  Then up to start the "C" wave up in an ABC move from the 1010 low.

For the bears, I'd wait until that daily chart finishes putting in a lower tower high on the histogram bars before shorting.  It wouldn't surprise me if we only went down to 1060, before ramping up higher into Friday.  There were probably some bears that went short on Friday, because we hit the 50% Fib. Level... which also makes me think they might push up with that last gasp (on the 15 and 60 minute charts) to 1085 Monday morning,and then roll over.

If so, then 1060 area is more likely the downside target, and then a move up into Friday.  If it rolls over at the open or even gaps down, then I believe 1040 is more likely the downside move for the "B" wave.  Personally, I'll feel much better on the short side once that 112.41 print is hit.  For now, the bulls have control.  The only thing next week that can move the market, is earnings... and you know how easy that is too make up.

It's not going to last for long though folks.  All this bullishness will be over soon, and the bears will rejoice again.  But for next week, the bears should take a vacation... as any move down is best left for day traders, not swing traders.

Good luck to all you bulls and bears out there...

Red

Last Call For The Bears…

79

Is it time for the Bears to go back into hibernation?

Yesterday I called for the 1070.50 spx print to be hit, and it did exactly that today.  But, will my call for a sell off tomorrow be right?  I doubt it, as my luck isn't that good.  I may get a few calls right from time to time, but tomorrow looks quite bullish right now, so calling for a big sell off is probably just wishful dreaming on my part.

The daily chart is pushing the market up hard, from oversold territory.  It's about to cross over the zero level on the histogram bars... quite bullish.  It could easily last until opx next Friday... or longer?  And, it could just as easily roll back down tomorrow too.

There is no way of knowing how high it will go, with regard to putting in higher histogram bars... which should make a higher price on the overall market too.

The 60 minute chart is overbought, as the daily keeps pushing it back up every time it tries to roll over.  The 15 minute chart has already dipped below into oversold territory and is now coming back up now.  That's what caused the run up into the close, as the 15 finally curled up and crossed back above the zero level into positive territory again.

Overall, tomorrow looks very bullish with the daily and 15 minute chart ready to push the market up to the next level.  The 60 is overbought though, which could limit the upside, and in fact it could make the day just trade sideways as the charts aren't all lined up together pointing in the same direction.

Honestly, I don't see much hope for the bears right now.  The light volume will keep the market from selling off hard.  I think a big news event is needed to bring the market down now.  What could that be?  I don't know?  Maybe nothing, as they may want to take it up to 112.41 next week first, before they sell it off.

To sum it up, a slight down or flat day is bullish as that would just be a pullback in a move up higher next week.  A gap up and crap could be very bearish though, as that might indicate that the sell off has started.  The last hope for the bears tomorrow is a hard sell off... one that would make the bulls bail out, that just went long.  But, I just don't see it in the charts.  Sorry about that (I really am, as I'm short the market... so I'm a bear right now).

So the bulls have the ball for now, with 4 downs to go... at the bears' goal line.  The only hope for the bears is a fumble.  (Let it rain, snow, and hail down tomorrow on the field... go bears)

Red

Going Down?

712

After such a huge rally, who's left bearish?

Well that would be me of course.  Today closed at 106.30 spy, and filled the fake print I posted with 10 cents to spare... What will tomorrow bring?  I see two options here: One, a run up to 1070.50 spx, to fill that fake print... or Two, we just open flat or down, and start selling off.

If we pop to 1070 first, then the day should likely back off down to the closing price of today... about 1060 spx.  That would give us a doji for the day, and allow Friday to be a big down day... that could wipe out all of today's gains?

OK, here's a third option... we can all take the Blue Pill, and rally on up taking out the Aprils highs and going to the DIA 118.16 print over the next few months.  Yes, it's possibly... but not likely.  Every time Cobra posts a chart showing the liquidity, it's being sucked out faster then the money in your wallet is (by the government of course).

I find option One or Two the most likely, and give very little odds to option Three.  So, should it go up to 1070, that would be a ideal shorting spot, before a huge sell off over the next coming few days.  I expect next week too be really ugly, as I believe we are now in a wave 3 down on the weekly chart.

While everyone is expecting a rally up to where ever, to make a larger wave 2 up, with the move from 1220 to 1010 being wave 1, I think 1070 is as far as she going.  This ship just popped the nose up into air, before a plunge to the bottom happens.

So, for you bears, the best you can hope for is a move to the 1070 level to fill that gap.  For you bulls, you want a small down day to consolidate before another move higher.  I also have a print of 112.41 spy, which could be the wave 2 target high... after wave 1 down is complete.

If wave 1 down is complete at 1010, then the larger wave 2 up should go to that 112.41 print before starting larger wave 3 down... which should take us to the Wilshire print level of about 725-730 spx.  But that's awhile off yet, so let's just focus on this week for now.

My forecast is simple:  Thursday should go up to 1070 and then reverse back down to close slightly negative or a doji, or it should simply sell off from the open and close lower for the day.  Friday should be a large down day, closing this week out negative.

Red

Indecision?

185

that's what we got today...

As for tomorrow, I don't know where we are going?  That's why they call that the "indecision candle", or doji.  It looks very bearish how it went up to the 1040 level that I expect on Friday (a day early I was), but we should rally at some point soon.

We are very oversold now, and appear to be basing, or consolidating in this lower range.  That could be viewed as bullish, or it could be viewed as a bear flag forming... which is bearish.

The 15 minute chart look ready to rally up tomorrow, and the MACD's are recycling back up from oversold, and the histogram bars look ready to cross the zero line as well.  We are also forming a support trendline from the 1010 low, and the higher low at 1015, and now 1018 today.

The 60 minute chart looks ready to go back up and make a second histogram tower above the zero line.  If it's a lower tower, then it would be putting in a negative divergence.  The bulls need it to be a higher tower then the top of today's tower when the market hit 1040.

The daily chart put in a higher low on the histogram bar today.  That shows that an uptrend is about to start soon.  The only bad thing about that, is that the MACD's aren't rolling back up yet.  And, ADX line is still rising.  The negative DI line did roll over today, and is now pointing down, and the positive DI line curled up today, so that's bullish.

The RSI turned back up too, and didn't penetrate the 30 level (if it did, that's really bearish).  But, the charts seem mixed overall.  I can see bullish points of view and bearish, so I just don't know what to think about tomorrow?

The weekly chart is still very bearish, and isn't showing any signs of going up yet.  That means we should expect another down week, although that just doesn't seem likely too me.  Just because I see how oversold it is, and should rally.  I'm still expecting a move to 1070 soon... but when does it start?

The news out this week isn't really much of anything important, so with this light volume, you would think that we are going to start a rally this week.  That's why I don't think this week will be down, even though the charts tell me it will.  I'm obviously just going on my gut feeling that we are going to start that rally tomorrow, and not continue to sell off.

So, I wait for the rally, like all the other bears do.  The bulls are long, and the bears are waiting to get short at a higher level.  Will it happen?  Who knows?  Not me, that's for sure.

Good luck to everyone...

Red

Update:  In the afterhours session, I just caught this print of 106.20 spy.  It's likely to be our high tomorrow, should we rally.

Weekend Update…

111

I can't find anything bullish?

I wasn't sure what to say this weekend, so I'll keep it short and simple.  I looked hard for a reason to see a gap up on Tuesday, but I can't find one?  Yes we are overdue... yes we need one... but I just can't see it in the charts yet?  Last Thursday I did a video explaining that I expected a move to 1040 on Friday... but it didn't happen?

Friday had everything going for it.  It had light volume, a holiday weekend in front of it, and traders leaving early... but it failed to rally?  In fact, the brief rally into the close was sold off in one 10 minute bearish engulfing candle.  Not good for the bulls at all.

While I still think we will see that 1070.50 spx fake print soon, it might not happen until we put in a lower low first.  While we did that last week, it didn't come with any panic selling, and that's what concerns me.  We need a capitulation day to wipe-out all the bulls, and get every bear back in... short again.

Most bears probably closed up their positions on Friday, expecting a rally next week.  After all, who would be brave enough to hold shorts over a 3 day weekend, after selling off for 2 weeks straight now?  I'd say those bears are in cash, and I'd guess that there were some bulls that went long into the weekend... but not many.

I think it's going to catch a lot of people off guard if it goes down instead of up on Tuesday.  Anyway, I'll keep this short, like I said.  But one other thing... you should watch this video below about the BP disaster, it confirms what I thought all along... it was another false flag event.

Red

Happy 4th of July everyone!

Update: This is a very interesting video by Karl Denninger, showing how the market in currently (as in July 4th, 2010) being manipulated up and down with fake bids and sells. Watch it... it's worth your time.

Jobs, Jobs, And Less Jobs…

313

... unless you want to clean up an oil spill for BP of course.

Yes, the numbers were horrible today... for the Continuing Claims and Initial Claims that is.  Tomorrow has the  Nonfarm Payroll and Unemployment Rate, which should be just as bad.  But, we are very oversold right now, so I'm expecting a sell off first, then a rally.

We went down to within 41 cents of the 100.72 spy fake print, before reversing hard into the close.  I still think a down move to the 990 area is coming, but not tomorrow.  I think the move down in the morning will only put in a higher low, and then rally the rest of the day, closing positive.

There is a lot of resistance in the 1040 area now, and I think that will stop the advance tomorrow, and could be the closing price too?  However, I have a fake print of 1070.50 too, and should 1040 not hold back the bulls... a massive short squeeze could happen, taking us up to that level.

Now don't get me wrong, I don't think we will hit that target tomorrow... but anything is possible, so keep that in mind.  I feel like we will hit 1040, and close around there, then hit 1070 next week, at which point I would go short again.

But let's just play it one day at a time.  For tomorrow, a possible down move early in the morning on jobs data and rally the rest of the day is my forecast for Friday.

Good luck everyone...

Red

s2Member®