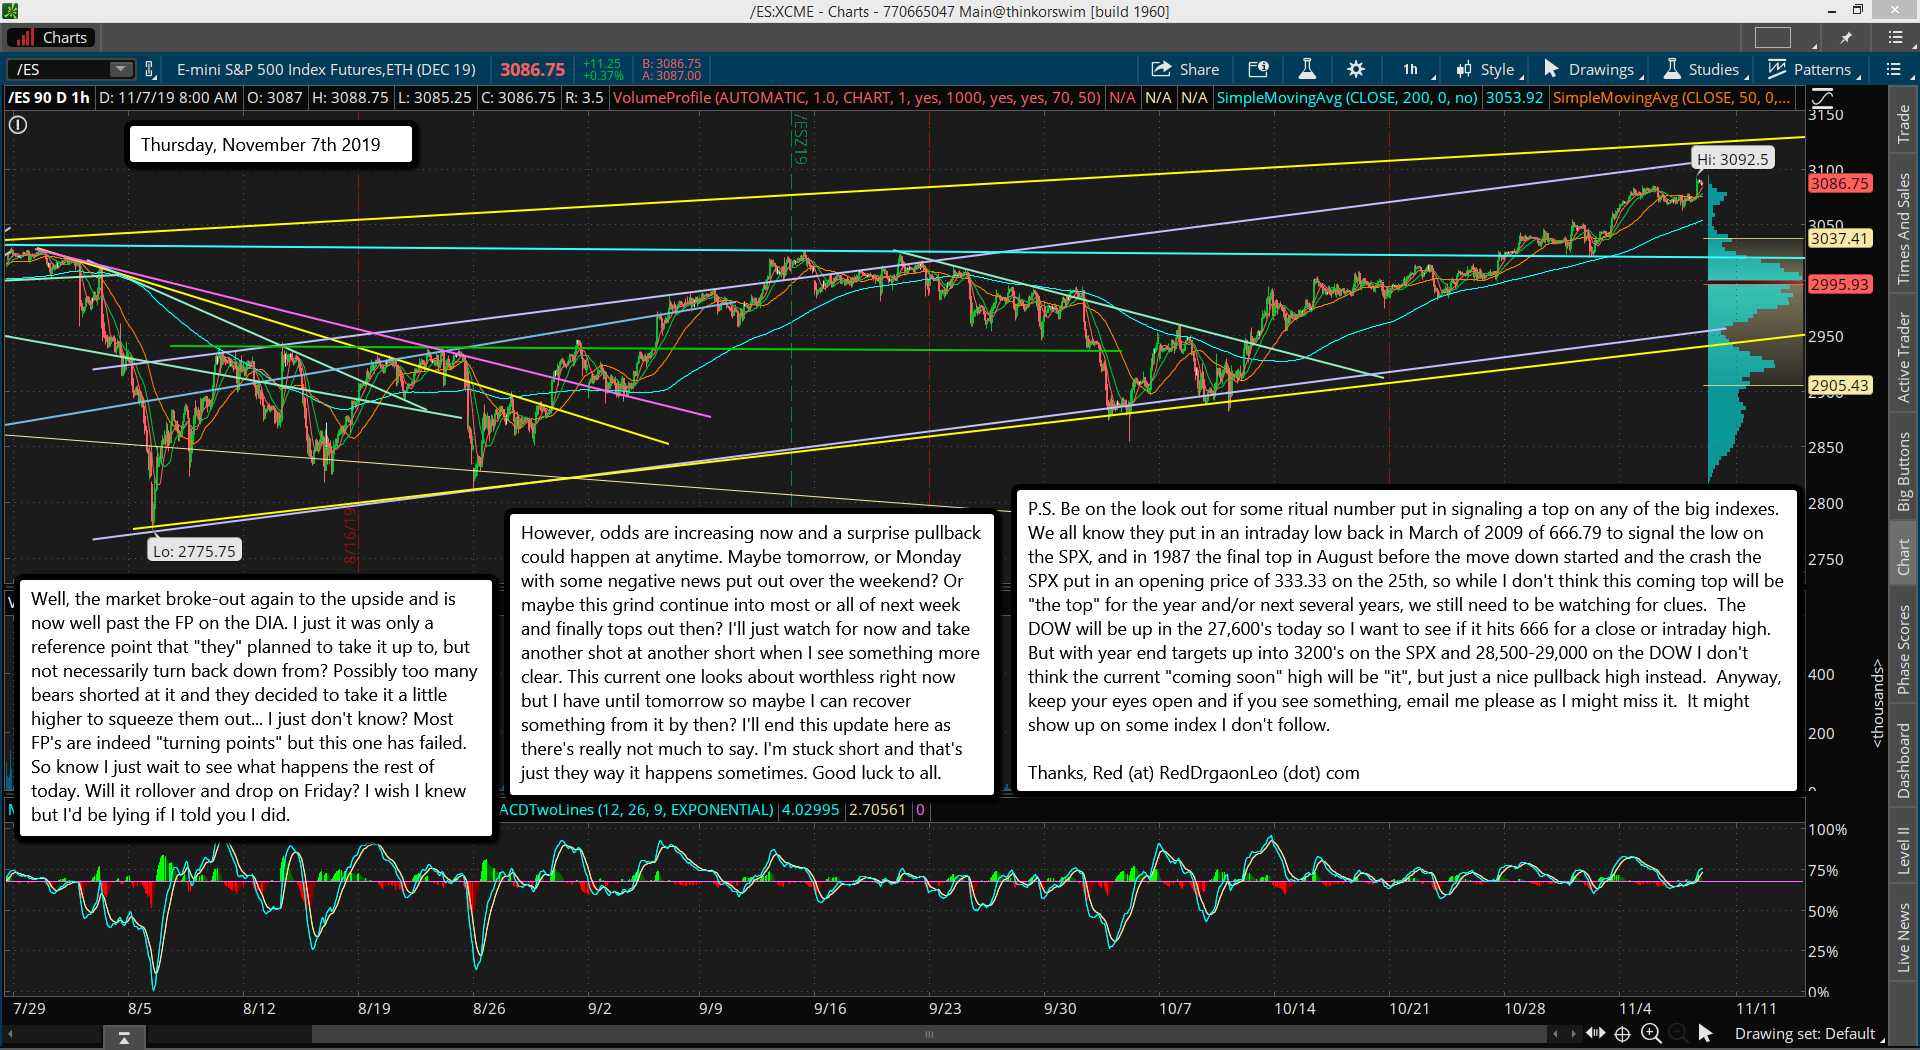
Well, the market broke-out again to the upside and is now well past the FP on the DIA. I just it was only a reference point that "they" planned to take it up to, but not necessarily turn back down from? Possibly too many bears shorted at it and they decided to take it a little higher to squeeze them out... I just don't know? Most FP's are indeed "turning points" but this one has failed. So know I just wait to see what happens the rest of today. Will it rollover and drop on Friday? I wish I knew but I'd be lying if I told you I did.
However, odds are increasing now and a surprise pullback could happen at anytime. Maybe tomorrow, or Monday with some negative news put out over the weekend? Or maybe this grind continue into most or all of next week and finally tops out then? I'll just watch for now and take another shot at another short when I see something more clear. This current one looks about worthless right now but I have until tomorrow so maybe I can recover something from it by then? I'll end this update here as there's really not much to say. I'm stuck short and that's just they way it happens sometimes. Good luck to all.
P.S. Be on the look out for some ritual number put in signaling a top on any of the big indexes. We all know they put in an intraday low back in March of 2009 of 666.79 to signal the low on the SPX, and in 1987 the final top in August before the move down started and the crash the SPX put in an opening price of 333.33 on the 25th, so while I don't think this coming top will be "the top" for the year and/or next several years, we still need to be watching for clues. The DOW will be up in the 27,600's today so I want to see if it hits 666 for a close or intraday high. But with year end targets up into 3200's on the SPX and 28,500-29,000 on the DOW I don't think the current "coming soon" high will be "it", but just a nice pullback high instead. Anyway, keep your eyes open and if you see something, email me please as I might miss it. It might show up on some index I don't follow.
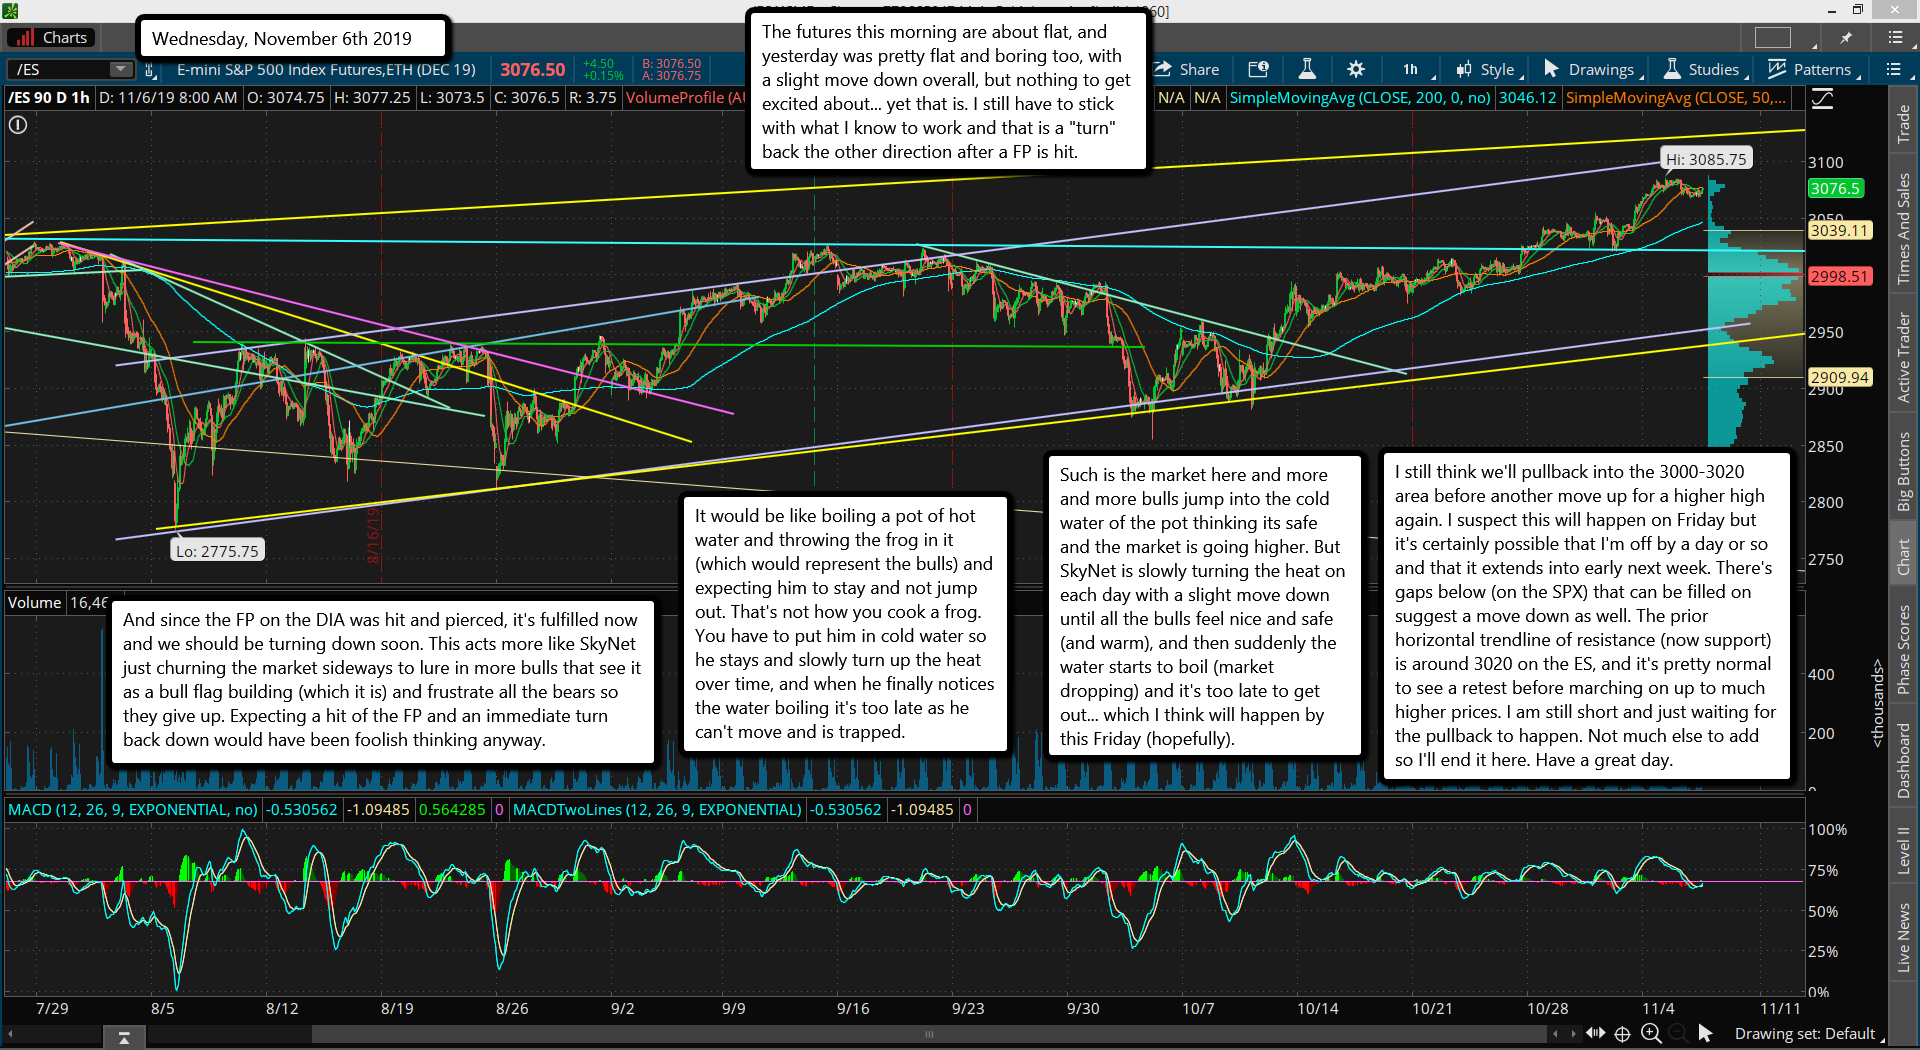
The futures this morning are about flat, and yesterday was pretty flat and boring too, with a slight move down overall, but nothing to get excited about... yet that is. I still have to stick with what I know to work and that is a "turn" back the other direction after a FP is hit.
And since the FP on the DIA was hit and pierced, it's fulfilled now and we should be turning down soon. This acts more like SkyNet just churning the market sideways to lure in more bulls that see it as a bull flag building (which it is) and frustrate all the bears so they give up. Expecting a hit of the FP and an immediate turn back down would have been foolish thinking anyway.
It would be like boiling a pot of hot water and throwing the frog in it (which would represent the bulls) and expecting him to stay and not jump out. That's not how you cook a frog. You have to put him in cold water so he stays and slowly turn up the heat over time, and when he finally notices the water boiling it's too late as he can't move and is trapped.
Such is the market here and more and more bulls jump into the cold water of the pot thinking its safe and the market is going higher. But SkyNet is slowly turning the heat on each day with a slight move down until all the bulls feel nice and safe (and warm), and then suddenly the water starts to boil (market dropping) and it's too late to get out... which I think will happen by this Friday (hopefully).
I still think we'll pullback into the 3000-3020 area before another move up for a higher high again. I suspect this will happen on Friday but it's certainly possible that I'm off by a day or so and that it extends into early next week. There's gaps below (on the SPX) that can be filled on suggest a move down as well. The prior horizontal trendline of resistance (now support) is around 3020 on the ES, and it's pretty normal to see a retest before marching on up to much higher prices. I am still short and just waiting for the pullback to happen. Not much else to add so I'll end it here. Have a great day.
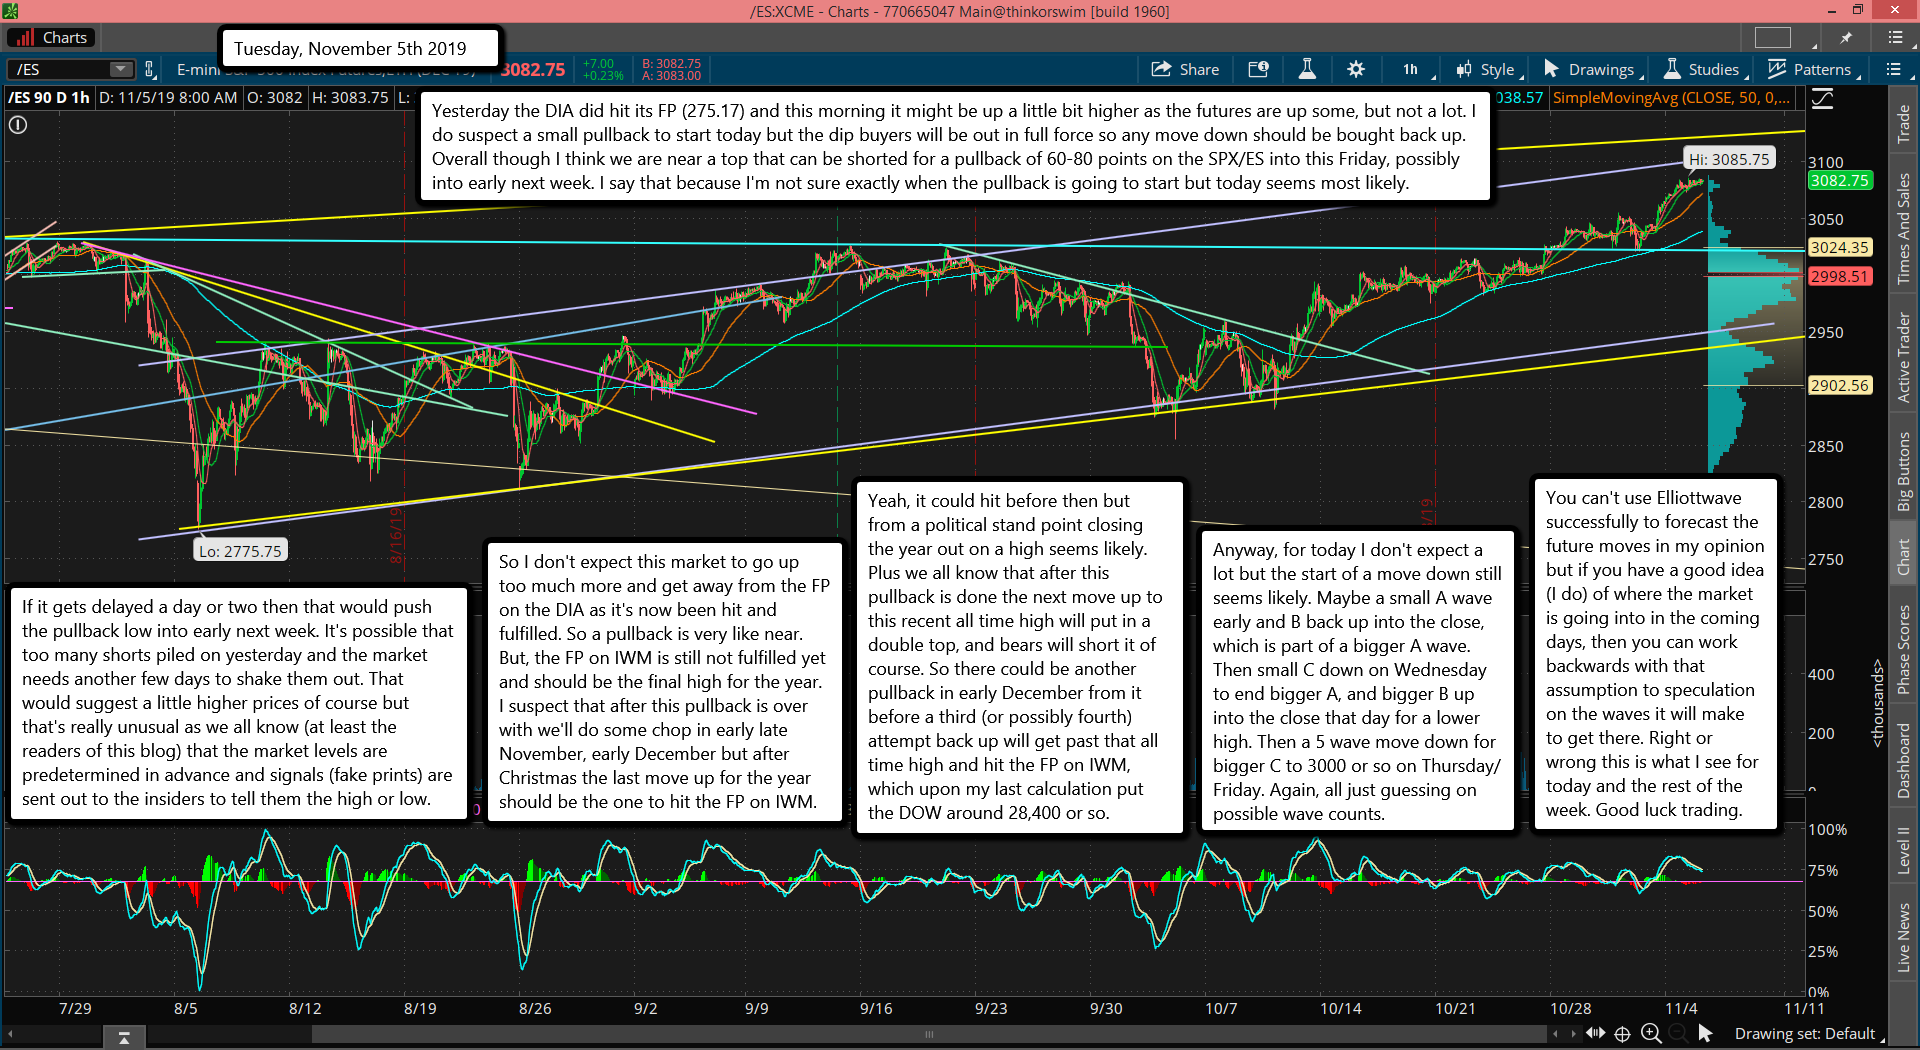
Yesterday the DIA did hit its FP (275.17) and this morning it might be up a little bit higher as the futures are up some, but not a lot. I do suspect a small pullback to start today but the dip buyers will be out in full force so any move down should be bought back up. Overall though I think we are near a top that can be shorted for a pullback of 60-80 points on the SPX/ES into this Friday, possibly into early next week. I say that because I'm not sure exactly when the pullback is going to start but today seems most likely.
If it gets delayed a day or two then that would push the pullback low into early next week. It's possible that too many shorts piled on yesterday and the market needs another few days to shake them out. That would suggest a little higher prices of course but that's really unusual as we all know (at least the readers of this blog) that the market levels are predetermined in advance and signals (fake prints) are sent out to the insiders to tell them the high or low.
So I don't expect this market to go up too much more and get away from the FP on the DIA as it's now been hit and fulfilled. So a pullback is very like near. But, the FP on IWM is still not fulfilled yet and should be the final high for the year. I suspect that after this pullback is over with we'll do some chop in early late November, early December but after Christmas the last move up for the year should be the one to hit the FP on IWM.
Yeah, it could hit before then but from a political stand point closing the year out on a high seems likely. Plus we all know that after this pullback is done the next move up to this recent all time high will put in a double top, and bears will short it of course. So there could be another pullback in early December from it before a third (or possibly fourth) attempt back up will get past that all time high and hit the FP on IWM, which upon my last calculation put the DOW around 28,400 or so.
Anyway, for today I don't expect a lot but the start of a move down still seems likely. Maybe a small A wave early and B back up into the close, which is part of a bigger A wave. Then small C down on Wednesday to end bigger A, and bigger B up into the close that day for a lower high. Then a 5 wave move down for bigger C to 3000 or so on Thursday/Friday. Again, all just guessing on possible wave counts.
You can't use Elliottwave successfully to forecast the future moves in my opinion but if you have a good idea (I do) of where the market is going into in the coming days, then you can work backwards with that assumption to speculation on the waves it will make to get there. Right or wrong this is what I see for today and the rest of the week. Good luck trading.
Here we are (almost)... right up near that FP on the DIA this morning. I do expect it to be hit sometime today during normal market hours, and if it marks a turning point (I think odds are for that to be the case) then I think we'll see the low 3000's on the ES/SPX by this Friday. Everyone should be nice and bullish after today, and will buy every dip looking for 3100, 3200, etc... But that shouldn't happen on the first attempt, and especially since we have a FP that's about to get hit today. LOL... just as I was typing this update the DIA surged up and hit 275.00 on the nose!
Needless to say gang I'm a bear now and will look for a short today. Overall I do think we are going higher into the end of the year but we should pullback this week as upside targets have been hit now, and we are quite overbought on the short term. I see no reason to make a long drawn out post today. It's pretty simple... the FP has been hit, upside projection ranges/targets have been hit, and we are very overbought. Time to look for a pullback this week. AKA, time for a short. I don't expect anything huge but 3000 area is more then likely on the SPX/ES by this Friday in my humble opinion. Good Luck and have a blessed day.
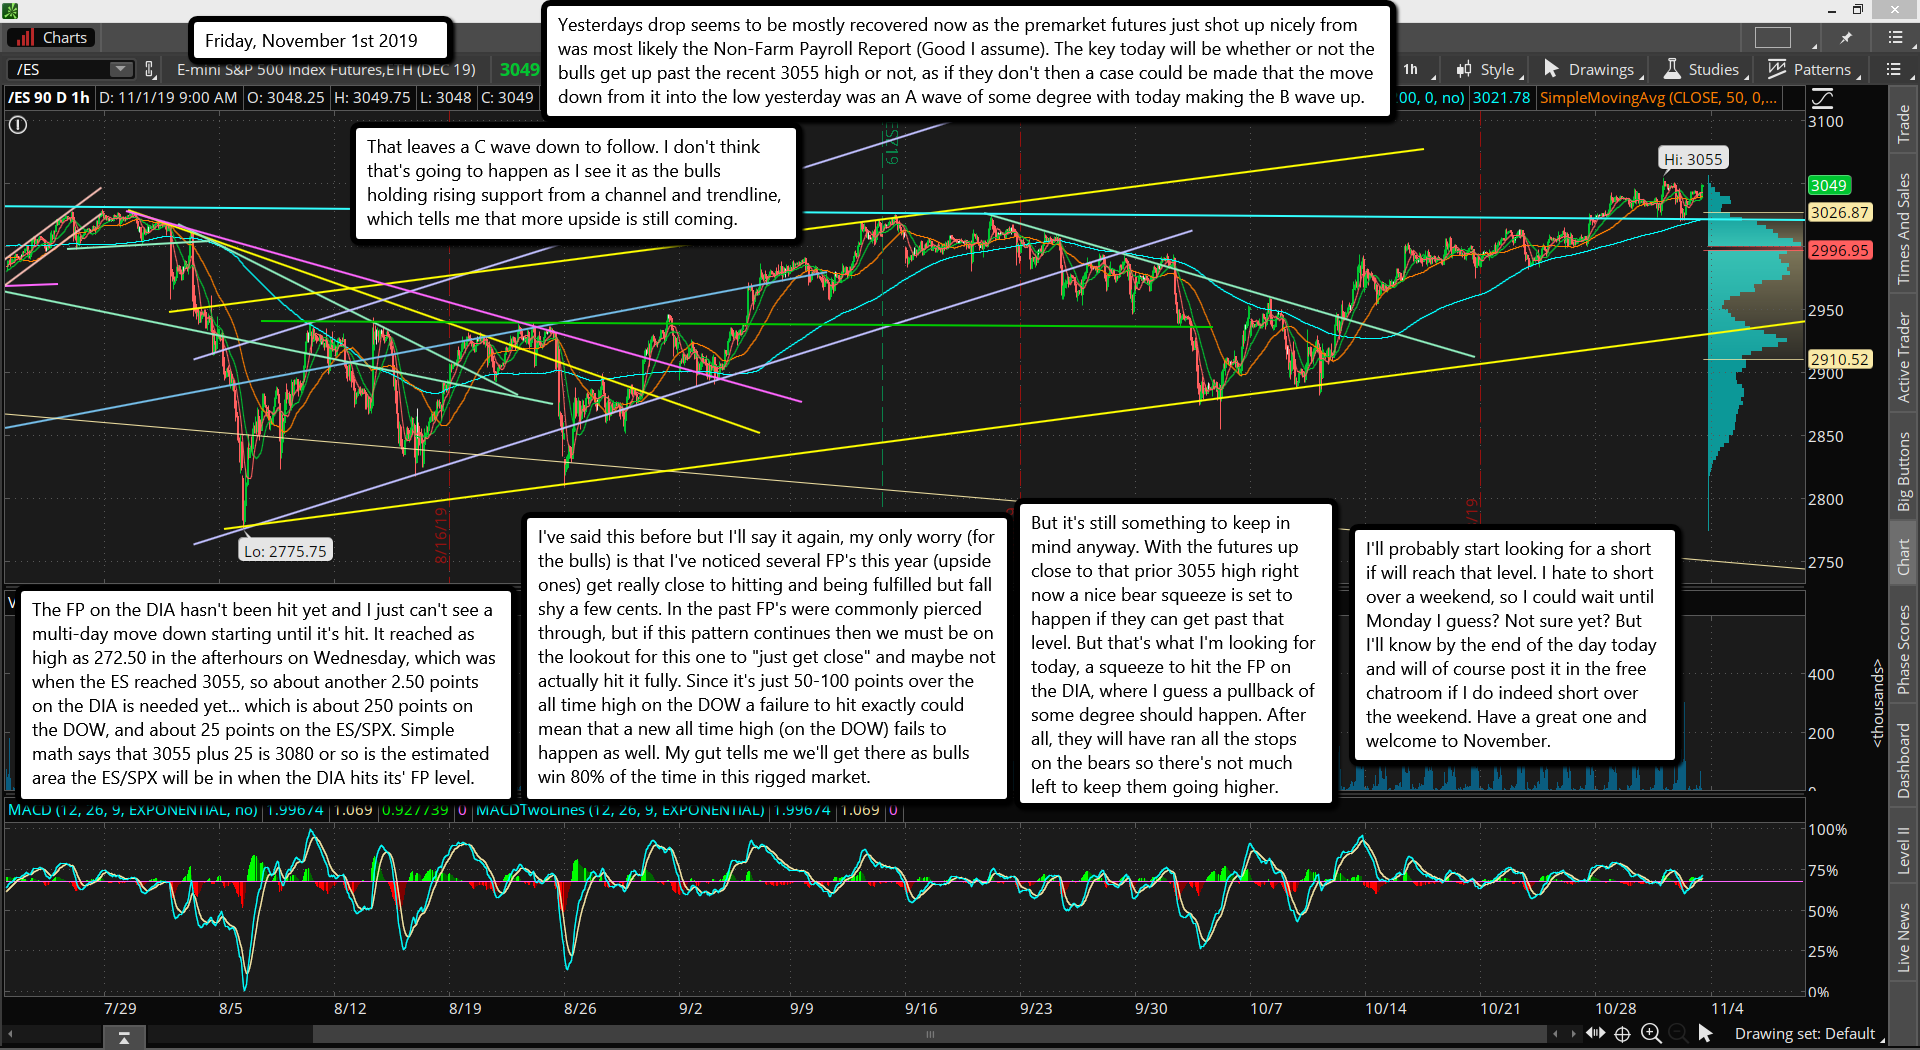
Yesterdays drop seems to be mostly recovered now as the premarket futures just shot up nicely from was most likely the Non-Farm Payroll Report (Good I assume). The key today will be whether or not the bulls get up past the recent 3055 high or not, as if they don't then a case could be made that the move down from it into the low yesterday was an A wave of some degree with today making the B wave up.
That leaves a C wave down to follow. I don't think that's going to happen as I see it as the bulls holding rising support from a channel and trendline, which tells me that more upside is still coming.
The FP on the DIA hasn't been hit yet and I just can't see a multi-day move down starting until it's hit. It reached as high as 272.50 in the afterhours on Wednesday, which was when the ES reached 3055, so about another 2.50 points on the DIA is needed yet... which is about 250 points on the DOW, and about 25 points on the ES/SPX. Simple math says that 3055 plus 25 is 3080 or so is the estimated area the ES/SPX will be in when the DIA hits its' FP level.
I've said this before but I'll say it again, my only worry (for the bulls) is that I've noticed several FP's this year (upside ones) get really close to hitting and being fulfilled but fall shy a few cents. In the past FP's were commonly pierced through, but if this pattern continues then we must be on the lookout for this one to "just get close" and maybe not actually hit it fully. Since it's just 50-100 points over the all time high on the DOW a failure to hit exactly could mean that a new all time high (on the DOW) fails to happen as well. My gut tells me we'll get there as bulls win 80% of the time in this rigged market.
But it's still something to keep in mind anyway. With the futures up close to that prior 3055 high right now a nice bear squeeze is set to happen if they can get past that level. But that's what I'm looking for today, a squeeze to hit the FP on the DIA, where I guess a pullback of some degree should happen. After all, they will have ran all the stops on the bears so there's not much left to keep them going higher.
I'll probably start looking for a short if will reach that level. I hate to short over a weekend, so I could wait until Monday I guess? Not sure yet? But I'll know by the end of the day today and will of course post it in the free chatroom if I do indeed short over the weekend. Have a great one and welcome to November.
Yesterday around 1:30 pm I exited my Apple shorts as I just felt that it had pulled back in front of earnings enough that there probably wasn't much more downside left for afterwards... or worst, it went back up. Glad I did as the earnings were obviously viewed as positive since it ripped back up higher after the announcement.
After the Fed announcement the market rallied up nicely and put in another new high, but is down some this morning. I took a small long into this Friday as I think it's possible that the FP on the DIA will get hit by the end of this week. So far this morning I'm questioning that decision. But the day hasn't started yet and this early pullback could just be to reset the short term overbought charts to make another run higher later today. Also, I did a new post last night about a "possible" False Flag event that could happen this Sunday? There's 3 video's on the post (not done by me) that explain it all.
I pray it's all wrong but we do indeed know that the satanists did indeed tell us in advance of 911, so we have to at least keep an open mind for them to do another one. The guy makes a lot sense on how it points to November 3rd, but I didn't see any evidence (or good clues) that said it would happen in 2019, so maybe it's planned for another year out into the future? I pray it doesn't happen at all. Anyway, back to the market. The FP on the DIA translates to 27,436.11 on the DOW if you used the closing price yesterday of both of them for your calculations.
It's not an exact 100 to 1 ratio between the DOW and the DIA, just like it's not an exact 10 to 1 ratio between the SPX and the SPY. That's why 275.00 on the DIA isn't exactly 27,500 on the DOW, but it's close as you can see. Bottom line is that it's a new all time high as the current one is 27,398.68 from July 16th, 2019. But, let's keep in mind that the ratio between the two aren't locked in stone and can vary a little from day to day.
Yesterday at the close it was 99.76766972477064 to 1... again, not an exact 100 to 1. Between today and the day that the 275.00 FP is hit that ratio could change a little... meaning it's possible (though it doesn't really look likely) that the FP on the DIA could be hit (which is of course a new all time high on it) while the actual DOW makes a slightly lower high. On July 16th the all time high on it was 273.99, so again "possible" but not something I'd bet on. Most likely the DOW will make a new all time high with the hit of the FP on the DIA. Why do I mention this at all?
Because if for some reason the DOW failed to make a new all time high it could trigger a very large sell signal on the market, which then would make me more worried about the false flag event being more possible to really happen this coming Sunday. Again, I pray it doesn't, and a new all time high would lessen those odds I think as while we should still get a pullback from it, a very large drop (aka... flash crash) won't have very high odds. Most double tops are met with some selling but I've never seen one just rollover and crash after hitting it.
Ok, on the SPX/ES there are higher upside target not yet met, and they are just under 3100 by about 5-15 points. If we get up to that area by tomorrow I'd expect the FP on the DIA to be hit as well. That's a pretty strong rally from the 3055 high yesterday, but it's possible I guess? Like I said, I took a long yesterday on the SPX looking for continued strength this morning to hit those upside targets. But if it doesn't look like it's going to happen I'll exit those longs and re-evaluate. Have a great day and pray that the false flag event doesn't happen.
An interesting set of video's here gang. I watched all 3 and thought I'd repost the article. As you all know I have a FP on the DIA that is getting close to being hit. It's for 275.00, which is about 27,500 on the DOW... and that's a new all time high. It very well could be hit by this Friday November 1st, 2019 from the looks of the market close today (October 30th, 2019).
While I don't see anything in the charts that would suggest a crash or even just a flash crash is coming I still can't rule out a down move happening after a hit of the FP on the DIA. Most new all times produce pullbacks and this one should be no different... but I've never seen a crash follow one. Maybe it's desperate times out there for the elite satanists and they know they can't keep the market going up forever? Who knows?
Obviously the market would have at least a flash crash if Seattle was blown up in this false flag prediction for this coming Sunday November 3rd, 2019. I don't see how the guy came up with the year in the video's but certainly the date seems accurate. Next year November 3rd will be the presidential election, so who's to say it couldn't happen then... or even in 2021?
I don't know but I'll just continue to trade the market as I see it. If we hit the FP by the close this Friday I suspect it will setup a nice short into next week anyway. I don't see this false flag event happening this coming Sunday, and I pray it doesn't, but I still felt the need to share it so people can be on alert just in case some thing does happen.
Red
Sidenote: When I do the calculations between the DOW and the DIA today, based on the closing prices, the FP on the DIA of 275.00 is equal to 27,436.11 on the DOW... so a new all time on it but not 27,500 like I previously said.
Is this a potential false flag like 9-1-1 or just fear porn?
You decide. It’s interesting to keep an eye on Wash just in case.
Here are three videos about it.
I’m NOT saying this is GOING to happen and I’m NOT saying it won’t happen.
This was a highly requested video and this is my summary and understanding at this point from the work of Kochen Mit Willi.
Having said that…the symbolism they pack into TV shows, Movies, commercials, magazines and comic books is interesting. The First Predictive Programming False Flag shirt of its kind: https://teespring.com/nov-3rd-predict…
In this video I want to warn you of a possible False Flag attack in Seattle, that will take place on Nov 03, 2019.
Here is a warm up of Seattle Predictive Programming Imagery.
Comic book title unknown
Cirith Ungol is an American heavy metal band formed in late 1971.
The CD jacket for the movie ‘Seattle Superstorm’ (2011)
The 2013 movie ‘End of the World’
New Zealand series ‘The Shannara Chronicles’ (2016-2017)
Sci-fi movie ‘Dark Storm’ (2006)
The following image is taken from the movie “How It Ends,” which Netflix released in 2018. The image shows the view of downtown Seattle’s skyline from the Interstate 5 freeway looking north. It’s an iconic and memorable viewpoint for me, as I lived there for three decades.
This next image is a scene clipped from a United Arab Emirates movie called “Chaos” (2005) that portrays explosions and fire around a structure that looks like Seattle’s Space Needle.
Next is a clipped still from a Trump-mocking music video by Japanese boy band “New World Order” for their track called “Let’s Start World War 3.” The video starts off in Tokyo and ends in Seattle.
ABC’s new dramatic series “Station 19” (signalling 2019?) — centered around Seattle’s firefighters — has an apocalyptic episode called “Last Day on Earth.”
And the season finale of the Seattle-based series “Grey’s Anatomy” ended with two of the characters being suddenly surrounded by smoke while in their car on a highway, and then the male character walks off into the smoke. This series seemed to be especially fond of fire scenes.
In terms of timing, researchers seem to be zeroing in on November 3 as a possible date. 3/11 is the pat 3 x 11, which equals 33, an important number in dark occultism. Watches and clocks showing 11:15 have been turning up in media scenes. From strange cover of Economist magazine.
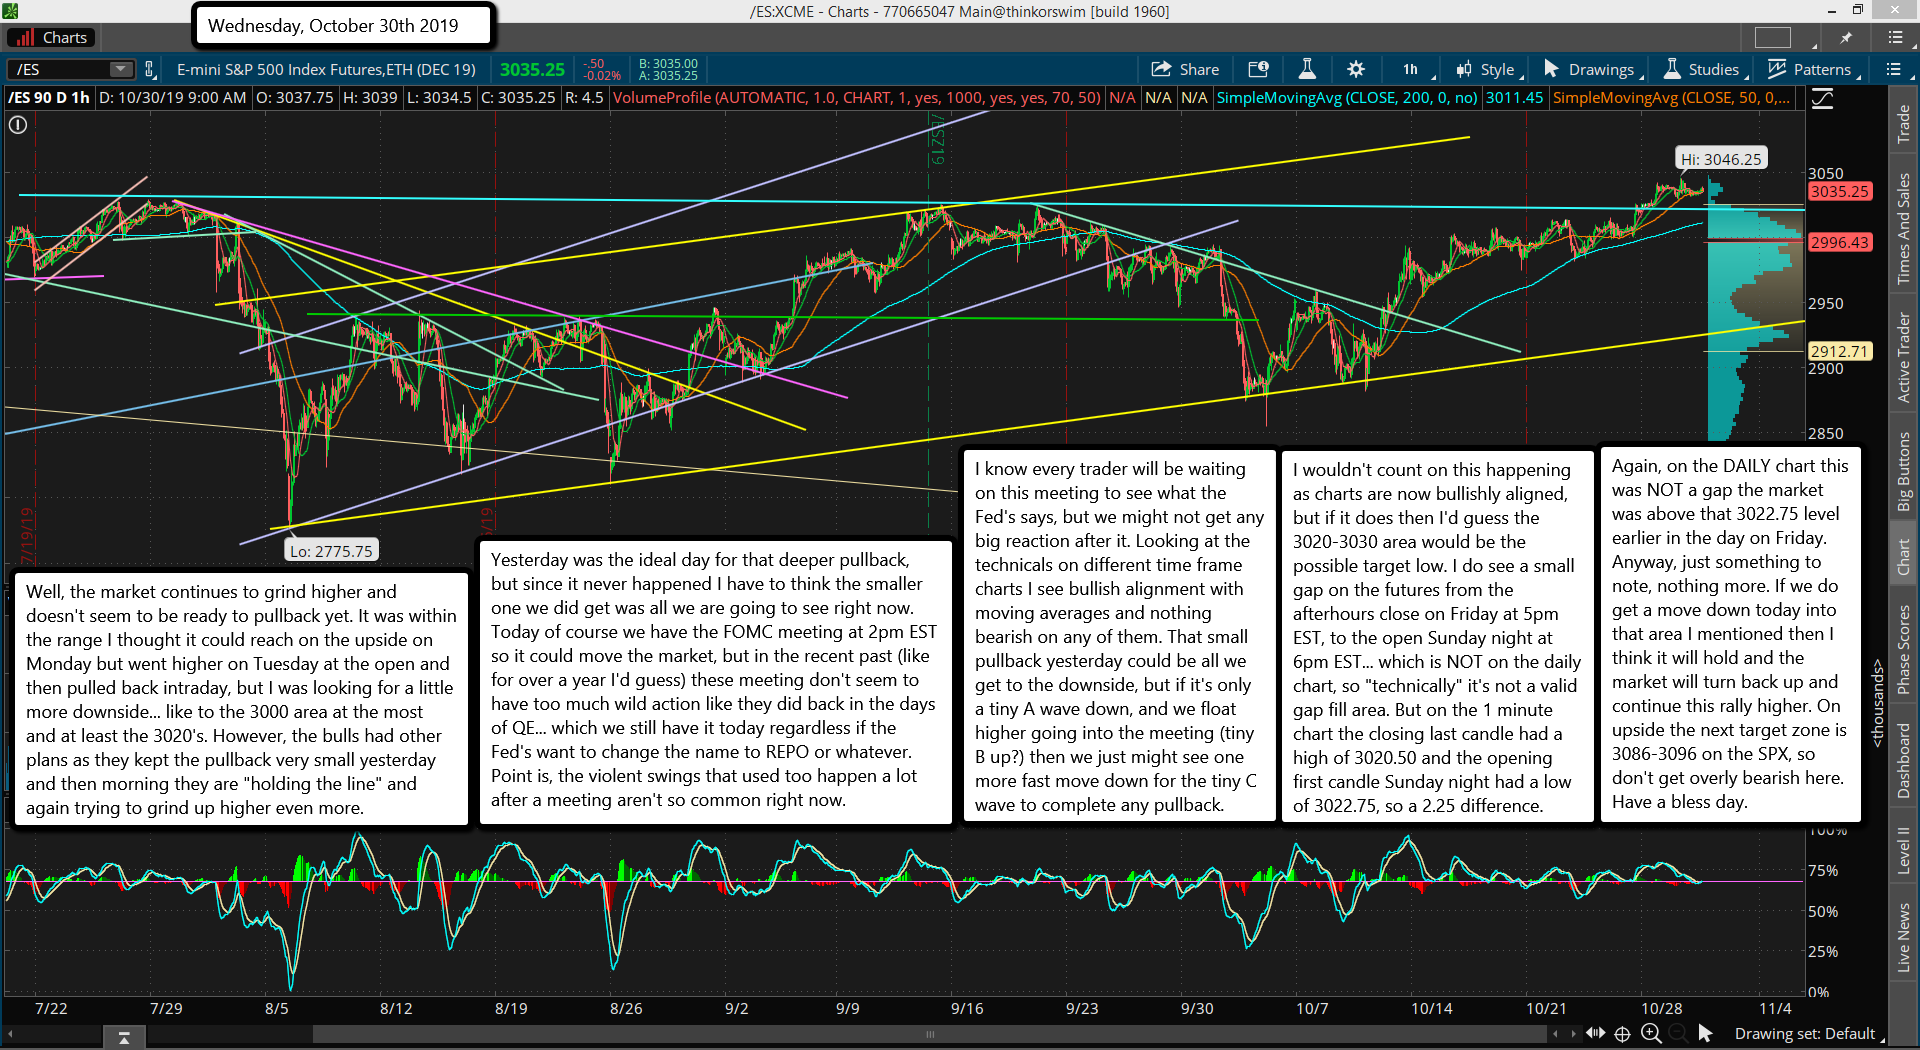
Well, the market continues to grind higher and doesn't seem to be ready to pullback yet. It was within the range I thought it could reach on the upside on Monday but went higher on Tuesday at the open and then pulled back intraday, but I was looking for a little more downside... like to the 3000 area at the most and at least the 3020's. However, the bulls had other plans as they kept the pullback very small yesterday and then morning they are "holding the line" and again trying to grind up higher even more.
Yesterday was the ideal day for that deeper pullback, but since it never happened I have to think the smaller one we did get was all we are going to see right now. Today of course we have the FOMC meeting at 2pm EST so it could move the market, but in the recent past (like for over a year I'd guess) these meeting don't seem to have too much wild action like they did back in the days of QE... which we still have it today regardless if the Fed's want to change the name to REPO or whatever. Point is, the violent swings that used too happen a lot after a meeting aren't so common right now.
I know every trader will be waiting on this meeting to see what the Fed's says, but we might not get any big reaction after it. Looking at the technicals on different time frame charts I see bullish alignment with moving averages and nothing bearish on any of them. That small pullback yesterday could be all we get to the downside, but if it's only a tiny A wave down, and we float higher going into the meeting (tiny B up?) then we just might see one more fast move down for the tiny C wave to complete any pullback.
I wouldn't count on this happening as charts are now bullishly aligned, but if it does then I'd guess the 3020-3030 area would be the possible target low. I do see a small gap on the futures from the afterhours close on Friday at 5pm EST, to the open Sunday night at 6pm EST... which is NOT on the daily chart, so "technically" it's not a valid gap fill area. But on the 1 minute chart the closing last candle had a high of 3020.50 and the opening first candle Sunday night had a low of 3022.75, so a 2.25 difference.
Again, on the DAILY chart this was NOT a gap the market was above that 3022.75 level earlier in the day on Friday. Anyway, just something to note, nothing more. If we do get a move down today into that area I mentioned then I think it will hold and the market will turn back up and continue this rally higher. On upside the next target zone is 3086-3096 on the SPX, so don't get overly bearish here. Have a bless day.
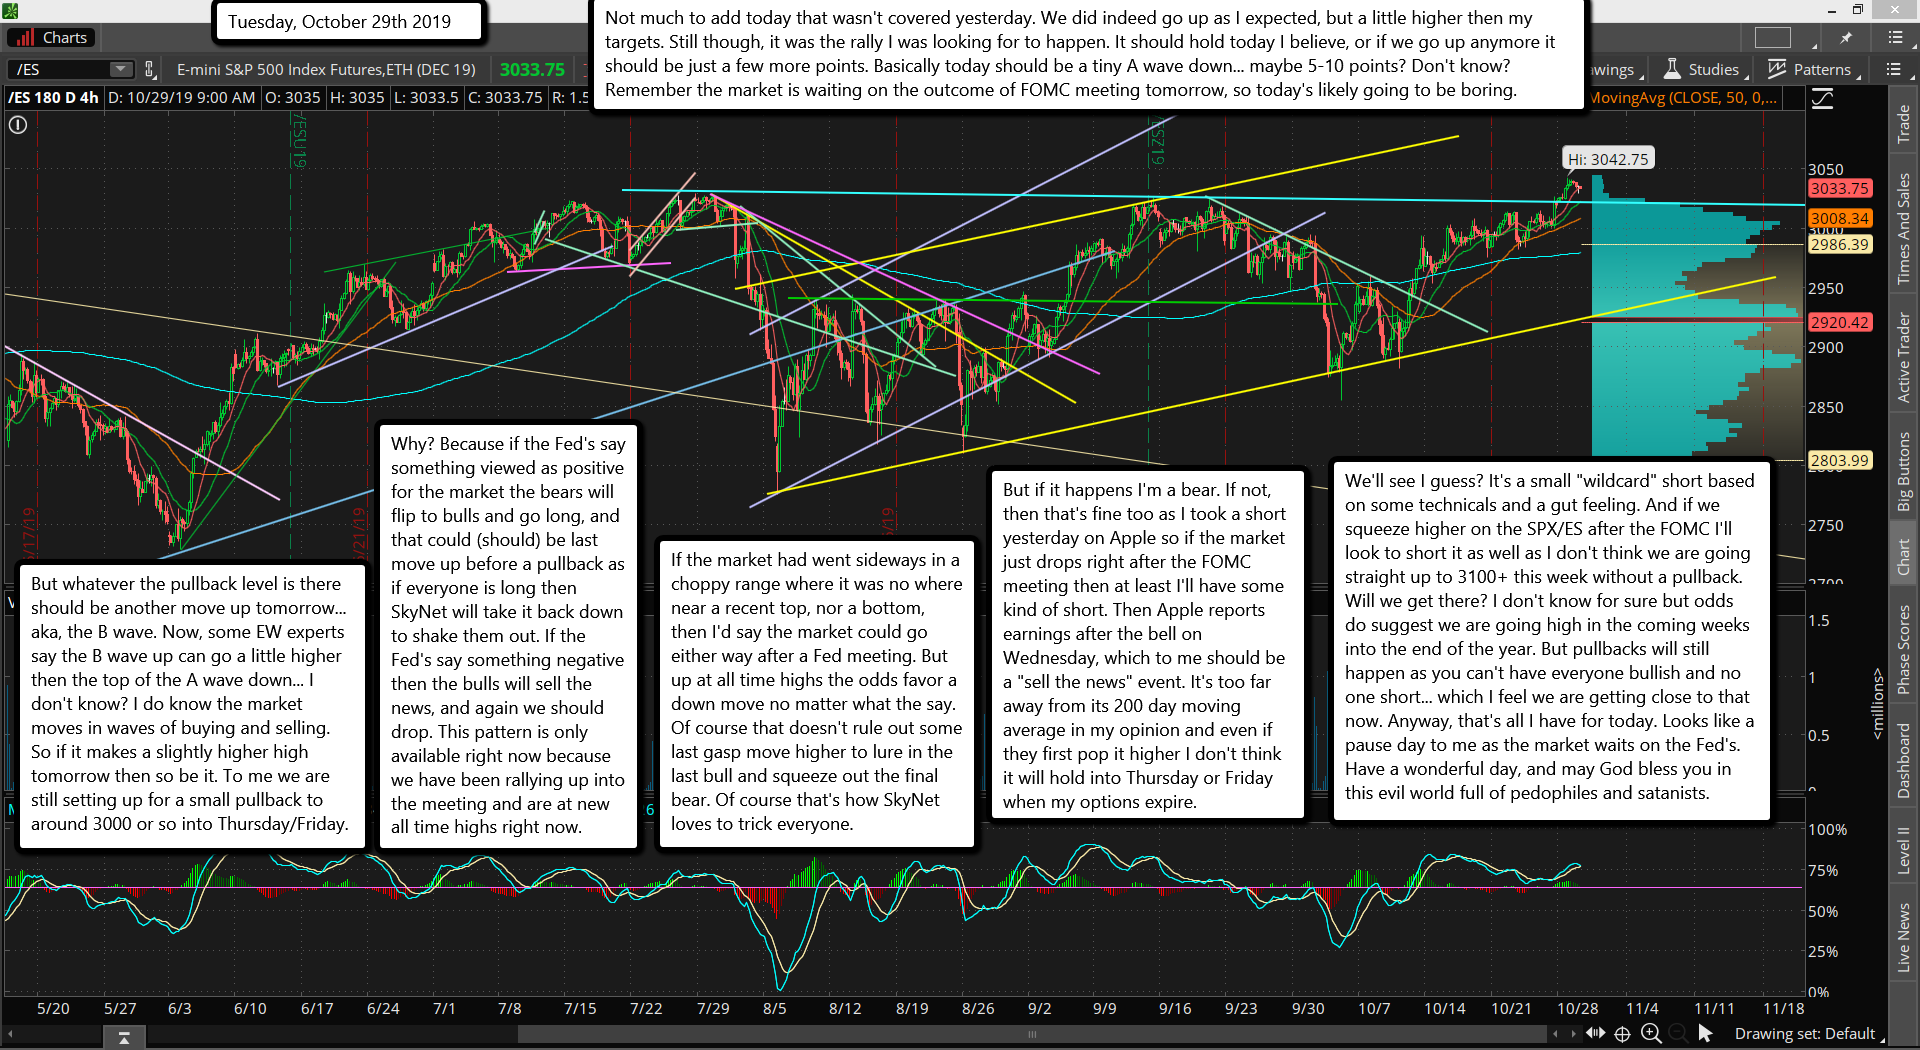
Not much to add today that wasn't covered yesterday. We did indeed go up as I expected, but a little higher then my targets. Still though, it was the rally I was looking for to happen. It should hold today I believe, or if we go up anymore it should be just a few more points. Basically today should be a tiny A wave down... maybe 5-10 points? Don't know? Remember the market is waiting on the outcome of FOMC meeting tomorrow, so today's likely going to be boring.
But whatever the pullback level is there should be another move up tomorrow... aka, the B wave. Now, some EW experts say the B wave up can go a little higher then the top of the A wave down... I don't know? I do know the market moves in waves of buying and selling. So if it makes a slightly higher high tomorrow then so be it. To me we are still setting up for a small pullback to around 3000 or so into Thursday/Friday.
Why? Because if the Fed's say something viewed as positive for the market the bears will flip to bulls and go long, and that could (should) be last move up before a pullback as if everyone is long then SkyNet will take it back down to shake them out. If the Fed's say something negative then the bulls will sell the news, and again we should drop. This pattern is only available right now because we have been rallying up into the meeting and are at new all time highs right now.
If the market had went sideways in a choppy range where it was no where near a recent top, nor a bottom, then I'd say the market could go either way after a Fed meeting. But up at all time highs the odds favor a down move no matter what the say. Of course that doesn't rule out some last gasp move higher to lure in the last bull and squeeze out the final bear. Of course that's how SkyNet loves to trick everyone.
But if it happens I'm a bear. If not, then that's fine too as I took a short yesterday on Apple so if the market just drops right after the FOMC meeting then at least I'll have some kind of short. Then Apple reports earnings after the bell on Wednesday, which to me should be a "sell the news" event. It's too far away from its 200 day moving average in my opinion and even if they first pop it higher I don't think it will hold into Thursday or Friday when my options expire.
We'll see I guess? It's a small "wildcard" short based on some technicals and a gut feeling. And if we squeeze higher on the SPX/ES after the FOMC I'll look to short it as well as I don't think we are going straight up to 3100+ this week without a pullback. Will we get there? I don't know for sure but odds do suggest we are going high in the coming weeks into the end of the year. But pullbacks will still happen as you can't have everyone bullish and no one short... which I feel we are getting close to that now. Anyway, that's all I have for today. Looks like a pause day to me as the market waits on the Fed's. Have a wonderful day, and may God bless you in this evil world full of pedophiles and satanists.
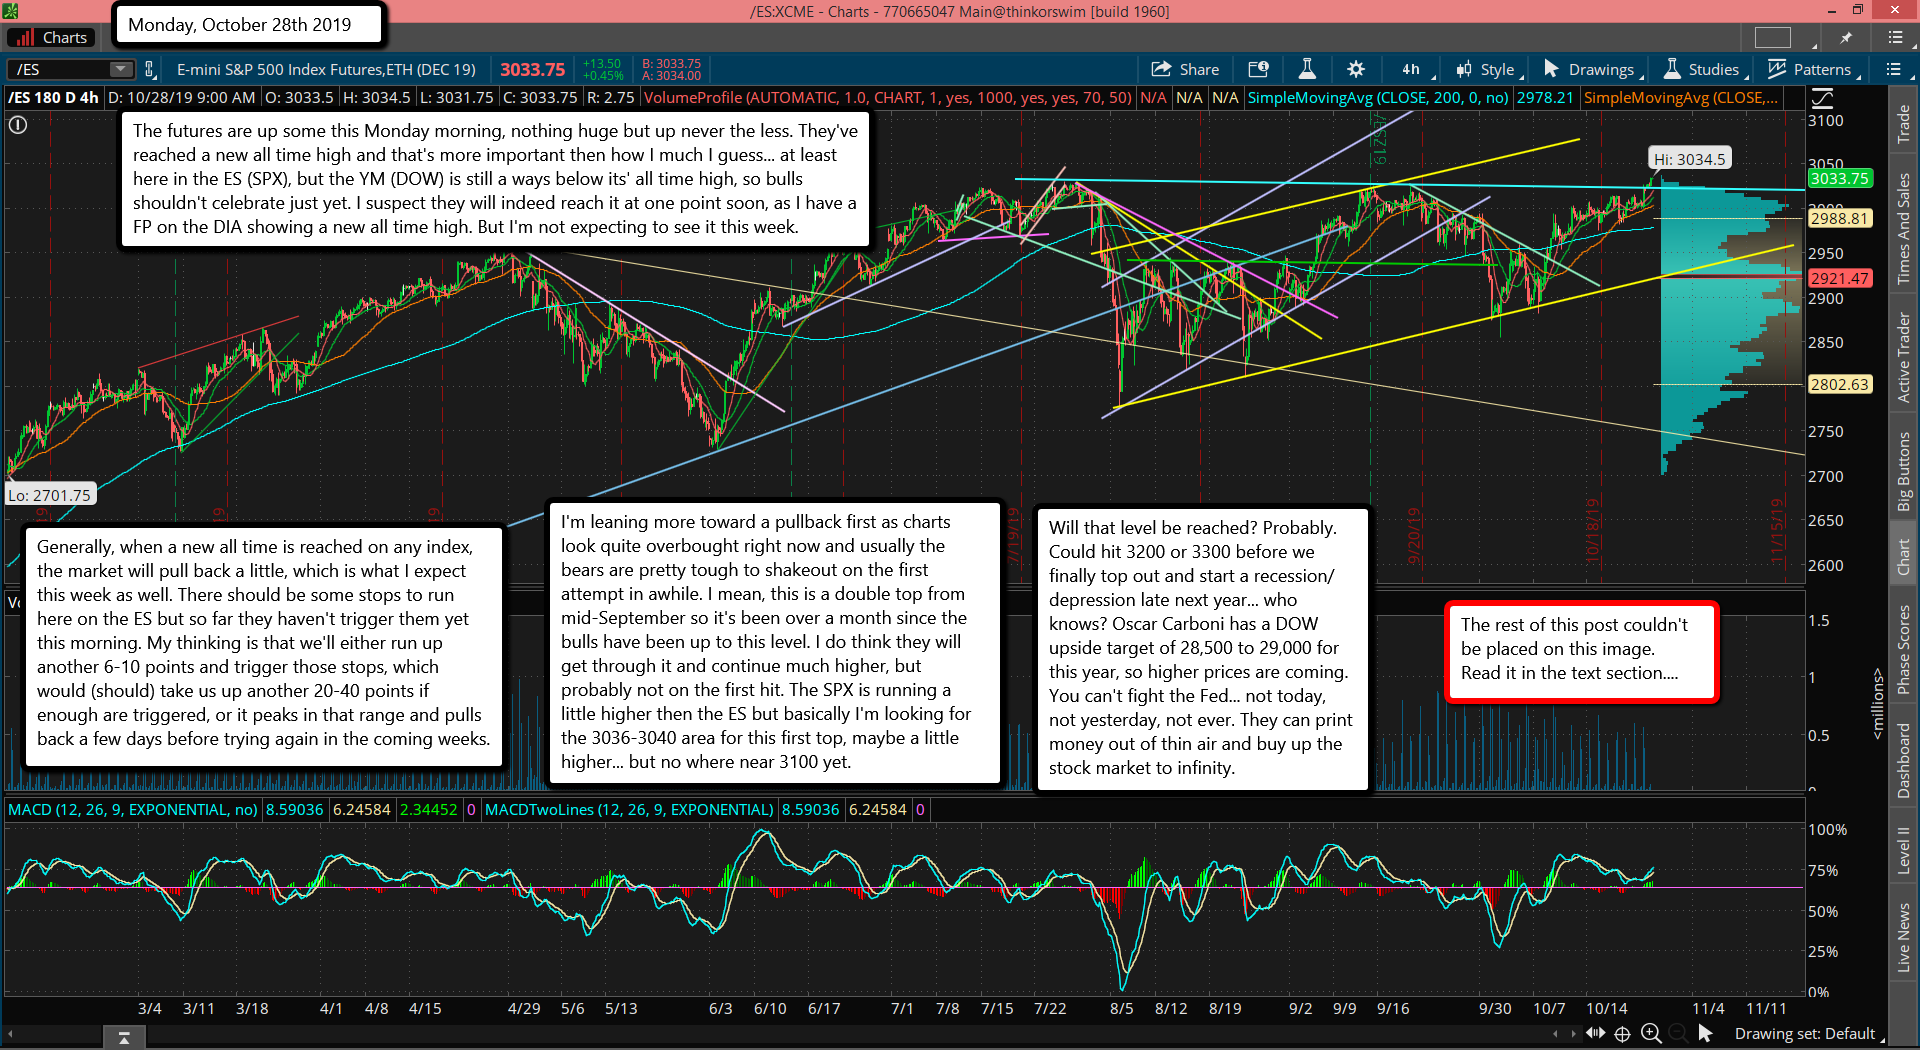
The futures are up some this Monday morning, nothing huge but up never the less. They've reached a new all time high and that's more important then how I much I guess... at least here in the ES (SPX), but the YM (DOW) is still a ways below its' all time high, so bulls shouldn't celebrate just yet. I suspect they will indeed reach it at one point soon, as I have a FP on the DIA showing a new all time high. But I'm not expecting to see it this week.
Generally, when a new all time is reached on any index, the market will pull back a little, which is what I expect this week as well. There should be some stops to run here on the ES but so far they haven't trigger them yet this morning. My thinking is that we'll either run up another 6-10 points and trigger those stops, which would (should) take us up another 20-40 points if enough are triggered, or it peaks in that range and pulls back a few days before trying again in the coming weeks.
I'm leaning more toward a pullback first as charts look quite overbought right now and usually the bears are pretty tough to shakeout on the first attempt in awhile. I mean, this is a double top from mid-September so it's been over a month since the bulls have been up to this level. I do think they will get through it and continue much higher, but probably not on the first hit. The SPX is running a little higher then the ES but basically I'm looking for the 3036-3040 area for this first top, maybe a little higher... but no where near 3100 yet.
Will that level be reached? Probably. Could hit 3200 or 3300 before we finally top out and start a recession/depression late next year... who knows? Oscar Carboni has a DOW upside target of 28,500 to 29,000 for this year, so higher prices are coming. You can't fight the Fed... not today, not yesterday, not ever. They can print money out of thin air and buy up the stock market to infinity.
But there are some reason to suggest that mathematically it can't continue too much longer as interest rates can't go much lower, as well as the danger of inverted yield curves that can't seem to be stopped. Michel Pento explains it very well in this video.
We'll cross that road when we get there I guess. For the short term I'm thinking we will see a top of some kind by midweek as there's an FOMC meeting this Wednesday and I wouldn't be surprised to see a pullback afterwards. I don't see it marking "the Top" for the market but pulling back to the 3000 area again (maybe a slight pierce to lure in shorts) wouldn't be out of the question.
Apple has earnings after the bell that day as well and when I look at the chart of it I have to notice how far it is away from its' 200 day moving average... not a good sign. Plus there's a gap on it at 230.44 from 10/10/19, so I would not be surprised if Apple sells off after their earnings along with the overall market. I don't normally track stocks by themselves but the timing of their earnings and the FOMC had me point it out for you. So if we do get a pullback late this week I don't think it's "the End" for the bulls, just a pullback that's all.
There are higher upside targets still out there so I'll be looking for more upside into November as well. Then probably another pullback, and the usually December "end of the year" rally. One last thing, it's also common to see the high put in on a Monday the week of any FOMC, where there's a small pullback on Tuesday (uncertainty) before the Wednesday FOMC, where it usually (I'd guess 80% of the time) closes green that day.
Therefore we might see the high today, then a small A wave down tomorrow, and back up for the B wave into the close on Wednesday. Then a C wave down (3000 SPX area... or a pierce?) on Thursday, which they can blame on Apple ("they" means the talking puppets on the financial news stations). That's my best guess for this week. Have a bless day.
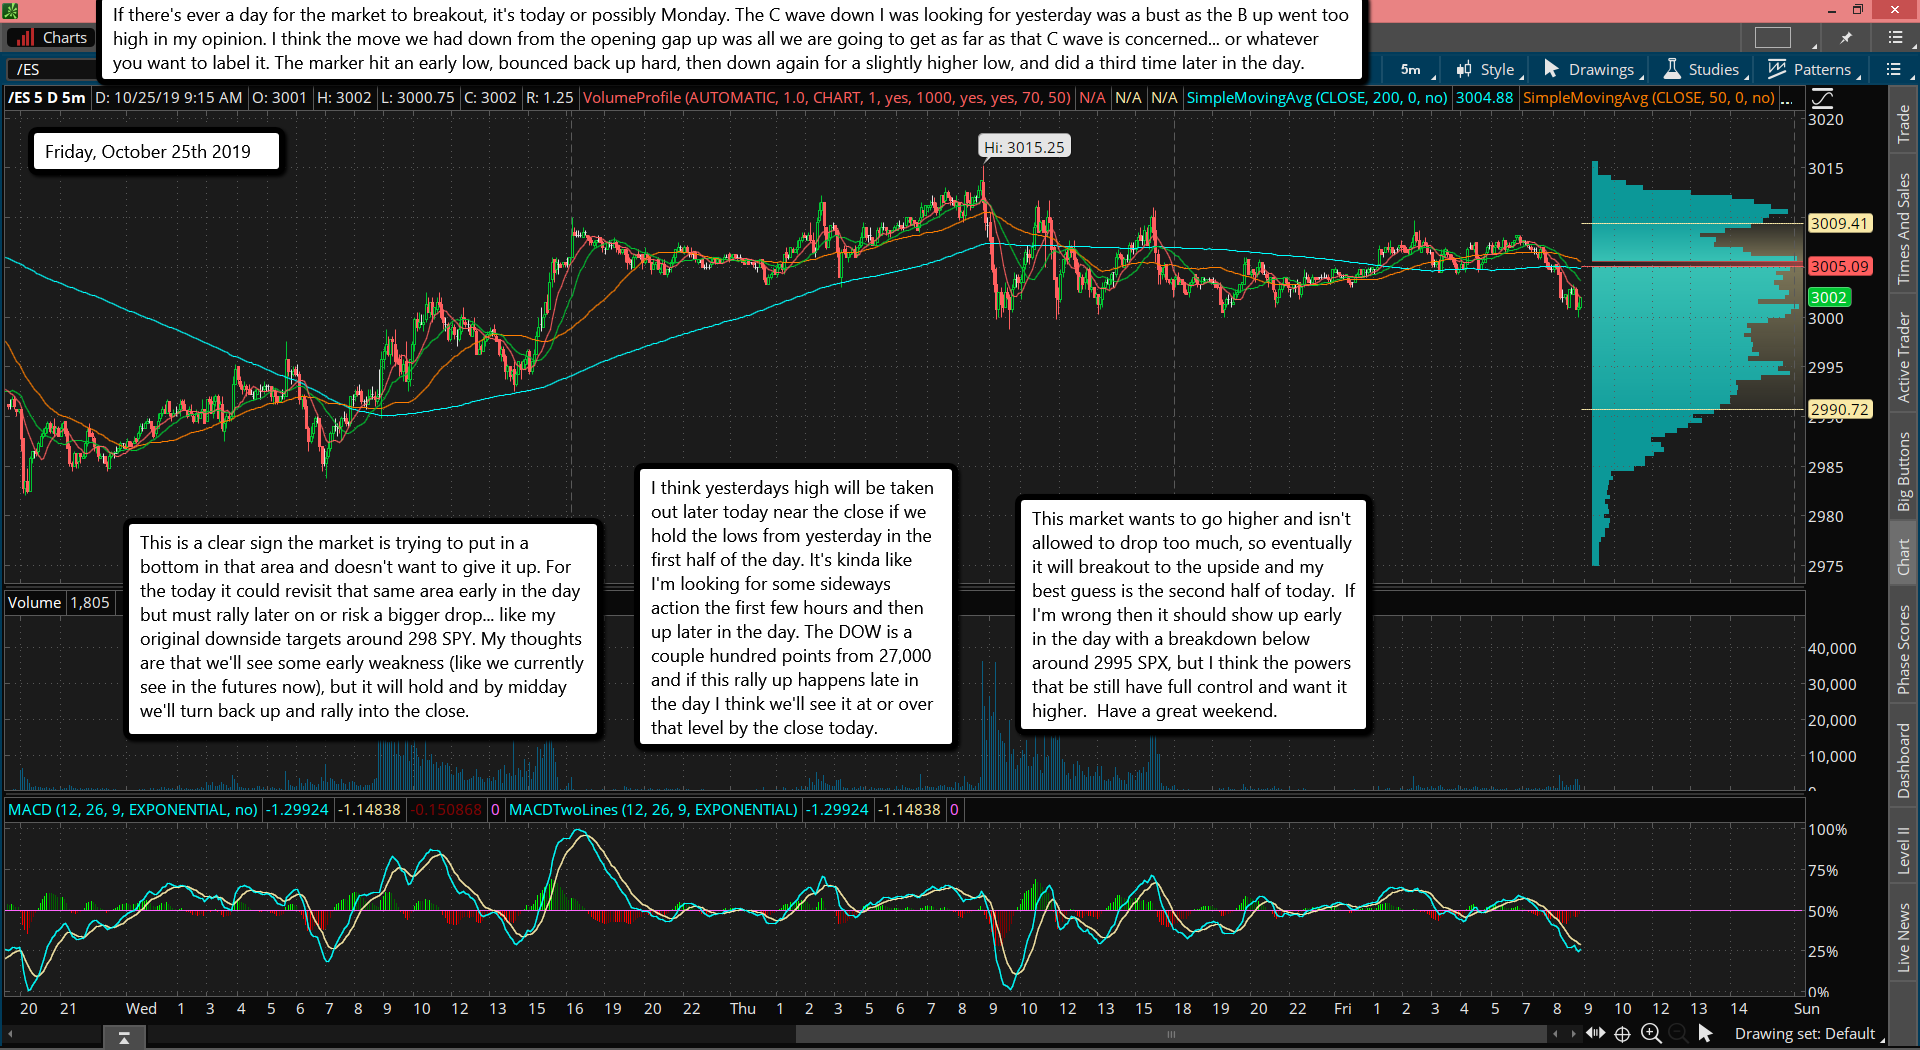
If there's ever a day for the market to breakout, it's today or possibly Monday. The C wave down I was looking for yesterday was a bust as the B up went too high in my opinion. I think the move we had down from the opening gap up was all we are going to get as far as that C wave is concerned... or whatever you want to label it. The marker hit an early low, bounced back up hard, then down again for a slightly higher low, and did a third time later in the day.
This is a clear sign the market is trying to put in a bottom in that area and doesn't want to give it up. For the today it could revisit that same area early in the day but must rally later on or risk a bigger drop... like my original downside targets around 298 SPY. My thoughts are that we'll see some early weakness (like we currently see in the futures now), but it will hold and by midday we'll turn back up and rally into the close.
I think yesterdays high will be taken out later today near the close if we hold the lows from yesterday in the first half of the day. It's kinda like I'm looking for some sideways action the first few hours and then up later in the day. The DOW is a couple hundred points from 27,000 and if this rally up happens late in the day I think we'll see it at or over that level by the close today.
This market wants to go higher and isn't allowed to drop too much, so eventually it will breakout to the upside and my best guess is the second half of today. If I'm wrong then it should show up early in the day with a breakdown below around 2995 SPX, but I think the powers that be still have full control and want it higher. Have a great weekend.
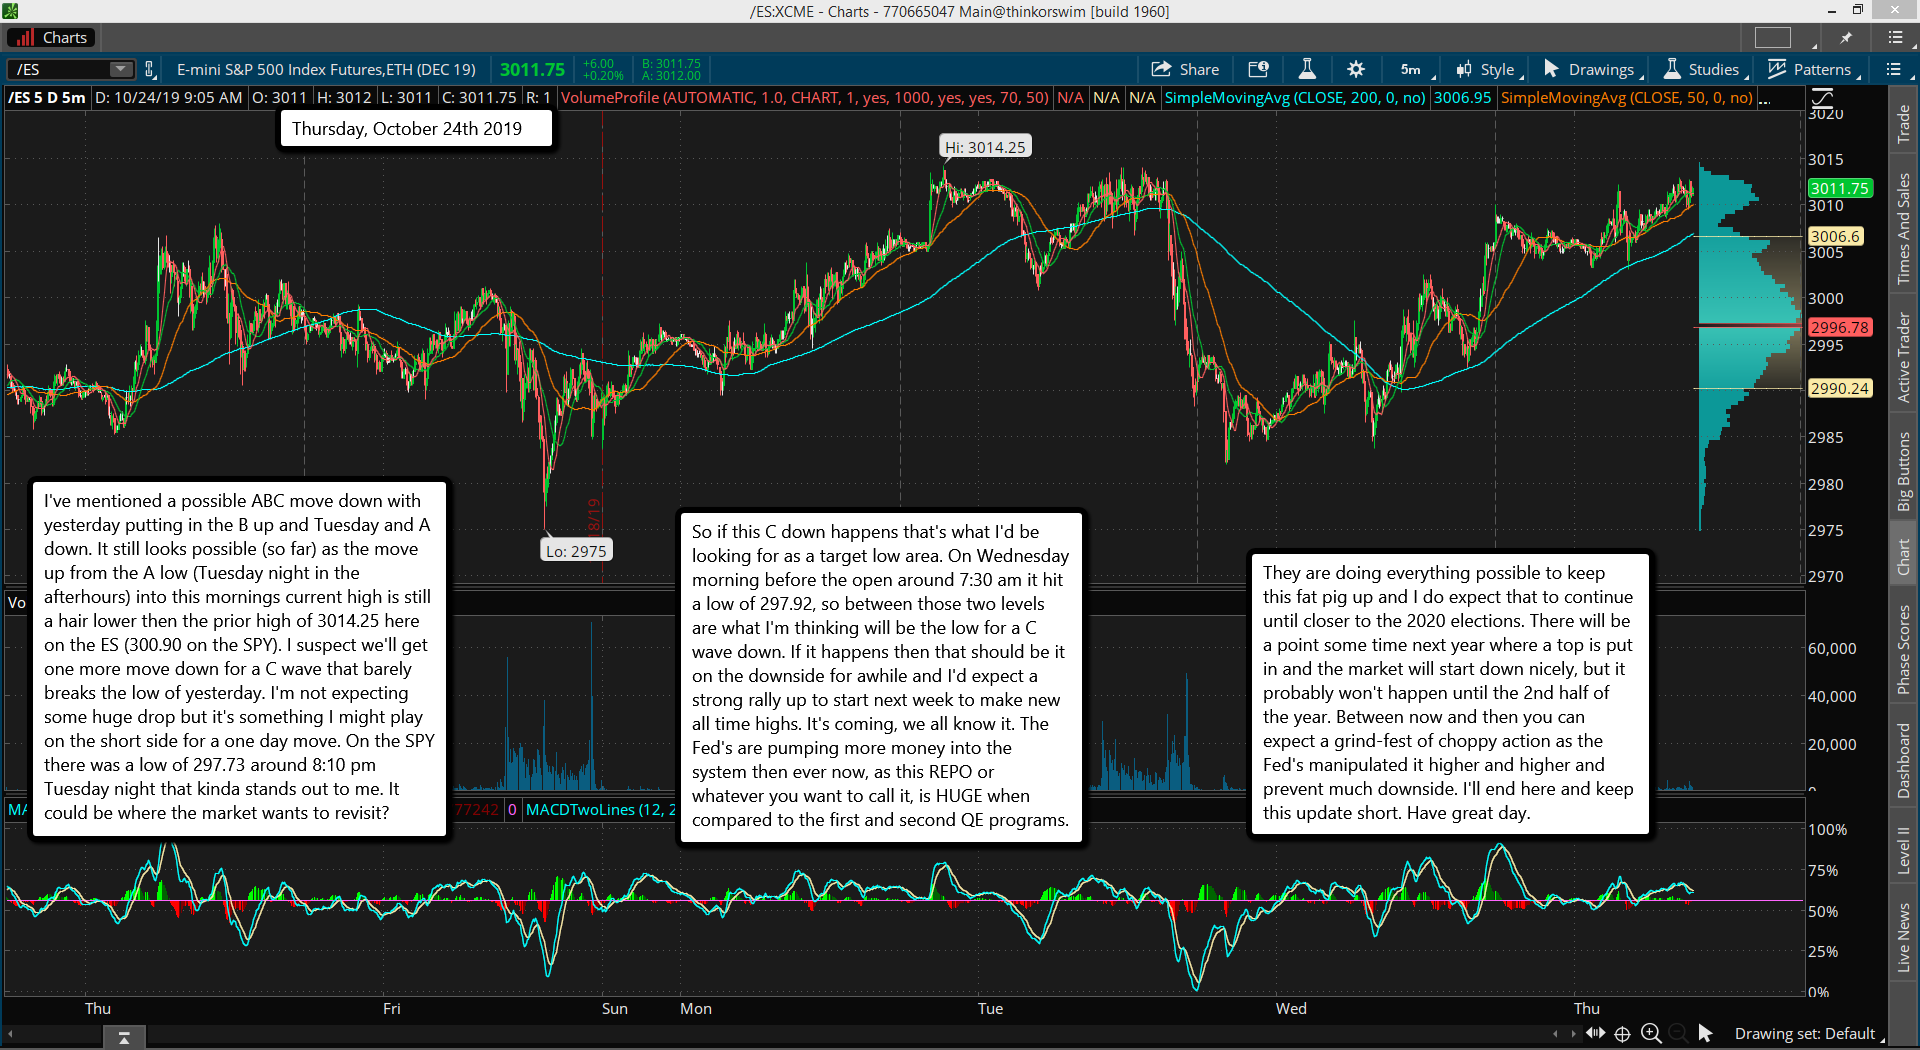
I've mentioned a possible ABC move down with yesterday putting in the B up and Tuesday and A down. It still looks possible (so far) as the move up from the A low (Tuesday night in the afterhours) into this mornings current high is still a hair lower then the prior high of 3014.25 here on the ES (300.90 on the SPY). I suspect we'll get one more move down for a C wave that barely breaks the low of yesterday. I'm not expecting some huge drop but it's something I might play on the short side for a one day move. On the SPY there was a low of 297.73 around 8:10 pm Tuesday night that kinda stands out to me. It could be where the market wants to revisit?
So if this C down happens that's what I'd be looking for as a target low area. On Wednesday morning before the open around 7:30 am it hit a low of 297.92, so between those two levels are what I'm thinking will be the low for a C wave down. If it happens then that should be it on the downside for awhile and I'd expect a strong rally up to start next week to make new all time highs. It's coming, we all know it. The Fed's are pumping more money into the system then ever now, as this REPO or whatever you want to call it, is HUGE when compared to the first and second QE programs.
They are doing everything possible to keep this fat pig up and I do expect that to continue until closer to the 2020 elections. There will be a point some time next year where a top is put in and the market will start down nicely, but it probably won't happen until the 2nd half of the year. Between now and then you can expect a grind-fest of choppy action as the Fed's manipulated it higher and higher and prevent much downside. I'll end here and keep this update short. Have great day.
Yesterday I said I really didn't have a clue on where the market was going that day, but I mentioned I might take a small short into today. The DOW went up into that 26,900's area, which I didn't want to see, but it never got up to 27,000 and it looked weak all day. So around midday I went short in a small position based on part gut and part weakness. I'll exit it today as it's only a one day play. But if the DOW can stay weak again today and close red then we might have the start of an ABC pattern down starting to form.
Elliottwave is very tough to use in forecasting but sometimes it will work on shorter time frames when combined with other methods. We know the charts are overbought and the market is up near a falling trendline of resistance, so those things added in with the equation and possibly we'll get this wave pattern to work out. So, if the DOW doesn't fall off a cliff, and doesn't rally too much, and close red, we'll probably have a nice A wave down.
We'd then need a B wave up for the next 2 days, where both Thursday and Friday close green. That could setup Monday to start a nice C wave down where I'd start looking for the 293.18 FP on the SPY as the target. That's probably just above the 26,000 level on the DOW. So there is some nice hope for the bears here but do remember that next week is the end of the month and it's usually a bullish period.
A move down would fool a look of traders, which could indeed be the scenario that SkyNet is planning to do? Let's not get ahead of ourselves though as we haven't even got the A wave down completed yet. But if it happens it will certainly be a very sweet short as I'd expect the B wave up to get back to at least 300 on the SPY, so a drop to 293.18 would be about 7 points there, 70 on the SPX and around 700 on the DOW. Good money can certainly be made there for sure.
However, we must not get fooled as if we instead drop more today and tomorrow then we can throw out the ABC pattern as it's more likely then a wave 2 or 4 down of some degree trying setup a nice move up, which could then start on Friday and last into most of next week. That's why EW isn't really good forecasting the future as there's are alternate wave counts. I prefer to just see what the market wants to give me and go bullish or bearish when it sets up. And from what I see we have a possible buy or sell in the making. That's all I have for now. Stay patient and God bless.
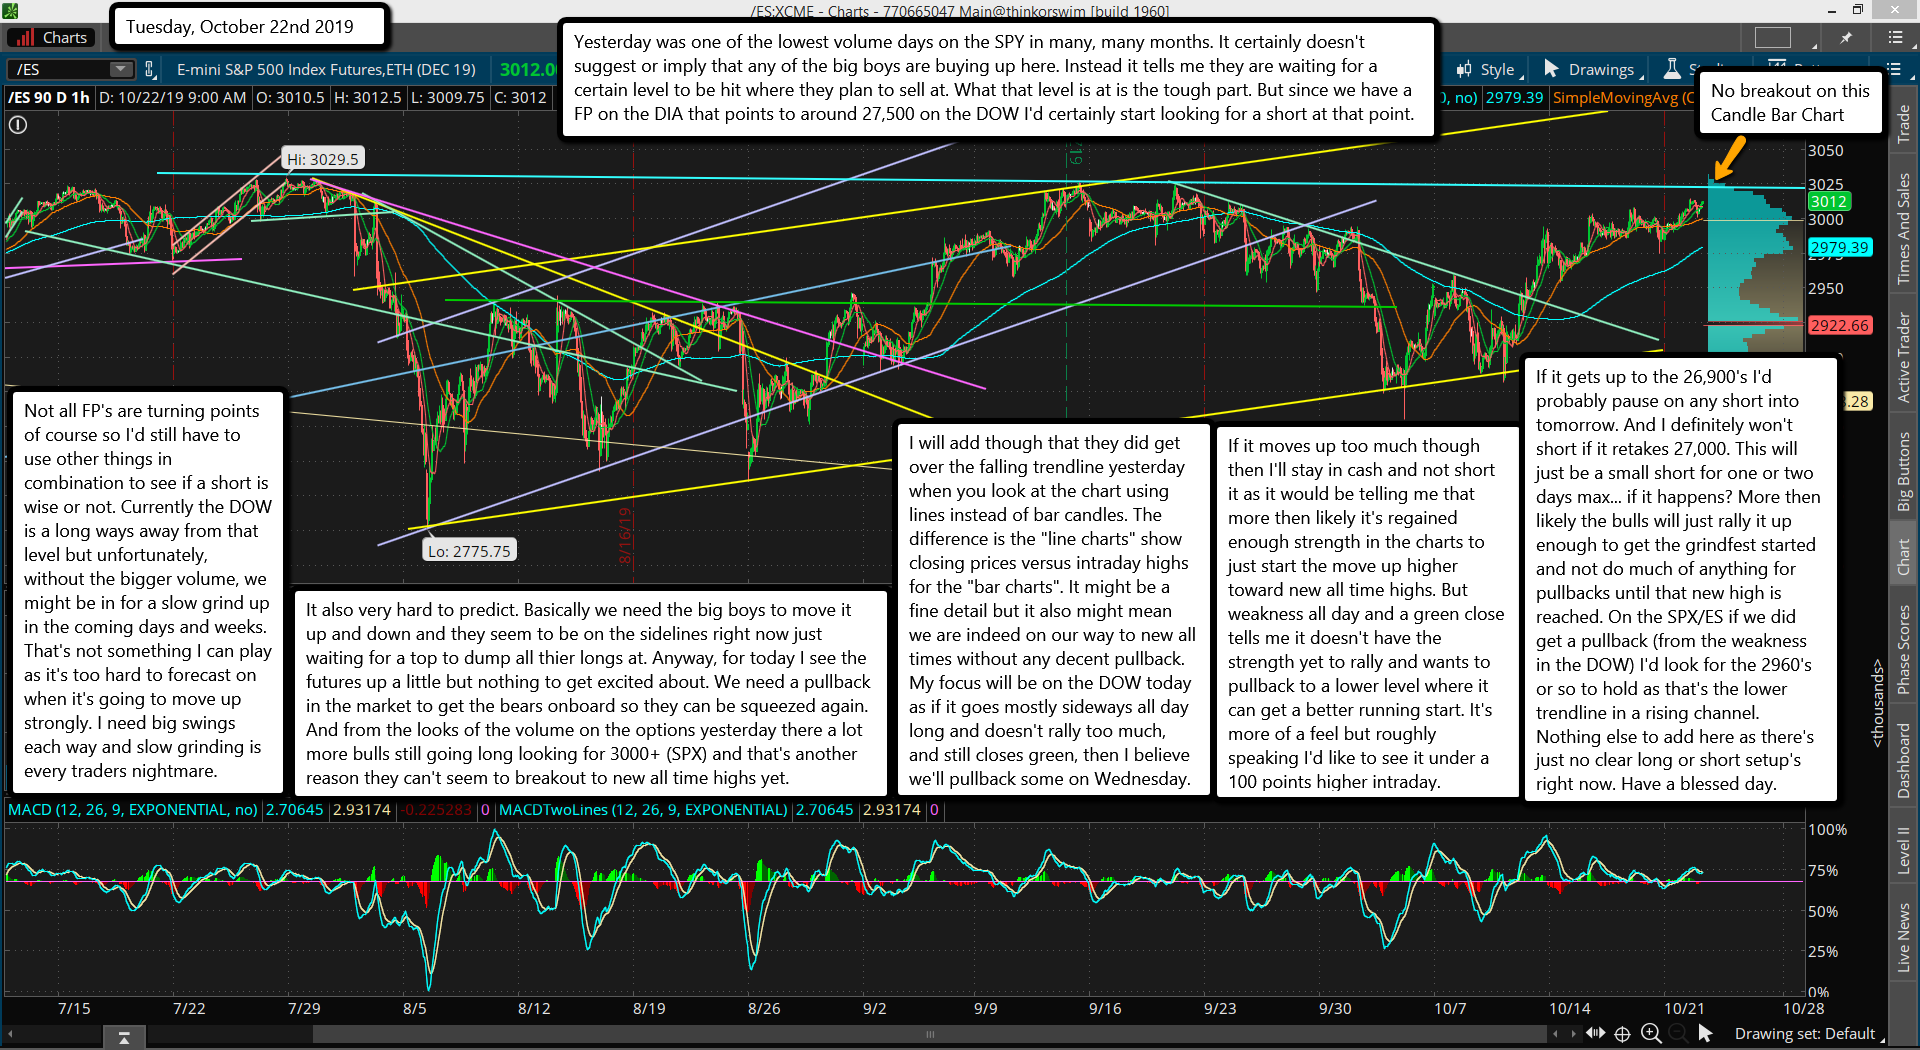
Yesterday was one of the lowest volume days on the SPY in many, many months. It certainly doesn't suggest or imply that any of the big boys are buying up here. Instead it tells me they are waiting for a certain level to be hit where they plan to sell at. What that level is at is the tough part. But since we have a FP on the DIA that points to around 27,500 on the DOW I'd certainly start looking for a short at that point.
Not all FP's are turning points of course so I'd still have to use other things in combination to see if a short is wise or not. Currently the DOW is a long ways away from that level but unfortunately, without the bigger volume, we might be in for a slow grind up in the coming days and weeks. That's not something I can play as it's too hard to forecast on when it's going to move up strongly. I need big swings each way and slow grinding is every traders nightmare.
It also very hard to predict. Basically we need the big boys to move it up and down and they seem to be on the sidelines right now just waiting for a top to dump all thier longs at. Anyway, for today I see the futures up a little but nothing to get excited about. We need a pullback in the market to get the bears onboard so they can be squeezed again. And from the looks of the volume on the options yesterday there a lot more bulls still going long looking for 3000+ (SPX) and that's another reason they can't seem to breakout to new all time highs yet.
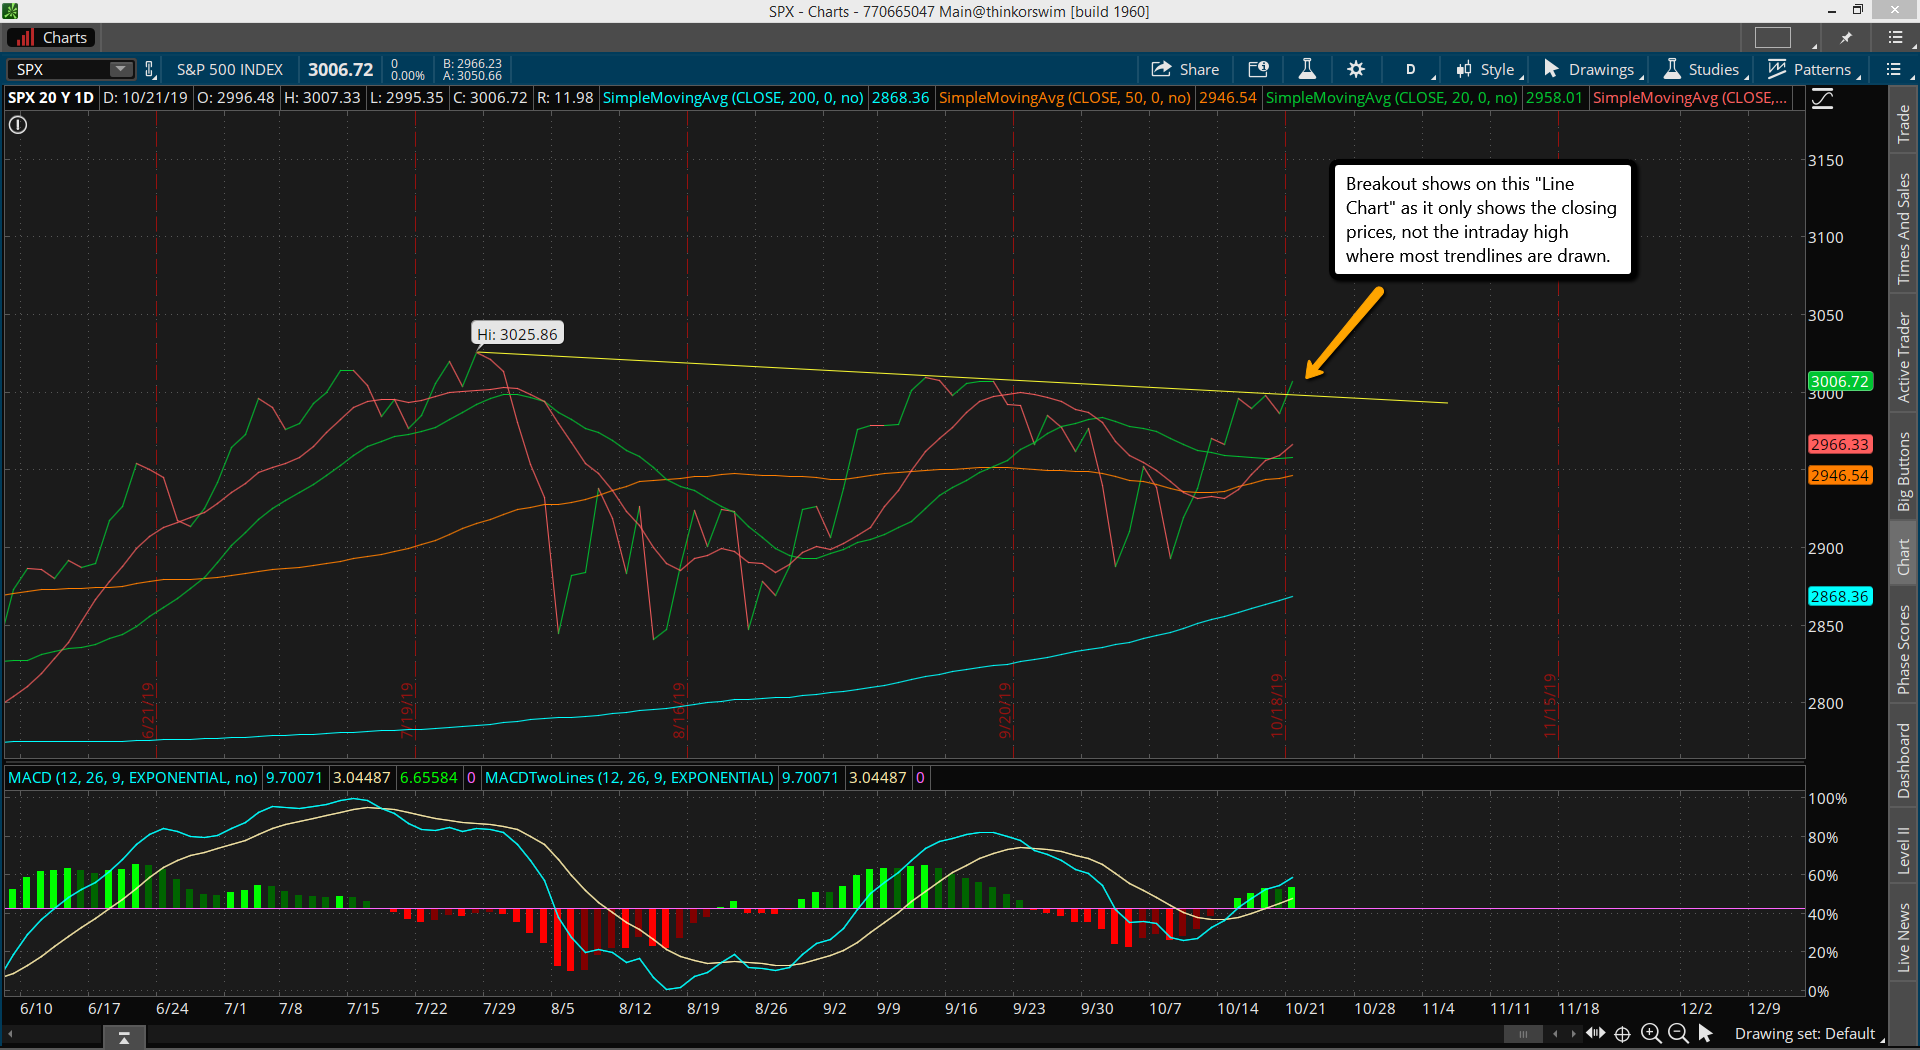
I will add though that they did get over the falling trendline yesterday when you look at the chart using lines instead of bar candles. The difference is the "line charts" show closing prices versus intraday highs for the "bar charts". It might be a fine detail but it also might mean we are indeed on our way to new all times without any decent pullback. My focus will be on the DOW today as if it goes mostly sideways all day long and doesn't rally too much, and still closes green, then I believe we'll pullback some on Wednesday.
If it moves up too much though then I'll stay in cash and not short it as it would be telling me that more then likely it's regained enough strength in the charts to just start the move up higher toward new all time highs. But weakness all day and a green close tells me it doesn't have the strength yet to rally and wants to pullback to a lower level where it can get a better running start. It's more of a feel but roughly speaking I'd like to see it under a 100 points higher intraday.
If it gets up to the 26,900's I'd probably pause on any short into tomorrow. And I definitely won't short if it retakes 27,000. This will just be a small short for one or two days max... if it happens? More then likely the bulls will just rally it up enough to get the grindfest started and not do much of anything for pullbacks until that new high is reached. On the SPX/ES if we did get a pullback (from the weakness in the DOW) I'd look for the 2960's or so to hold as that's the lower trendline in a rising channel. Nothing else to add here as there's just no clear long or short setup's right now. Have a blessed day.
Friday surprised me with the drop down to 297 on the SPY but most of it was reversed by the close. Then this morning we see the futures up so it's like the drop never happened as the market is back to around that 3000 zone again. If there's ever a good chance for the bulls to get through overhead resistance today would be it I believe. And it does look like they are trying in the futures as I write this update with them set to open with a gap. If they are smart they will keep going north and NOT drop back to fill the gap.
There was also a new FP on the DIA pointing to a new all time high, but of course we don't know the "when" part. But for today I'll just say I'm more bullish then bearish but I do not know if the bulls will be able to breakout or not? They could get a squeeze on if they do but right now charts are still mixed with some bullish, some bearish, some overbought, some oversold, etc... I'll just make this a short update and end it here. Have a great day.
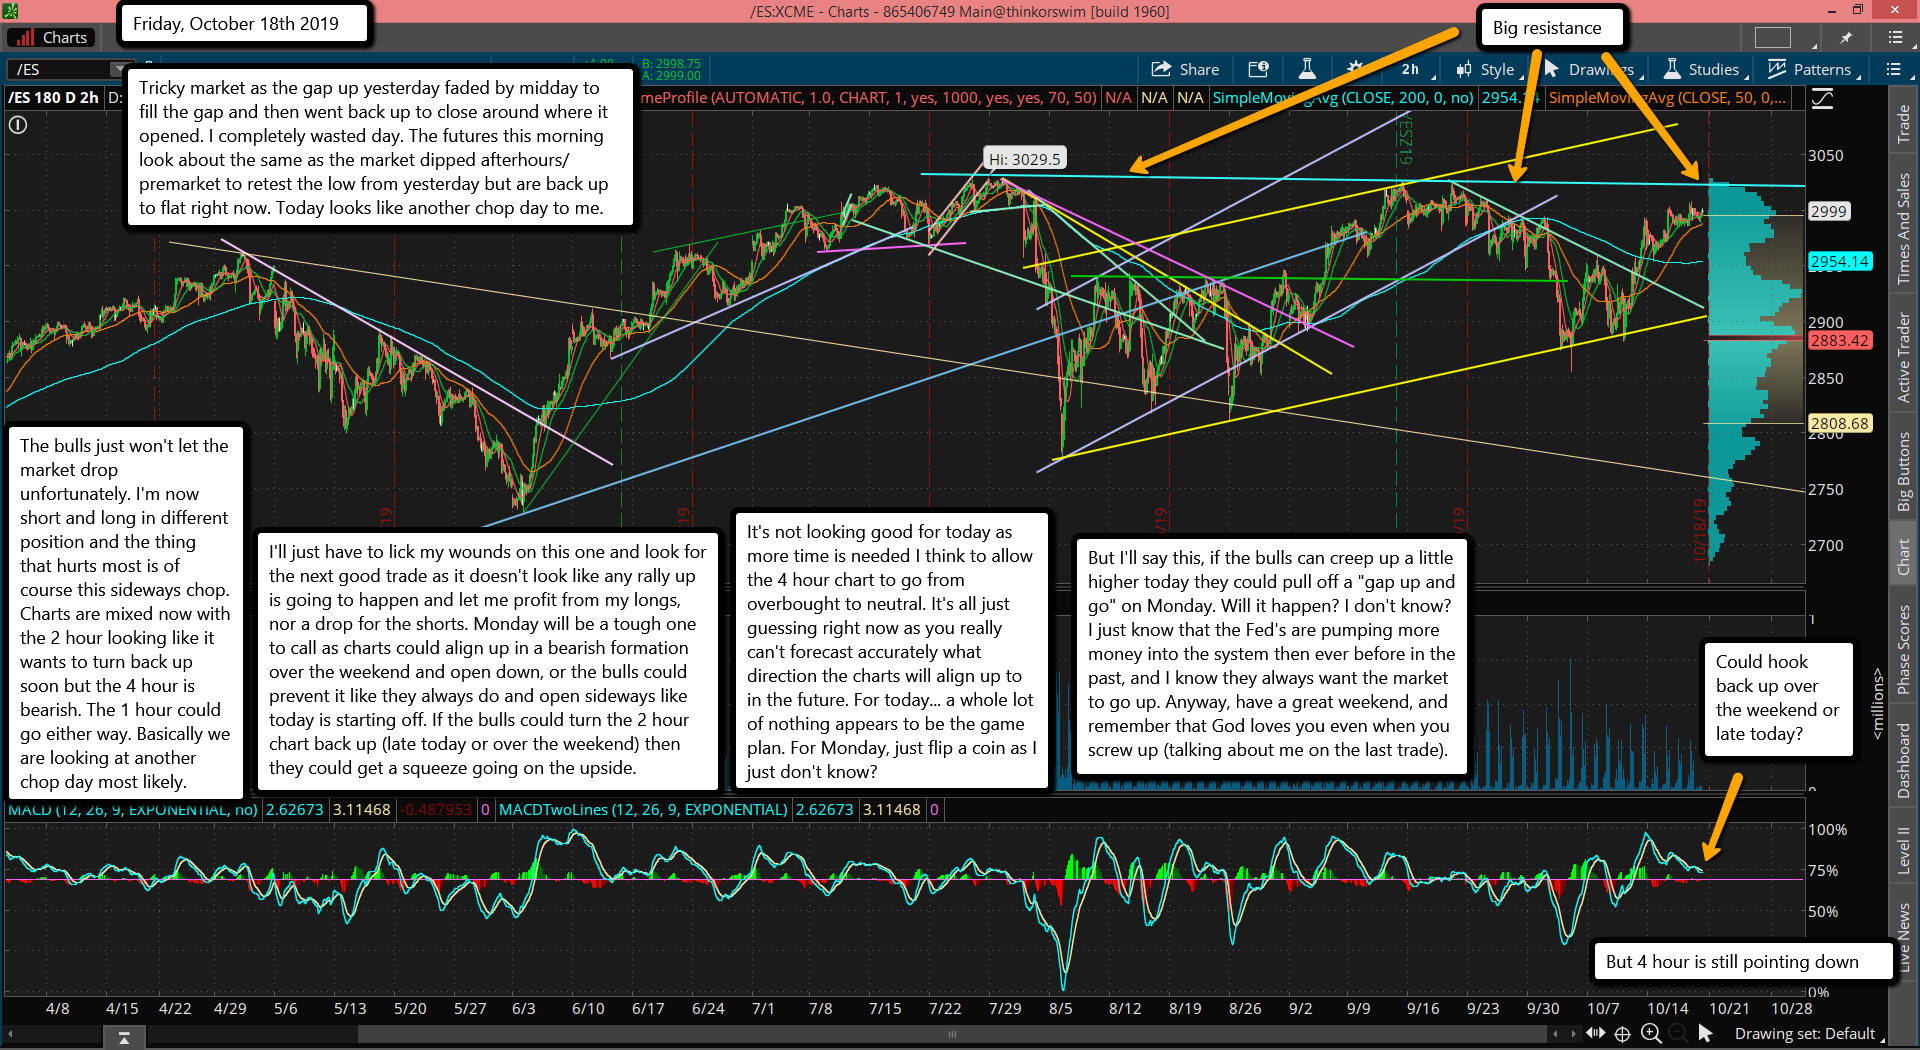
Tricky market as the gap up yesterday faded by midday to fill the gap and then went back up to close around where it opened. I completely wasted day. The futures this morning look about the same as the market dipped afterhours/premarket to retest the low from yesterday but are back up to flat right now. Today looks like another chop day to me.
The bulls just won't let the market drop unfortunately. I'm now short and long in different position and the thing that hurts most is of course this sideways chop. Charts are mixed now with the 2 hour looking like it wants to turn back up soon but the 4 hour is bearish. The 1 hour could go either way. Basically we are looking at another chop day most likely.
I'll just have to lick my wounds on this one and look for the next good trade as it doesn't look like any rally up is going to happen and let me profit from my longs, nor a drop for the shorts. Monday will be a tough one to call as charts could align up in a bearish formation over the weekend and open down, or the bulls could prevent it like they always do and open sideways like today is starting off. If the bulls could turn the 2 hour chart back up (late today or over the weekend) then they could get a squeeze going on the upside.
It's not looking good for today as more time is needed I think to allow the 4 hour chart to go from overbought to neutral. It's all just guessing right now as you really can't forecast accurately what direction the charts will align up to in the future. For today... a whole lot of nothing appears to be the game plan. For Monday, just flip a coin as I just don't know?
But I'll say this, if the bulls can creep up a little higher today they could pull off a "gap up and go" on Monday. Will it happen? I don't know? I just know that the Fed's are pumping more money into the system then ever before in the past, and I know they always want the market to go up. Anyway, have a great weekend, and remember that God loves you even when you screw up (talking about me on the last trade).
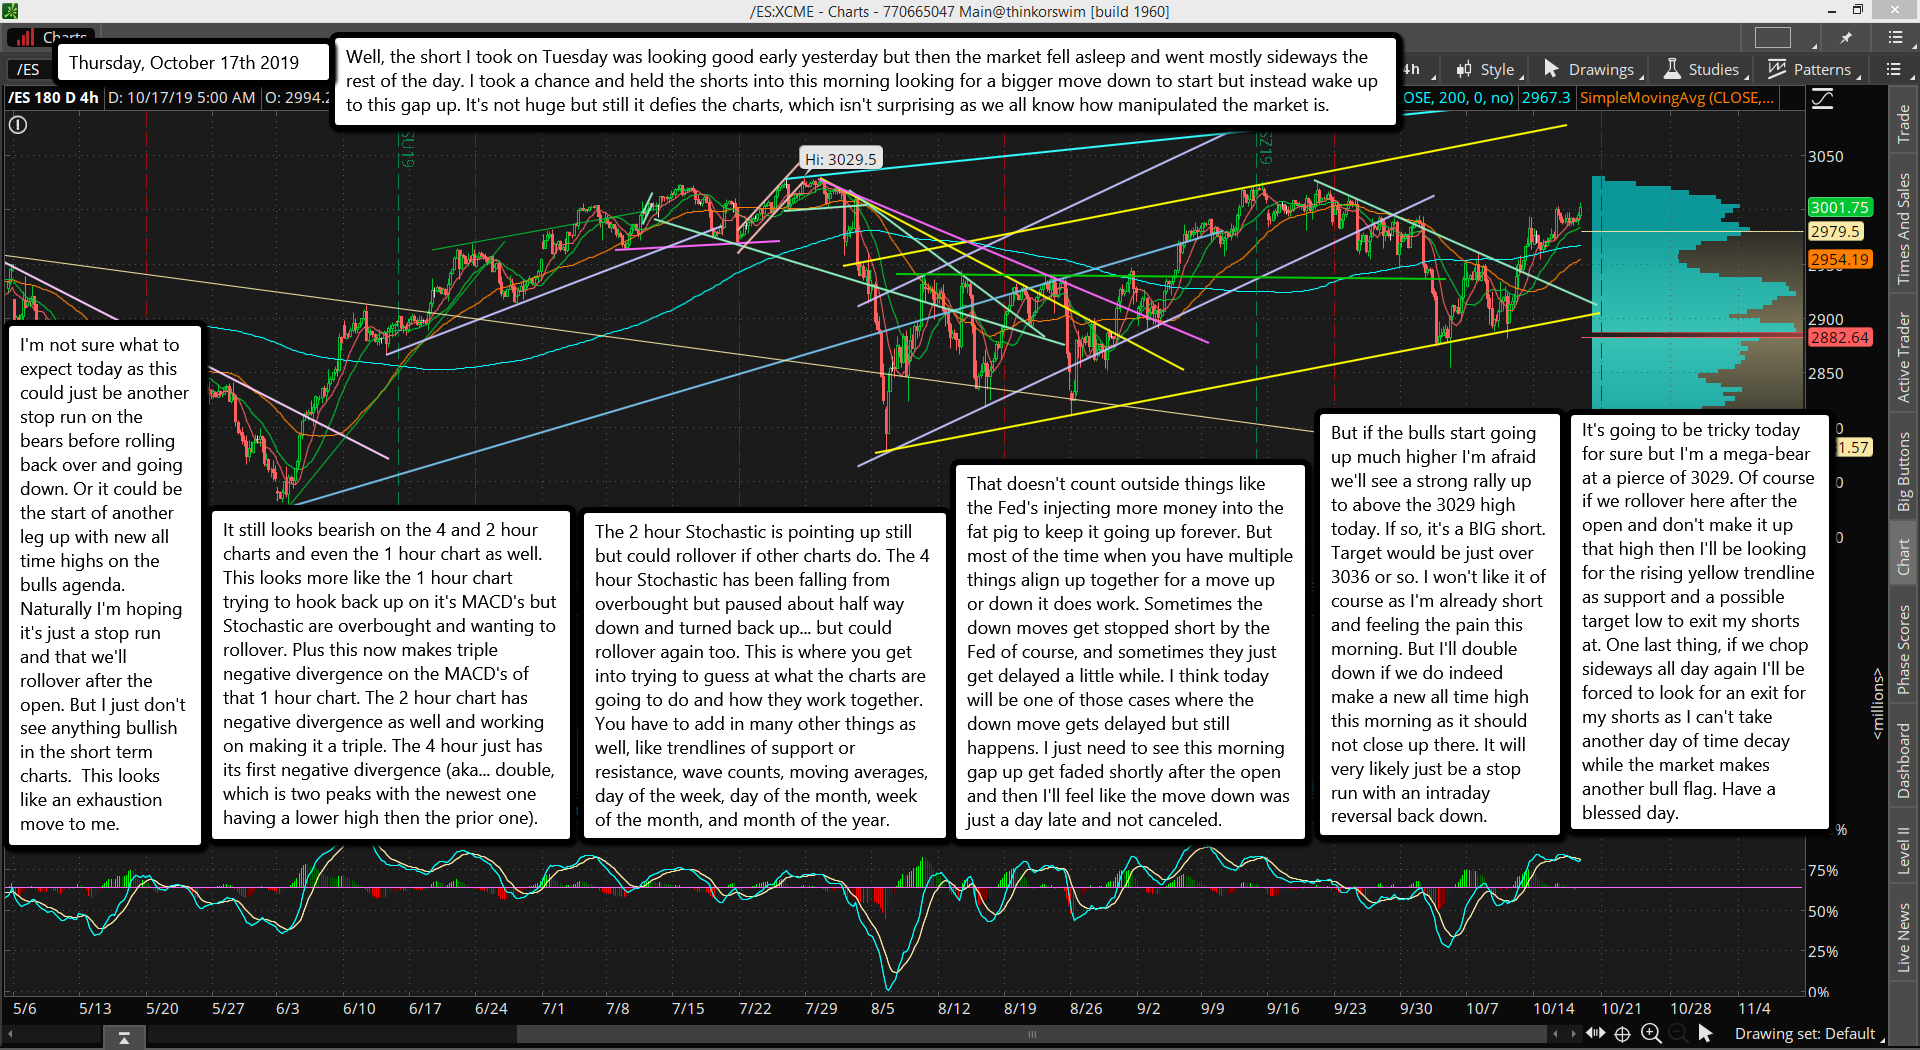
Well, the short I took on Tuesday was looking good early yesterday but then the market fell asleep and went mostly sideways the rest of the day. I took a chance and held the shorts into this morning looking for a bigger move down to start but instead wake up to this gap up. It's not huge but still it defies the charts, which isn't surprising as we all know how manipulated the market is.
I'm not sure what to expect today as this could just be another stop run on the bears before rolling back over and going down. Or it could be the start of another leg up with new all time highs on the bulls agenda. Naturally I'm hoping it's just a stop run and that we'll rollover after the open. But I just don't see anything bullish in the short term charts. This looks like an exhaustion move to me.
It still looks bearish on the 4 and 2 hour charts and even the 1 hour chart as well. This looks more like the 1 hour chart trying to hook back up on it's MACD's but Stochastic are overbought and wanting to rollover. Plus this now makes triple negative divergence on the MACD's of that 1 hour chart. The 2 hour chart has negative divergence as well and working on making it a triple. The 4 hour just has its first negative divergence (aka... double, which is two peaks with the newest one having a lower high then the prior one).
The 2 hour Stochastic is pointing up still but could rollover if other charts do. The 4 hour Stochastic has been falling from overbought but paused about half way down and turned back up... but could rollover again too. This is where you get into trying to guess at what the charts are going to do and how they work together. You have to add in many other things as well, like trendlines of support or resistance, wave counts, moving averages, day of the week, day of the month, week of the month, and month of the year.
That doesn't count outside things like the Fed's injecting more money into the fat pig to keep it going up forever. But most of the time when you have multiple things align up together for a move up or down it does work. Sometimes the down moves get stopped short by the Fed of course, and sometimes they just get delayed a little while. I think today will be one of those cases where the down move gets delayed but still happens. I just need to see this morning gap up get faded shortly after the open and then I'll feel like the move down was just a day late and not canceled.
But if the bulls start going up much higher I'm afraid we'll see a strong rally up to above the 3029 high today. If so, it's a BIG short. Target would be just over 3036 or so. I won't like it of course as I'm already short and feeling the pain this morning. But I'll double down if we do indeed make a new all time high this morning as it should not close up there. It will very likely just be a stop run with an intraday reversal back down.
It's going to be tricky today for sure but I'm a mega-bear at a pierce of 3029. Of course if we rollover here after the open and don't make it up that high then I'll be looking for the rising yellow trendline as support and a possible target low to exit my shorts at. One last thing, if we chop sideways all day again I'll be forced to look for an exit for my shorts as I can't take another day of time decay while the market makes another bull flag. Have a blessed day.
Yesterday near the close I decided to take a short position. A lot of factors went into it, like the 5 wave up move from the 2888 low on 10/8 looked completed. There was negative divergence on many charts. The SPY came within pennies of hitting 300 while the SPX/ES pierced it a little.
The VIX expiring on the options part yesterday at the close and the futures part this morning at 9am EST, which I previously thought they both expired today but I did further research to nail down the exact time. That means at the open this morning the new November contract on the VIX will start and the market makers aren't under any pressure to push it down so they can keep all the money from naked calls they sold previously.
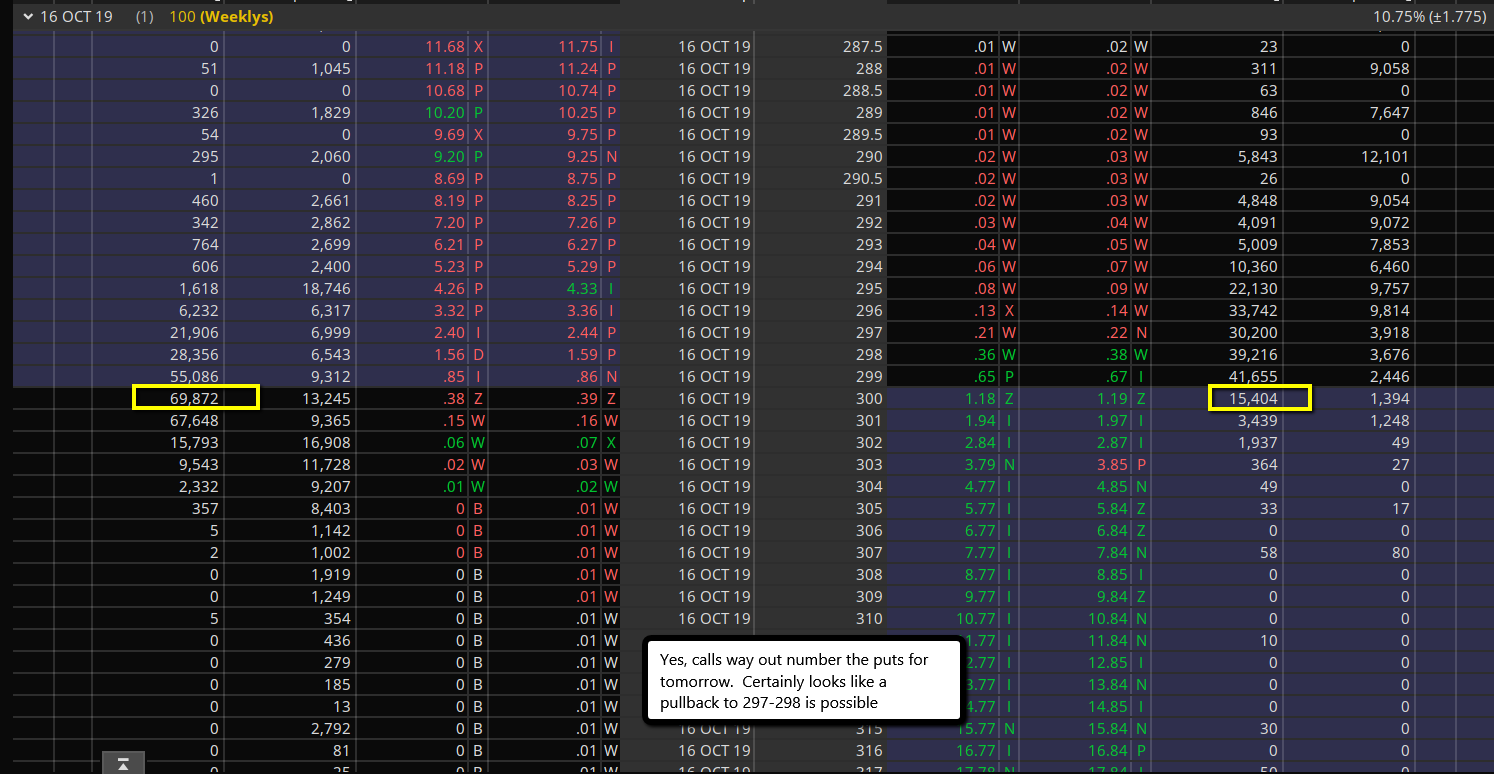
In fact it's to their benefit to drop the market today so the VIX can rally up and they can repeat the process again. Also there's a possible FP on the SPY from Fridays close at 293.18, which is another reason to short. There's way too many calls at the 300 strike price for todays expiration, so it looks like a move down to 297-298 range would be a better spot to close it at today as that's where the puts and calls get closer to equal.
Of course that doesn't mean we can't drop lower intraday as we could go all the way down to that FP on the SPY and then rally back up into the close to pin it in that 297-298 zone. I'm not saying that's going to happen of course, but it's possible. A more common move would be a slow drift down into that zone for a tiny A wave, then a tiny B up early tomorrow and back down to the FP for the tiny C down.
After that I'd expect a rally back up on Friday again, but I doubt if we make it to 3000 again... at least not on Friday. Next week though is another story as I do believe we'll see a new all time high soon, and then we could have a nice correction down (hopefully... LOL). For today though I'm short and will be rooting for the 293.18 FP to get hit where I'll exit shorts and probably go long. But again, more then likely we'll just chop around and pin the SPY in that 297-298 zone. My God bless you in your day to day life and especially in trading. He's done that for me, and all I had to do was ask him for help. Happy Hump Day!
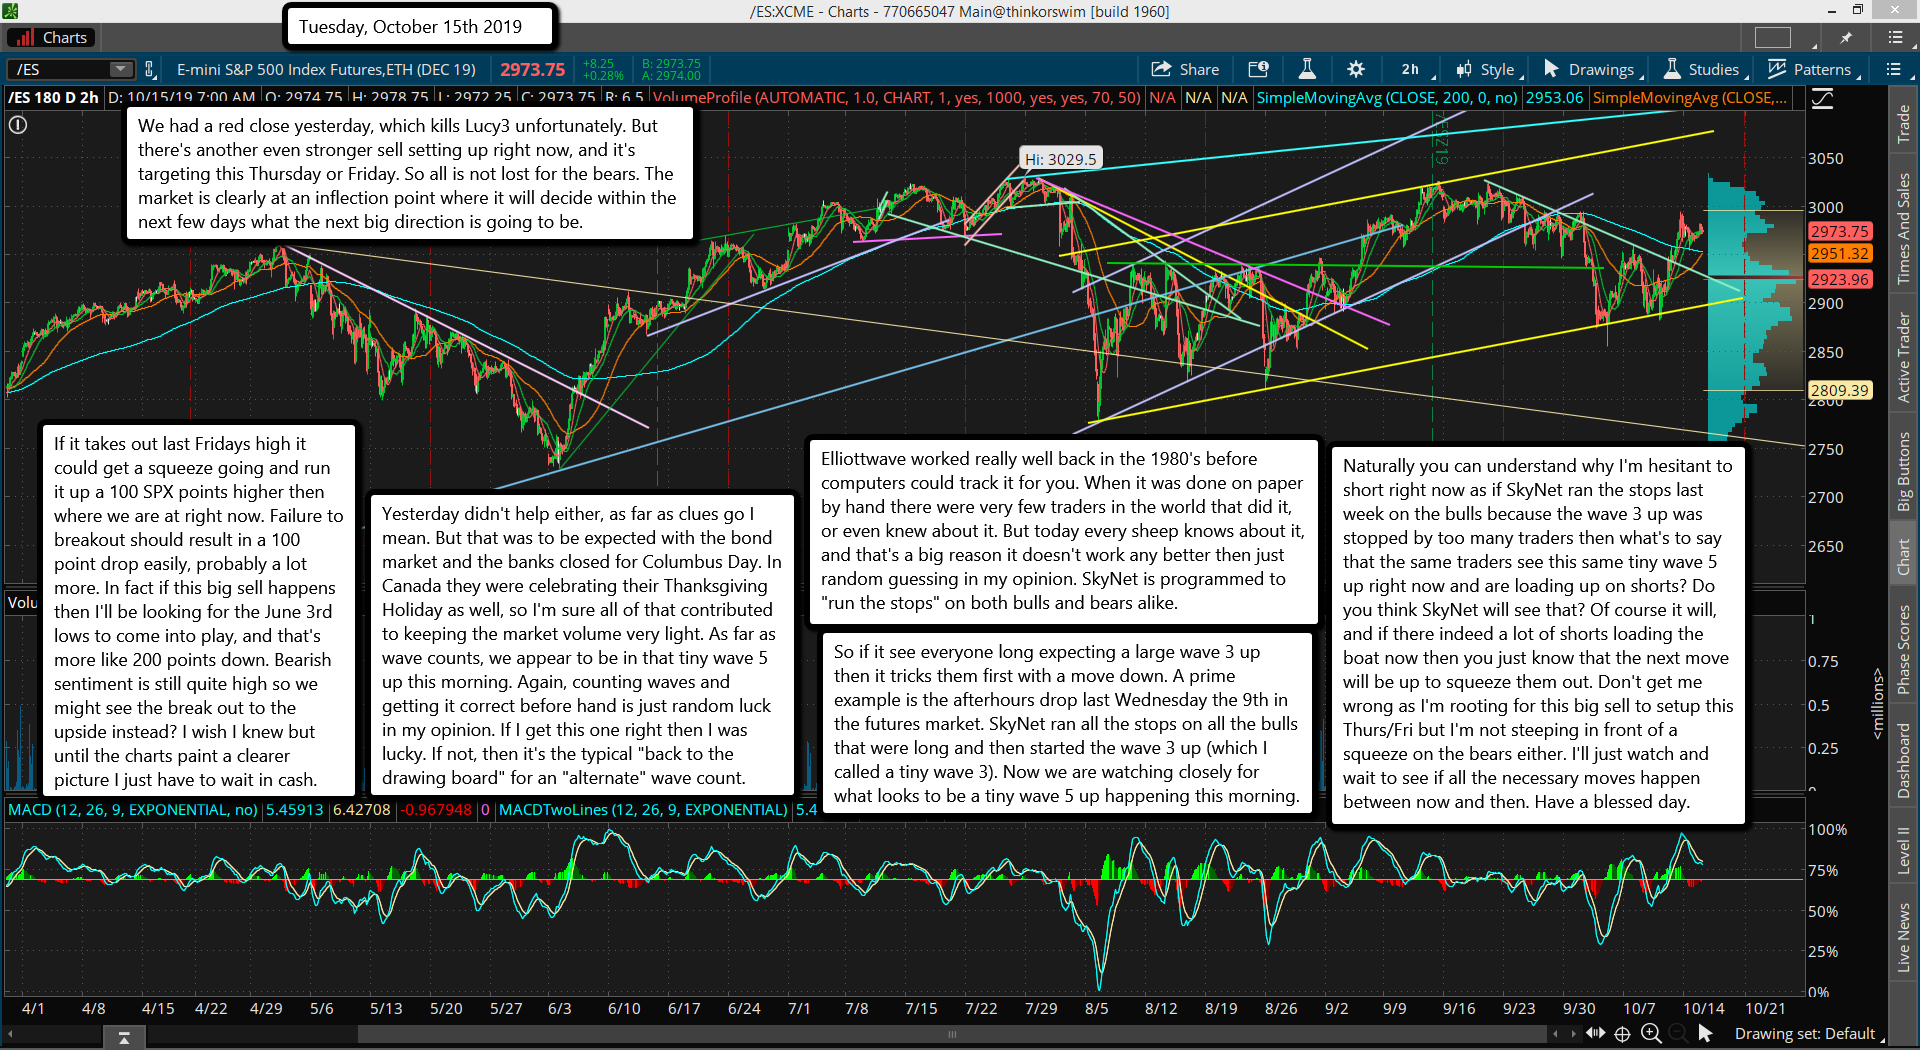
We had a red close yesterday, which kills Lucy3 unfortunately. But there's another even stronger sell setting up right now, and it's targeting this Thursday or Friday. So all is not lost for the bears. The market is clearly at an inflection point where it will decide within the next few days what the next big direction is going to be.
If it takes out last Fridays high it could get a squeeze going and run it up a 100 SPX points higher then where we are at right now. Failure to breakout should result in a 100 point drop easily, probably a lot more. In fact if this big sell happens then I'll be looking for the June 3rd lows to come into play, and that's more like 200 points down. Bearish sentiment is still quite high so we might see the break out to the upside instead? I wish I knew but until the charts paint a clearer picture I just have to wait in cash.
Yesterday didn't help either, as far as clues go I mean. But that was to be expected with the bond market and the banks closed for Columbus Day. In Canada they were celebrating their Thanksgiving Holiday as well, so I'm sure all of that contributed to keeping the market volume very light. As far as wave counts, we appear to be in that tiny wave 5 up this morning. Again, counting waves and getting it correct before hand is just random luck in my opinion. If I get this one right then I was lucky. If not, then it's the typical "back to the drawing board" for an "alternate" wave count.
Elliottwave worked really well back in the 1980's before computers could track it for you. When it was done on paper by hand there were very few traders in the world that did it, or even knew about it. But today every sheep knows about it, and that's a big reason it doesn't work any better then just random guessing in my opinion. SkyNet is programmed to "run the stops" on both bulls and bears alike.
So if it see everyone long expecting a large wave 3 up then it tricks them first with a move down. A prime example is the afterhours drop last Wednesday the 9th in the futures market. SkyNet ran all the stops on all the bulls that were long and then started the wave 3 up (which I called a tiny wave 3). Now we are watching closely for what looks to be a tiny wave 5 up happening this morning.
Naturally you can understand why I'm hesitant to short right now as if SkyNet ran the stops last week on the bulls because the wave 3 up was stopped by too many traders then what's to say that the same traders see this same tiny wave 5 up right now and are loading up on shorts? Do you think SkyNet will see that? Of course it will, and if there indeed a lot of shorts loading the boat now then you just know that the next move will be up to squeeze them out. Don't get me wrong as I'm rooting for this big sell to setup this Thurs/Fri but I'm not steeping in front of a squeeze on the bears either. I'll just watch and wait to see if all the necessary moves happen between now and then. Have a blessed day.
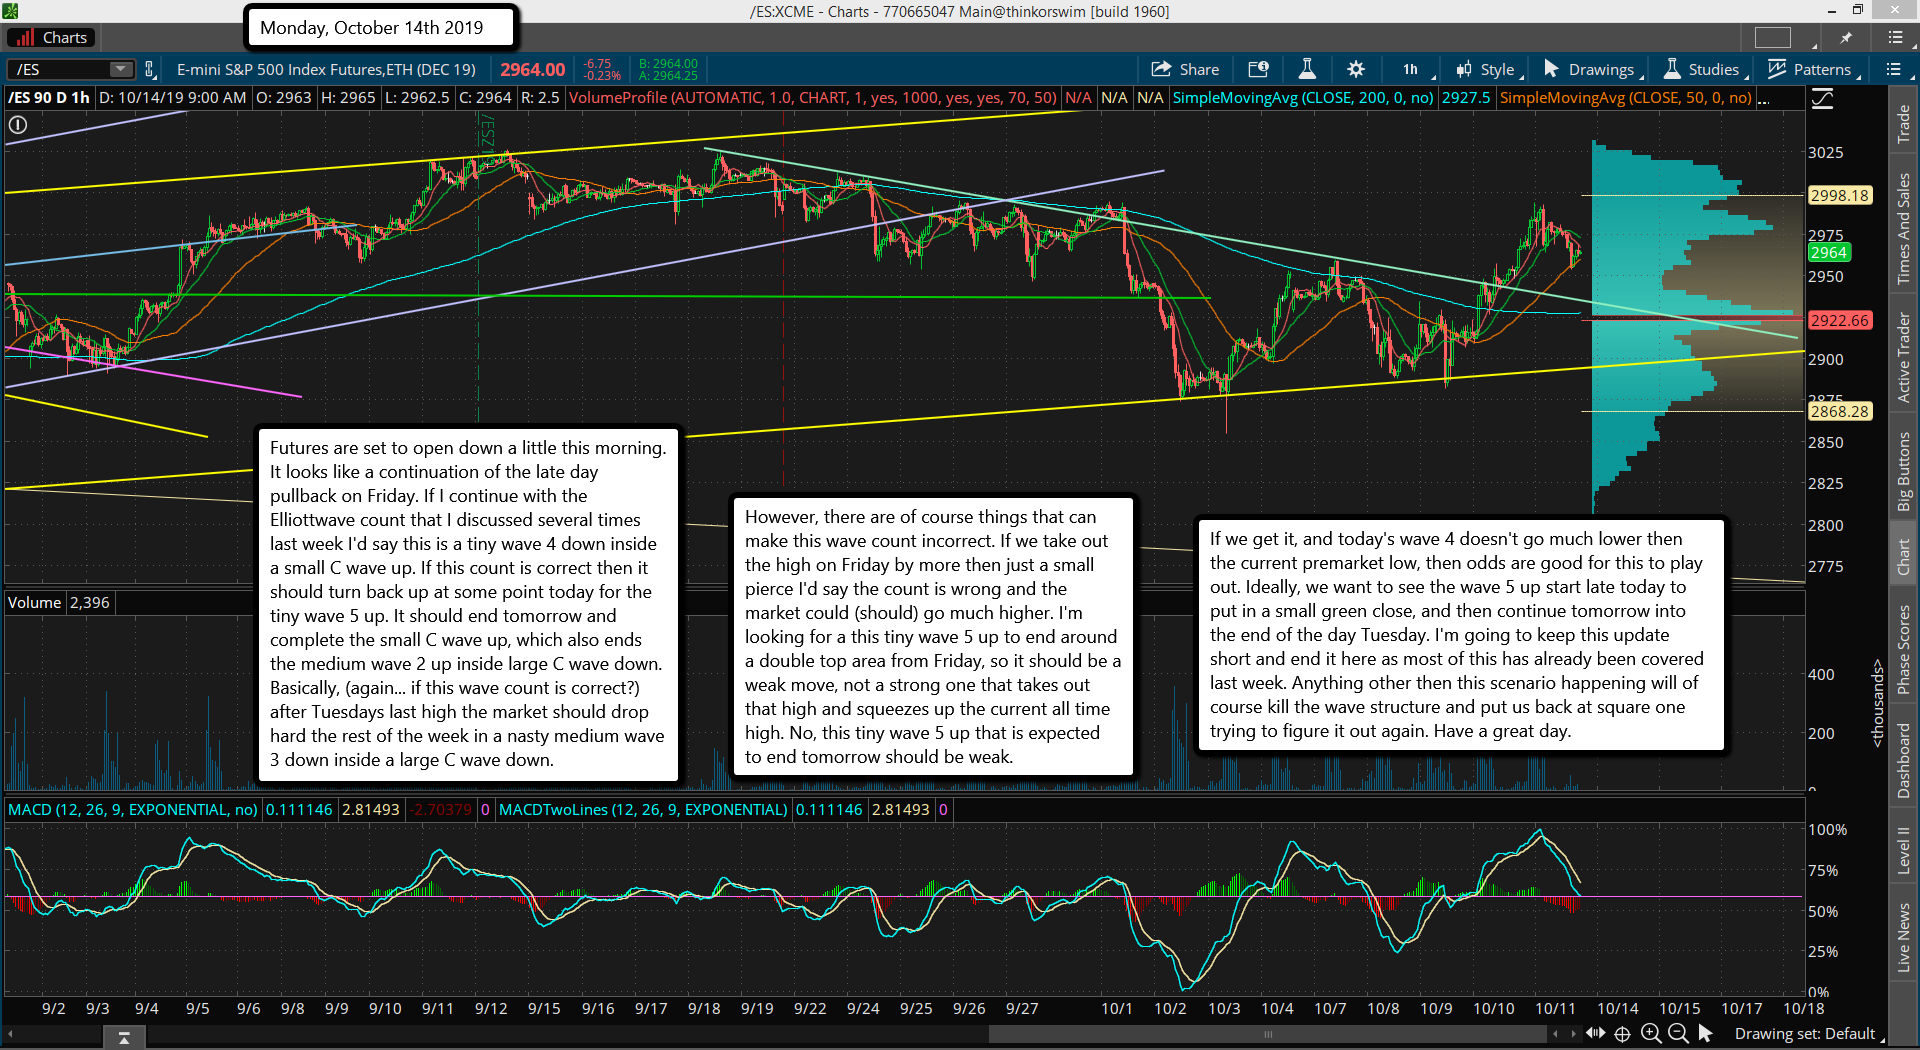
Futures are set to open down a little this morning. It looks like a continuation of the late day pullback on Friday. If I continue with the Elliottwave count that I discussed several times last week I'd say this is a tiny wave 4 down inside a small C wave up. If this count is correct then it should turn back up at some point today for the tiny wave 5 up. It should end tomorrow and complete the small C wave up, which also ends the medium wave 2 up inside large C wave down. Basically, (again... if this wave count is correct?) after Tuesdays last high the market should drop hard the rest of the week in a nasty medium wave 3 down inside a large C wave down.
However, there are of course things that can make this wave count incorrect. If we take out the high on Friday by more then just a small pierce I'd say the count is wrong and the market could (should) go much higher. I'm looking for a this tiny wave 5 up to end around a double top area from Friday, so it should be a weak move, not a strong one that takes out that high and squeezes up the current all time high. No, this tiny wave 5 up that is expected to end tomorrow should be weak.
If we get it, and today's wave 4 doesn't go much lower then the current premarket low, then odds are good for this to play out. Ideally, we want to see the wave 5 up start late today to put in a small green close, and then continue tomorrow into the end of the day Tuesday. I'm going to keep this update short and end it here as most of this has already been covered last week. Anything other then this scenario happening will of course kill the wave structure and put us back at square one trying to figure it out again. Have a great day.







 Sci-fi movie ‘Dark Storm’ (2006)