Monday, August 24, 2026
Home Blog Page 54

ES Morning Update December 5th 2017

0

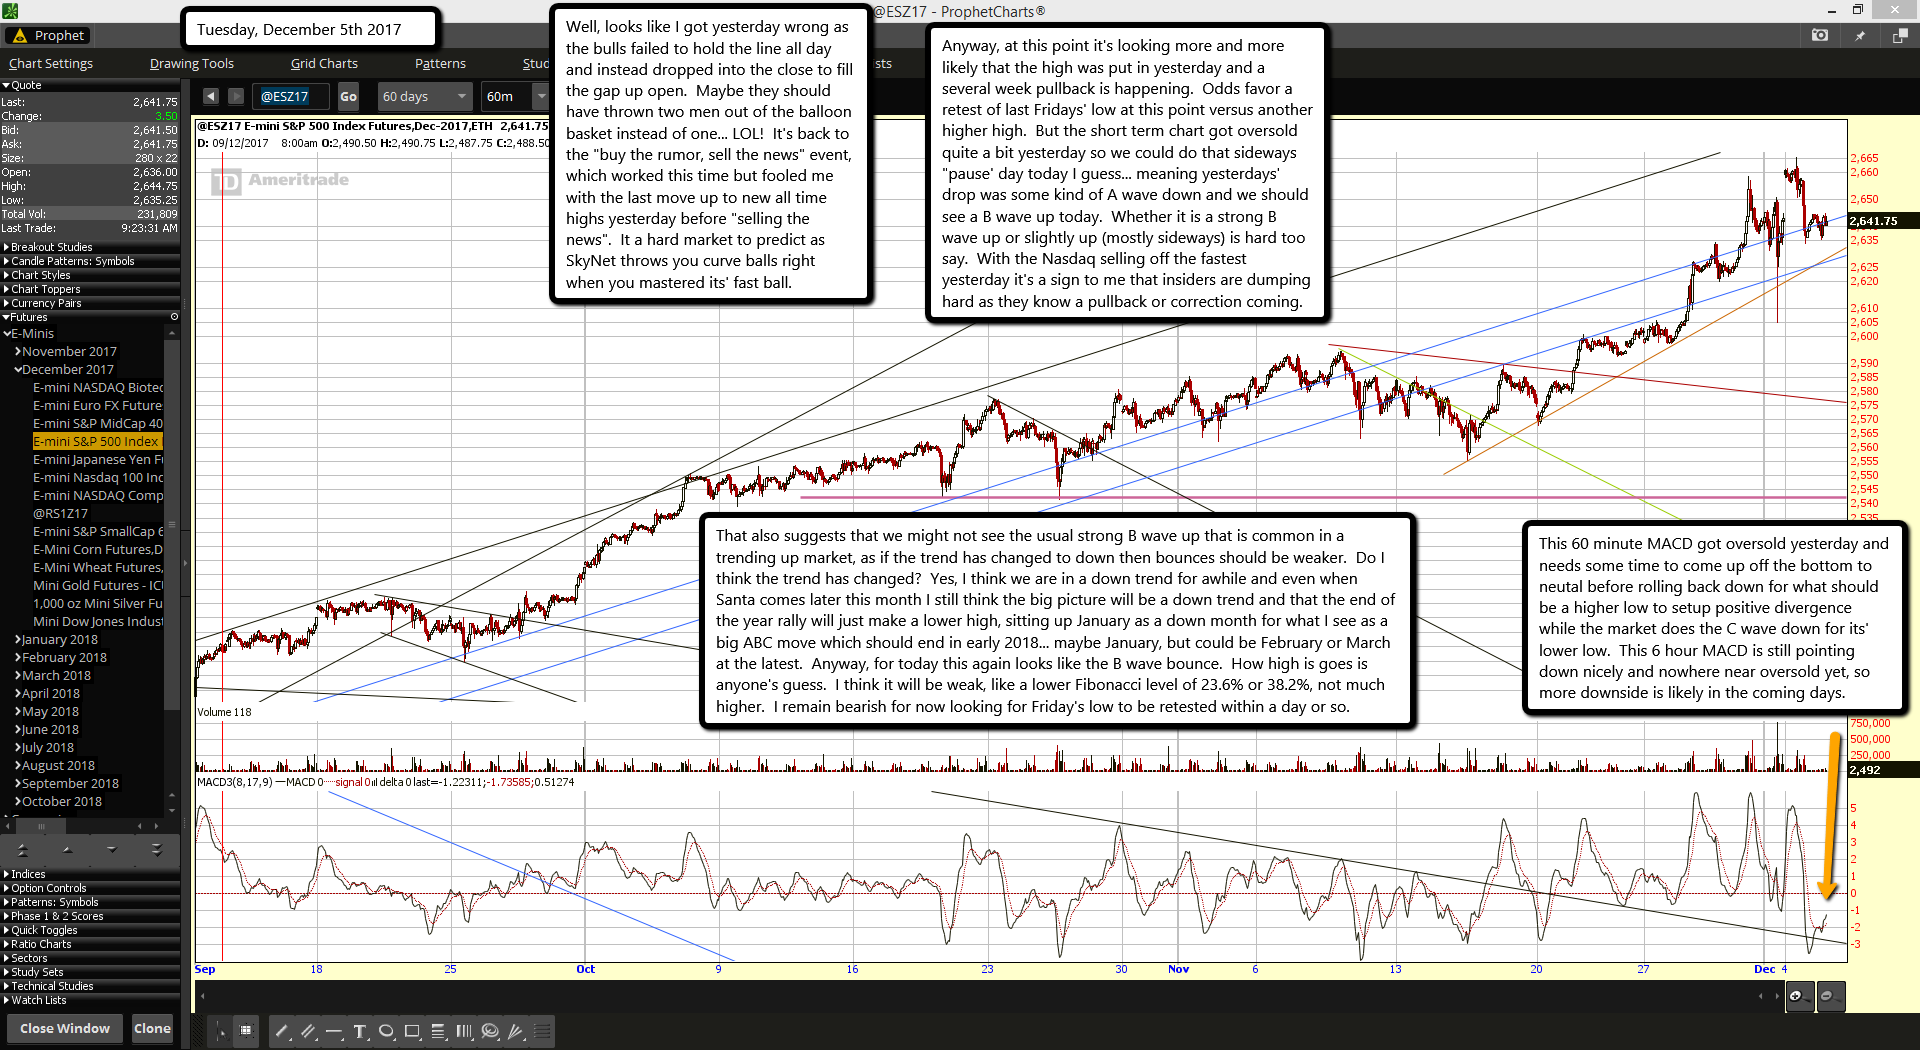
Well, looks like I got yesterday wrong as the bulls failed to hold the line all day and instead dropped into the close to fill the gap up open.  Maybe they should have thrown two men out of the balloon basket instead of one... LOL!  It's back to the "buy the rumor, sell the news" event, which worked this time but fooled me with the last move up to new all time highs yesterday before "selling the news".  It a hard market to predict as SkyNet throws you curve balls right when you mastered its' fast ball.

Anyway, at this point it's looking more and more likely that the high was put in yesterday and a several week pullback is happening.  Odds favor a retest of last Fridays' low at this point versus another higher high.  But the short term chart got oversold quite a bit yesterday so we could do that sideways "pause' day today I guess... meaning yesterdays' drop was some kind of A wave down and we should see a B wave up today.  Whether it is a strong B wave up or slightly up (mostly sideways) is hard too say.  With the Nasdaq selling off the fastest yesterday it's a sign to me that insiders are dumping hard as they know a pullback or correction coming.

That also suggests that we might not see the usual strong B wave up that is common in a trending up market, as if the trend has changed to down then bounces should be weaker.  Do I think the trend has changed?  Yes, I think we are in a down trend for awhile and even when Santa comes later this month I still think the big picture will be a down trend and that the end of the year rally will just make a lower high, sitting up January as a down month for what I see as a big ABC move which should end in early 2018... maybe January, but could be February or March at the latest.  Anyway, for today this again looks like the B wave bounce.  How high is goes is anyone's guess.  I think it will be weak, like a lower Fibonacci level of 23.6% or 38.2%, not much higher.  I remain bearish for now looking for Friday's low to be retested within a day or so.

ES Morning Update December 4th 2017

0

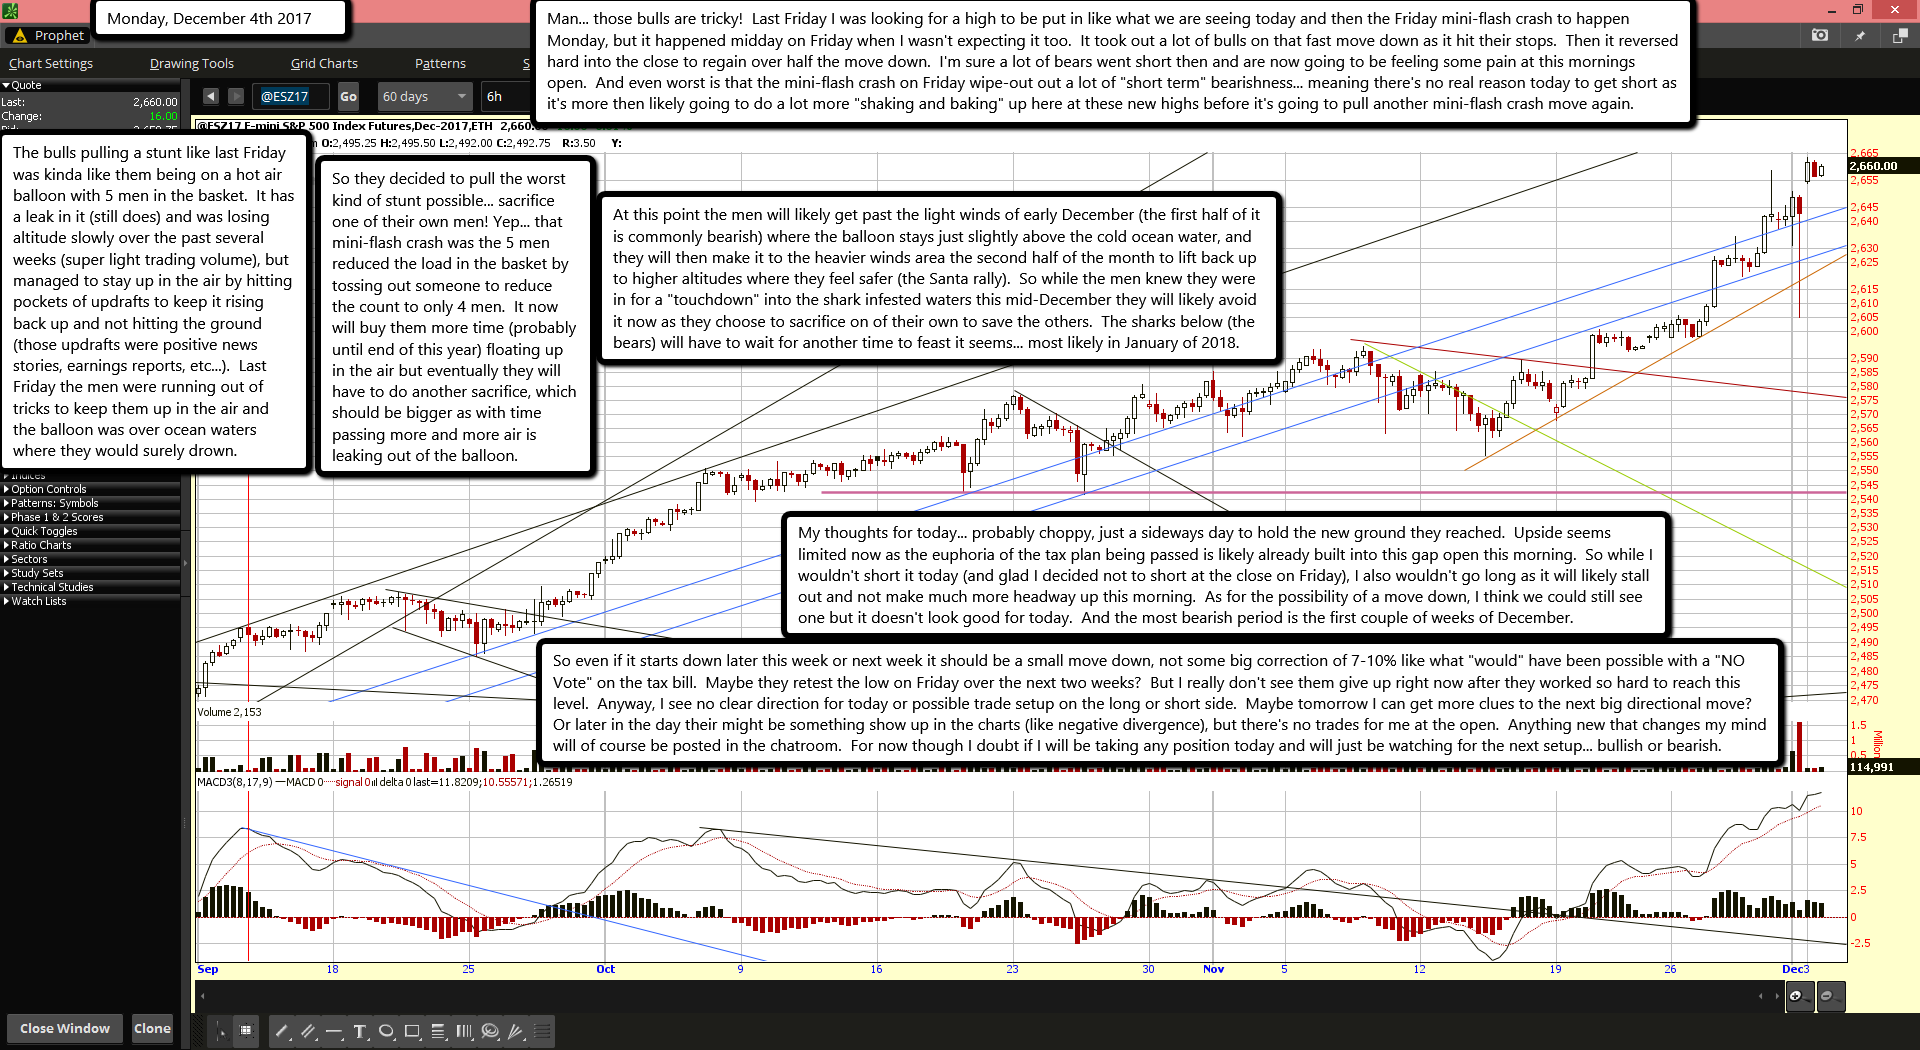
Man... those bulls are tricky!  Last Friday I was looking for a high to be put in like what we are seeing today and then the Friday mini-flash crash to happen Monday, but it happened midday on Friday when I wasn't expecting it too.  It took out a lot of bulls on that fast move down as it hit their stops.  Then it reversed hard into the close to regain over half the move down.  I'm sure a lot of bears went short then and are now going to be feeling some pain at this mornings open.  And even worst is that the mini-flash crash on Friday wipe-out out a lot of "short term" bearishness... meaning there's no real reason today to get short as it's more then likely going to do a lot more "shaking and baking" up here at these new highs before it's going to pull another mini-flash crash move again.

The bulls pulling a stunt like last Friday was kinda like them being on a hot air balloon with 5 men in the basket.  It has a leak in it (still does) and was losing altitude slowly over the past several weeks (super light trading volume), but managed to stay up in the air by hitting pockets of updrafts to keep it rising back up and not hitting the ground (those updrafts were positive news stories, earnings reports, etc...).  Last Friday the men were running out of tricks to keep them up in the air and the balloon was over ocean waters where they would surely drown.

So they decided to pull the worst kind of stunt possible... sacrifice one of their own men! Yep... that mini-flash crash was the 5 men reduced the load in the basket by tossing out someone to reduce the count to only 4 men.  It now will buy them more time (probably until end of this year) floating up in the air but eventually they will have to do another sacrifice, which should be bigger as with time passing more and more air is leaking out of the balloon.

At this point the men will likely get past the light winds of early December (the first half of it is commonly bearish) where the balloon stays just slightly above the cold ocean water, and they will then make it to the heavier winds area the second half of the month to lift back up to higher altitudes where they feel safer (the Santa rally).  So while the men knew they were in for a "touchdown" into the shark infested waters this mid-December they will likely avoid it now as they choose to sacrifice on of their own to save the others.  The sharks below (the bears) will have to wait for another time to feast it seems... most likely in January of 2018.

My thoughts for today... probably choppy, just a sideways day to hold the new ground they reached.  Upside seems limited now as the euphoria of the tax plan being passed is likely already built into this gap open this morning.  So while I wouldn't short it today (and glad I decided not to short at the close on Friday), I also wouldn't go long as it will likely stall out and not make much more headway up this morning.  As for the possibility of a move down, I think we could still see one but it doesn't look good for today.  And the most bearish period is the first couple of weeks of December.

So even if it starts down later this week or next week it should be a small move down, not some big correction of 7-10% like what "would" have been possible with a "NO Vote" on the tax bill.  Maybe they retest the low on Friday over the next two weeks?  But I really don't see them give up right now after they worked so hard to reach this level.  Anyway, I see no clear direction for today or possible trade setup on the long or short side.  Maybe tomorrow I can get more clues to the next big directional move?  Or later in the day their might be something show up in the charts (like negative divergence), but there's no trades for me at the open.  Anything new that changes my mind will of course be posted in the chatroom.  For now though I doubt if I will be taking any position today and will just be watching for the next setup... bullish or bearish.

Another 9/11 may be the black swan event that triggers global stock market meltdown

0

Major financial institutions like Bank of America see the end of the bull market next year. They predict stocks pushing higher in the first half followed by all sorts of potential trouble after that.

Some experts say the new crisis could happen because of economic factors like an inflation hike or tight monetary policy by the US Federal Reserve. However, the crisis is much more likely, if an external shock hits the world, warn analysts.

“In general, this can be any significant event, for example, military actions. The effect will be stronger if negative events happen one after another. In such a situation, there can be a plunge in stock prices and deleveraging would start. All risky assets will begin to get cheaper in a spiral. This is the standard development of the crisis,”financial analyst Timur Nigmatullin told RIA Novosti.

According to the analyst, geopolitical risks are difficult to predict and can happen without notice. At the time of terror attacks like 9/11 or military actions, hyperinflated assets are most vulnerable.

The S&P 500, the American stock market index based on the market capitalizations of the 500 largest companies listed on the NYSE or NASDAQ, has grown almost 40 percent in a year and a half. The index has been increasing steadily since the financial crisis started a decade ago, when it slipped 38.49 percent, its worst yearly percentage loss.

The other probable risks for the global economy include the crisis in the Italian banking sector and likely difficulties facing the Chinese leadership handling ongoing economic growth.

“In the near future, Chinese society must adapt to its higher income and deepen integration into the global economy. When this transformation begins, there may be a capital outflow from China: investors will be afraid of possible problems in this direction," Nigmatullin said.

The black swan theory was developed by author Nassim Nicholas Taleb to explain an event that comes as a surprise, has a significant effect, and is often inappropriately rationalized after the fact with the benefit of hindsight. The term is based on an ancient saying which presumed black swans did not exist, but the saying was rewritten after black swans were discovered in the wild.

ES Morning Update December 1st 2017

0

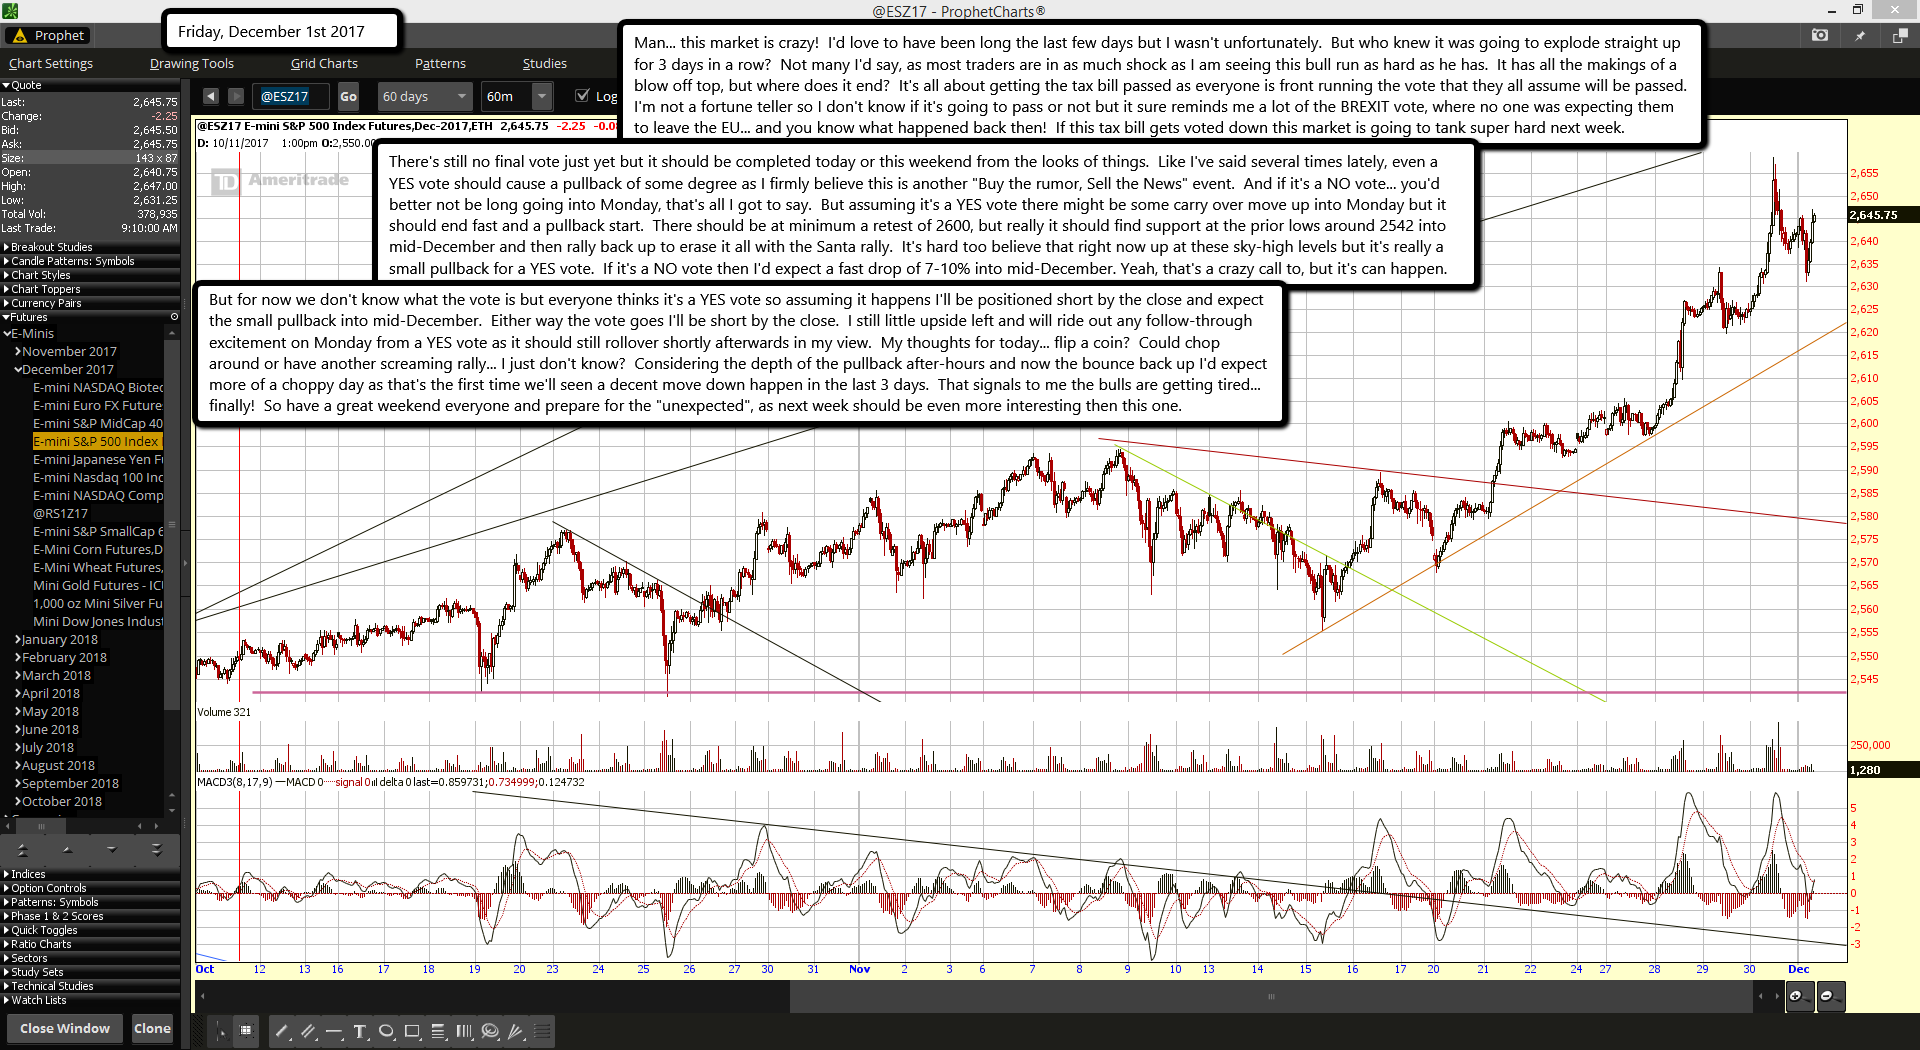
Man... this market is crazy!  I'd love to have been long the last few days but I wasn't unfortunately.  But who knew it was going to explode straight up for 3 days in a row?  Not many I'd say, as most traders are in as much shock as I am seeing this bull run as hard as he has.  It has all the makings of a blow off top, but where does it end?  It's all about getting the tax bill passed as everyone is front running the vote that they all assume will be passed.  I'm not a fortune teller so I don't know if it's going to pass or not but it sure reminds me a lot of the BREXIT vote, where no one was expecting them to leave the EU... and you know what happened back then!  If this tax bill gets voted down this market is going to tank super hard next week.

There's still no final vote just yet but it should be completed today or this weekend from the looks of things.  Like I've said several times lately, even a YES vote should cause a pullback of some degree as I firmly believe this is another "Buy the rumor, Sell the News" event.  And if it's a NO vote... you'd better not be long going into Monday, that's all I got to say.  But assuming it's a YES vote there might be some carry over move up into Monday but it should end fast and a pullback start.  There should be at minimum a retest of 2600, but really it should find support at the prior lows around 2542 into mid-December and then rally back up to erase it all with the Santa rally.  It's hard too believe that right now up at these sky-high levels but it's really a small pullback for a YES vote.  If it's a NO vote then I'd expect a fast drop of 7-10% into mid-December. Yeah, that's a crazy call to, but it's can happen.

But for now we don't know what the vote is but everyone thinks it's a YES vote so assuming it happens I'll be positioned short by the close and expect the small pullback into mid-December.  Either way the vote goes I'll be short by the close.  I still little upside left and will ride out any follow-through excitement on Monday from a YES vote as it should still rollover shortly afterwards in my view.  My thoughts for today... flip a coin?  Could chop around or have another screaming rally... I just don't know?  Considering the depth of the pullback after-hours and now the bounce back up I'd expect more of a choppy day as that's the first time we'll seen a decent move down happen in the last 3 days.  That signals to me the bulls are getting tired... finally!  So have a great weekend everyone and prepare for the "unexpected", as next week should be even more interesting then this one.

ES Morning Update November 30th 2017

0

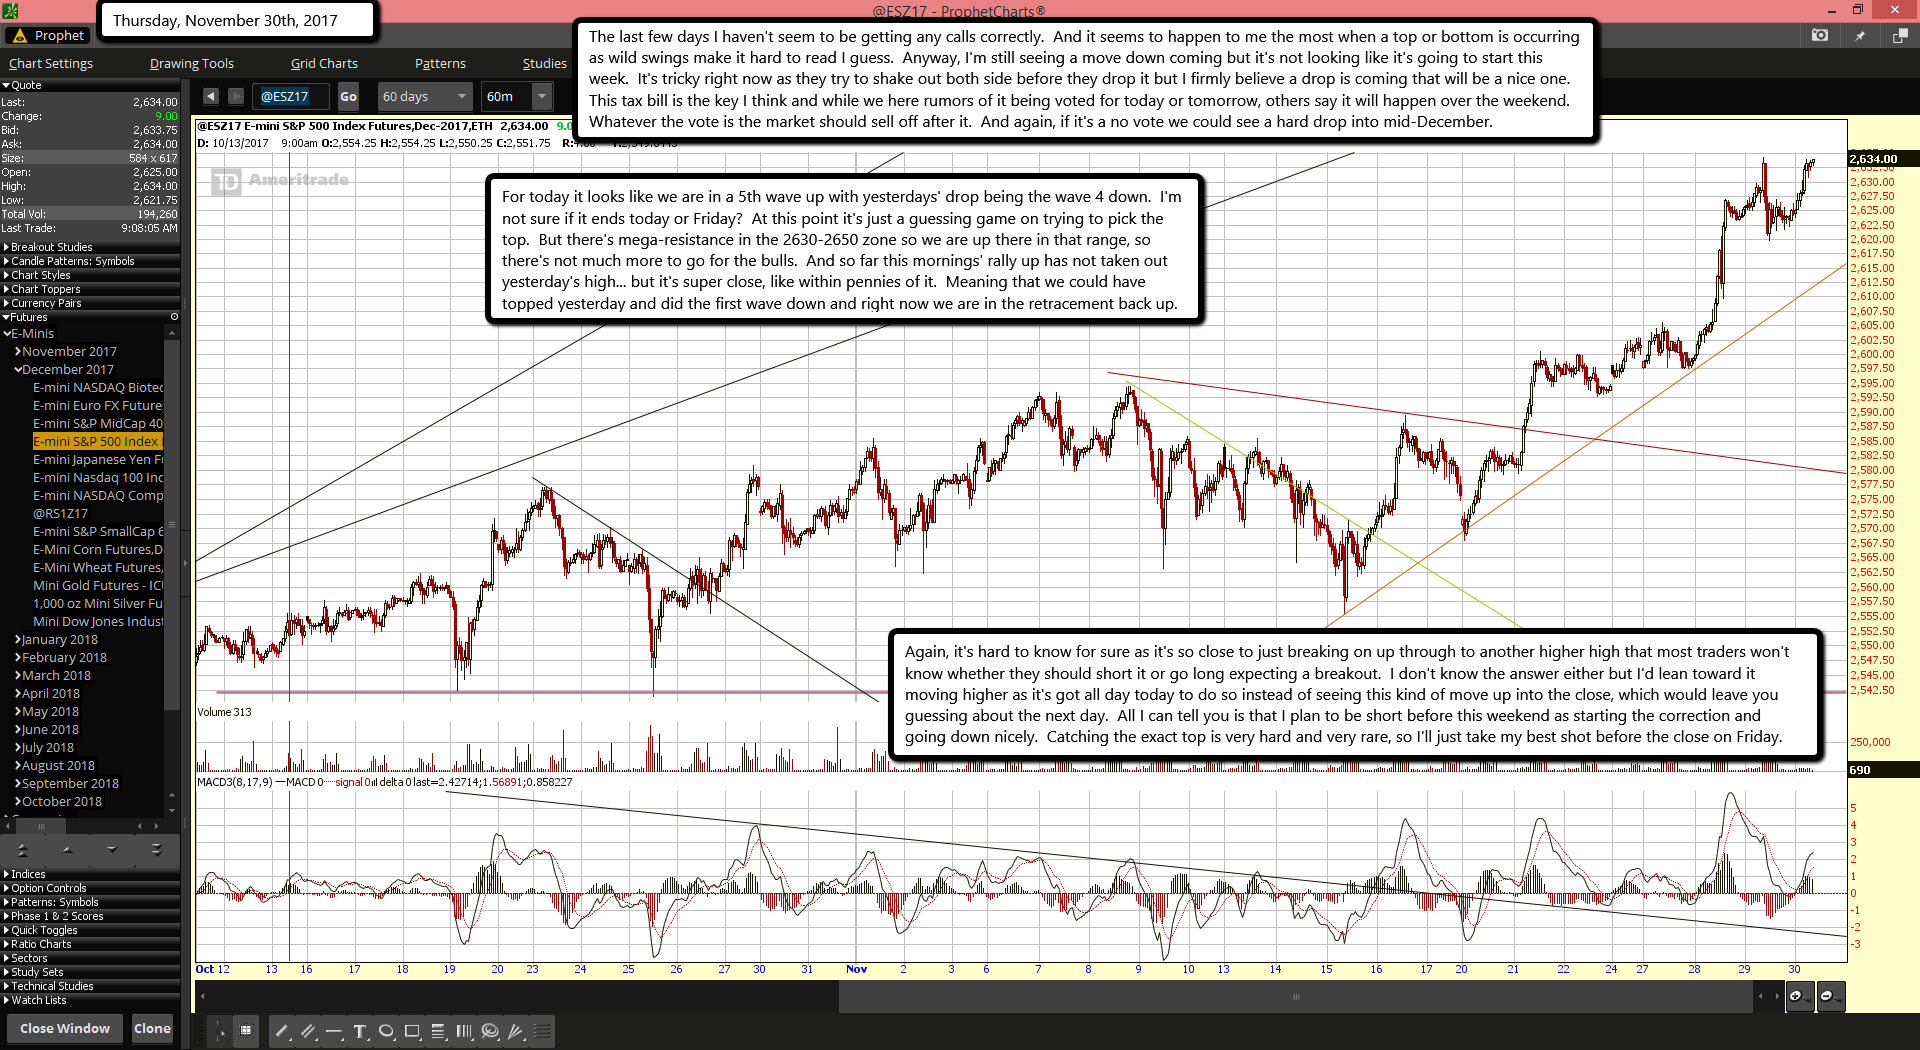
The last few days I haven't seem to be getting any calls correctly.  And it seems to happen to me the most when a top or bottom is occurring as wild swings make it hard to read I guess.  Anyway, I'm still seeing a move down coming but it's not looking like it's going to start this week.  It's tricky right now as they try to shake out both side before they drop it but I firmly believe a drop is coming that will be a nice one.  This tax bill is the key I think and while we here rumors of it being voted for today or tomorrow, others say it will happen over the weekend.  Whatever the vote is the market should sell off after it.  And again, if it's a no vote we could see a hard drop into mid-December.

For today it looks like we are in a 5th wave up with yesterdays' drop being the wave 4 down.  I'm not sure if it ends today or Friday?  At this point it's just a guessing game on trying to pick the top.  But there's mega-resistance in the 2630-2650 zone so we are up there in that range, so there's not much more to go for the bulls.  And so far this mornings' rally up has not taken out yesterday's high... but it's super close, like within pennies of it.  Meaning that we could have topped yesterday and did the first wave down and right now we are in the retracement back up.

Again, it's hard to know for sure as it's so close to just breaking on up through to another higher high that most traders won't know whether they should short it or go long expecting a breakout.  I don't know the answer either but I'd lean toward it moving higher as it's got all day today to do so instead of seeing this kind of move up into the close, which would leave you guessing about the next day.  All I can tell you is that I plan to be short before this weekend as starting the correction and going down nicely.  Catching the exact top is very hard and very rare, so I'll just take my best shot before the close on Friday.

Bank of America: Flash crash in 2018 then war to follow

0

In its analysis for the first half of 2018, Bank of America is warning investors of a “flash crash” the likes of 1987, 1994, 1998. And  it warns that the central bank policies that have created the current conditions can’t be reversed, leading to an inevitable war to follow the crash.

In 1987, known as “Black Monday,” global stock markets lost huge portions of their valuations, ranging from 60 percent in New Zealand to 23 percent in the U.S. In 1994, the Great Bond Massacre saw global bond markets collapse, starting in the U.S. and Japan, resulting in treasury rates skyrocketing through the first nine months of the year.

In 1998, the Dow Jones Industrial Average saw its greatest single-day point loss of 512 points. The collapse was brought on by major financial crises involving the “emerging markets” in Russia, Thailand, and Poland.

The bearish outlook is based on large part because the investment script has been flipped from beginning to end of 2017. Going into the new year, the markets will be “positioning now long, not short; profit expectations high, not low; policy close to max stimulus; peak positioning, peak profits, peak policy stimulus means peak asset returns in 2018.”

The report strongly suggests the “tech bubble” is about to burst, if not in 2018, then early in 2019. It also hints at the very strong possibility of civil war, possibly boiling over into a global war, as a result of the very policies that have gotten us where we’re at.

The analysis strongly recommends buying gold now.


When Bank of America warns us in advance it's got to be a "cover their ass" news release.  Now the real question is... when is it going to happen?  What if it happens in 2017?  What if Trumps tax bill doesn't pass?  Today is November 29th, 2017 as I write this and the bill passed congress already but not the senate.  If it fails there I could see a flash crash happen right afterwards.

Red

ES Morning Update November 29th 2017

0

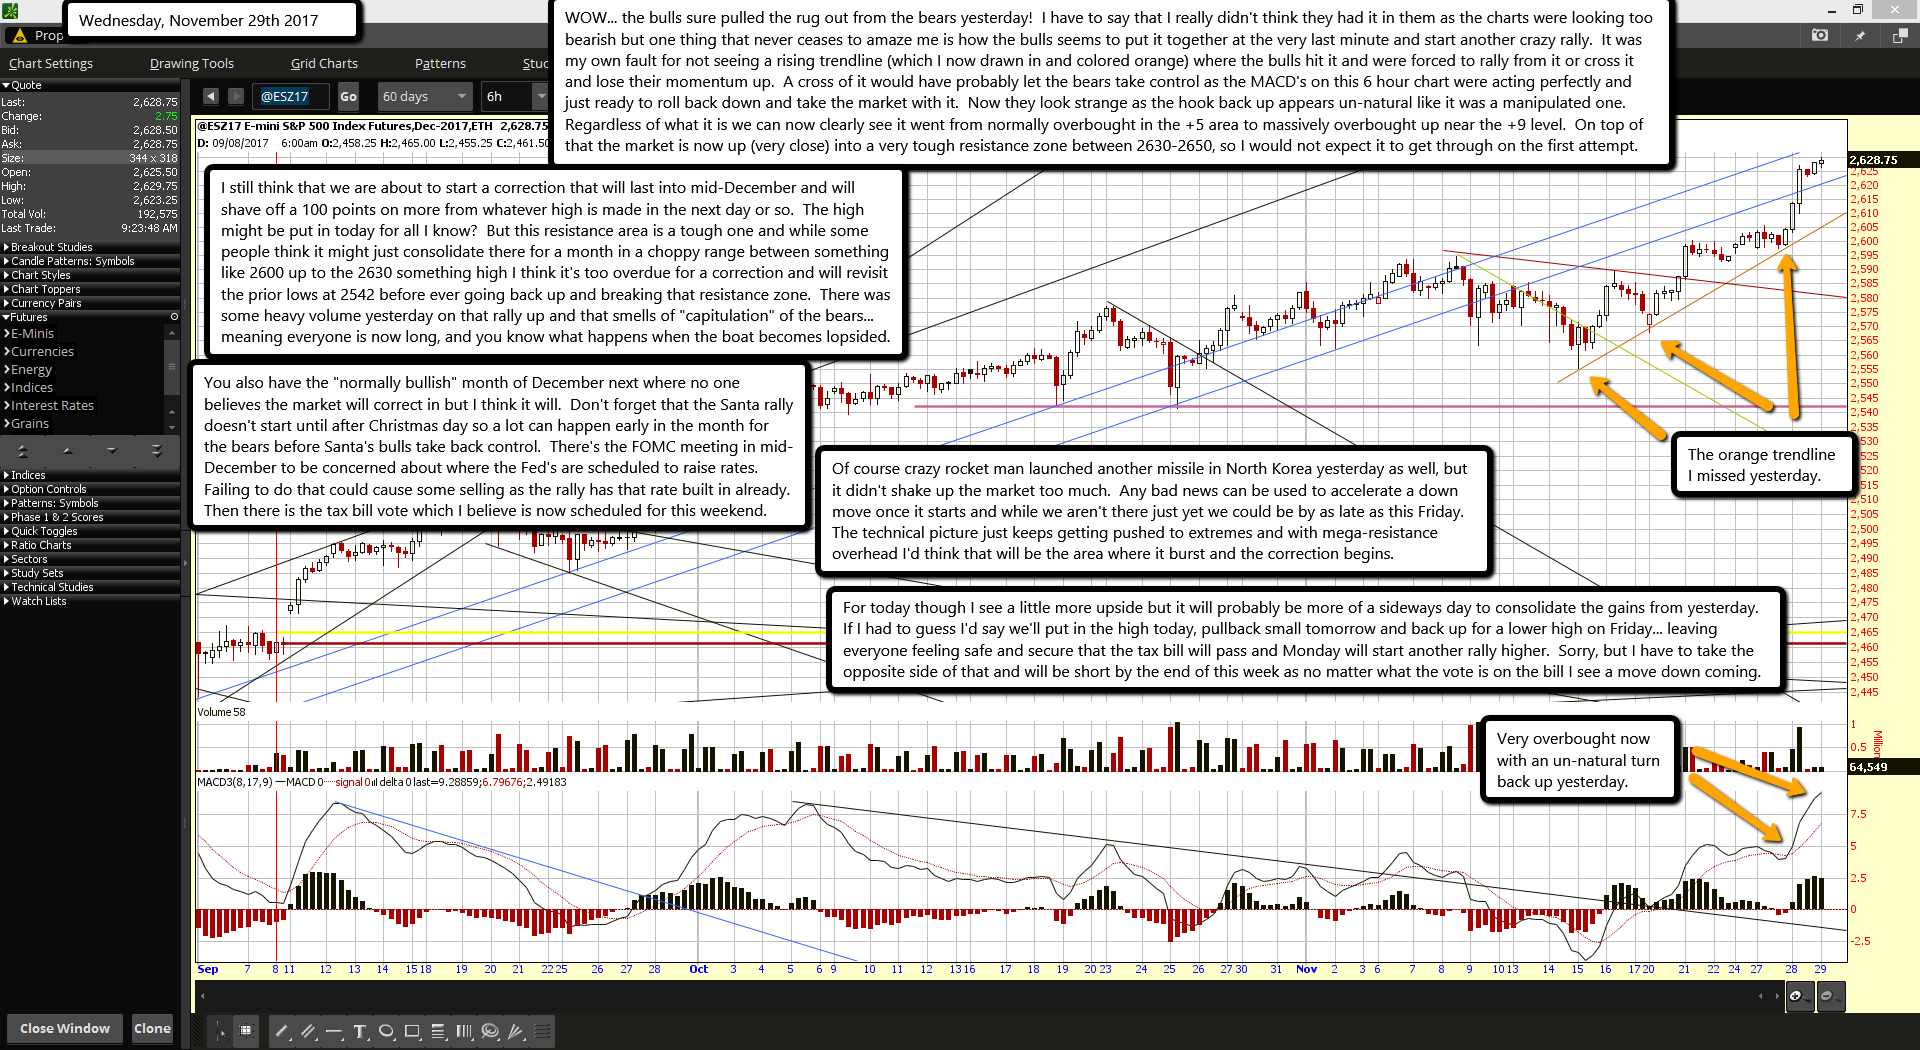
WOW... the bulls sure pulled the rug out from the bears yesterday!  I have to say that I really didn't think they had it in them as the charts were looking too bearish but one thing that never ceases to amaze me is how the bulls seems to put it together at the very last minute and start another crazy rally.  It was my own fault for not seeing a rising trendline (which I now drawn in and colored orange) where the bulls hit it and were forced to rally from it or cross it and lose their momentum up.  A cross of it would have probably let the bears take control as the MACD's on this 6 hour chart were acting perfectly and just ready to roll back down and take the market with it.  Now they look strange as the hook back up appears un-natural like it was a manipulated one.  Regardless of what it is we can now clearly see it went from normally overbought in the +5 area to massively overbought up near the +9 level.  On top of that the market is now up (very close) into a very tough resistance zone between 2630-2650, so I would not expect it to get through on the first attempt.

I still think that we are about to start a correction that will last into mid-December and will shave off a 100 points on more from whatever high is made in the next day or so.  The high might be put in today for all I know?  But this resistance area is a tough one and while some people think it might just consolidate there for a month in a choppy range between something like 2600 up to the 2630 something high I think it's too overdue for a correction and will revisit the prior lows at 2542 before ever going back up and breaking that resistance zone.  There was some heavy volume yesterday on that rally up and that smells of "capitulation" of the bears... meaning everyone is now long, and you know what happens when the boat becomes lopsided.

You also have the "normally bullish" month of December next where no one believes the market will correct in but I think it will.  Don't forget that the Santa rally doesn't start until after Christmas day so a lot can happen early in the month for the bears before Santa's bulls take back control.  There's the FOMC meeting in mid-December to be concerned about where the Fed's are scheduled to raise rates.  Failing to do that could cause some selling as the rally has that rate built in already.  Then there is the tax bill vote which I believe is now scheduled for this weekend.

Of course crazy rocket man launched another missile in North Korea yesterday as well, but it didn't shake up the market too much.  Any bad news can be used to accelerate a down move once it starts and while we aren't there just yet we could be by as late as this Friday.  The technical picture just keeps getting pushed to extremes and with mega-resistance overhead I'd think that will be the area where it burst and the correction begins.

For today though I see a little more upside but it will probably be more of a sideways day to consolidate the gains from yesterday.  If I had to guess I'd say we'll put in the high today, pullback small tomorrow and back up for a lower high on Friday... leaving everyone feeling safe and secure that the tax bill will pass and Monday will start another rally higher.  Sorry, but I have to take the opposite side of that and will be short by the end of this week as no matter what the vote is on the bill I see a move down coming.

ES Morning Update November 28th 2017

0

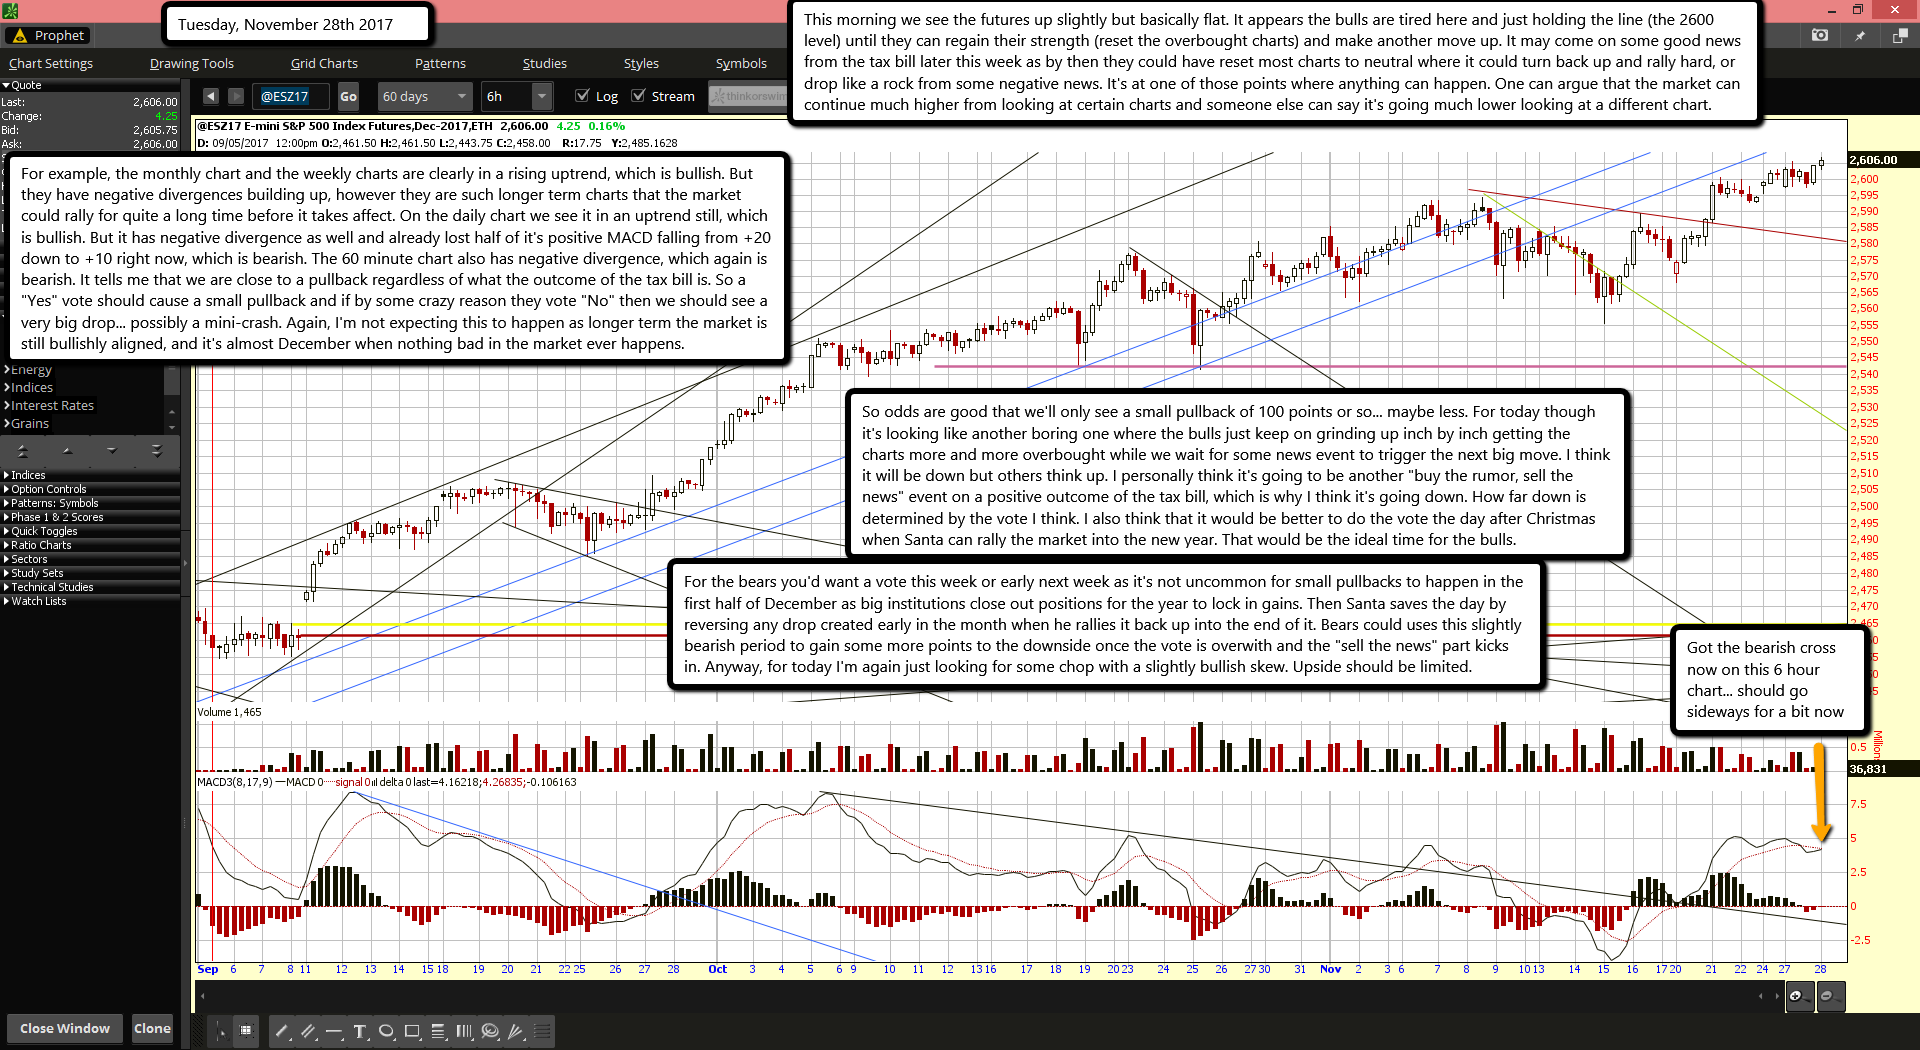
This morning we see the futures up slightly but basically flat. It appears the bulls are tired here and just holding the line (the 2600 level) until they can regain their strength (reset the overbought charts) and make another move up. It may come on some good news from the tax bill later this week as by then they could have reset most charts to neutral where it could turn back up and rally hard, or drop like a rock from some negative news. It's at one of those points where anything can happen. One can argue that the market can continue much higher from looking at certain charts and someone else can say it's going much lower looking at a different chart.

For example, the monthly chart and the weekly charts are clearly in a rising uptrend, which is bullish. But they have negative divergences building up, however they are such longer term charts that the market could rally for quite a long time before it takes affect. On the daily chart we see it in an uptrend still, which is bullish. But it has negative divergence as well and already lost half of it's positive MACD falling from +20 down to +10 right now, which is bearish. The 60 minute chart also has negative divergence, which again is bearish. It tells me that we are close to a pullback regardless of what the outcome of the tax bill is. So a "Yes" vote should cause a small pullback and if by some crazy reason they vote "No" then we should see a very big drop... possibly a mini-crash. Again, I'm not expecting this to happen as longer term the market is still bullishly aligned, and it's almost December when nothing bad in the market ever happens.

So odds are good that we'll only see a small pullback of 100 points or so... maybe less. For today though it's looking like another boring one where the bulls just keep on grinding up inch by inch getting the charts more and more overbought while we wait for some news event to trigger the next big move. I think it will be down but others think up. I personally think it's going to be another "buy the rumor, sell the news" event on a positive outcome of the tax bill, which is why I think it's going down. How far down is determined by the vote I think. I also think that it would be better to do the vote the day after Christmas when Santa can rally the market into the new year. That would be the ideal time for the bulls.

For the bears you'd want a vote this week or early next week as it's not uncommon for small pullbacks to happen in the first half of December as big institutions close out positions for the year to lock in gains. Then Santa saves the day by reversing any drop created early in the month when he rallies it back up into the end of it. Bears could uses this slightly bearish period to gain some more points to the downside once the vote is overwith and the "sell the news" part kicks in. Anyway, for today I'm again just looking for some chop with a slightly bullish skew. Upside should be limited.

ES Morning Update November 27th 2017

0

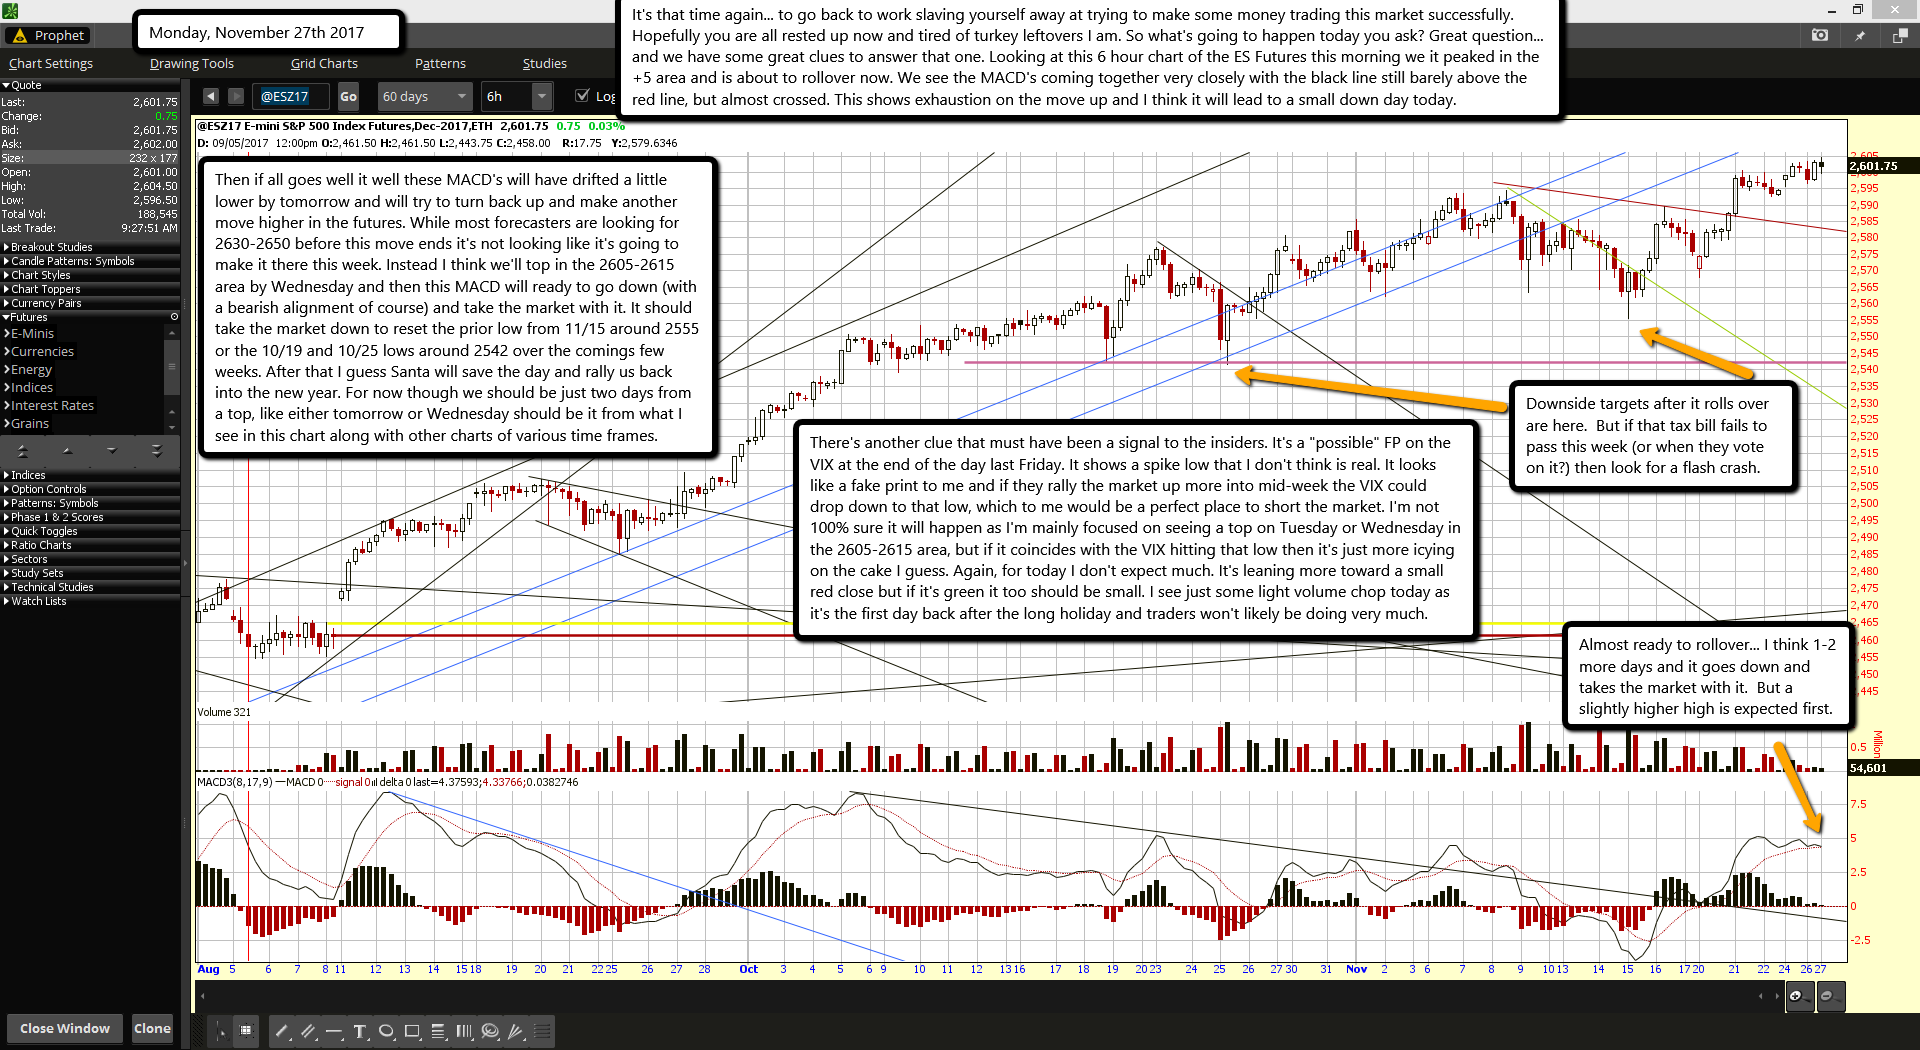
It's that time again... to go back to work slaving yourself away at trying to make some money trading this market successfully. Hopefully you are all rested up now and tired of turkey leftovers I am. So what's going to happen today you ask? Great question... and we have some great clues to answer that one. Looking at this 6 hour chart of the ES Futures this morning we it peaked in the +5 area and is about to rollover now. We see the MACD's coming together very closely with the black line still barely above the red line, but almost crossed. This shows exhaustion on the move up and I think it will lead to a small down day today.

Then if all goes well it well these MACD's will have drifted a little lower by tomorrow and will try to turn back up and make another move higher in the futures. While most forecasters are looking for 2630-2650 before this move ends it's not looking like it's going to make it there this week. Instead I think we'll top in the 2605-2615 area by Wednesday and then this MACD will ready to go down (with a bearish alignment of course) and take the market with it. It should take the market down to reset the prior low from 11/15 around 2555 or the 10/19 and 10/25 lows around 2542 over the comings few weeks. After that I guess Santa will save the day and rally us back into the new year. For now though we should be just two days from a top, like either tomorrow or Wednesday should be it from what I see in this chart along with other charts of various time frames.

There's another clue that must have been a signal to the insiders. It's a "possible" FP on the VIX at the end of the day last Friday. It shows a spike low that I don't think is real. It looks like a fake print to me and if they rally the market up more into mid-week the VIX could drop down to that low, which to me would be a perfect place to short the market. I'm not 100% sure it will happen as I'm mainly focused on seeing a top on Tuesday or Wednesday in the 2605-2615 area, but if it coincides with the VIX hitting that low then it's just more icying on the cake I guess. Again, for today I don't expect much. It's leaning more toward a small red close but if it's green it too should be small. I see just some light volume chop today as it's the first day back after the long holiday and traders won't likely be doing very much.


Midday Update on possible coded message...

bfe363e1-26f3-44ce-9dc0-71f70095f312

ES Morning Update November 24th 2017

0

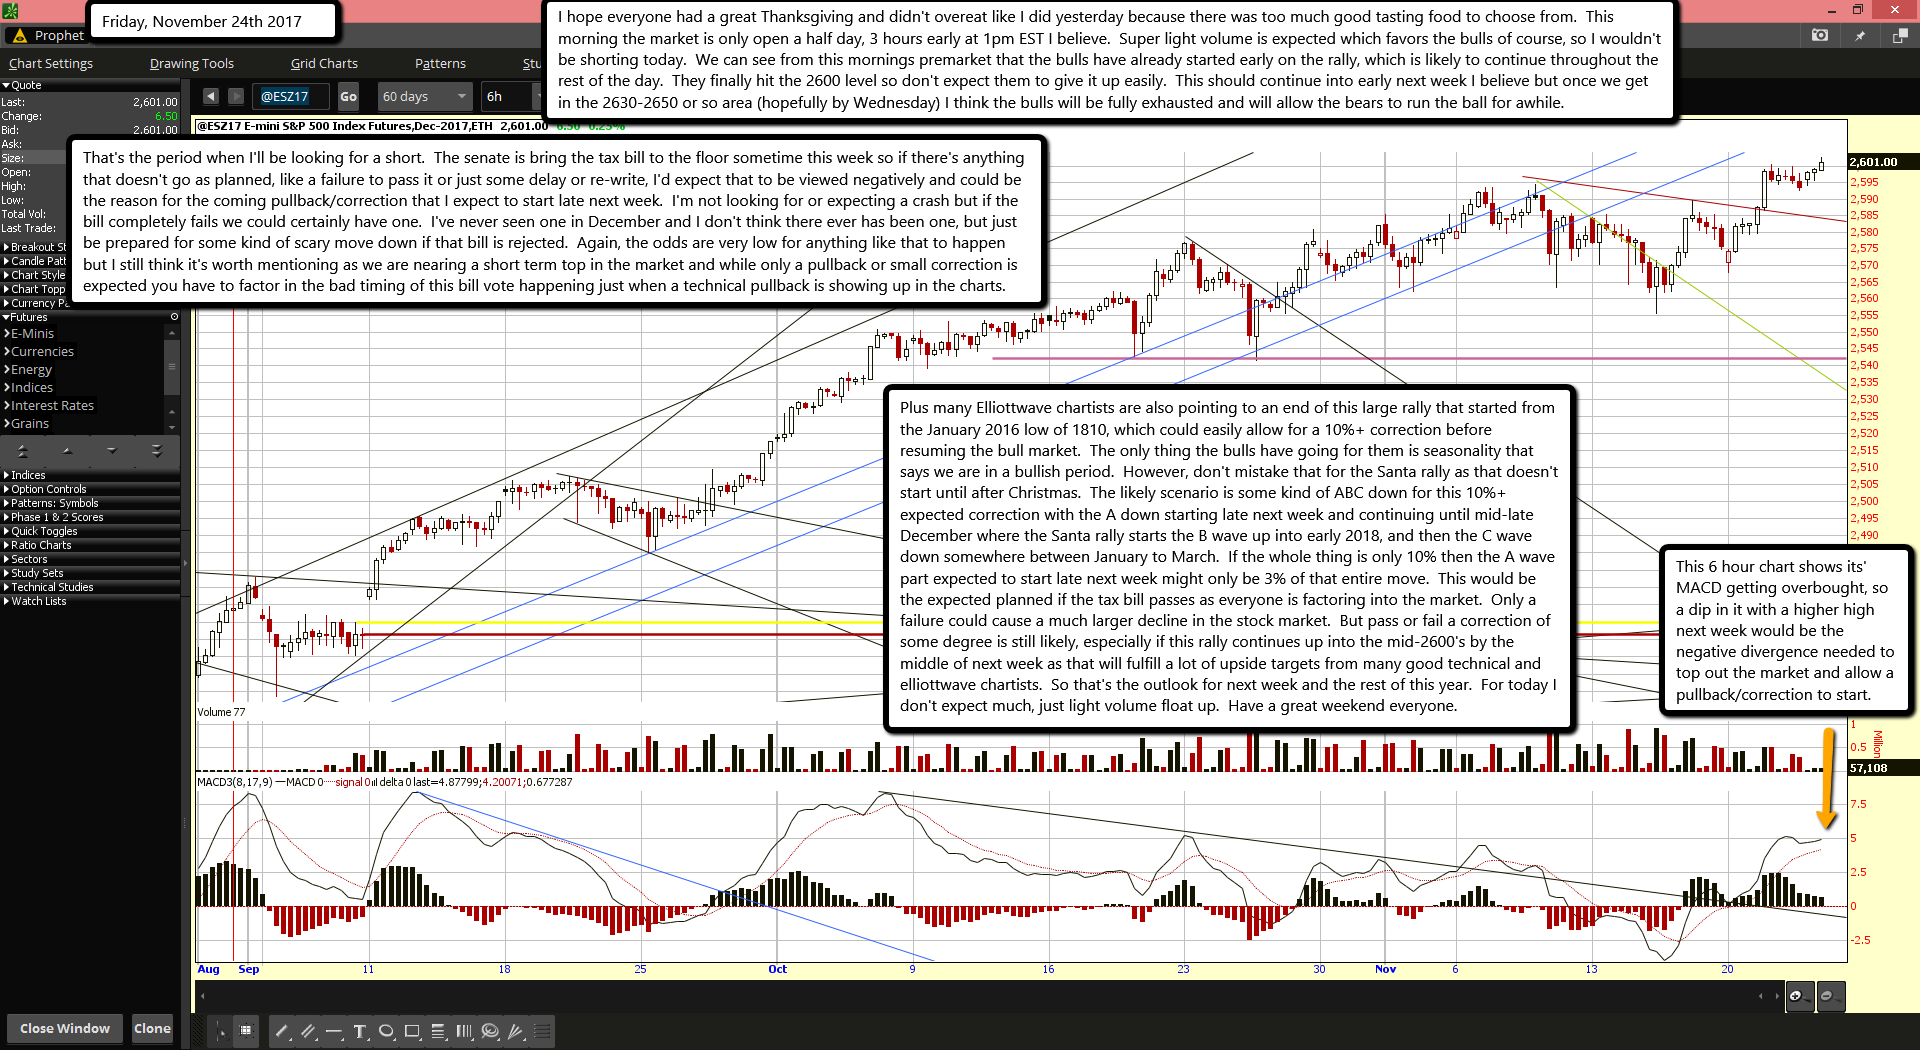
I hope everyone had a great Thanksgiving and didn't overeat like I did yesterday because there was too much good tasting food to choose from.  This morning the market is only open a half day, 3 hours early at 1pm EST I believe.  Super light volume is expected which favors the bulls of course, so I wouldn't be shorting today.  We can see from this mornings premarket that the bulls have already started early on the rally, which is likely to continue throughout the rest of the day.  They finally hit the 2600 level so don't expect them to give it up easily.  This should continue into early next week I believe but once we get in the 2630-2650 or so area (hopefully by Wednesday) I think the bulls will be fully exhausted and will allow the bears to run the ball for awhile.

That's the period when I'll be looking for a short.  The senate is bring the tax bill to the floor sometime this week so if there's anything that doesn't go as planned, like a failure to pass it or just some delay or re-write, I'd expect that to be viewed negatively and could be the reason for the coming pullback/correction that I expect to start late next week.  I'm not looking for or expecting a crash but if the bill completely fails we could certainly have one.  I've never seen one in December and I don't think there ever has been one, but just be prepared for some kind of scary move down if that bill is rejected.  Again, the odds are very low for anything like that to happen but I still think it's worth mentioning as we are nearing a short term top in the market and while only a pullback or small correction is expected you have to factor in the bad timing of this bill vote happening just when a technical pullback is showing up in the charts.

Plus many Elliottwave chartists are also pointing to an end of this large rally that started from the January 2016 low of 1810, which could easily allow for a 10%+ correction before resuming the bull market.  The only thing the bulls have going for them is seasonality that says we are in a bullish period.  However, don't mistake that for the Santa rally as that doesn't start until after Christmas.  The likely scenario is some kind of ABC down for this 10%+ expected correction with the A down starting late next week and continuing until mid-late December where the Santa rally starts the B wave up into early 2018, and then the C wave down somewhere between January to March.  If the whole thing is only 10% then the A wave part expected to start late next week might only be 3% of that entire move.  This would be the expected planned if the tax bill passes as everyone is factoring into the market.  Only a failure could cause a much larger decline in the stock market.  But pass or fail a correction of some degree is still likely, especially if this rally continues up into the mid-2600's by the middle of next week as that will fulfill a lot of upside targets from many good technical and elliottwave chartists.  So that's the outlook for next week and the rest of this year.  For today I don't expect much, just light volume float up.  Have a great weekend everyone.

ES Morning Update November 22nd 2017

0

Nothing much to say today gang.  Futures got very overbought yesterday and today they will likely trade sideways to work it off.  It's the day before Thanksgiving on top of that, so I really don't expect anything to happen.  I'd say take the day off and spend it with family.  I expect more of the same on Friday but the chart should be reset enough by then to continue this rally up.  Where it stops I don't know?  We'll have to take it day by day.  But next week I do think we'll see that top, and I'm estimating it to happen on Tuesday the 28th or Wednesday the 29th.  After that I see a move down starting and it should last into mid-December.  Anyway, for today I don't see anything but chop.  Have a great Thanksgiving tomorrow.

ES Morning Update November 21st 2017

0

Looks like the inverted head and shoulders is playing out this morning in the futures as the ES has pushed through the falling red trendline of resistance.  Next up will be a new all time high if the bulls can keep this momentum going, and of course the all important 2600 level.  The MACD made a lower high yesterday and appeared like it was going to rollover but the light volume of this holiday week must have taken over and turned it back up as it doesn't seem ready to quit yet.  It should still make a lower high then the previous +4.0 high, but I'm not sure where it will stop.

Time wise I don't think it can go more then one more day, if not later this day?  So, we could see a pullback start tomorrow but considering this is Thanksgiving week I seriously doubt if it would amount to much.  More likely it would be a sideways to slightly down day.  For today though I don't see much to do.  The move I was expecting yesterday has now happened but with the overbought 60 minute MACD the futures might not be able to push through overhead resistance today, so it's not something I want risk a long trade on.  I'm just in watch mode for today and will see how the close sets up.  There might be a short later today but again, I really don't see much of a move down tomorrow even if this short works.  Maybe Wednesday we'll get a good setup?

ES Morning Update November 20th 2017

0

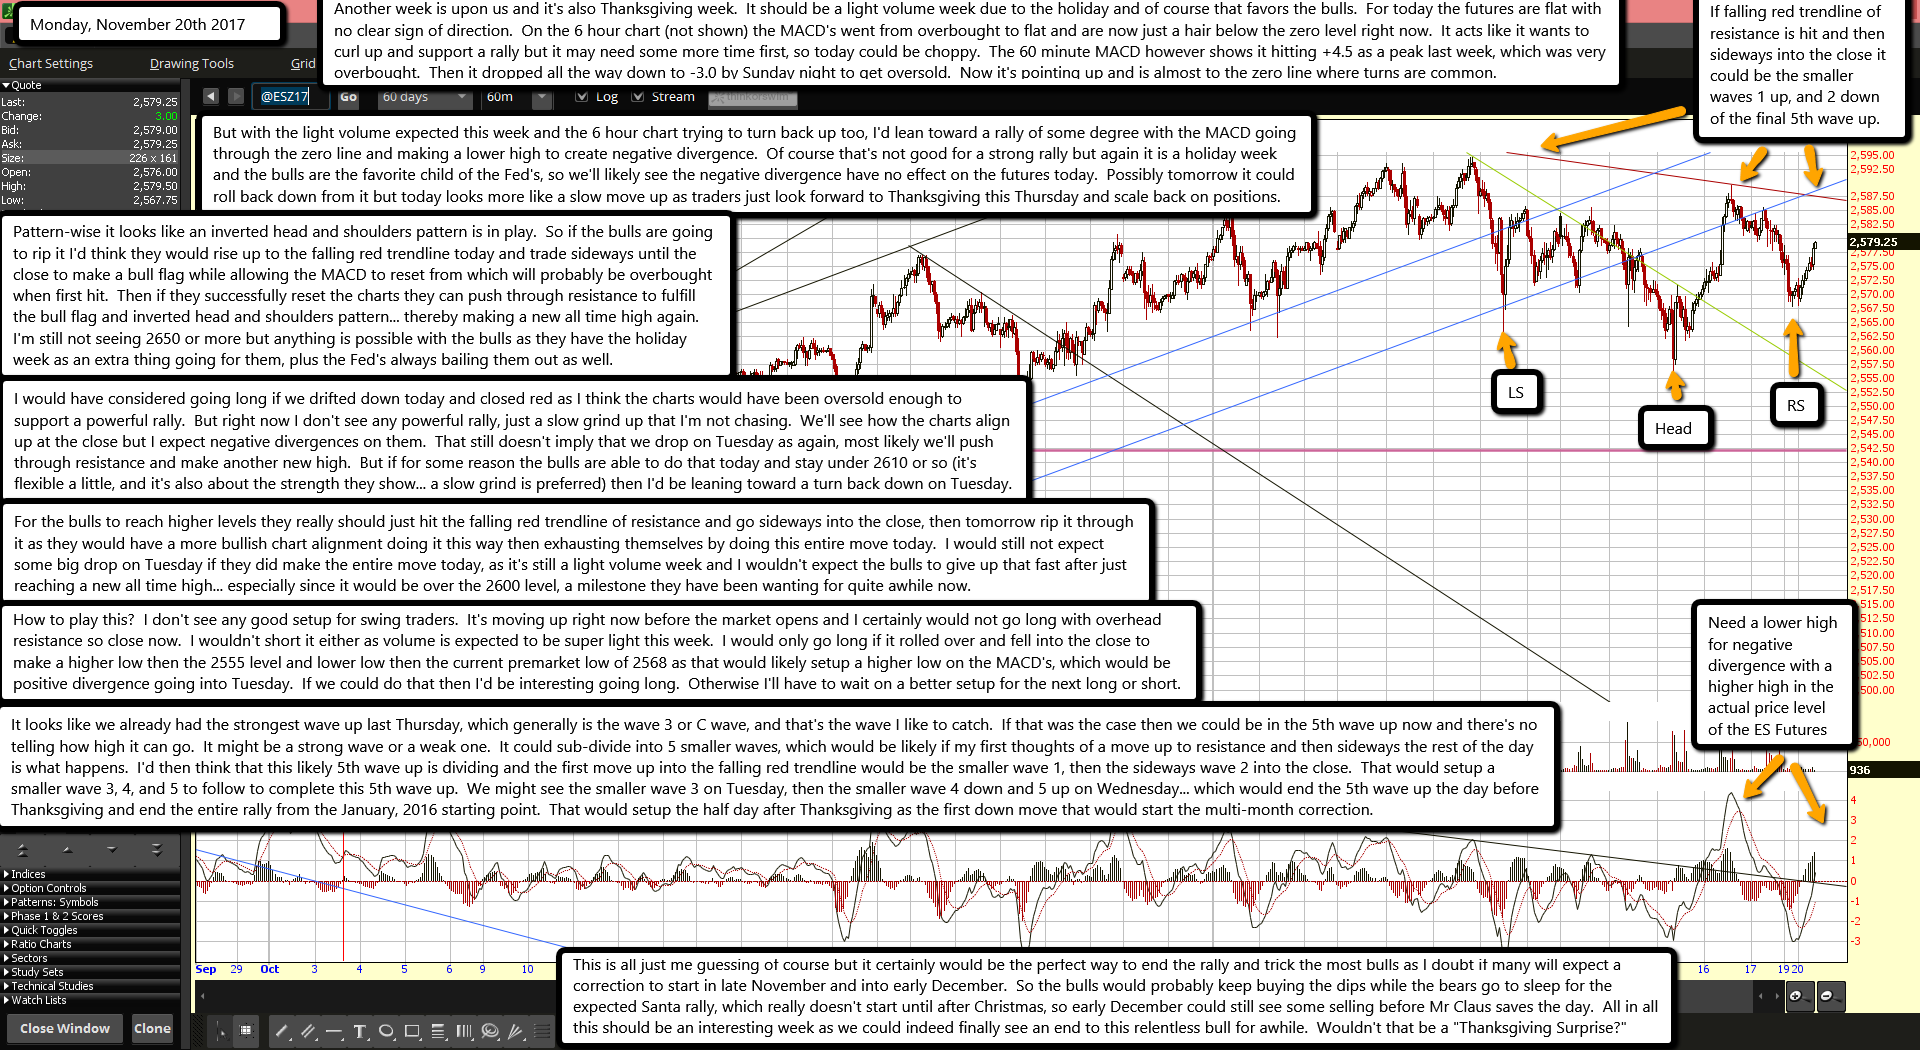
Another week is upon us and it's also Thanksgiving week.  It should be a light volume week due to the holiday and of course that favors the bulls.  For today the futures are flat with no clear sign of direction.  On the 6 hour chart (not shown) the MACD's went from overbought to flat and are now just a hair below the zero level right now.  It acts like it wants to curl up and support a rally but it may need some more time first, so today could be choppy.  The 60 minute MACD however shows it hitting +4.5 as a peak last week, which was very overbought.  Then it dropped all the way down to -3.0 by Sunday night to get oversold.  Now it's pointing up and is almost to the zero line where turns are common.

But with the light volume expected this week and the 6 hour chart trying to turn back up too, I'd lean toward a rally of some degree with the MACD going through the zero line and making a lower high to create negative divergence.  Of course that's not good for a strong rally but again it is a holiday week and the bulls are the favorite child of the Fed's, so we'll likely see the negative divergence have no effect on the futures today.  Possibly tomorrow it could roll back down from it but today looks more like a slow move up as traders just look forward to Thanksgiving this Thursday and scale back on positions.

Pattern-wise it looks like an inverted head and shoulders pattern is in play.  So if the bulls are going to rip it I'd think they would rise up to the falling red trendline today and trade sideways until the close to make a bull flag while allowing the MACD to reset from which will probably be overbought when first hit.  Then if they successfully reset the charts they can push through resistance to fulfill the bull flag and inverted head and shoulders pattern... thereby making a new all time high again.  I'm still not seeing 2650 or more but anything is possible with the bulls as they have the holiday week as an extra thing going for them, plus the Fed's always bailing them out as well.

I would have considered going long if we drifted down today and closed red as I think the charts would have been oversold enough to support a powerful rally.  But right now I don't see any powerful rally, just a slow grind up that I'm not chasing.  We'll see how the charts align up at the close but I expect negative divergences on them.  That still doesn't imply that we drop on Tuesday as again, most likely we'll push through resistance and make another new high.  But if for some reason the bulls are able to do that today and stay under 2610 or so (it's flexible a little, and it's also about the strength they show... a slow grind is preferred) then I'd be leaning toward a turn back down on Tuesday.

For the bulls to reach higher levels they really should just hit the falling red trendline of resistance and go sideways into the close, then tomorrow rip it through it as they would have a more bullish chart alignment doing it this way then exhausting themselves by doing this entire move today.  I would still not expect some big drop on Tuesday if they did make the entire move today, as it's still a light volume week and I wouldn't expect the bulls to give up that fast after just reaching a new all time high... especially since it would be over the 2600 level, a milestone they have been wanting for quite awhile now.

How to play this?  I don't see any good setup for swing traders.  It's moving up right now before the market opens and I certainly would not go long with overhead resistance so close now.  I wouldn't short it either as volume is expected to be super light this week.  I would only go long if it rolled over and fell into the close to make a higher low then the 2555 level and lower low then the current premarket low of 2568 as that would likely setup a higher low on the MACD's, which would be positive divergence going into Tuesday.  If we could do that then I'd be interesting going long.  Otherwise I'll have to wait on a better setup for the next long or short.

It looks like we already had the strongest wave up last Thursday, which generally is the wave 3 or C wave, and that's the wave I like to catch.  If that was the case then we could be in the 5th wave up now and there's no telling how high it can go.  It might be a strong wave or a weak one.  It could sub-divide into 5 smaller waves, which would be likely if my first thoughts of a move up to resistance and then sideways the rest of the day is what happens.  I'd then think that this likely 5th wave up is dividing and the first move up into the falling red trendline would be the smaller wave 1, then the sideways wave 2 into the close.  That would setup a smaller wave 3, 4, and 5 to follow to complete this 5th wave up.  We might see the smaller wave 3 on Tuesday, then the smaller wave 4 down and 5 up on Wednesday... which would end the 5th wave up the day before Thanksgiving and end the entire rally from the January, 2016 starting point.  That would setup the half day after Thanksgiving as the first down move that would start the multi-month correction.

This is all just me guessing of course but it certainly would be the perfect way to end the rally and trick the most bulls as I doubt if many will expect a correction to start in late November and into early December.  So the bulls would probably keep buying the dips while the bears go to sleep for the expected Santa rally, which really doesn't start until after Christmas, so early December could still see some selling before Mr Claus saves the day.  All in all this should be an interesting week as we could indeed finally see an end to this relentless bull for awhile.  Wouldn't that be a "Thanksgiving Surprise?"

ES Morning Update November 17th 2017

0

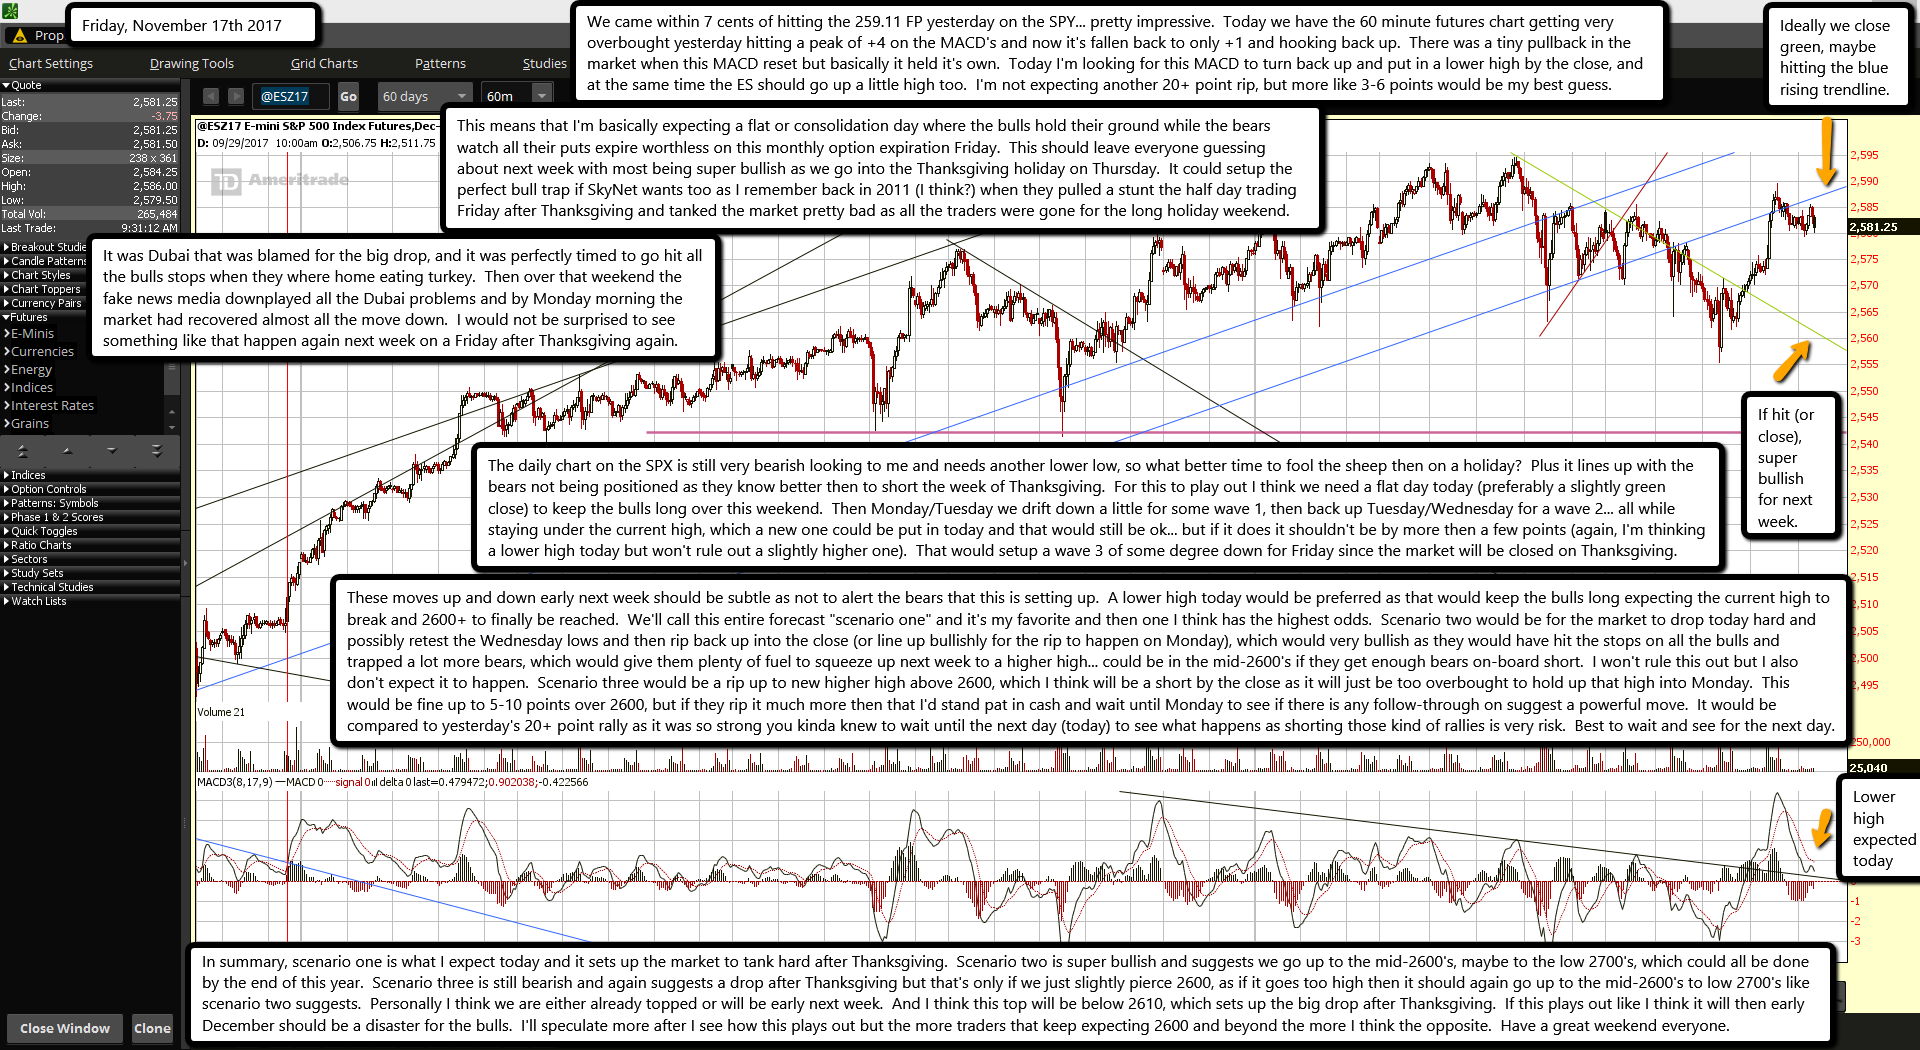
We came within 7 cents of hitting the 259.11 FP yesterday on the SPY... pretty impressive.  Today we have the 60 minute futures chart getting very overbought yesterday hitting a peak of +4 on the MACD's and now it's fallen back to only +1 and hooking back up.  There was a tiny pullback in the market when this MACD reset but basically it held it's own.  Today I'm looking for this MACD to turn back up and put in a lower high by the close, and at the same time the ES should go up a little high too.  I'm not expecting another 20+ point rip, but more like 3-6 points would be my best guess.

This means that I'm basically expecting a flat or consolidation day where the bulls hold their ground while the bears watch all their puts expire worthless on this monthly option expiration Friday.  This should leave everyone guessing about next week with most being super bullish as we go into the Thanksgiving holiday on Thursday.  It could setup the perfect bull trap if SkyNet wants too as I remember back in 2011 (I think?) when they pulled a stunt the half day trading Friday after Thanksgiving and tanked the market pretty bad as all the traders were gone for the long holiday weekend.

It was Dubai that was blamed for the big drop, and it was perfectly timed to go hit all the bulls stops when they where home eating turkey.  Then over that weekend the fake news media downplayed all the Dubai problems and by Monday morning the market had recovered almost all the move down.  I would not be surprised to see something like that happen again next week on a Friday after Thanksgiving again.

The daily chart on the SPX is still very bearish looking to me and needs another lower low, so what better time to fool the sheep then on a holiday?  Plus it lines up with the bears not being positioned as they know better then to short the week of Thanksgiving.  For this to play out I think we need a flat day today (preferably a slightly green close) to keep the bulls long over this weekend.  Then Monday/Tuesday we drift down a little for some wave 1, then back up Tuesday/Wednesday for a wave 2... all while staying under the current high, which a new one could be put in today and that would still be ok... but if it does it shouldn't be by more then a few points (again, I'm thinking a lower high today but won't rule out a slightly higher one).  That would setup a wave 3 of some degree down for Friday since the market will be closed on Thanksgiving.

These moves up and down early next week should be subtle as not to alert the bears that this is setting up.  A lower high today would be preferred as that would keep the bulls long expecting the current high to break and 2600+ to finally be reached.  We'll call this entire forecast "scenario one" and it's my favorite and then one I think has the highest odds.  Scenario two would be for the market to drop today hard and possibly retest the Wednesday lows and then rip back up into the close (or line up bullishly for the rip to happen on Monday), which would very bullish as they would have hit the stops on all the bulls and trapped a lot more bears, which would give them plenty of fuel to squeeze up next week to a higher high... could be in the mid-2600's if they get enough bears on-board short.  I won't rule this out but I also don't expect it to happen.  Scenario three would be a rip up to new higher high above 2600, which I think will be a short by the close as it will just be too overbought to hold up that high into Monday.  This would be fine up to 5-10 points over 2600, but if they rip it much more then that I'd stand pat in cash and wait until Monday to see if there is any follow-through on suggest a powerful move.  It would be compared to yesterday's 20+ point rally as it was so strong you kinda knew to wait until the next day (today) to see what happens as shorting those kind of rallies is very risk.  Best to wait and see for the next day.

In summary, scenario one is what I expect today and it sets up the market to tank hard after Thanksgiving.  Scenario two is super bullish and suggests we go up to the mid-2600's, maybe to the low 2700's, which could all be done by the end of this year.  Scenario three is still bearish and again suggests a drop after Thanksgiving but that's only if we just slightly pierce 2600, as if it goes too high then it should again go up to the mid-2600's to low 2700's like scenario two suggests.  Personally I think we are either already topped or will be early next week.  And I think this top will be below 2610, which sets up the big drop after Thanksgiving.  If this plays out like I think it will then early December should be a disaster for the bulls.  I'll speculate more after I see how this plays out but the more traders that keep expecting 2600 and beyond the more I think the opposite.  Have a great weekend everyone.

ES Morning Update November 16th 2017

0

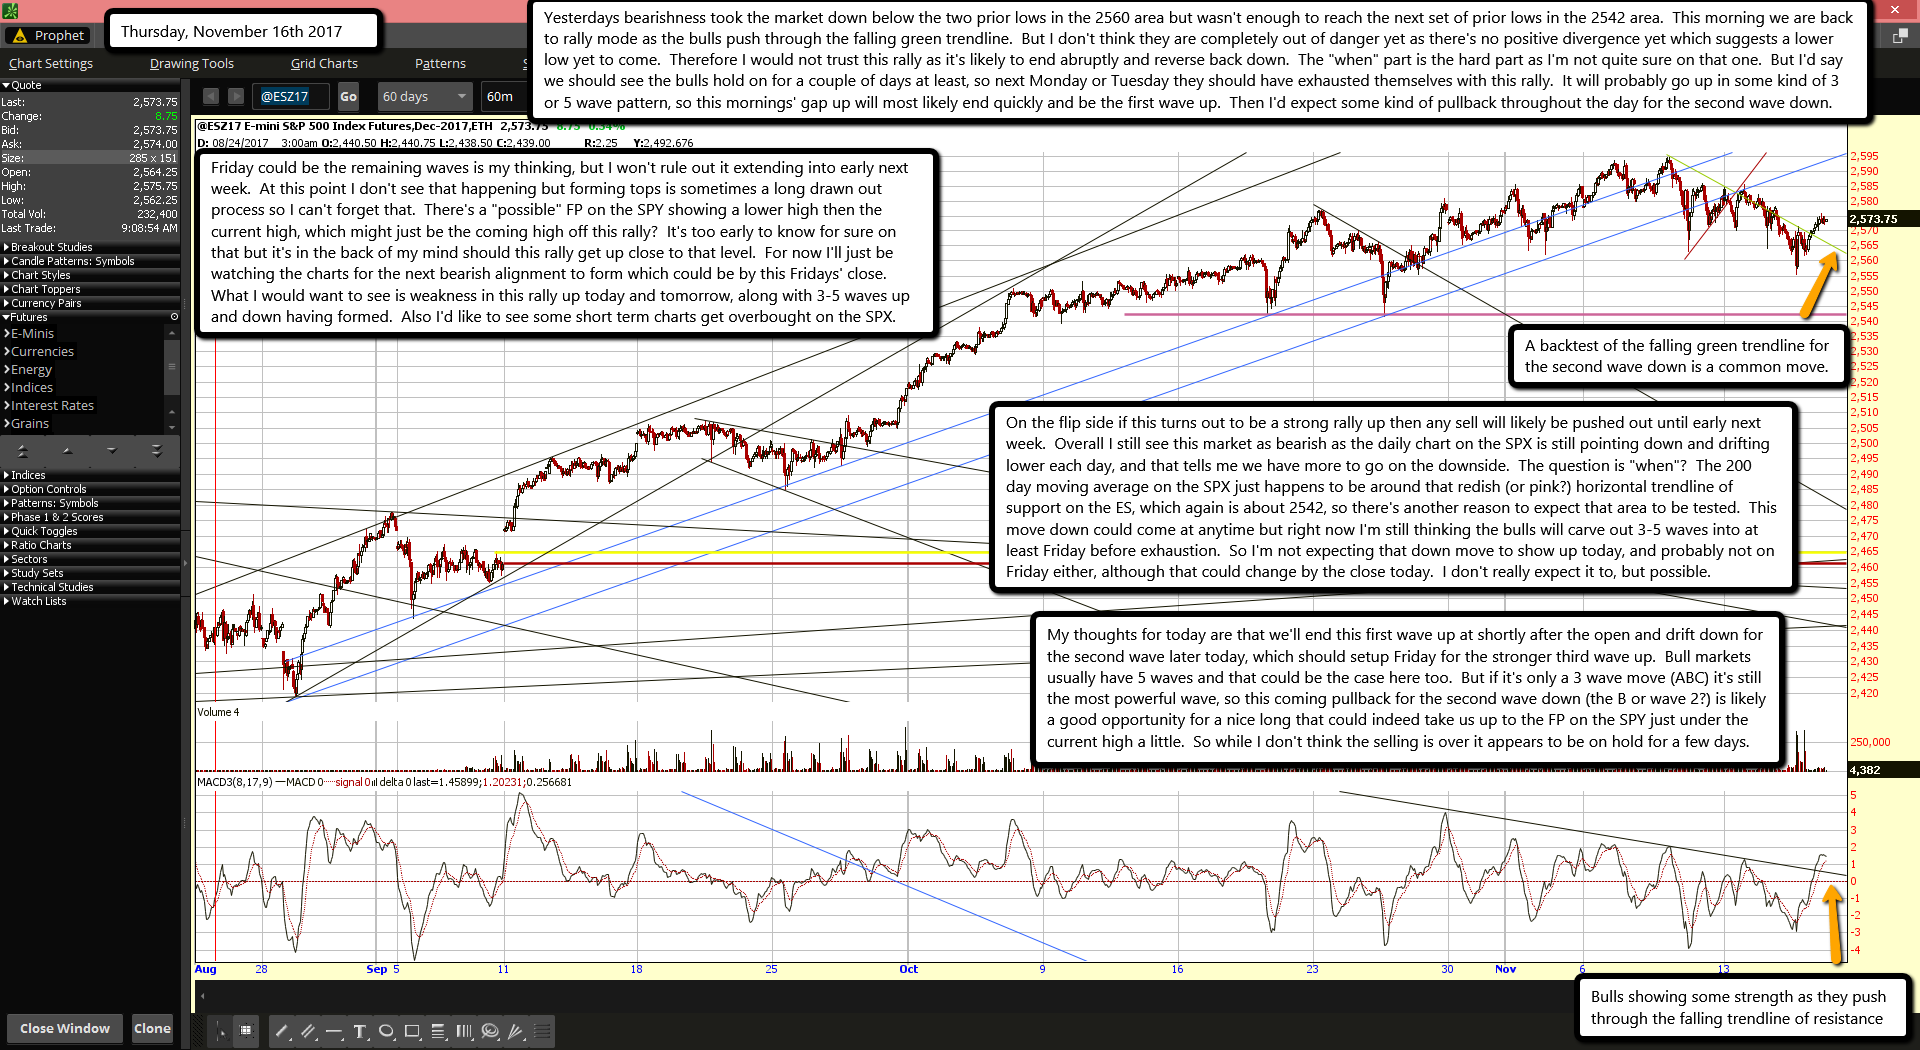
Yesterdays bearishness took the market down below the two prior lows in the 2560 area but wasn't enough to reach the next set of prior lows in the 2542 area.  This morning we are back to rally mode as the bulls push through the falling green trendline.  But I don't think they are completely out of danger yet as there's no positive divergence yet which suggests a lower low yet to come.  Therefore I would not trust this rally as it's likely to end abruptly and reverse back down.  The "when" part is the hard part as I'm not quite sure on that one.  But I'd say we should see the bulls hold on for a couple of days at least, so next Monday or Tuesday they should have exhausted themselves with this rally.  It will probably go up in some kind of 3 or 5 wave pattern, so this mornings' gap up will most likely end quickly and be the first wave up.  Then I'd expect some kind of pullback throughout the day for the second wave down.

Friday could be the remaining waves is my thinking, but I won't rule out it extending into early next week.  At this point I don't see that happening but forming tops is sometimes a long drawn out process so I can't forget that.  There's a "possible" FP on the SPY showing a lower high then the current high, which might just be the coming high off this rally?  It's too early to know for sure on that but it's in the back of my mind should this rally get up close to that level.  For now I'll just be watching the charts for the next bearish alignment to form which could be by this Fridays' close.  What I would want to see is weakness in this rally up today and tomorrow, along with 3-5 waves up and down having formed.  Also I'd like to see some short term charts get overbought on the SPX.

On the flip side if this turns out to be a strong rally up then any sell will likely be pushed out until early next week.  Overall I still see this market as bearish as the daily chart on the SPX is still pointing down and drifting lower each day, and that tells me we have more to go on the downside.  The question is "when"?  The 200 day moving average on the SPX just happens to be around that redish (or pink?) horizontal trendline of support on the ES, which again is about 2542, so there's another reason to expect that area to be tested.  This move down could come at anytime but right now I'm still thinking the bulls will carve out 3-5 waves into at least Friday before exhaustion.  So I'm not expecting that down move to show up today, and probably not on Friday either, although that could change by the close today.  I don't really expect it to, but possible.

My thoughts for today are that we'll end this first wave up at shortly after the open and drift down for the second wave later today, which should setup Friday for the stronger third wave up.  Bull markets usually have 5 waves and that could be the case here too.  But if it's only a 3 wave move (ABC) it's still the most powerful wave, so this coming pullback for the second wave down (the B or wave 2?) is likely a good opportunity for a nice long that could indeed take us up to the FP on the SPY just under the current high a little.  So while I don't think the selling is over it appears to be on hold for a few days.

ES Morning Update November 15th 2017

0

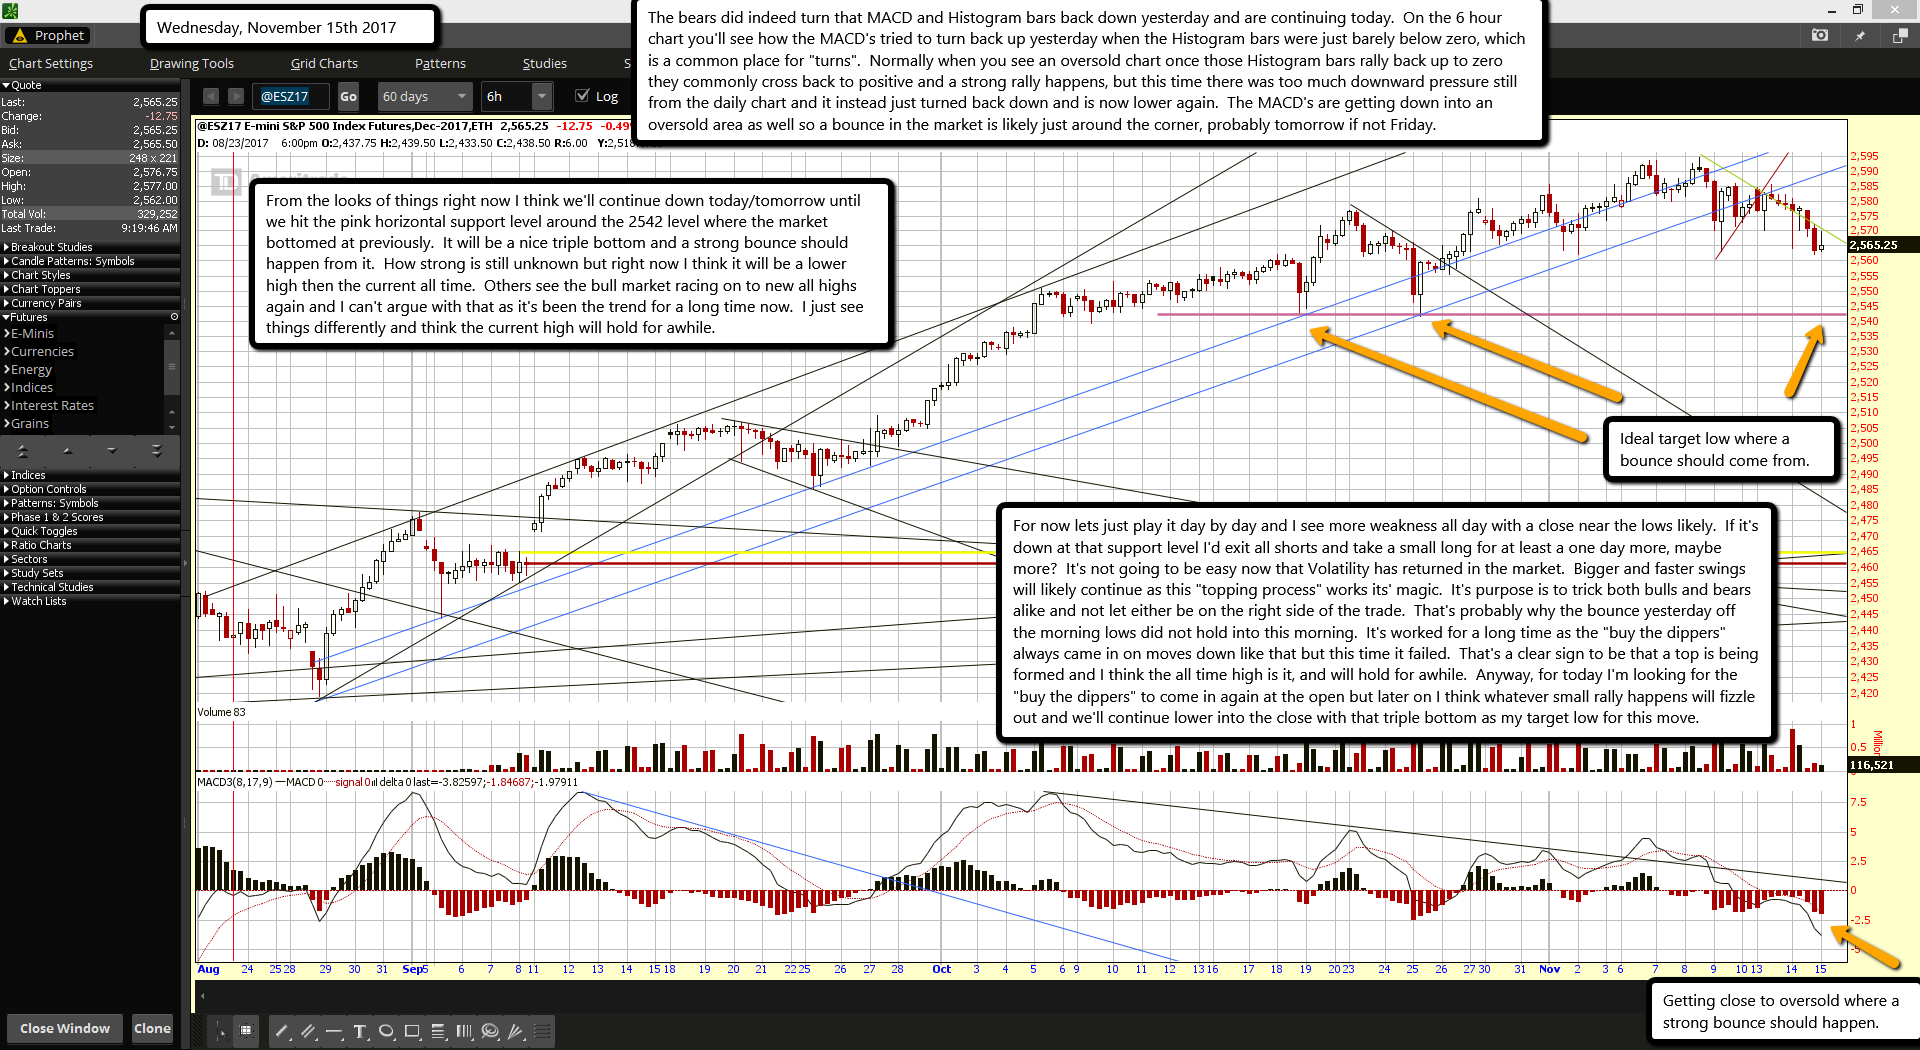
The bears did indeed turn that MACD and Histogram bars back down yesterday and are continuing today.  On the 6 hour chart you'll see how the MACD's tried to turn back up yesterday when the Histogram bars were just barely below zero, which is a common place for "turns".  Normally when you see an oversold chart once those Histogram bars rally back up to zero they commonly cross back to positive and a strong rally happens, but this time there was too much downward pressure still from the daily chart and it instead just turned back down and is now lower again.  The MACD's are getting down into an oversold area as well so a bounce in the market is likely just around the corner, probably tomorrow if not Friday.

From the looks of things right now I think we'll continue down today/tomorrow until we hit the pink horizontal support level around the 2542 level where the market bottomed at previously.  It will be a nice triple bottom and a strong bounce should happen from it.  How strong is still unknown but right now I think it will be a lower high then the current all time.  Others see the bull market racing on to new all highs again and I can't argue with that as it's been the trend for a long time now.  I just see things differently and think the current high will hold for awhile.

For now lets just play it day by day and I see more weakness all day with a close near the lows likely.  If it's down at that support level I'd exit all shorts and take a small long for at least a one day more, maybe more?  It's not going to be easy now that Volatility has returned in the market.  Bigger and faster swings will likely continue as this "topping process" works its' magic.  It's purpose is to trick both bulls and bears alike and not let either be on the right side of the trade.  That's probably why the bounce yesterday off the morning lows did not hold into this morning.  It's worked for a long time as the "buy the dippers" always came in on moves down like that but this time it failed.  That's a clear sign to be that a top is being formed and I think the all time high is it, and will hold for awhile.  Anyway, for today I'm looking for the "buy the dippers" to come in again at the open but later on I think whatever small rally happens will fizzle out and we'll continue lower into the close with that triple bottom as my target low for this move.

ES Morning Update November 14th 2017

0

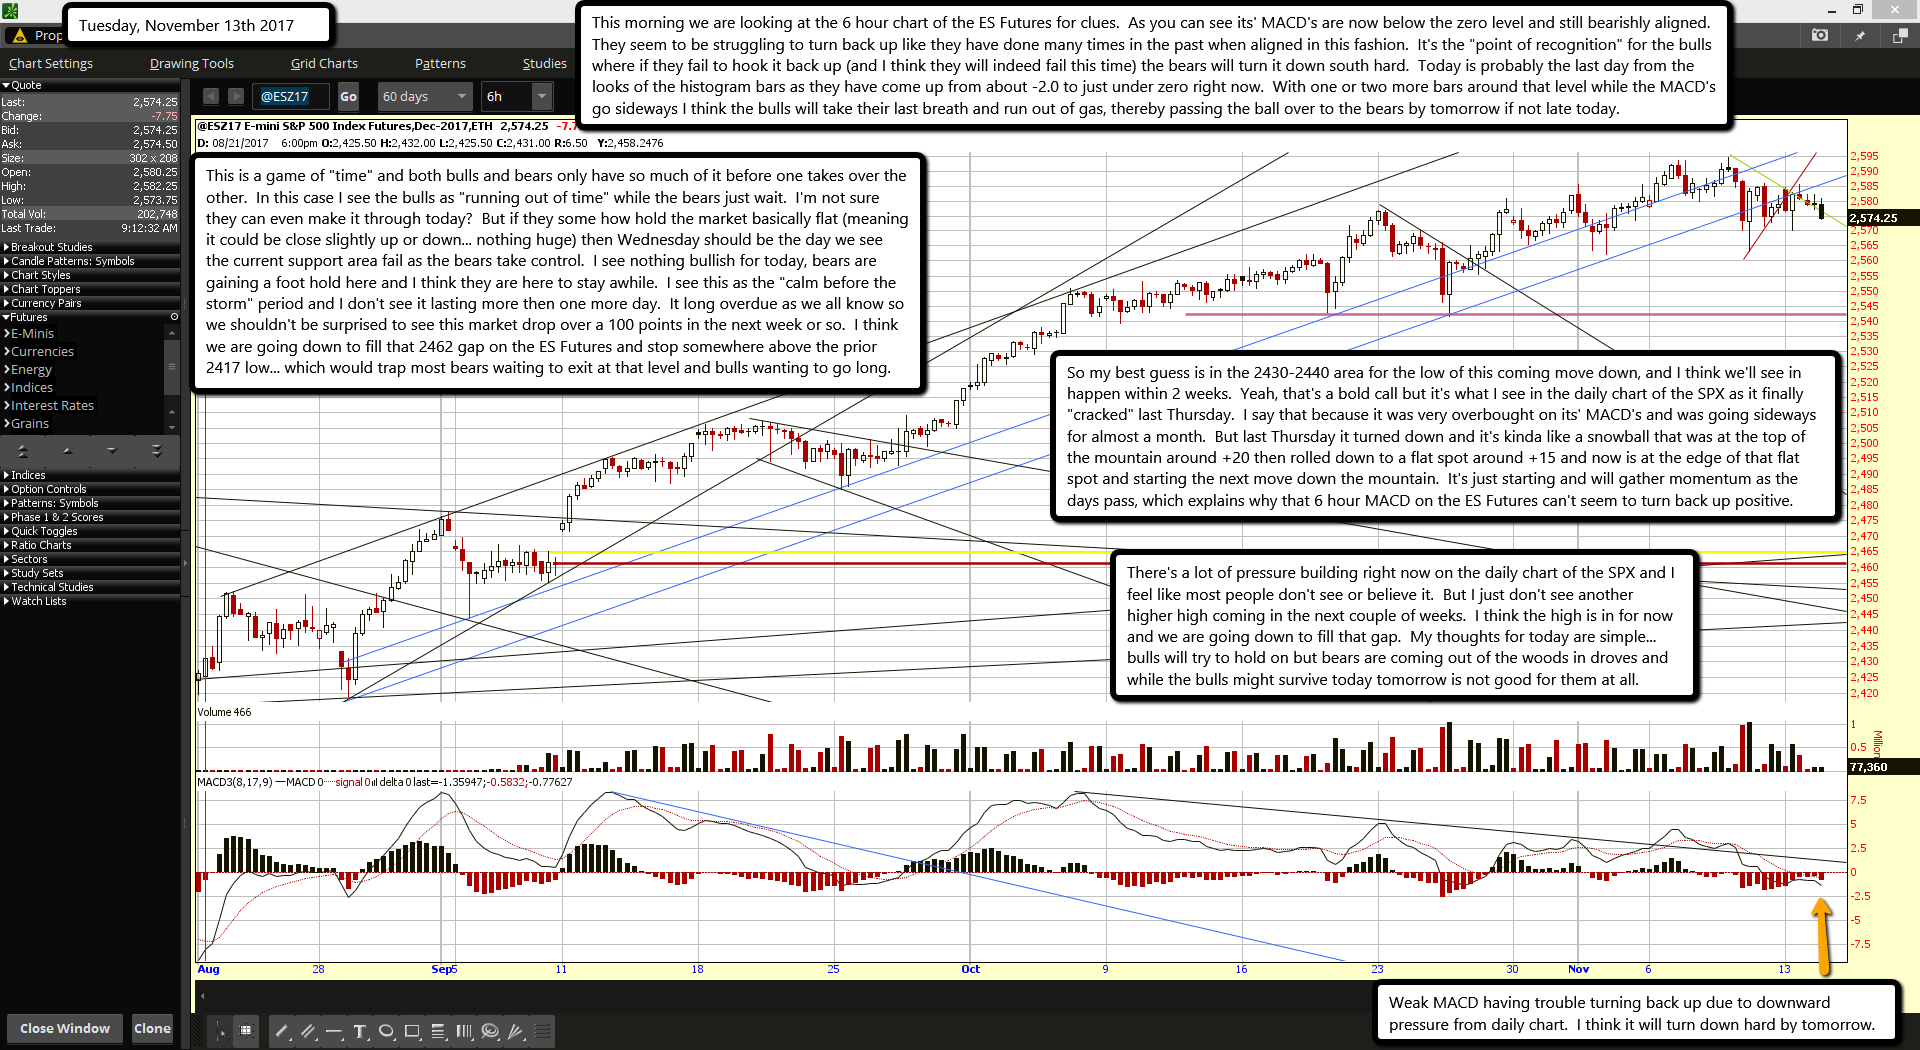
This morning we are looking at the 6 hour chart of the ES Futures for clues.  As you can see its' MACD's are now below the zero level and still bearishly aligned.  They seem to be struggling to turn back up like they have done many times in the past when aligned in this fashion.  It's the "point of recognition" for the bulls where if they fail to hook it back up (and I think they will indeed fail this time) the bears will turn it down south hard.  Today is probably the last day from the looks of the histogram bars as they have come up from about -2.0 to just under zero right now.  With one or two more bars around that level while the MACD's go sideways I think the bulls will take their last breath and run out of gas, thereby passing the ball over to the bears by tomorrow if not late today.

This is a game of "time" and both bulls and bears only have so much of it before one takes over the other.  In this case I see the bulls as "running out of time" while the bears just wait.  I'm not sure they can even make it through today?  But if they some how hold the market basically flat (meaning it could be close slightly up or down... nothing huge) then Wednesday should be the day we see the current support area fail as the bears take control.  I see nothing bullish for today, bears are gaining a foot hold here and I think they are here to stay awhile.  I see this as the "calm before the storm" period and I don't see it lasting more then one more day.  It long overdue as we all know so we shouldn't be surprised to see this market drop over a 100 points in the next week or so.  I think we are going down to fill that 2462 gap on the ES Futures and stop somewhere above the prior 2417 low... which would trap most bears waiting to exit at that level and bulls wanting to go long.

So my best guess is in the 2430-2440 area for the low of this coming move down, and I think we'll see in happen within 2 weeks.  Yeah, that's a bold call but it's what I see in the daily chart of the SPX as it finally "cracked" last Thursday.  I say that because it was very overbought on its' MACD's and was going sideways for almost a month.  But last Thursday it turned down and it's kinda like a snowball that was at the top of the mountain around +20 then rolled down to a flat spot around +15 and now is at the edge of that flat spot and starting the next move down the mountain.  It's just starting and will gather momentum as the days pass, which explains why that 6 hour MACD on the ES Futures can't seem to turn back up positive.

There's a lot of pressure building right now on the daily chart of the SPX and I feel like most people don't see or believe it.  But I just don't see another higher high coming in the next couple of weeks.  I think the high is in for now and we are going down to fill that gap.  My thoughts for today are simple... bulls will try to hold on but bears are coming out of the woods in droves and while the bulls might survive today tomorrow is not good for them at all.

ES Morning Update November 13th 2017

0

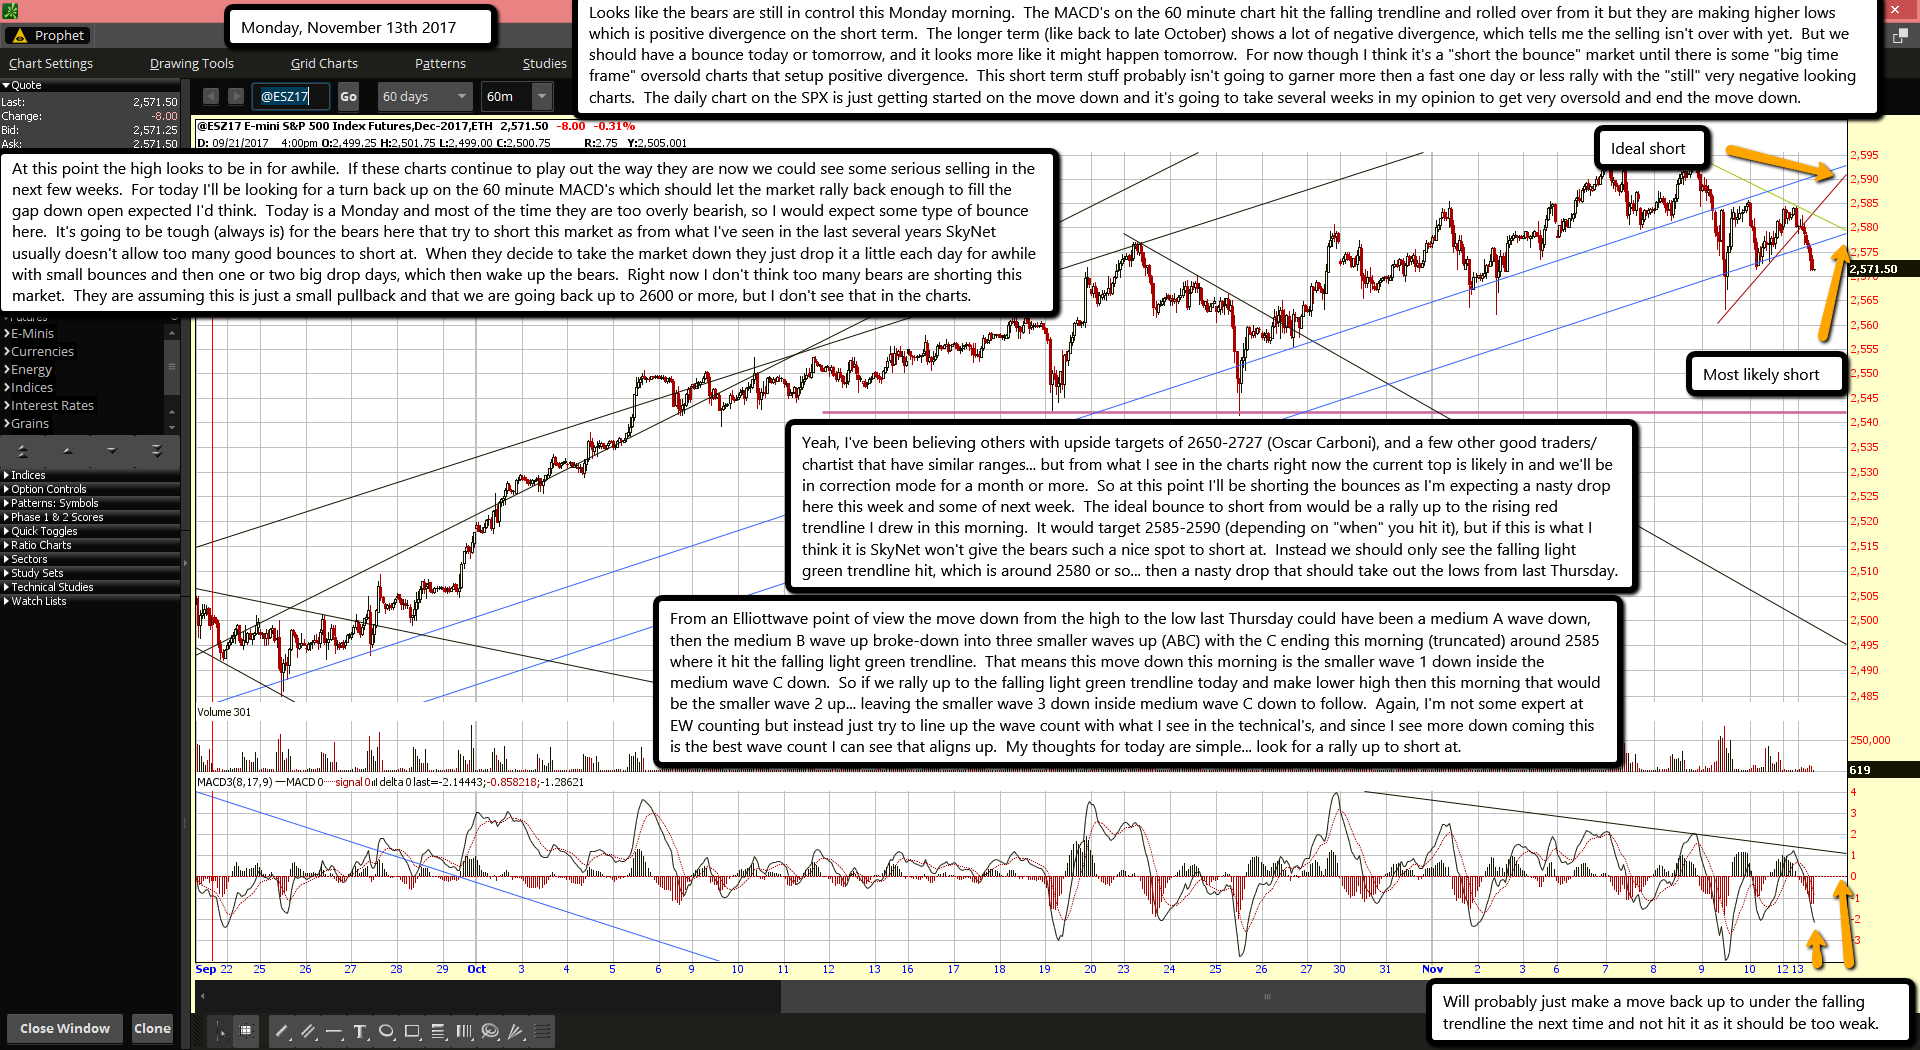
Looks like the bears are still in control this Monday morning.  The MACD's on the 60 minute chart hit the falling trendline and rolled over from it but they are making higher lows which is positive divergence on the short term.  The longer term (like back to late October) shows a lot of negative divergence, which tells me the selling isn't over with yet.  But we should have a bounce today or tomorrow, and it looks more like it might happen tomorrow.  For now though I think it's a "short the bounce" market until there is some "big time frame" oversold charts that setup positive divergence.  This short term stuff probably isn't going to garner more then a fast one day or less rally with the "still" very negative looking charts.  The daily chart on the SPX is just getting started on the move down and it's going to take several weeks in my opinion to get very oversold and end the move down.

At this point the high looks to be in for awhile.  If these charts continue to play out the way they are now we could see some serious selling in the next few weeks.  For today I'll be looking for a turn back up on the 60 minute MACD's which should let the market rally back enough to fill the gap down open expected I'd think.  Today is a Monday and most of the time they are too overly bearish, so I would expect some type of bounce here.  It's going to be tough (always is) for the bears here that try to short this market as from what I've seen in the last several years SkyNet usually doesn't allow too many good bounces to short at.  When they decide to take the market down they just drop it a little each day for awhile with small bounces and then one or two big drop days, which then wake up the bears.  Right now I don't think too many bears are shorting this market.  They are assuming this is just a small pullback and that we are going back up to 2600 or more, but I don't see that in the charts.

Yeah, I've been believing others with upside targets of 2650-2727 (Oscar Carboni), and a few other good traders/chartist that have similar ranges... but from what I see in the charts right now the current top is likely in and we'll be in correction mode for a month or more.  So at this point I'll be shorting the bounces as I'm expecting a nasty drop here this week and some of next week.  The ideal bounce to short from would be a rally up to the rising red trendline I drew in this morning.  It would target 2585-2590 (depending on "when" you hit it), but if this is what I think it is SkyNet won't give the bears such a nice spot to short at.  Instead we should only see the falling light green trendline hit, which is around 2580 or so... then a nasty drop that should take out the lows from last Thursday.

From an Elliottwave point of view the move down from the high to the low last Thursday could have been a medium A wave down, then the medium B wave up broke-down into three smaller waves up (ABC) with the C ending this morning (truncated) around 2585 where it hit the falling light green trendline.  That means this move down this morning is the smaller wave 1 down inside the medium wave C down.  So if we rally up to the falling light green trendline today and make lower high then this morning that would be the smaller wave 2 up... leaving the smaller wave 3 down inside medium wave C down to follow.  Again, I'm not some expert at EW counting but instead just try to line up the wave count with what I see in the technical's, and since I see more down coming this is the best wave count I can see that aligns up.  My thoughts for today are simple... look for a rally up to short at.

ES Morning Update November 10th 2017

0

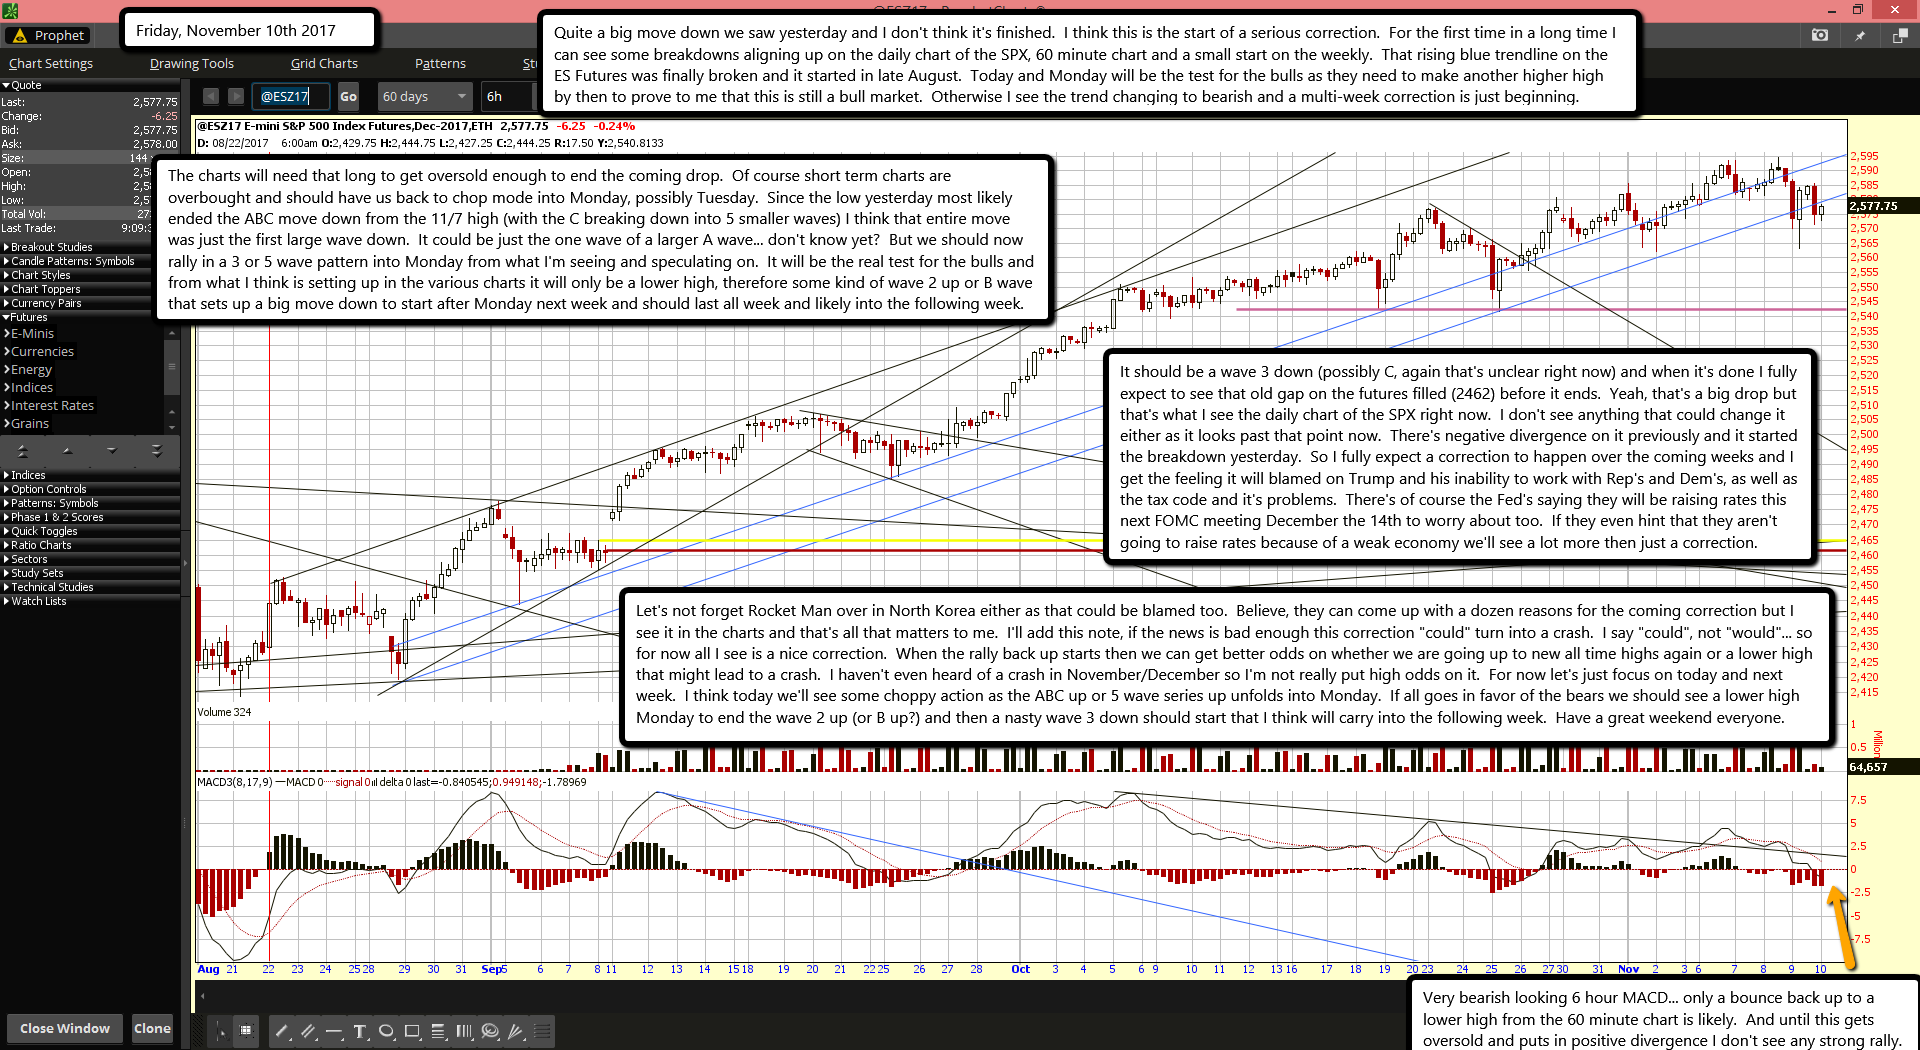
Quite a big move down we saw yesterday and I don't think it's finished.  I think this is the start of a serious correction.  For the first time in a long time I can see some breakdowns aligning up on the daily chart of the SPX, 60 minute chart and a small start on the weekly.  That rising blue trendline on the ES Futures was finally broken and it started in late August.  Today and Monday will be the test for the bulls as they need to make another higher high by then to prove to me that this is still a bull market.  Otherwise I see the trend changing to bearish and a multi-week correction is just beginning.

The charts will need that long to get oversold enough to end the coming drop.  Of course short term charts are overbought and should have us back to chop mode into Monday, possibly Tuesday.  Since the low yesterday most likely ended the ABC move down from the 11/7 high (with the C breaking down into 5 smaller waves) I think that entire move was just the first large wave down.  It could be just the one wave of a larger A wave... don't know yet?  But we should now rally in a 3 or 5 wave pattern into Monday from what I'm seeing and speculating on.  It will be the real test for the bulls and from what I think is setting up in the various charts it will only be a lower high, therefore some kind of wave 2 up or B wave that sets up a big move down to start after Monday next week and should last all week and likely into the following week.

It should be a wave 3 down (possibly C, again that's unclear right now) and when it's done I fully expect to see that old gap on the futures filled (2462) before it ends.  Yeah, that's a big drop but that's what I see the daily chart of the SPX right now.  I don't see anything that could change it either as it looks past that point now.  There's negative divergence on it previously and it started the breakdown yesterday.  So I fully expect a correction to happen over the coming weeks and I get the feeling it will blamed on Trump and his inability to work with Rep's and Dem's, as well as the tax code and it's problems.  There's of course the Fed's saying they will be raising rates this next FOMC meeting December the 14th to worry about too.  If they even hint that they aren't going to raise rates because of a weak economy we'll see a lot more then just a correction.

Let's not forget Rocket Man over in North Korea either as that could be blamed too.  Believe, they can come up with a dozen reasons for the coming correction but I see it in the charts and that's all that matters to me.  I'll add this note, if the news is bad enough this correction "could" turn into a crash.  I say "could", not "would"... so for now all I see is a nice correction.  When the rally back up starts then we can get better odds on whether we are going up to new all time highs again or a lower high that might lead to a crash.  I haven't even heard of a crash in November/December so I'm not really put high odds on it.  For now let's just focus on today and next week.  I think today we'll see some choppy action as the ABC up or 5 wave series up unfolds into Monday.  If all goes in favor of the bears we should see a lower high Monday to end the wave 2 up (or B up?) and then a nasty wave 3 down should start that I think will carry into the following week.  Have a great weekend everyone.

ES Morning Update November 9th 2017

0

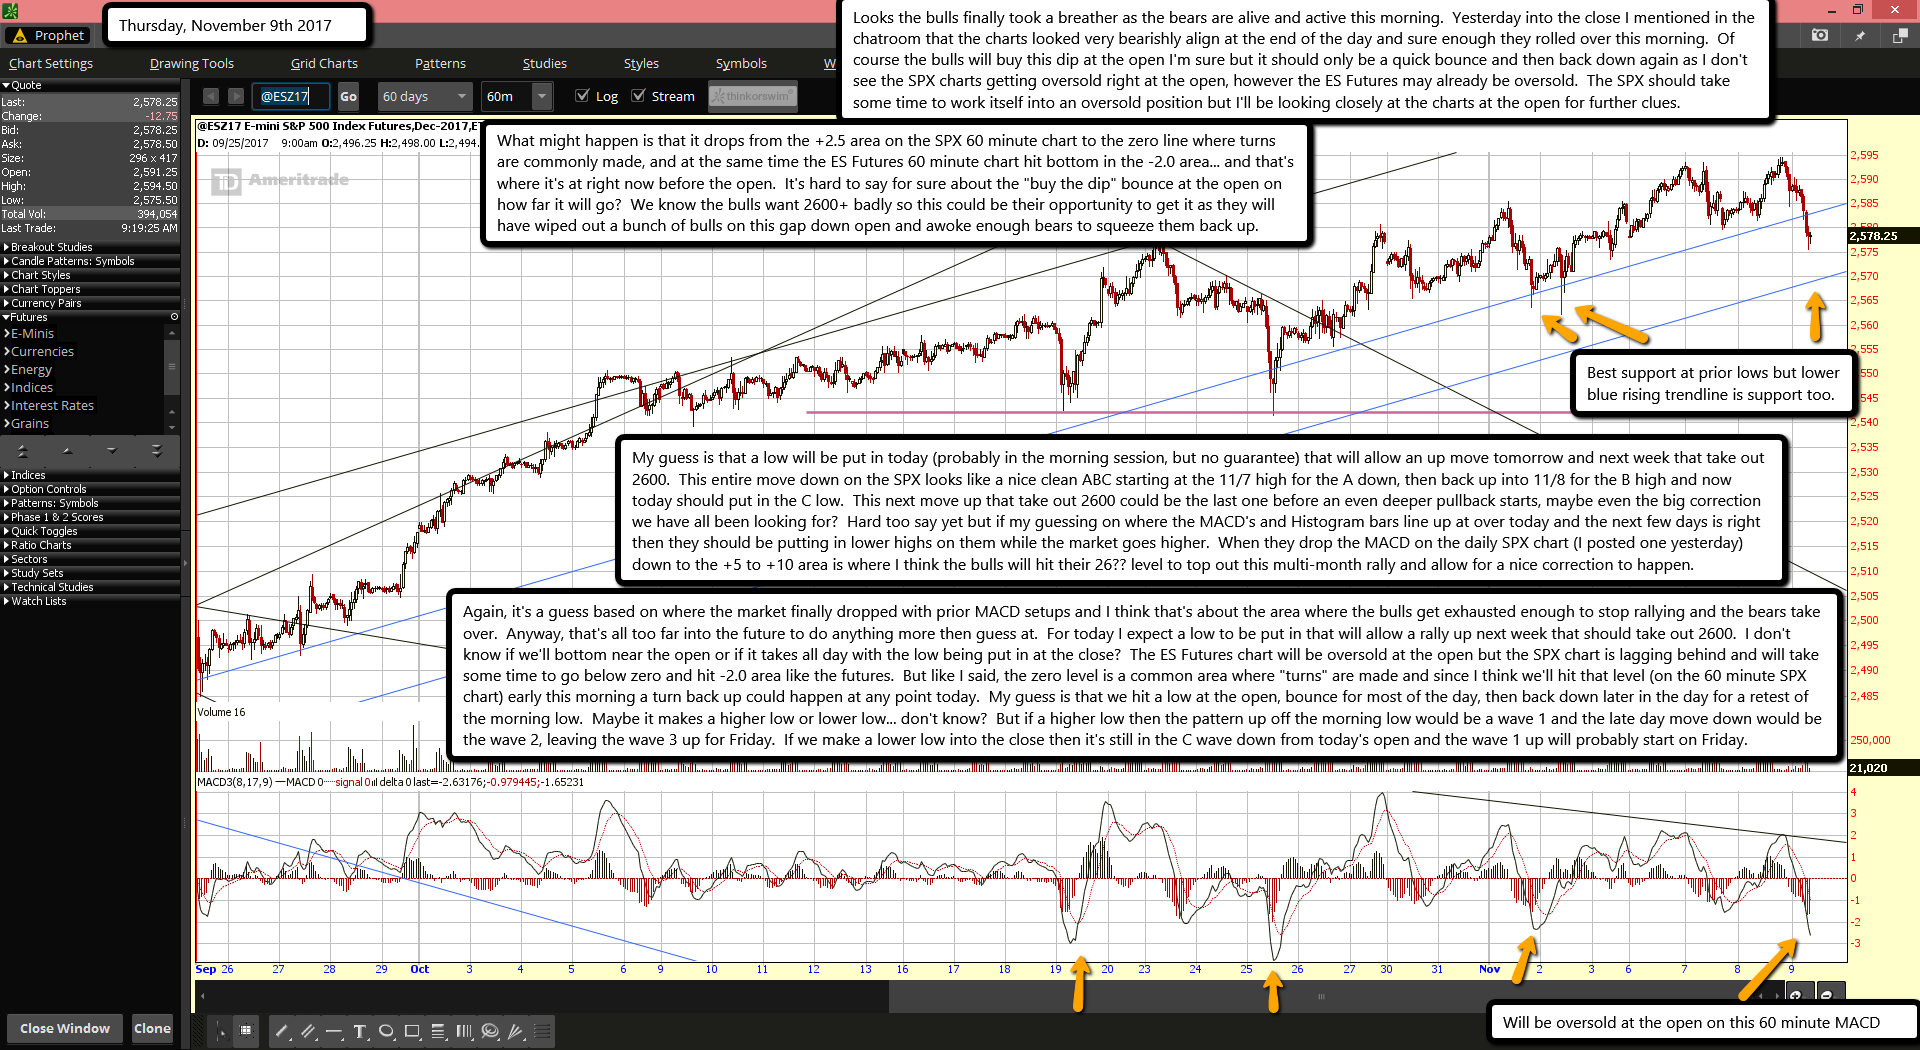
Looks the bulls finally took a breather as the bears are alive and active this morning.  Yesterday into the close I mentioned in the chatroom that the charts looked very bearishly align at the end of the day and sure enough they rolled over this morning.  Of course the bulls will buy this dip at the open I'm sure but it should only be a quick bounce and then back down again as I don't see the SPX charts getting oversold right at the open, however the ES Futures may already be oversold.  The SPX should take some time to work itself into an oversold position but I'll be looking closely at the charts at the open for further clues.

What might happen is that it drops from the +2.5 area on the SPX 60 minute chart to the zero line where turns are commonly made, and at the same time the ES Futures 60 minute chart hit bottom in the -2.0 area... and that's where it's at right now before the open.  It's hard to say for sure about the "buy the dip" bounce at the open on how far it will go?  We know the bulls want 2600+ badly so this could be their opportunity to get it as they will have wiped out a bunch of bulls on this gap down open and awoke enough bears to squeeze them back up.

My guess is that a low will be put in today (probably in the morning session, but no guarantee) that will allow an up move tomorrow and next week that take out 2600.  This entire move down on the SPX looks like a nice clean ABC starting at the 11/7 high for the A down, then back up into 11/8 for the B high and now today should put in the C low.  This next move up that take out 2600 could be the last one before an even deeper pullback starts, maybe even the big correction we have all been looking for?  Hard too say yet but if my guessing on where the MACD's and Histogram bars line up at over today and the next few days is right then they should be putting in lower highs on them while the market goes higher.  When they drop the MACD on the daily SPX chart (I posted one yesterday) down to the +5 to +10 area is where I think the bulls will hit their 26?? level to top out this multi-month rally and allow for a nice correction to happen.

Again, it's a guess based on where the market finally dropped with prior MACD setups and I think that's about the area where the bulls get exhausted enough to stop rallying and the bears take over.  Anyway, that's all too far into the future to do anything more then guess at.  For today I expect a low to be put in that will allow a rally up next week that should take out 2600.  I don't know if we'll bottom near the open or if it takes all day with the low being put in at the close?  The ES Futures chart will be oversold at the open but the SPX chart is lagging behind and will take some time to go below zero and hit -2.0 area like the futures.  But like I said, the zero level is a common area where "turns" are made and since I think we'll hit that level (on the 60 minute SPX chart) early this morning a turn back up could happen at any point today.  My guess is that we hit a low at the open, bounce for most of the day, then back down later in the day for a retest of the morning low.  Maybe it makes a higher low or lower low... don't know?  But if a higher low then the pattern up off the morning low would be a wave 1 and the late day move down would be the wave 2, leaving the wave 3 up for Friday.  If we make a lower low into the close then it's still in the C wave down from today's open and the wave 1 up will probably start on Friday.

s2Member®