Wednesday, August 26, 2026
Home Blog Page 61

ES Morning Update June 9th 2017

0

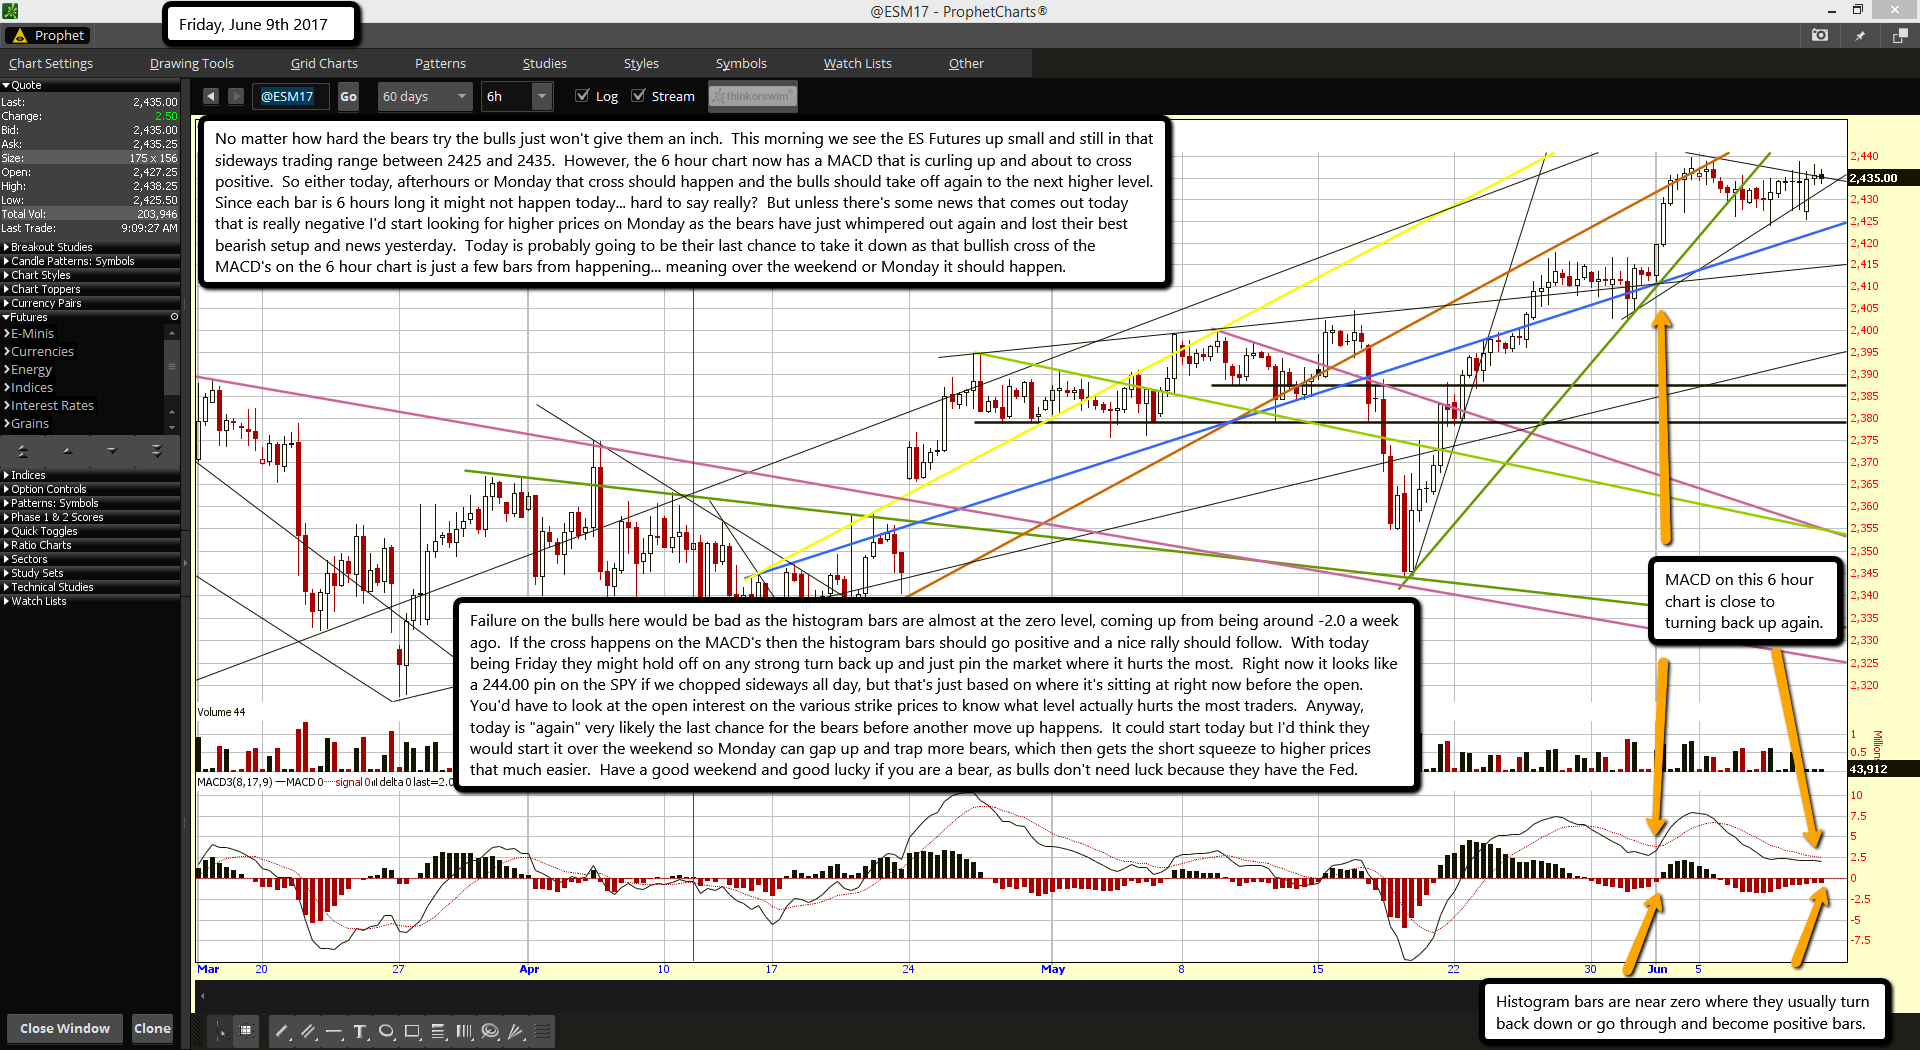
No matter how hard the bears try the bulls just won't give them an inch.  This morning we see the ES Futures up small and still in that sideways trading range between 2425 and 2435.  However, the 6 hour chart now has a MACD that is curling up and about to cross positive.  So either today, afterhours or Monday that cross should happen and the bulls should take off again to the next higher level.  Since each bar is 6 hours long it might not happen today... hard to say really?  But unless there's some news that comes out today that is really negative I'd start looking for higher prices on Monday as the bears have just whimpered out again and lost their best bearish setup and news yesterday.  Today is probably going to be their last chance to take it down as that bullish cross of the MACD's on the 6 hour chart is just a few bars from happening... meaning over the weekend or Monday it should happen.

Failure on the bulls here would be bad as the histogram bars are almost at the zero level, coming up from being around -2.0 a week ago.  If the cross happens on the MACD's then the histogram bars should go positive and a nice rally should follow.  With today being Friday they might hold off on any strong turn back up and just pin the market where it hurts the most.  Right now it looks like a 244.00 pin on the SPY if we chopped sideways all day, but that's just based on where it's sitting at right now before the open.  You'd have to look at the open interest on the various strike prices to know what level actually hurts the most traders.  Anyway, today is "again" very likely the last chance for the bears before another move up happens.  It could start today but I'd think they would start it over the weekend so Monday can gap up and trap more bears, which then gets the short squeeze to higher prices that much easier.  Have a good weekend and good lucky if you are a bear, as bulls don't need luck because they have the Fed.

ES Morning Update June 8th 2017

0

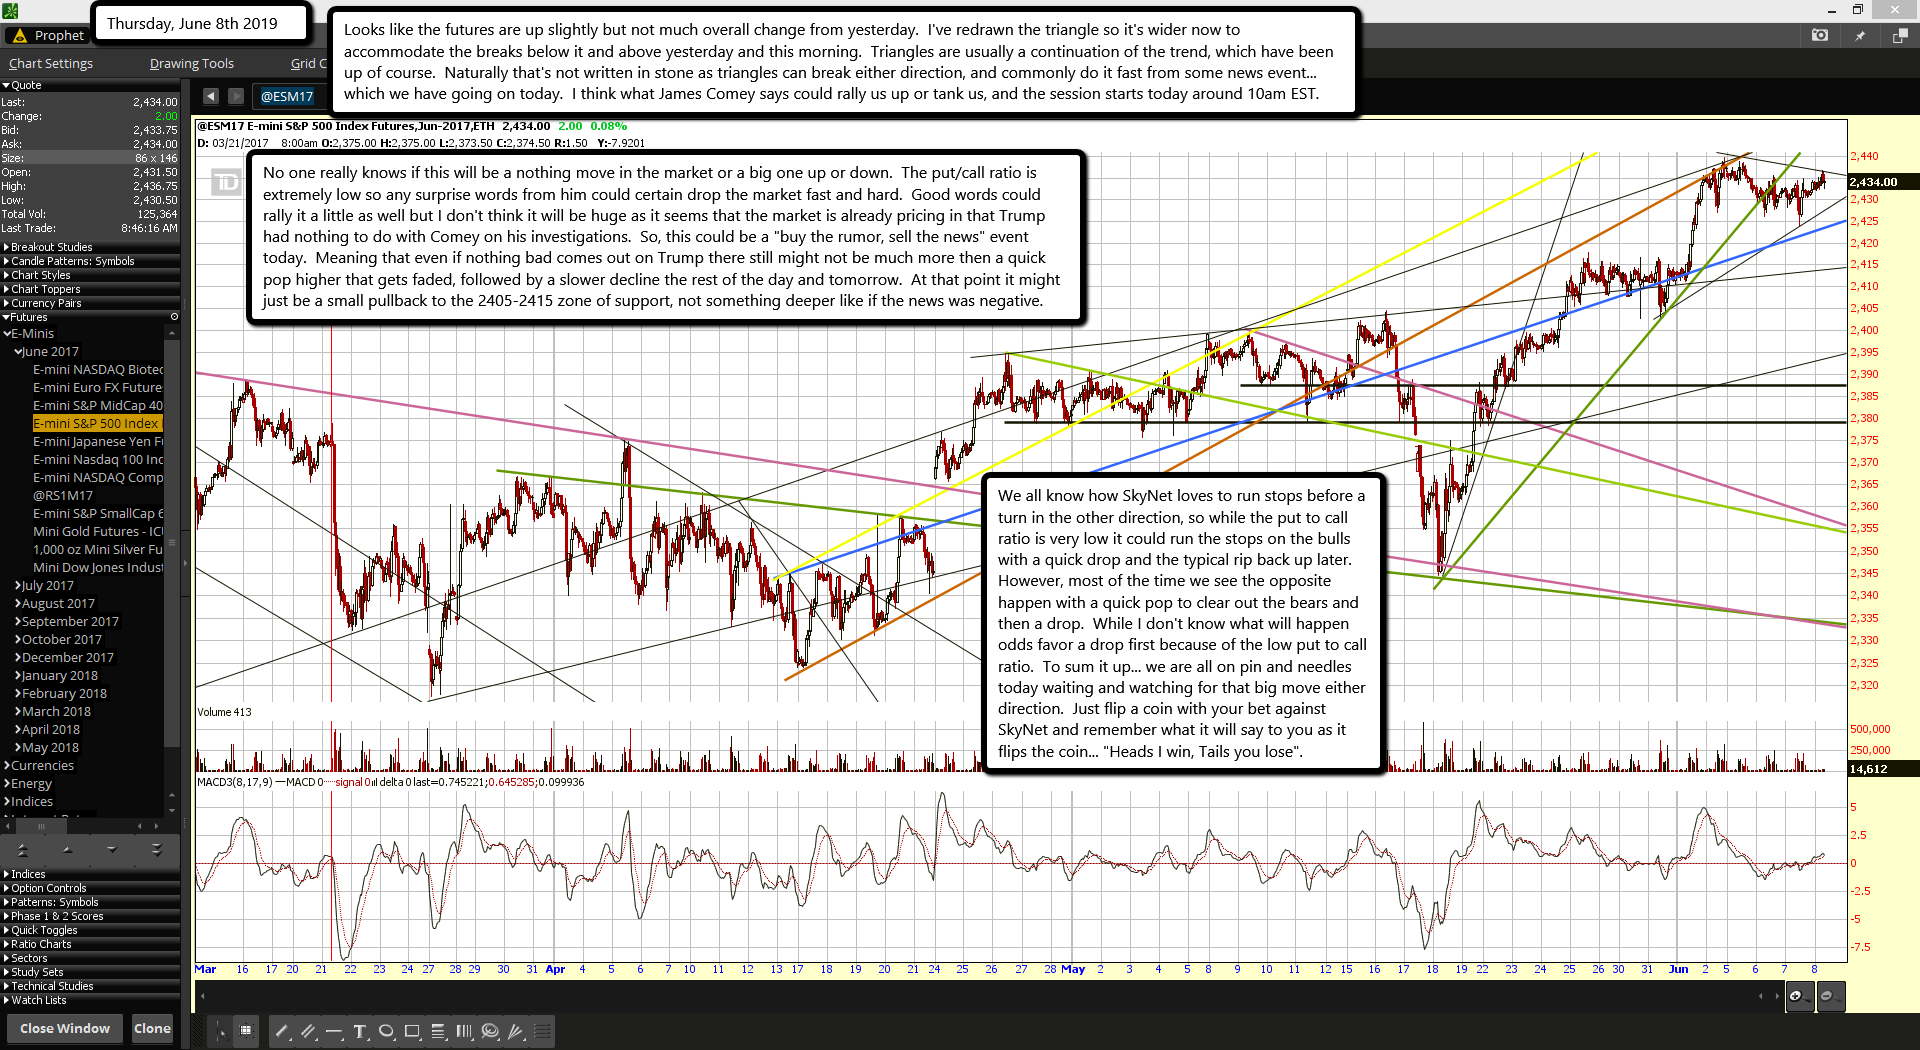
Looks like the futures are up slightly but not much overall change from yesterday.  I've redrawn the triangle so it's wider now to accommodate the breaks below it and above yesterday and this morning.  Triangles are usually a continuation of the trend, which have been up of course.  Naturally that's not written in stone as triangles can break either direction, and commonly do it fast from some news event... which we have going on today.  I think what James Comey says could rally us up or tank us, and the session starts today around 10am EST.

No one really knows if this will be a nothing move in the market or a big one up or down.  The put/call ratio is extremely low so any surprise words from him could certain drop the market fast and hard.  Good words could rally it a little as well but I don't think it will be huge as it seems that the market is already pricing in that Trump had nothing to do with Comey on his investigations.  So, this could be a "buy the rumor, sell the news" event today.  Meaning that even if nothing bad comes out on Trump there still might not be much more then a quick pop higher that gets faded, followed by a slower decline the rest of the day and tomorrow.  At that point it might just be a small pullback to the 2405-2415 zone of support, not something deeper like if the news was negative.

We all know how SkyNet loves to run stops before a turn in the other direction, so while the put to call ratio is very low it could run the stops on the bulls with a quick drop and the typical rip back up later.  However, most of the time we see the opposite happen with a quick pop to clear out the bears and then a drop.  While I don't know what will happen odds favor a drop first because of the low put to call ratio.  To sum it up... we are all on pin and needles today waiting and watching for that big move either direction.  Just flip a coin with your bet against SkyNet and remember what it will say to you as it flips the coin... "Heads I win, Tails you lose".

ES Morning Update June 7th 2017

0

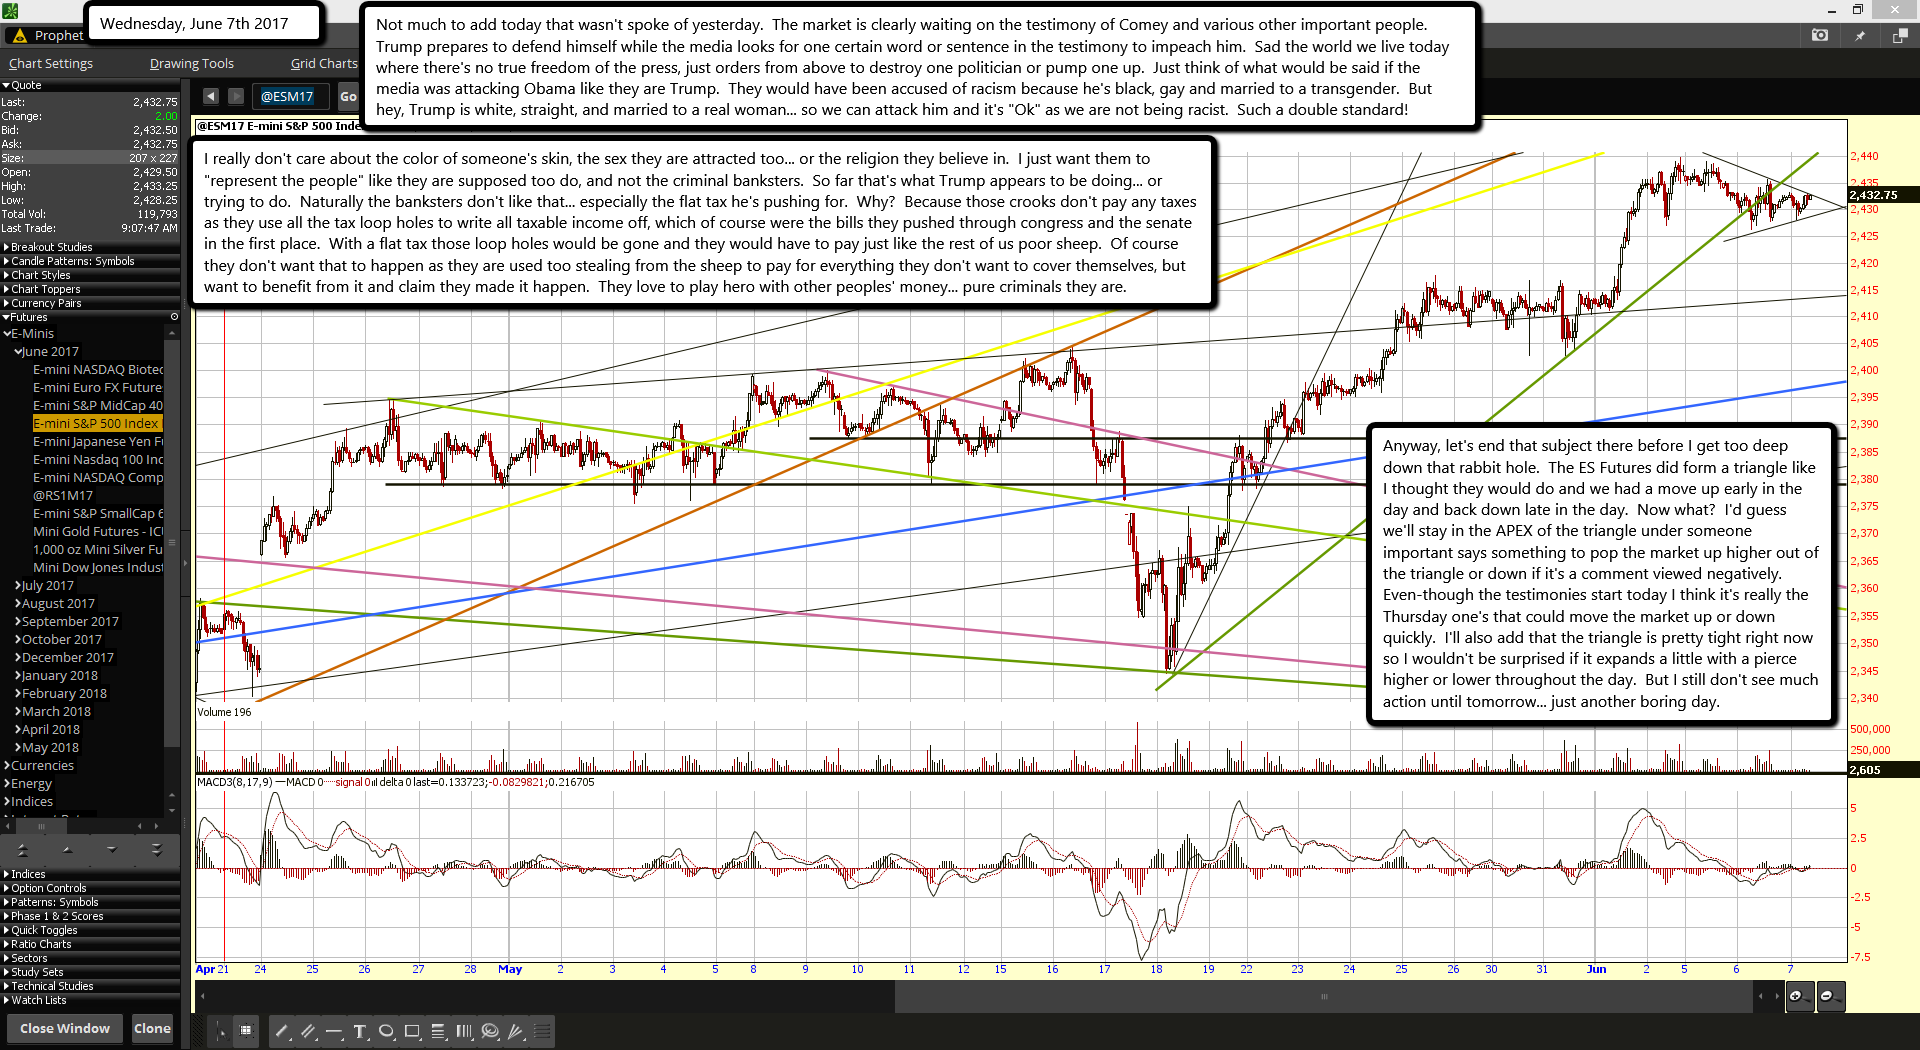
Not much to add today that wasn't spoke of yesterday.  The market is clearly waiting on the testimony of Comey and various other important people.  Trump prepares to defend himself while the media looks for one certain word or sentence in the testimony to impeach him.  Sad the world we live today where there's no true freedom of the press, just orders from above to destroy one politician or pump one up.  Just think of what would be said if the media was attacking Obama like they are Trump.  They would have been accused of racism because he's black, gay and married to a transgender.  But hey, Trump is white, straight, and married to a real woman... so we can attack him and it's "Ok" as we are not being racist.  Such a double standard!

I really don't care about the color of someone's skin, the sex they are attracted too... or the religion they believe in.  I just want them to "represent the people" like they are supposed too do, and not the criminal banksters.  So far that's what Trump appears to be doing... or trying to do.  Naturally the banksters don't like that... especially the flat tax he's pushing for.  Why?  Because those crooks don't pay any taxes as they use all the tax loop holes to write all taxable income off, which of course were the bills they pushed through congress and the senate in the first place.  With a flat tax those loop holes would be gone and they would have to pay just like the rest of us poor sheep.  Of course they don't want that to happen as they are used too stealing from the sheep to pay for everything they don't want to cover themselves, but want to benefit from it and claim they made it happen.  They love to play hero with other peoples' money... pure criminals they are.

Anyway, let's end that subject there before I get too deep down that rabbit hole.  The ES Futures did form a triangle like I thought they would do and we had a move up early in the day and back down late in the day.  Now what?  I'd guess we'll stay in the APEX of the triangle under someone important says something to pop the market up higher out of the triangle or down if it's a comment viewed negatively.  Even-though the testimonies start today I think it's really the Thursday one's that could move the market up or down quickly.  I'll also add that the triangle is pretty tight right now so I wouldn't be surprised if it expands a little with a pierce higher or lower throughout the day.  But I still don't see much action until tomorrow... just another boring day.

ES Morning Update June 6th 2017

0

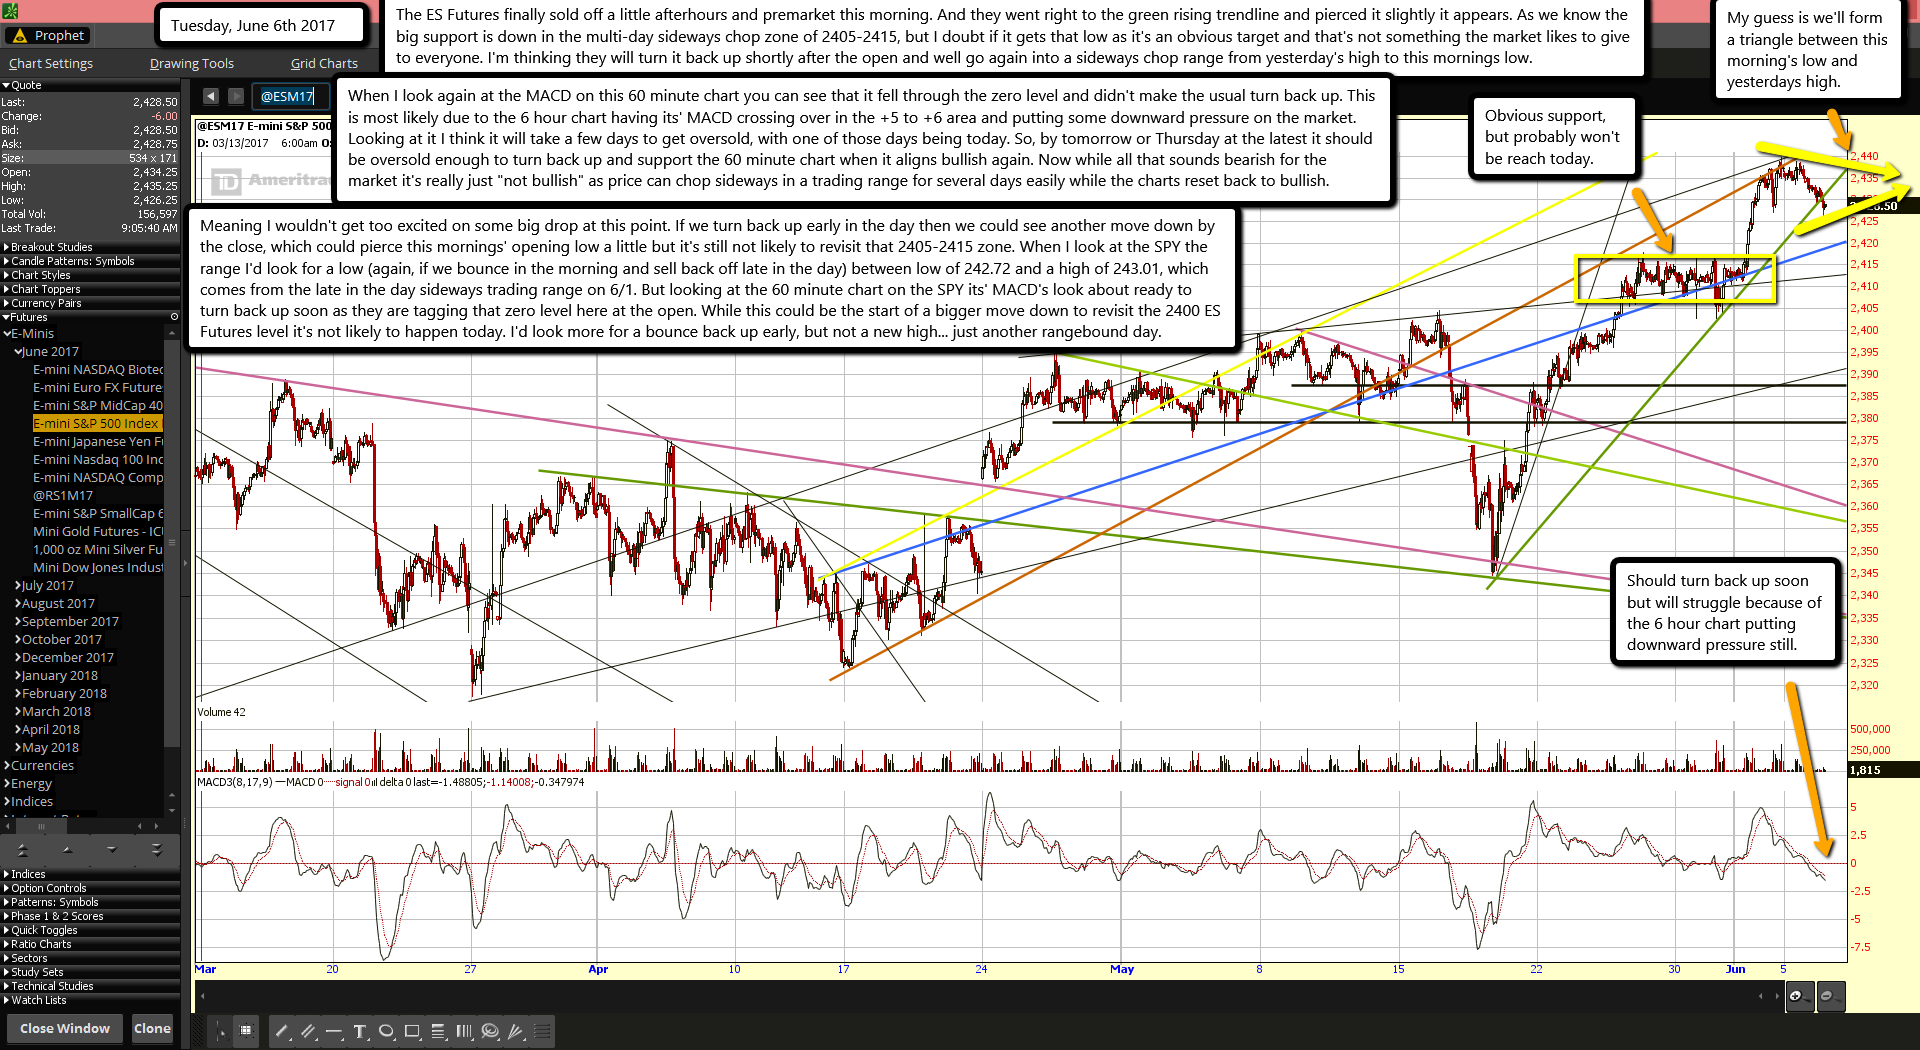
The ES Futures finally sold off a little afterhours and premarket this morning. And they went right to the green rising trendline and pierced it slightly it appears. As we know the big support is down in the multi-day sideways chop zone of 2405-2415, but I doubt if it gets that low as it's an obvious target and that's not something the market likes to give to everyone. I'm thinking they will turn it back up shortly after the open and well go again into a sideways chop range from yesterday's high to this mornings low.

When I look again at the MACD on this 60 minute chart you can see that it fell through the zero level and didn't make the usual turn back up. This is most likely due to the 6 hour chart having its' MACD crossing over in the +5 to +6 area and putting some downward pressure on the market. Looking at it I think it will take a few days to get oversold, with one of those days being today. So, by tomorrow or Thursday at the latest it should be oversold enough to turn back up and support the 60 minute chart when it aligns bullish again. Now while all that sounds bearish for the market it's really just "not bullish" as price can chop sideways in a trading range for several days easily while the charts reset back to bullish.

Meaning I wouldn't get too excited on some big drop at this point. If we turn back up early in the day then we could see another move down by the close, which could pierce this mornings' opening low a little but it's still not likely to revisit that 2405-2415 zone. When I look at the SPY the range I'd look for a low (again, if we bounce in the morning and sell back off late in the day) between low of 242.72 and a high of 243.01, which comes from the late in the day sideways trading range on 6/1. But looking at the 60 minute chart on the SPY its' MACD's look about ready to turn back up soon as they are tagging that zero level here at the open. While this could be the start of a bigger move down to revisit the 2400 ES Futures level it's not likely to happen today. I'd look more for a bounce back up early, but not a new high... just another rangebound day.

ES Morning Update June 5th 2017

0

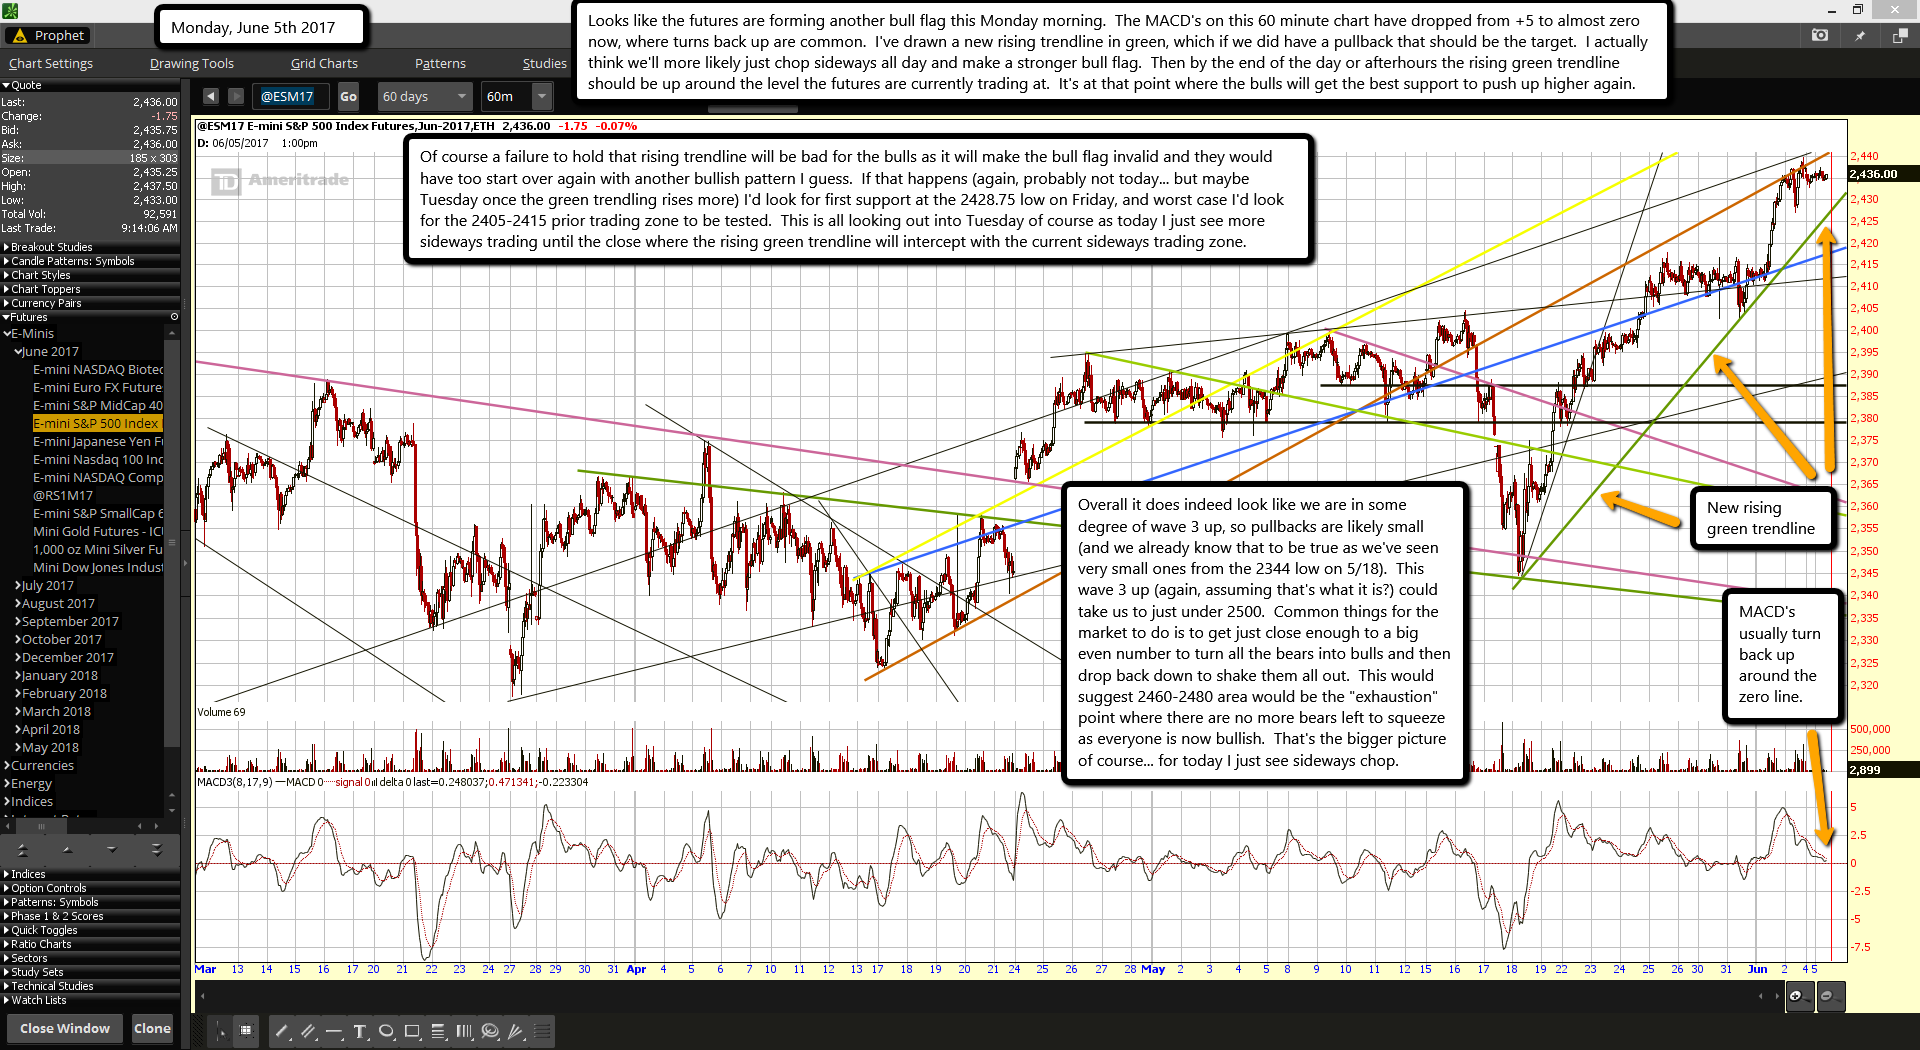
Looks like the futures are forming another bull flag this Monday morning.  The MACD's on this 60 minute chart have dropped from +5 to almost zero now, where turns back up are common.  I've drawn a new rising trendline in green, which if we did have a pullback that should be the target.  I actually think we'll more likely just chop sideways all day and make a stronger bull flag.  Then by the end of the day or afterhours the rising green trendline should be up around the level the futures are currently trading at.  It's at that point where the bulls will get the best support to push up higher again.

Of course a failure to hold that rising trendline will be bad for the bulls as it will make the bull flag invalid and they would have too start over again with another bullish pattern I guess.  If that happens (again, probably not today... but maybe Tuesday once the green trendling rises more) I'd look for first support at the 2428.75 low on Friday, and worst case I'd look for the 2405-2415 prior trading zone to be tested.  This is all looking out into Tuesday of course as today I just see more sideways trading until the close where the rising green trendline will intercept with the current sideways trading zone.

Overall it does indeed look like we are in some degree of wave 3 up, so pullbacks are likely small (and we already know that to be true as we've seen very small ones from the 2344 low on 5/18).  This wave 3 up (again, assuming that's what it is?) could take us to just under 2500.  Common things for the market to do is to get just close enough to a big even number to turn all the bears into bulls and then drop back down to shake them all out.  This would suggest 2460-2480 area would be the "exhaustion" point where there are no more bears left to squeeze as everyone is now bullish.  That's the bigger picture of course... for today I just see sideways chop.

ES Morning Update June 2nd 2017

0

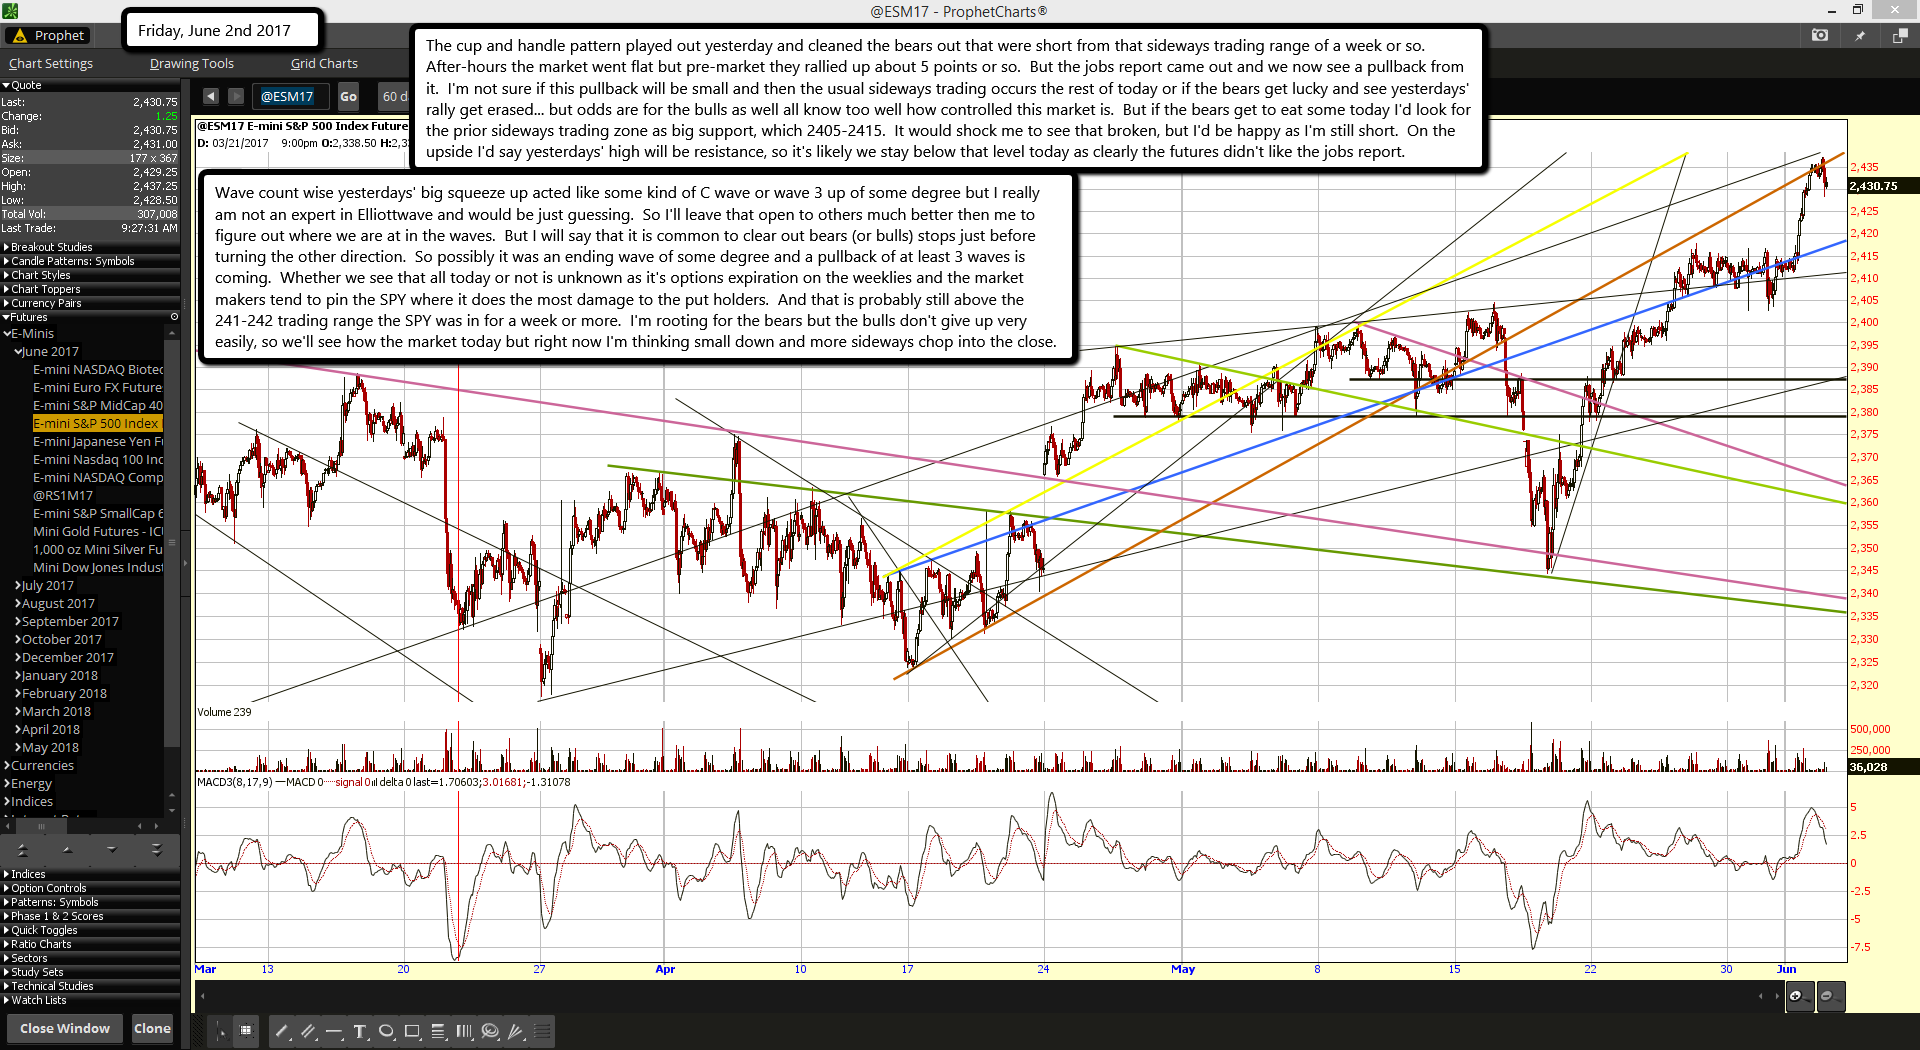
The cup and handle pattern played out yesterday and cleaned the bears out that were short from that sideways trading range of a week or so.  After-hours the market went flat but pre-market they rallied up about 5 points or so.  But the jobs report came out and we now see a pullback from it.  I'm not sure if this pullback will be small and then the usual sideways trading occurs the rest of today or if the bears get lucky and see yesterdays' rally get erased... but odds are for the bulls as well all know too well how controlled this market is.  But if the bears get to eat some today I'd look for the prior sideways trading zone as big support, which 2405-2415.  It would shock me to see that broken, but I'd be happy as I'm still short.  On the upside I'd say yesterdays' high will be resistance, so it's likely we stay below that level today as clearly the futures didn't like the jobs report.

Wave count wise yesterdays' big squeeze up acted like some kind of C wave or wave 3 up of some degree but I really am not an expert in Elliottwave and would be just guessing.  So I'll leave that open to others much better then me to figure out where we are at in the waves.  But I will say that it is common to clear out bears (or bulls) stops just before turning the other direction.  So possibly it was an ending wave of some degree and a pullback of at least 3 waves is coming.  Whether we see that all today or not is unknown as it's options expiration on the weeklies and the market makers tend to pin the SPY where it does the most damage to the put holders.  And that is probably still above the 241-242 trading range the SPY was in for a week or more.  I'm rooting for the bears but the bulls don't give up very easily, so we'll see how the market today but right now I'm thinking small down and more sideways chop into the close.

ES Morning Update June 1st 2017

0

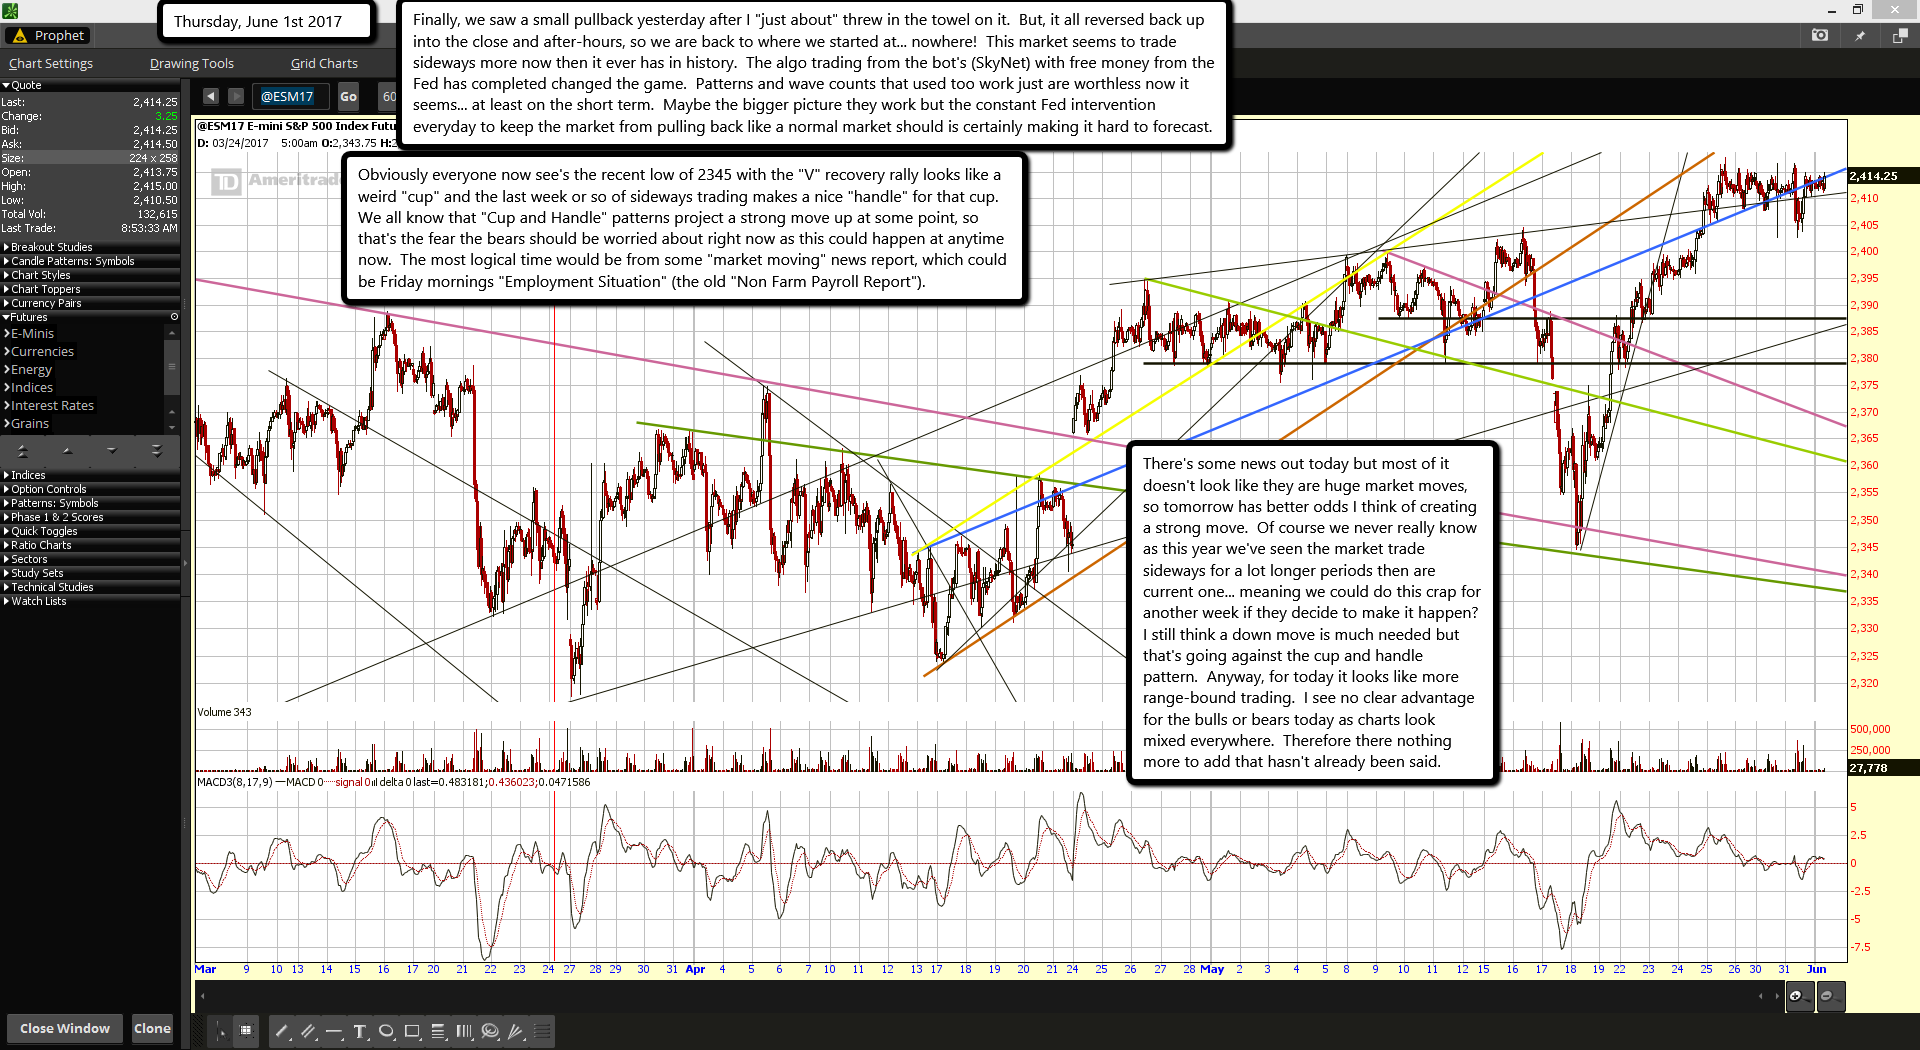
Finally, we saw a small pullback yesterday after I "just about" threw in the towel on it.  But, it all reversed back up into the close and after-hours, so we are back to where we started at... nowhere!  This market seems to trade sideways more now then it ever has in history.  The algo trading from the bot's (SkyNet) with free money from the Fed has completed changed the game.  Patterns and wave counts that used too work just are worthless now it seems... at least on the short term.  Maybe the bigger picture they work but the constant Fed intervention everyday to keep the market from pulling back like a normal market should is certainly making it hard to forecast.

Obviously everyone now see's the recent low of 2345 with the "V" recovery rally looks like a weird "cup" and the last week or so of sideways trading makes a nice "handle" for that cup.  We all know that "Cup and Handle" patterns project a strong move up at some point, so that's the fear the bears should be worried about right now as this could happen at anytime now.  The most logical time would be from some "market moving" news report, which could be Friday mornings "Employment Situation" (the old "Non Farm Payroll Report").

There's some news out today but most of it doesn't look like they are huge market moves, so tomorrow has better odds I think of creating a strong move.  Of course we never really know as this year we've seen the market trade sideways for a lot longer periods then are current one... meaning we could do this crap for another week if they decide to make it happen?  I still think a down move is much needed but that's going against the cup and handle pattern.  Anyway, for today it looks like more range-bound trading.  I see no clear advantage for the bulls or bears today as charts look mixed everywhere.  Therefore there nothing more to add that hasn't already been said.

ES Morning Update May 31st 2017

0

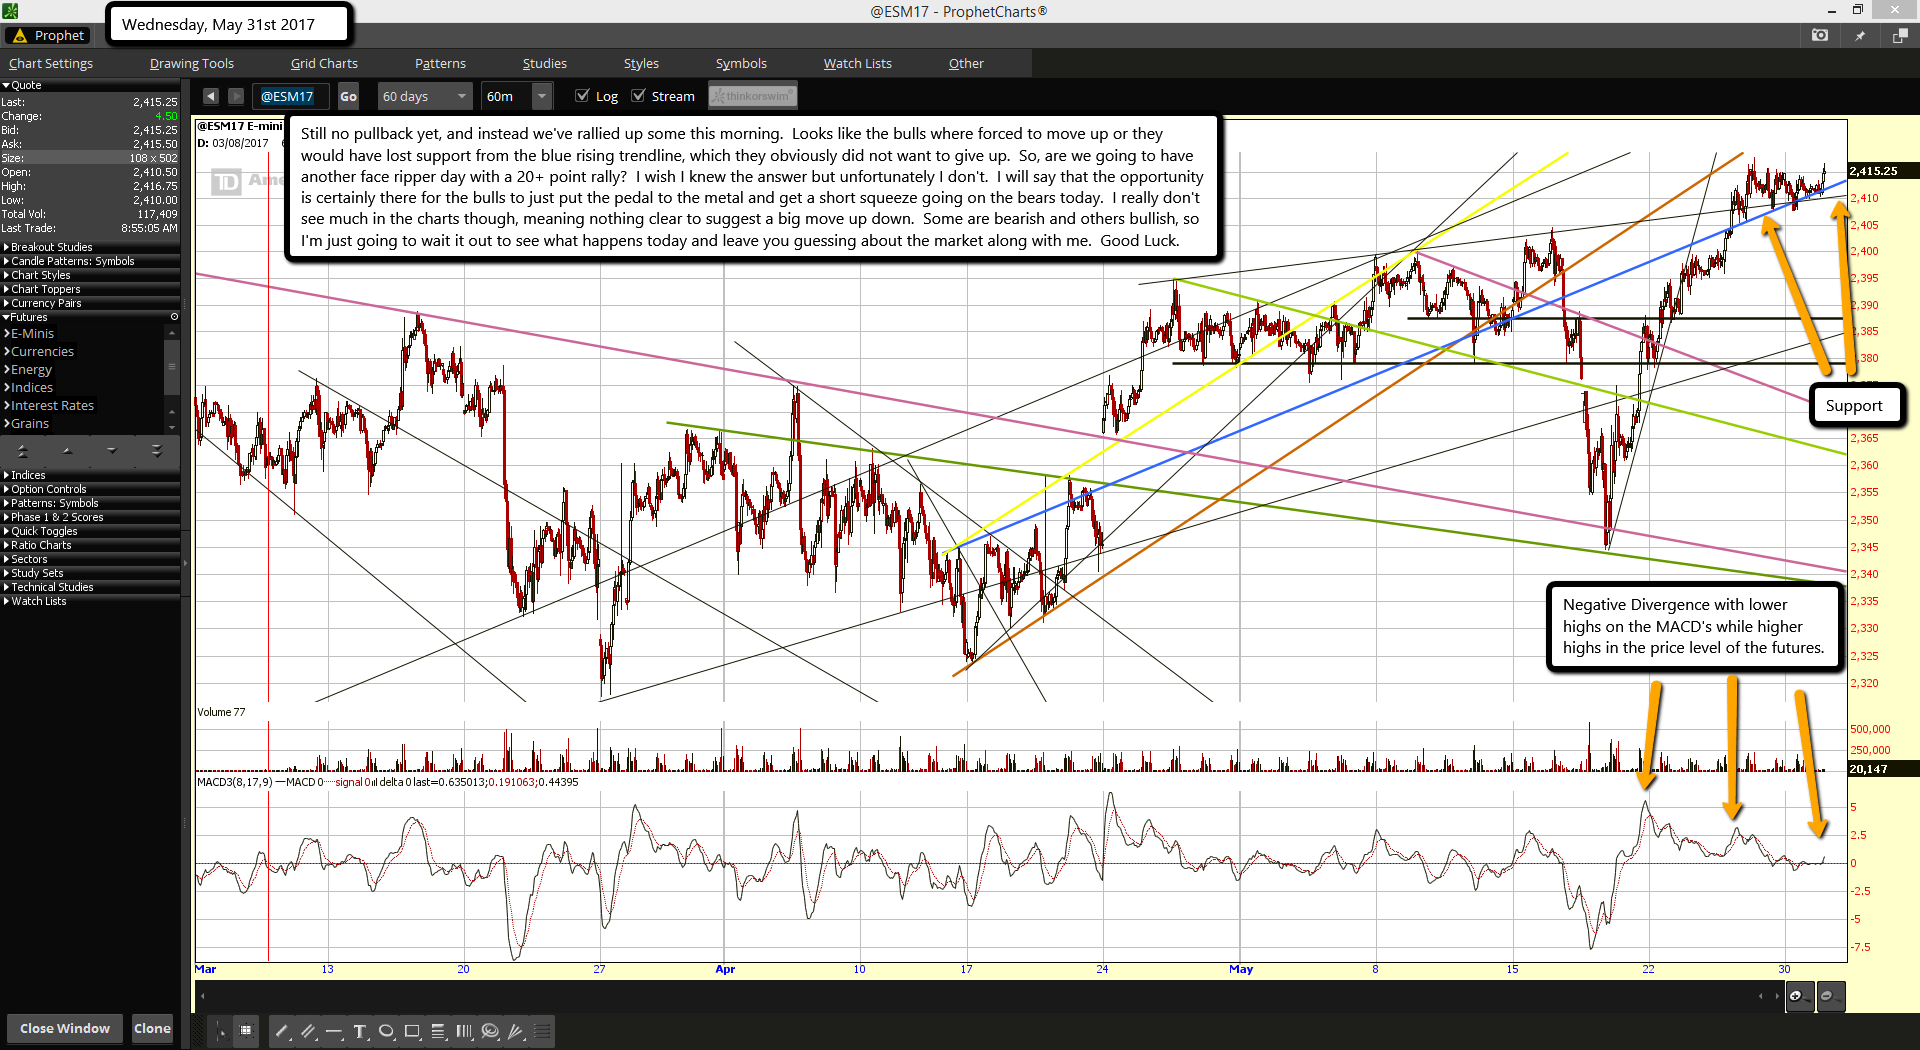
Still no pullback yet, and instead we've rallied up some this morning.  Looks like the bulls where forced to move up or they would have lost support from the blue rising trendline, which they obviously did not want to give up.  So, are we going to have another face ripper day with a 20+ point rally?  I wish I knew the answer but unfortunately I don't.  I will say that the opportunity is certainly there for the bulls to just put the pedal to the metal and get a short squeeze going on the bears today.  I really don't see much in the charts though, meaning nothing clear to suggest a big move up down.  Some are bearish and others bullish, so I'm just going to wait it out to see what happens today and leave you guessing about the market along with me.  Good Luck.

ES Morning Update May 30th 2017

0

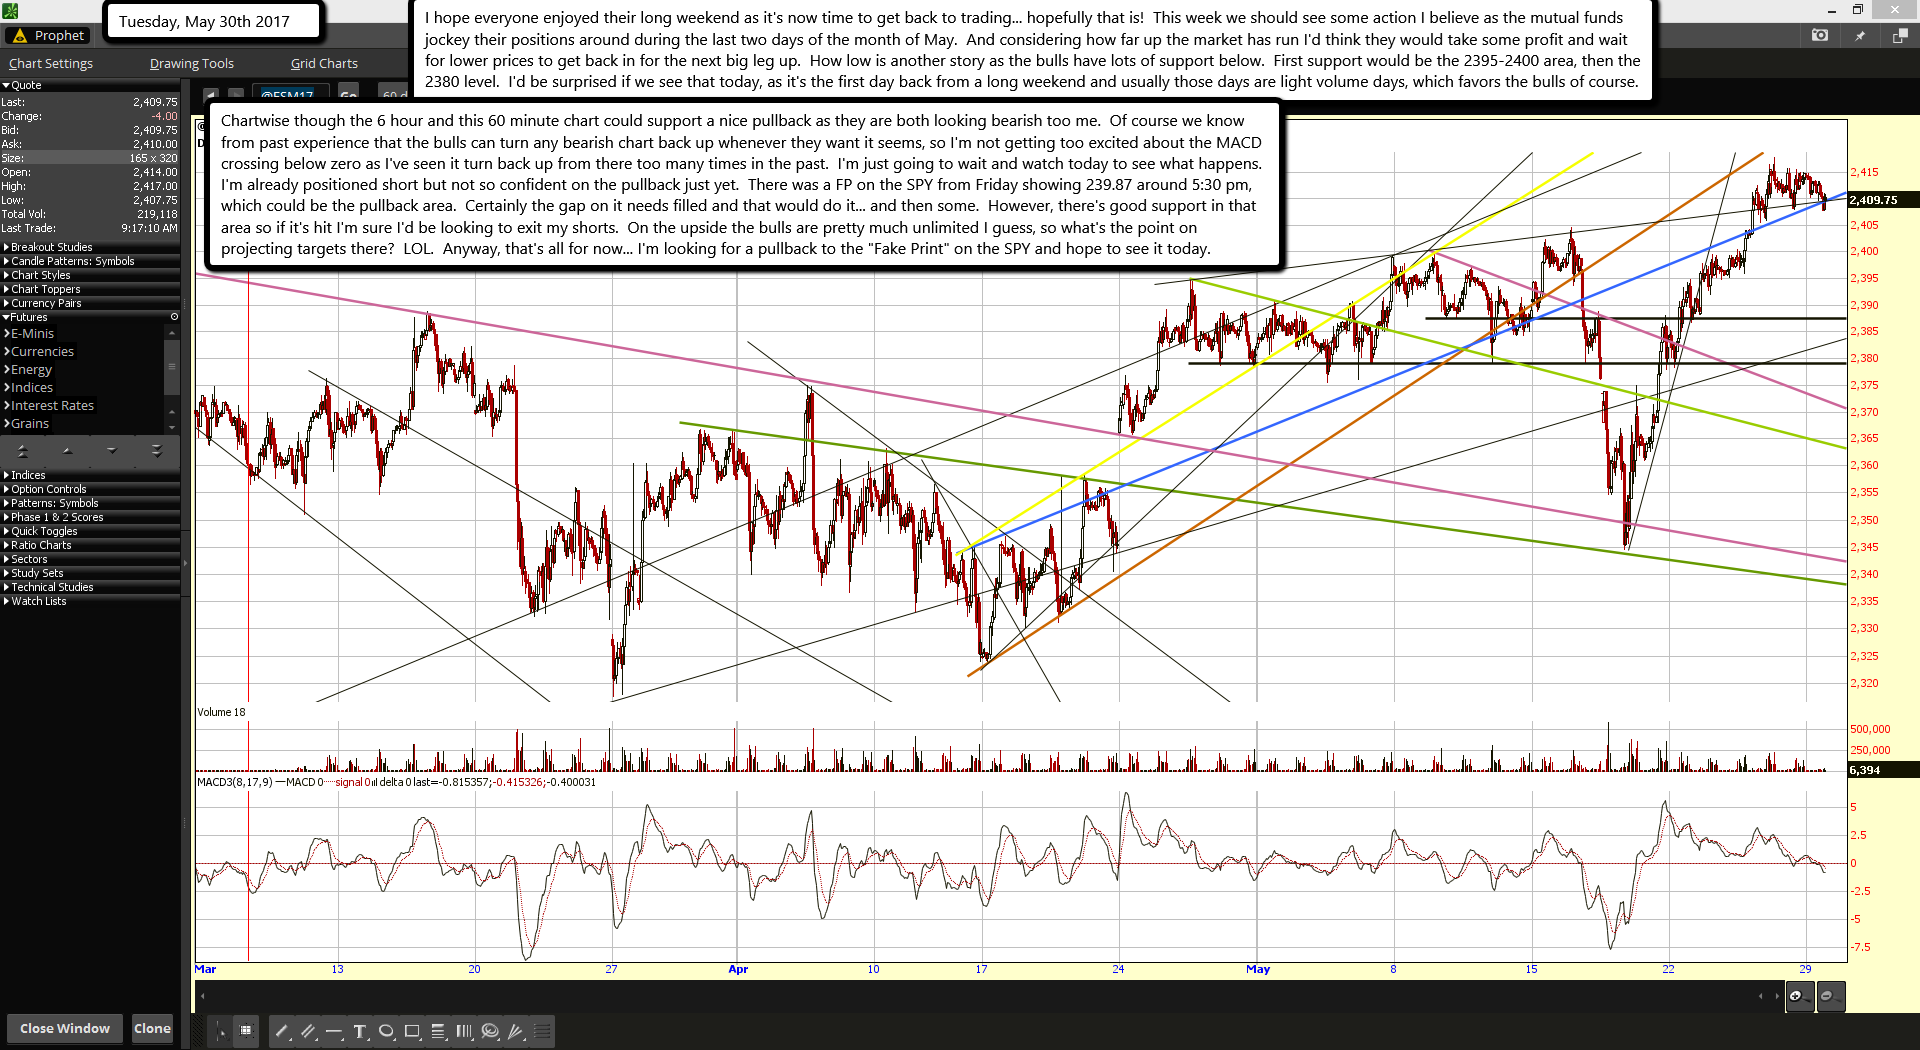
I hope everyone enjoyed their long weekend as it's now time to get back to trading... hopefully that is!  This week we should see some action I believe as the mutual funds jockey their positions around during the last two days of the month of May.  And considering how far up the market has run I'd think they would take some profit and wait for lower prices to get back in for the next big leg up.  How low is another story as the bulls have lots of support below.  First support would be the 2395-2400 area, then the 2380 level.  I'd be surprised if we see that today, as it's the first day back from a long weekend and usually those days are light volume days, which favors the bulls of course.

Chartwise though the 6 hour and this 60 minute chart could support a nice pullback as they are both looking bearish too me.  Of course we know from past experience that the bulls can turn any bearish chart back up whenever they want it seems, so I'm not getting too excited about the MACD crossing below zero as I've seen it turn back up from there too many times in the past.  I'm just going to wait and watch today to see what happens.  I'm already positioned short but not so confident on the pullback just yet.  There was a FP on the SPY from Friday showing 239.87 around 5:30 pm, which could be the pullback area.  Certainly the gap on it needs filled and that would do it... and then some.  However, there's good support in that area so if it's hit I'm sure I'd be looking to exit my shorts.  On the upside the bulls are pretty much unlimited I guess, so what's the point on projecting targets there?  LOL.  Anyway, that's all for now... I'm looking for a pullback to the "Fake Print" on the SPY and hope to see it today.

Are Mass Killings Real Or False Flags?

0

Ever wonder about all the school shootings, bombings, train killings, etc...?

I mean, they can't all be "False Flags" can they... or are they?

If you believe things must happen randomly then certainly the events in the image here clearly aren't random at all, and therefore logic dictates they are False Flags.

ES Morning Update May 26th 2017

0

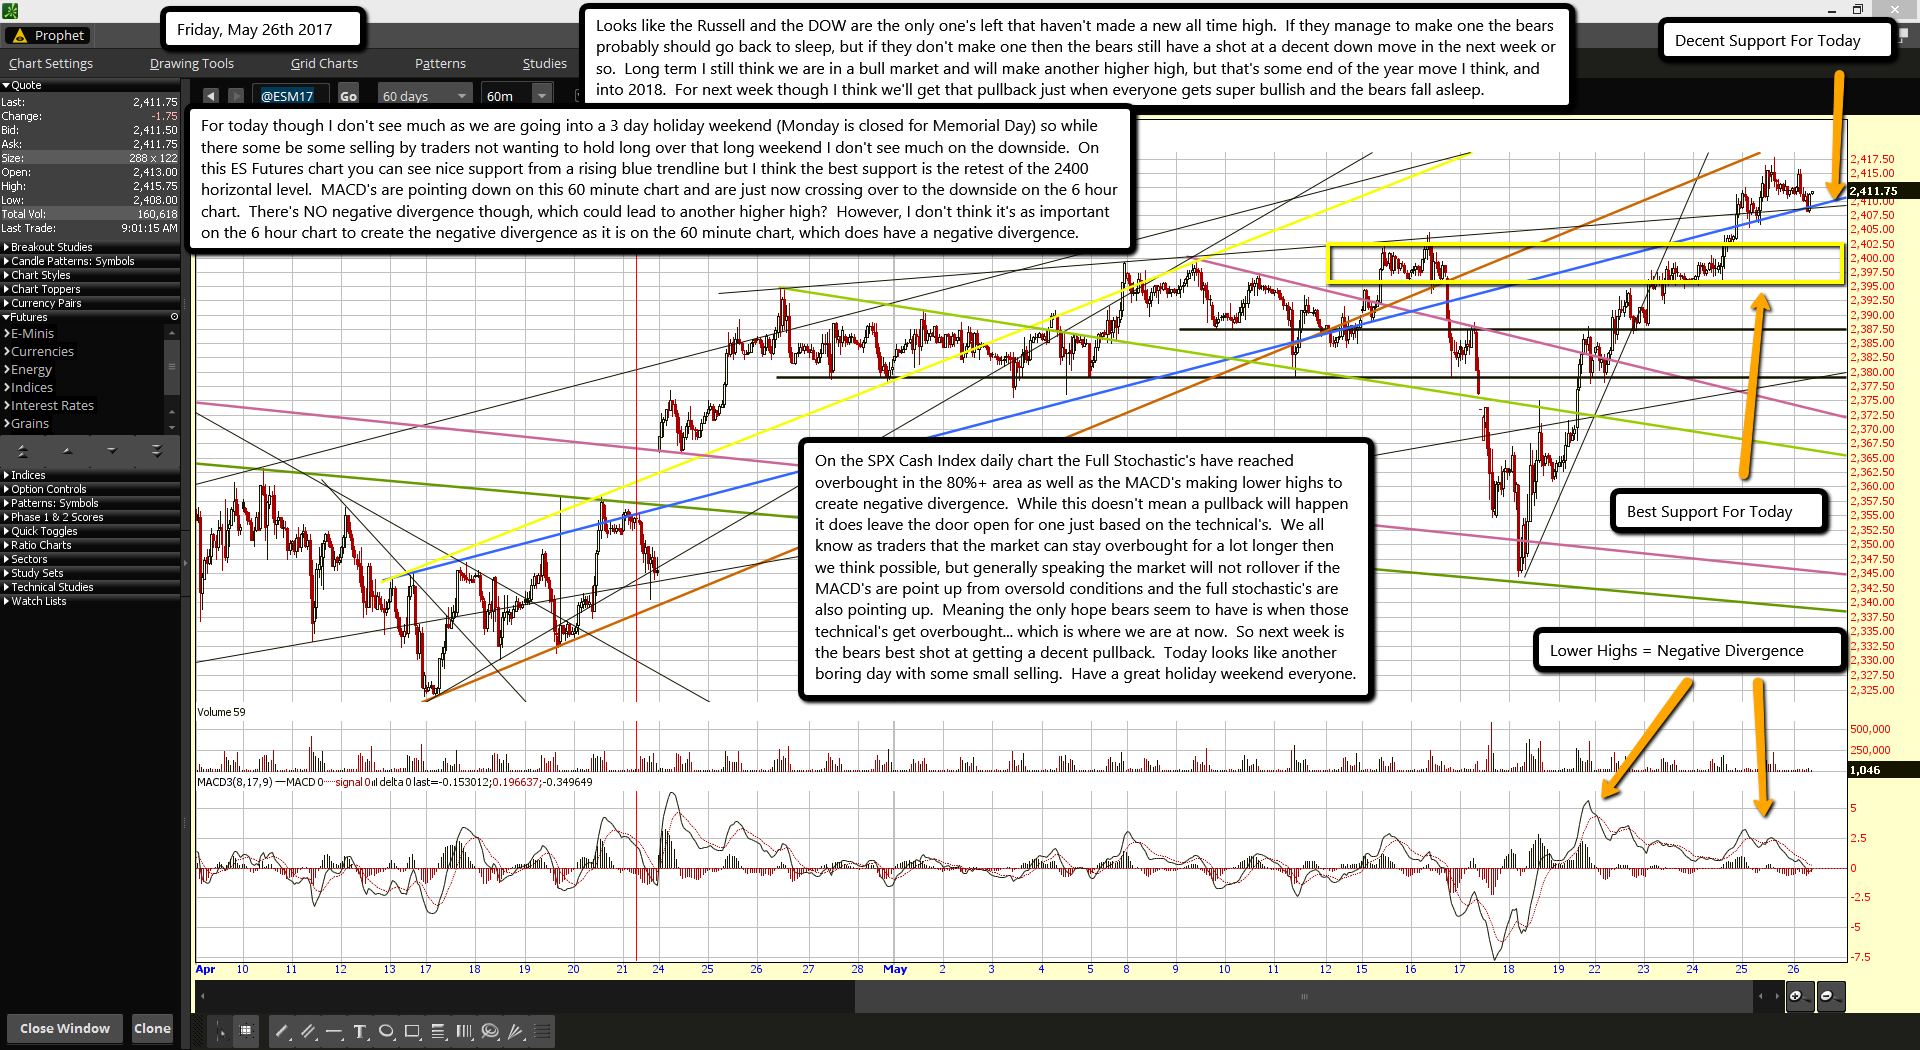
Looks like the Russell and the DOW are the only one's left that haven't made a new all time high.  If they manage to make one the bears probably should go back to sleep, but if they don't make one then the bears still have a shot at a decent down move in the next week or so.  Long term I still think we are in a bull market and will make another higher high, but that's some end of the year move I think, and into 2018.  For next week though I think we'll get that pullback just when everyone gets super bullish and the bears fall asleep.

For today though I don't see much as we are going into a 3 day holiday weekend (Monday is closed for Memorial Day) so while there some be some selling by traders not wanting to hold long over that long weekend I don't see much on the downside.  On this ES Futures chart you can see nice support from a rising blue trendline but I think the best support is the retest of the 2400 horizontal level.  MACD's are pointing down on this 60 minute chart and are just now crossing over to the downside on the 6 hour chart.  There's NO negative divergence though, which could lead to another higher high?  However, I don't think it's as important on the 6 hour chart to create the negative divergence as it is on the 60 minute chart, which does have a negative divergence.

On the SPX Cash Index daily chart the Full Stochastic's have reached overbought in the 80%+ area as well as the MACD's making lower highs to create negative divergence.  While this doesn't mean a pullback will happen it does leave the door open for one just based on the technical's.  We all know as traders that the market can stay overbought for a lot longer then we think possible, but generally speaking the market will not rollover if the MACD's are point up from oversold conditions and the full stochastic's are also pointing up.  Meaning the only hope bears seem to have is when those technical's get overbought... which is where we are at now.  So next week is the bears best shot at getting a decent pullback.  Today looks like another boring day with some small selling.  Have a great holiday weekend everyone.

ES Morning Update May 25th 2017

0

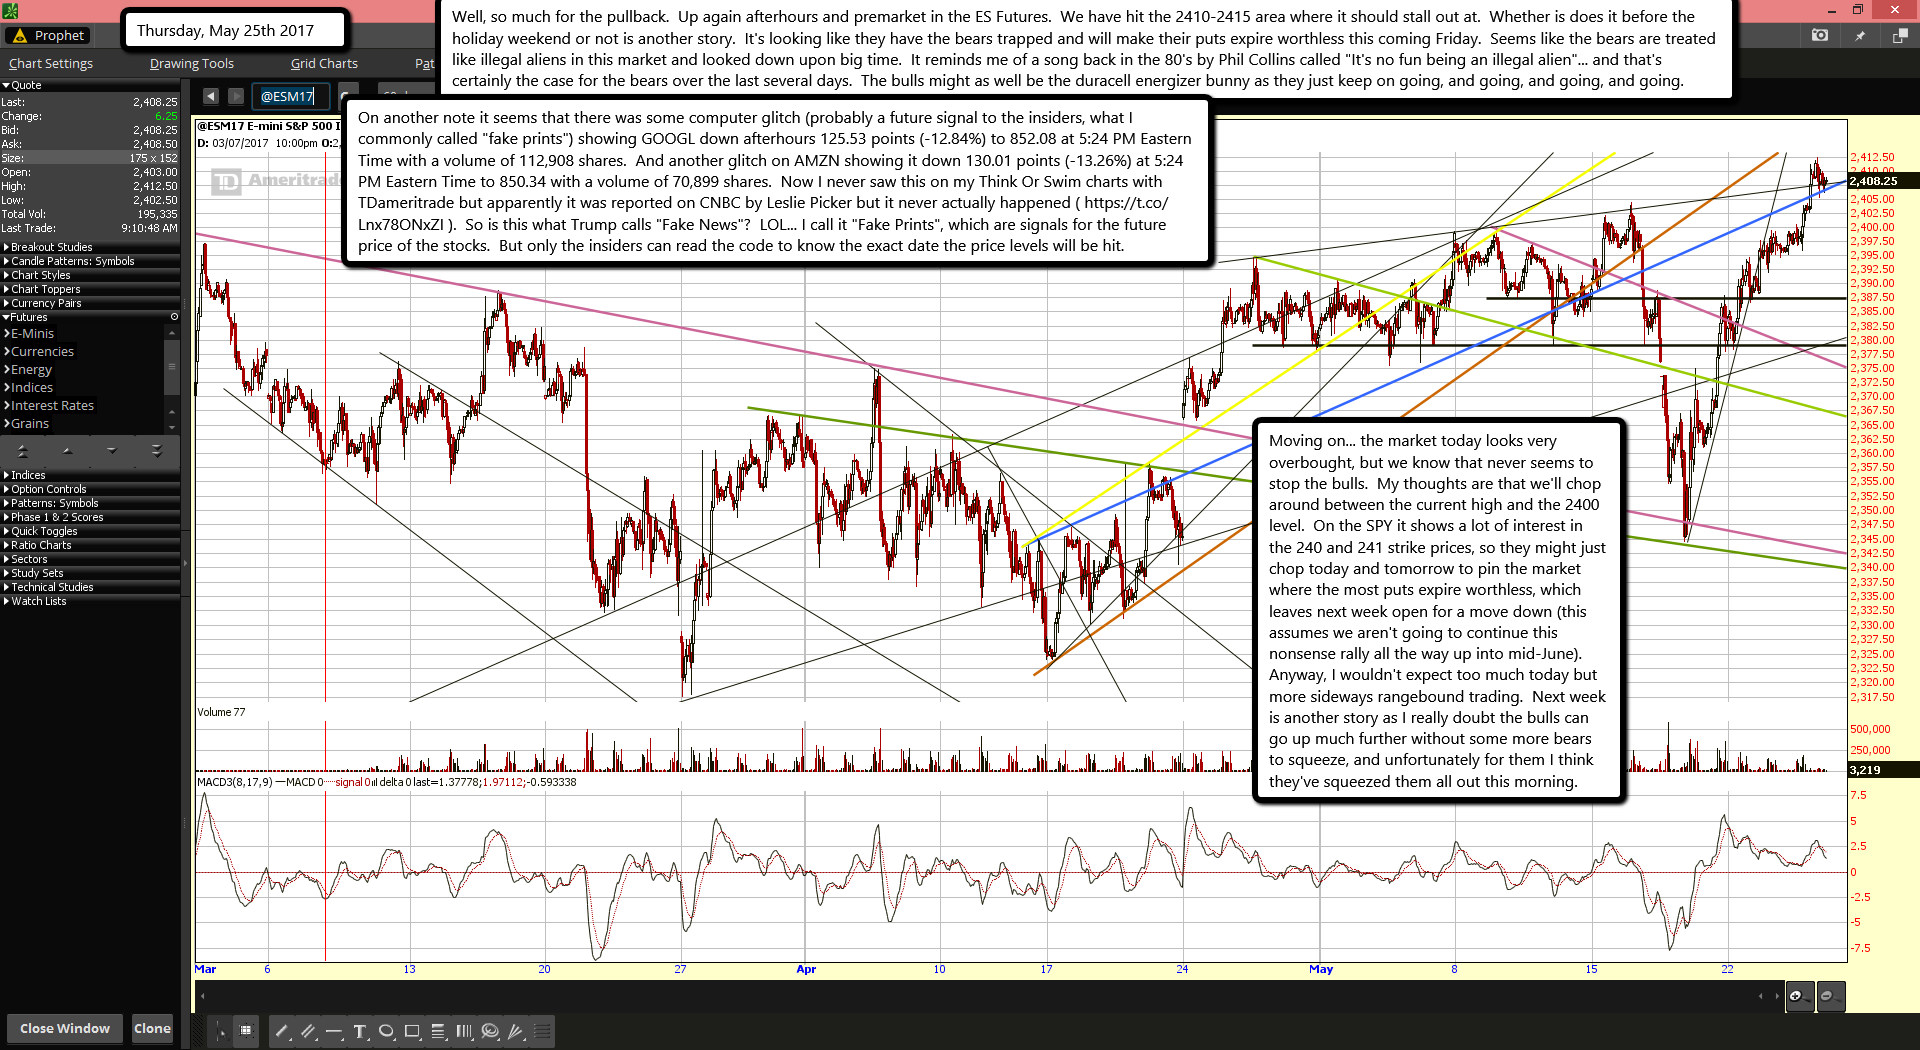
Well, so much for the pullback. Up again afterhours and premarket in the ES Futures. We have hit the 2410-2415 area where it should stall out at. Whether is does it before the holiday weekend or not is another story. It's looking like they have the bears trapped and will make their puts expire worthless this coming Friday. Seems like the bears are treated like illegal aliens in this market and looked down upon big time. It reminds me of a song back in the 80's by Phil Collins called "It's no fun being an illegal alien"... and that's certainly the case for the bears over the last several days. The bulls might as well be the duracell energizer bunny as they just keep on going, and going, and going, and going.

On another note it seems that there was some computer glitch (probably a future signal to the insiders, what I commonly called "fake prints") showing GOOGL down afterhours 125.53 points (-12.84%) to 852.08 at 5:24 PM Eastern Time with a volume of 112,908 shares. And another glitch on AMZN showing it down 130.01 points (-13.26%) at 5:24 PM Eastern Time to 850.34 with a volume of 70,899 shares. Now I never saw this on my Think Or Swim charts with TDameritrade but apparently it was reported on CNBC by Leslie Picker but it never actually happened ( https://t.co/Lnx78ONxZI ). So is this what Trump calls "Fake News"? LOL... I call it "Fake Prints", which are signals for the future price of the stocks. But only the insiders can read the code to know the exact date the price levels will be hit.

Moving on... the market today looks very overbought, but we know that never seems to stop the bulls. My thoughts are that we'll chop around between the current high and the 2400 level. On the SPY it shows a lot of interest in the 240 and 241 strike prices, so they might just chop today and tomorrow to pin the market where the most puts expire worthless, which leaves next week open for a move down (this assumes we aren't going to continue this nonsense rally all the way up into mid-June). Anyway, I wouldn't expect too much today but more sideways rangebound trading. Next week is another story as I really doubt the bulls can go up much further without some more bears to squeeze, and unfortunately for them I think they've squeezed them all out this morning.

ES Morning Update May 24th 2017

0

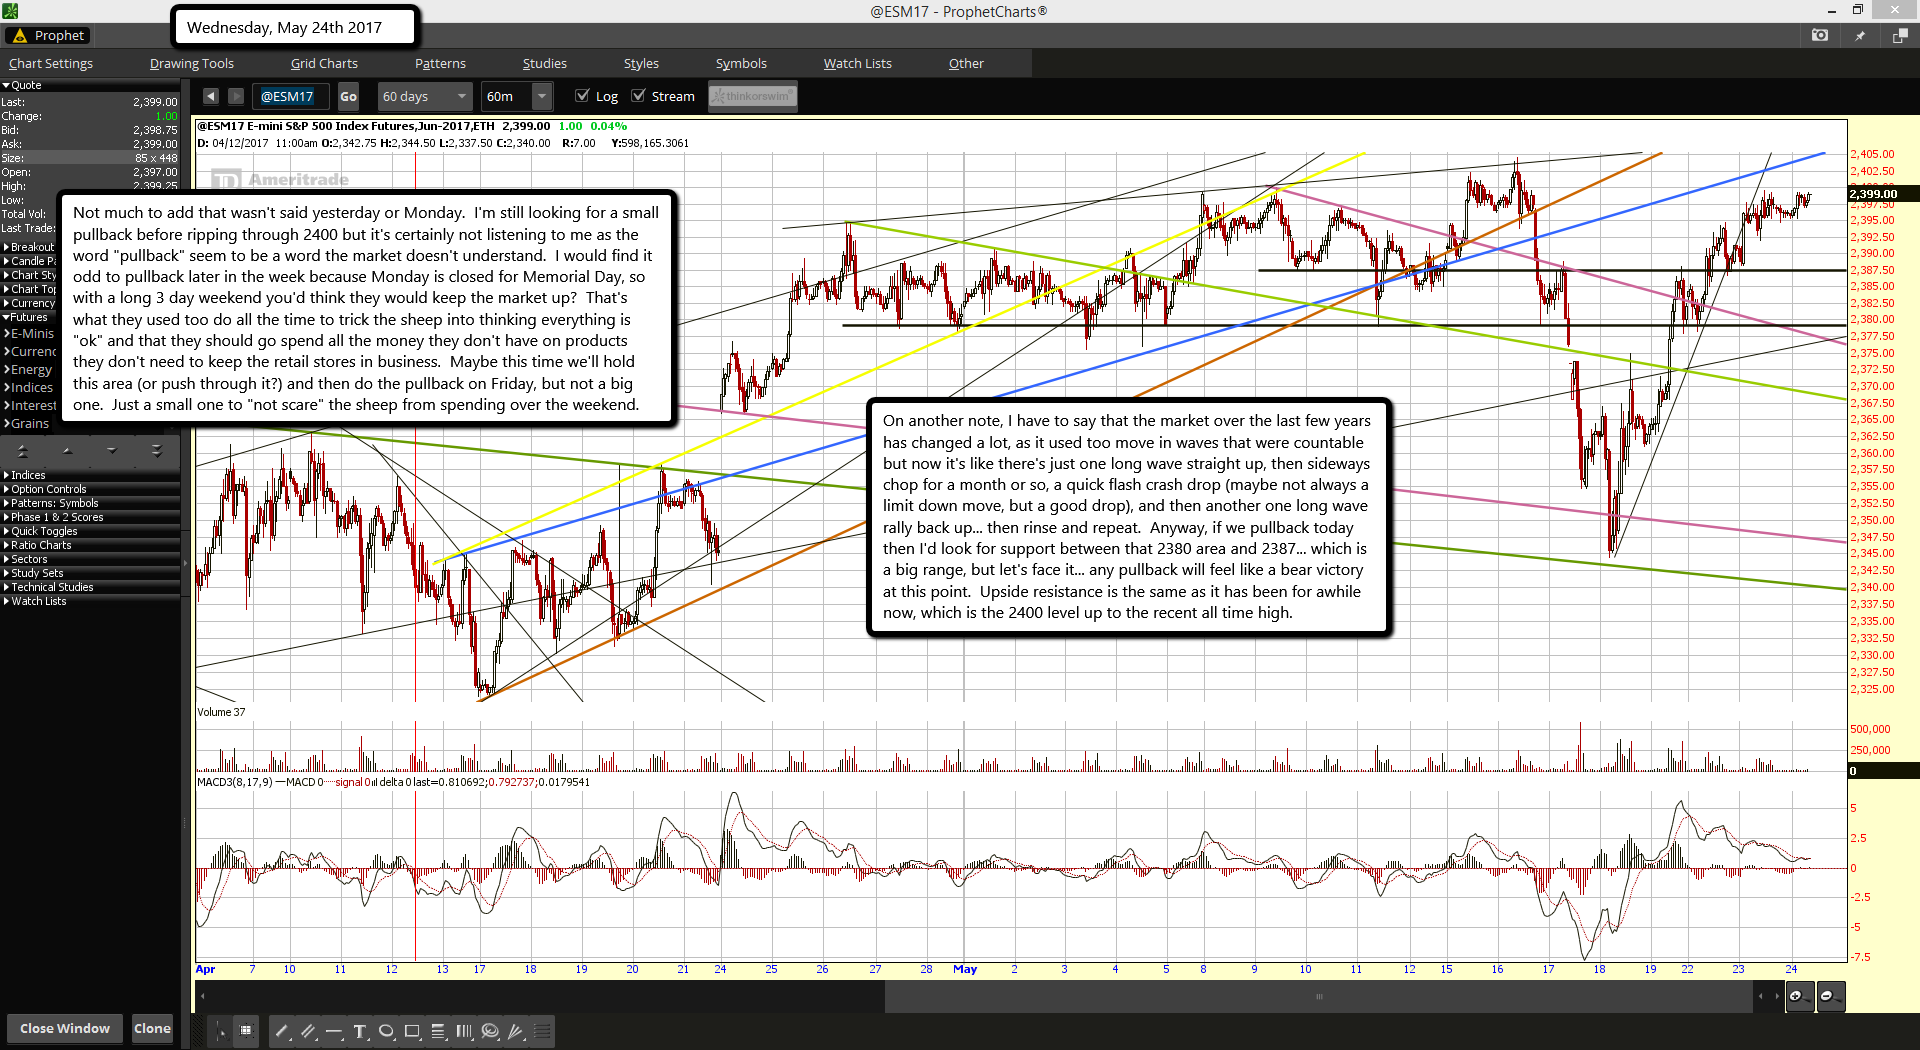
Not much to add that wasn't said yesterday or Monday.  I'm still looking for a small pullback before ripping through 2400 but it's certainly not listening to me as the word "pullback" seem to be a word the market doesn't understand.  I would find it odd to pullback later in the week because Monday is closed for Memorial Day, so with a long 3 day weekend you'd think they would keep the market up?  That's what they used too do all the time to trick the sheep into thinking everything is "ok" and that they should go spend all the money they don't have on products they don't need to keep the retail stores in business.  Maybe this time we'll hold this area (or push through it?) and then do the pullback on Friday, but not a big one.  Just a small one to "not scare" the sheep from spending over the weekend.

On another note, I have to say that the market over the last few years has changed a lot, as it used too move in waves that were countable but now it's like there's just one long wave straight up, then sideways chop for a month or so, a quick flash crash drop (maybe not always a limit down move, but a good drop), and then another one long wave rally back up... then rinse and repeat.  Anyway, if we pullback today then I'd look for support between that 2380 area and 2387... which is a big range, but let's face it... any pullback will feel like a bear victory at this point.  Upside resistance is the same as it has been for awhile now, which is the 2400 level up to the recent all time high.

ES Morning Update May 23rd 2017

0

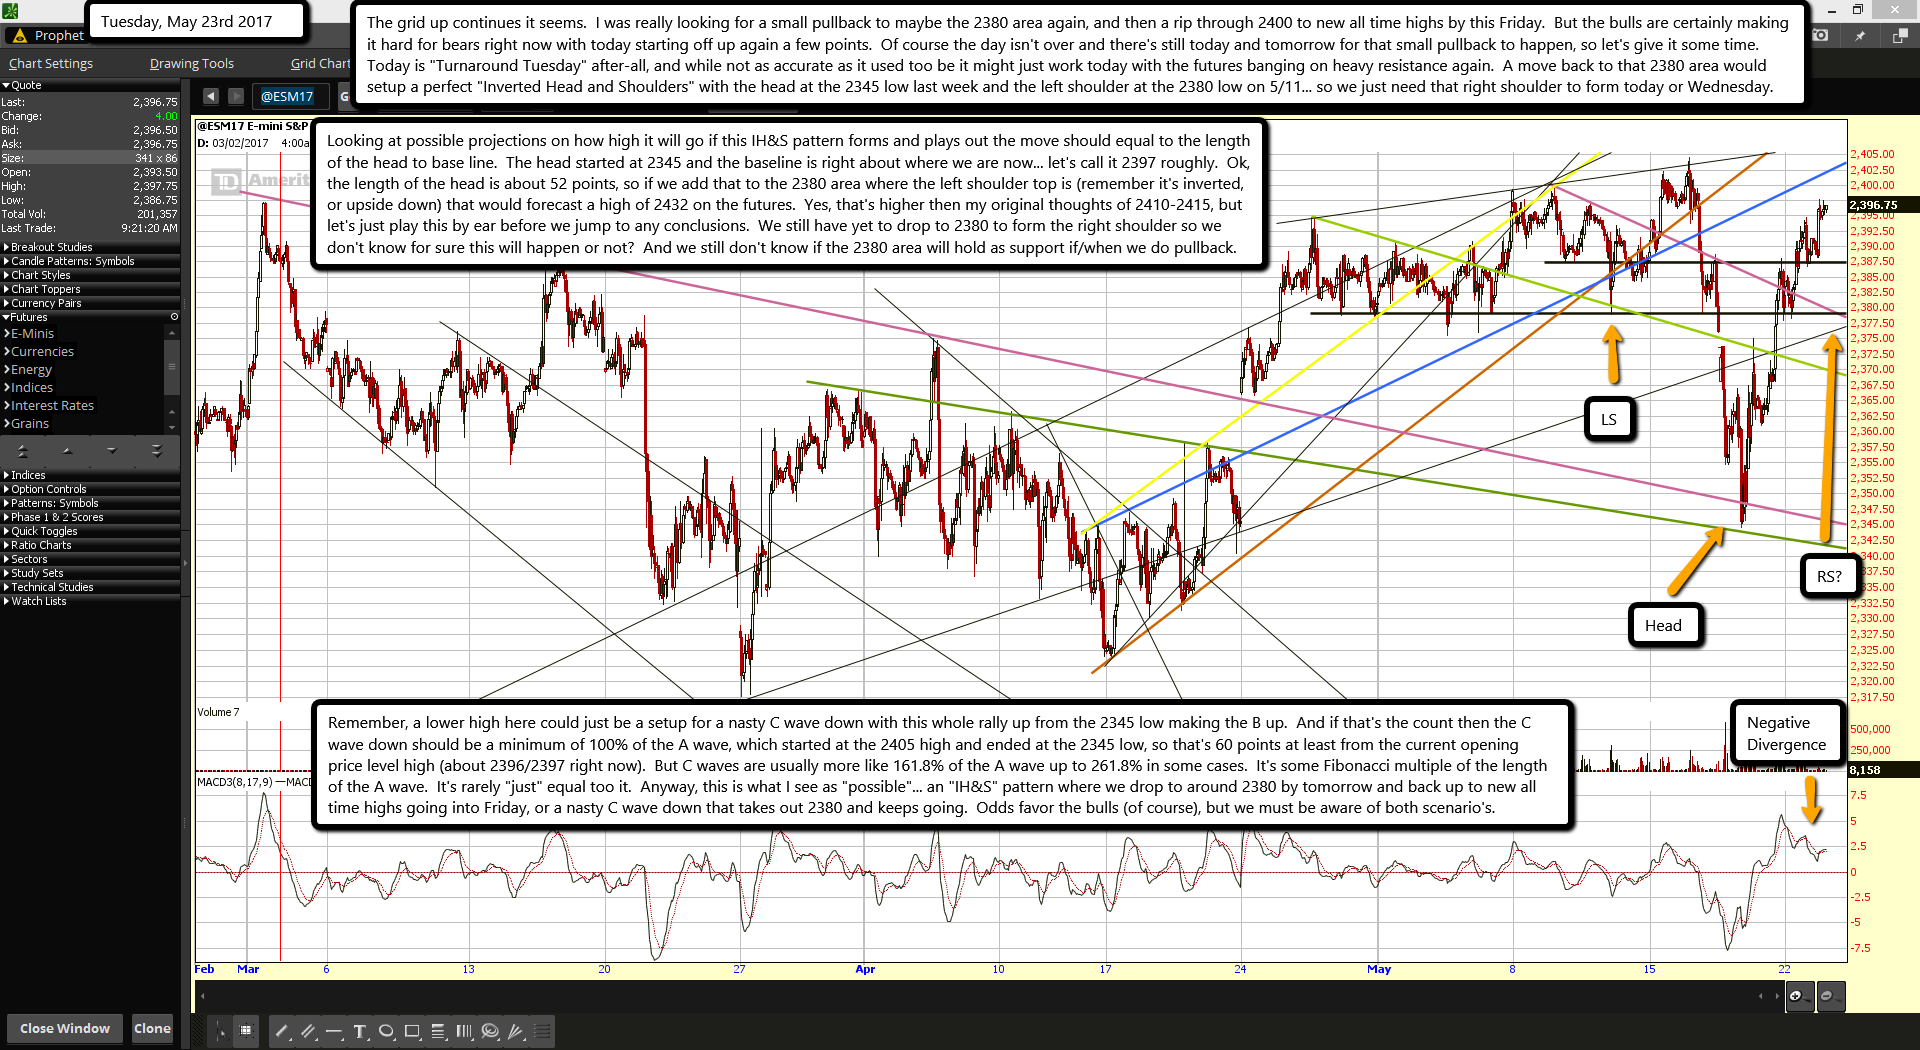
The grid up continues it seems.  I was really looking for a small pullback to maybe the 2380 area again, and then a rip through 2400 to new all time highs by this Friday.  But the bulls are certainly making it hard for bears right now with today starting off up again a few points.  Of course the day isn't over and there's still today and tomorrow for that small pullback to happen, so let's give it some time.  Today is "Turnaround Tuesday" after-all, and while not as accurate as it used too be it might just work today with the futures banging on heavy resistance again.  A move back to that 2380 area would setup a perfect "Inverted Head and Shoulders" with the head at the 2345 low last week and the left shoulder at the 2380 low on 5/11... so we just need that right shoulder to form today or Wednesday.

Looking at possible projections on how high it will go if this IH&S pattern forms and plays out the move should equal to the length of the head to base line.  The head started at 2345 and the baseline is right about where we are now... let's call it 2397 roughly.  Ok, the length of the head is about 52 points, so if we add that to the 2380 area where the left shoulder top is (remember it's inverted, or upside down) that would forecast a high of 2432 on the futures.  Yes, that's higher then my original thoughts of 2410-2415, but let's just play this by ear before we jump to any conclusions.  We still have yet to drop to 2380 to form the right shoulder so we don't know for sure this will happen or not?  And we still don't know if the 2380 area will hold as support if/when we do pullback.

Remember, a lower high here could just be a setup for a nasty C wave down with this whole rally up from the 2345 low making the B up.  And if that's the count then the C wave down should be a minimum of 100% of the A wave, which started at the 2405 high and ended at the 2345 low, so that's 60 points at least from the current opening price level high (about 2396/2397 right now).  But C waves are usually more like 161.8% of the A wave up to 261.8% in some cases.  It's some Fibonacci multiple of the length of the A wave.  It's rarely "just" equal too it.  Anyway, this is what I see as "possible"... an "IH&S" pattern where we drop to around 2380 by tomorrow and back up to new all time highs going into Friday, or a nasty C wave down that takes out 2380 and keeps going.  Odds favor the bulls (of course), but we must be aware of both scenario's.

ES Morning Update May 22nd 2017

0

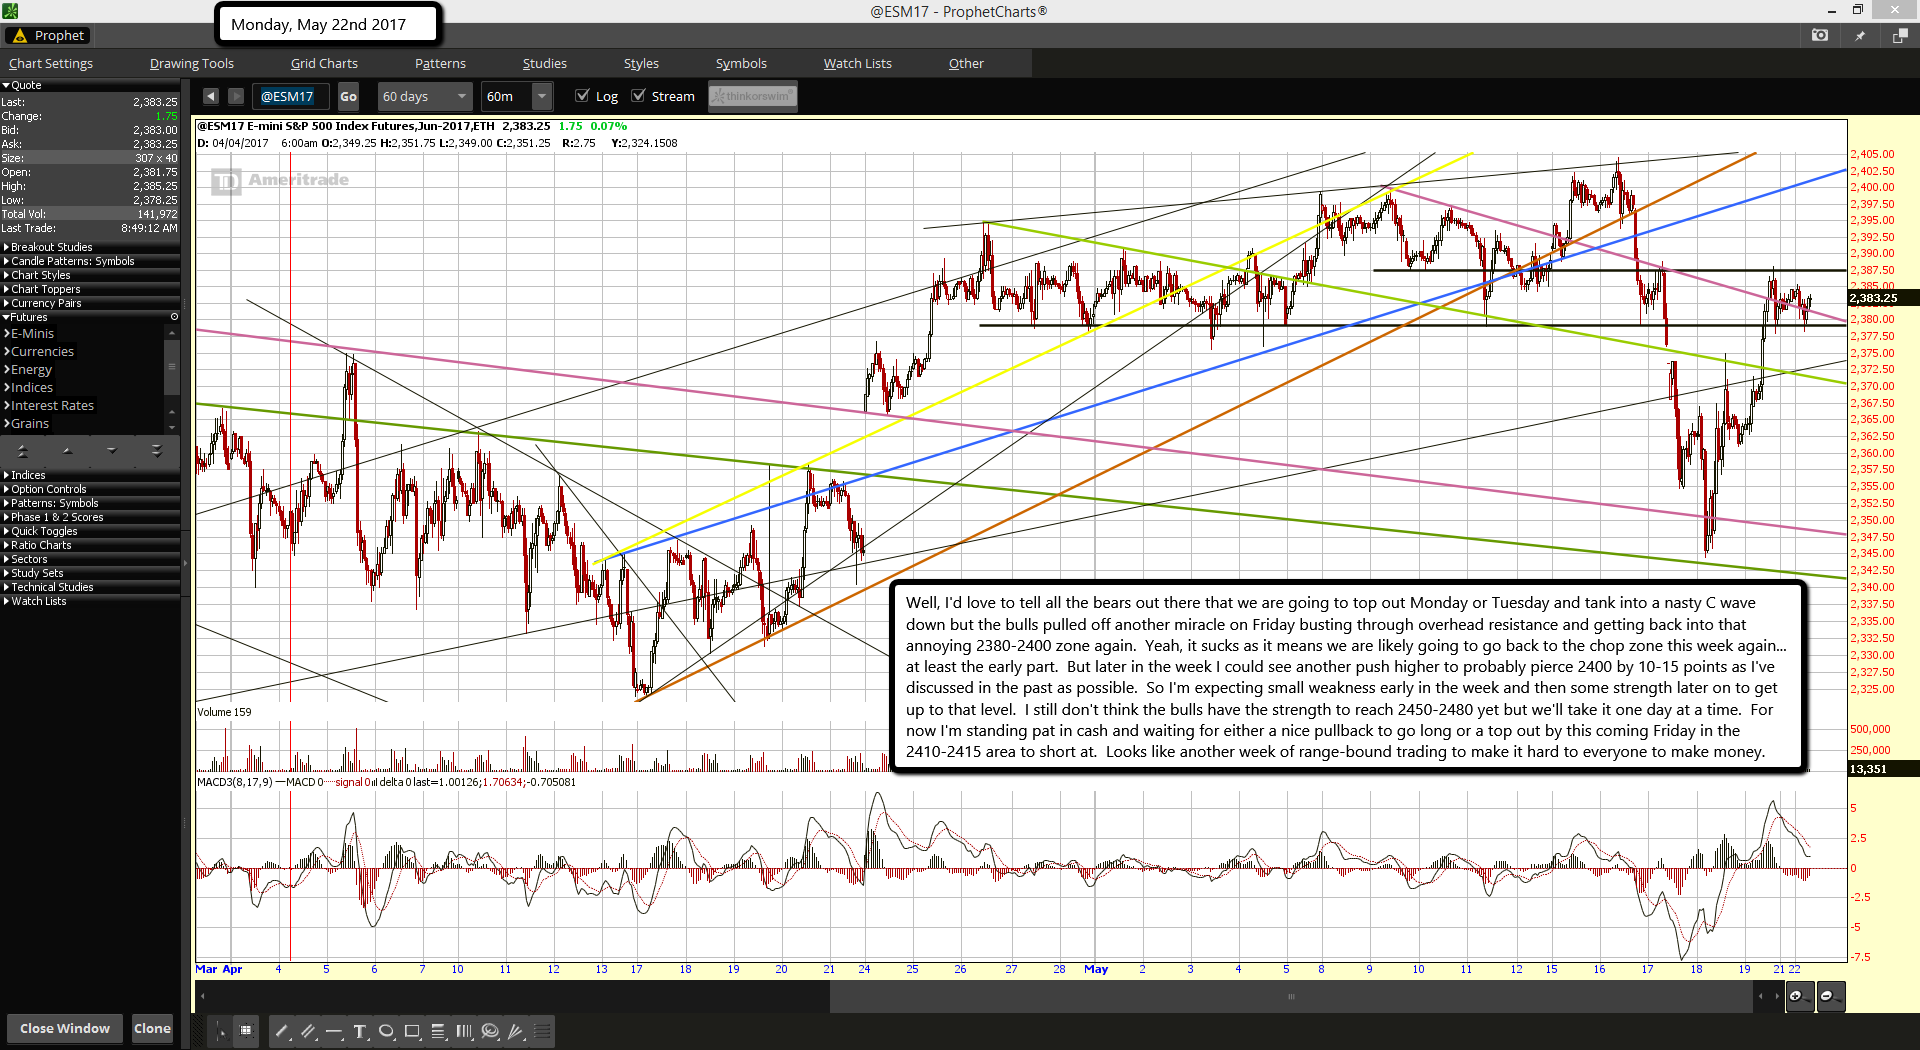
Well, I'd love to tell all the bears out there that we are going to top out Monday or Tuesday and tank into a nasty C wave down but the bulls pulled off another miracle on Friday busting through overhead resistance and getting back into that annoying 2380-2400 zone again.  Yeah, it sucks as it means we are likely going to go back to the chop zone this week again... at least the early part.  But later in the week I could see another push higher to probably pierce 2400 by 10-15 points as I've discussed in the past as possible.  So I'm expecting small weakness early in the week and then some strength later on to get up to that level.  I still don't think the bulls have the strength to reach 2450-2480 yet but we'll take it one day at a time.  For now I'm standing pat in cash and waiting for either a nice pullback to go long or a top out by this coming Friday in the 2410-2415 area to short at.  Looks like another week of range-bound trading to make it hard to everyone to make money.

ES Morning Update May 19th 2017

0

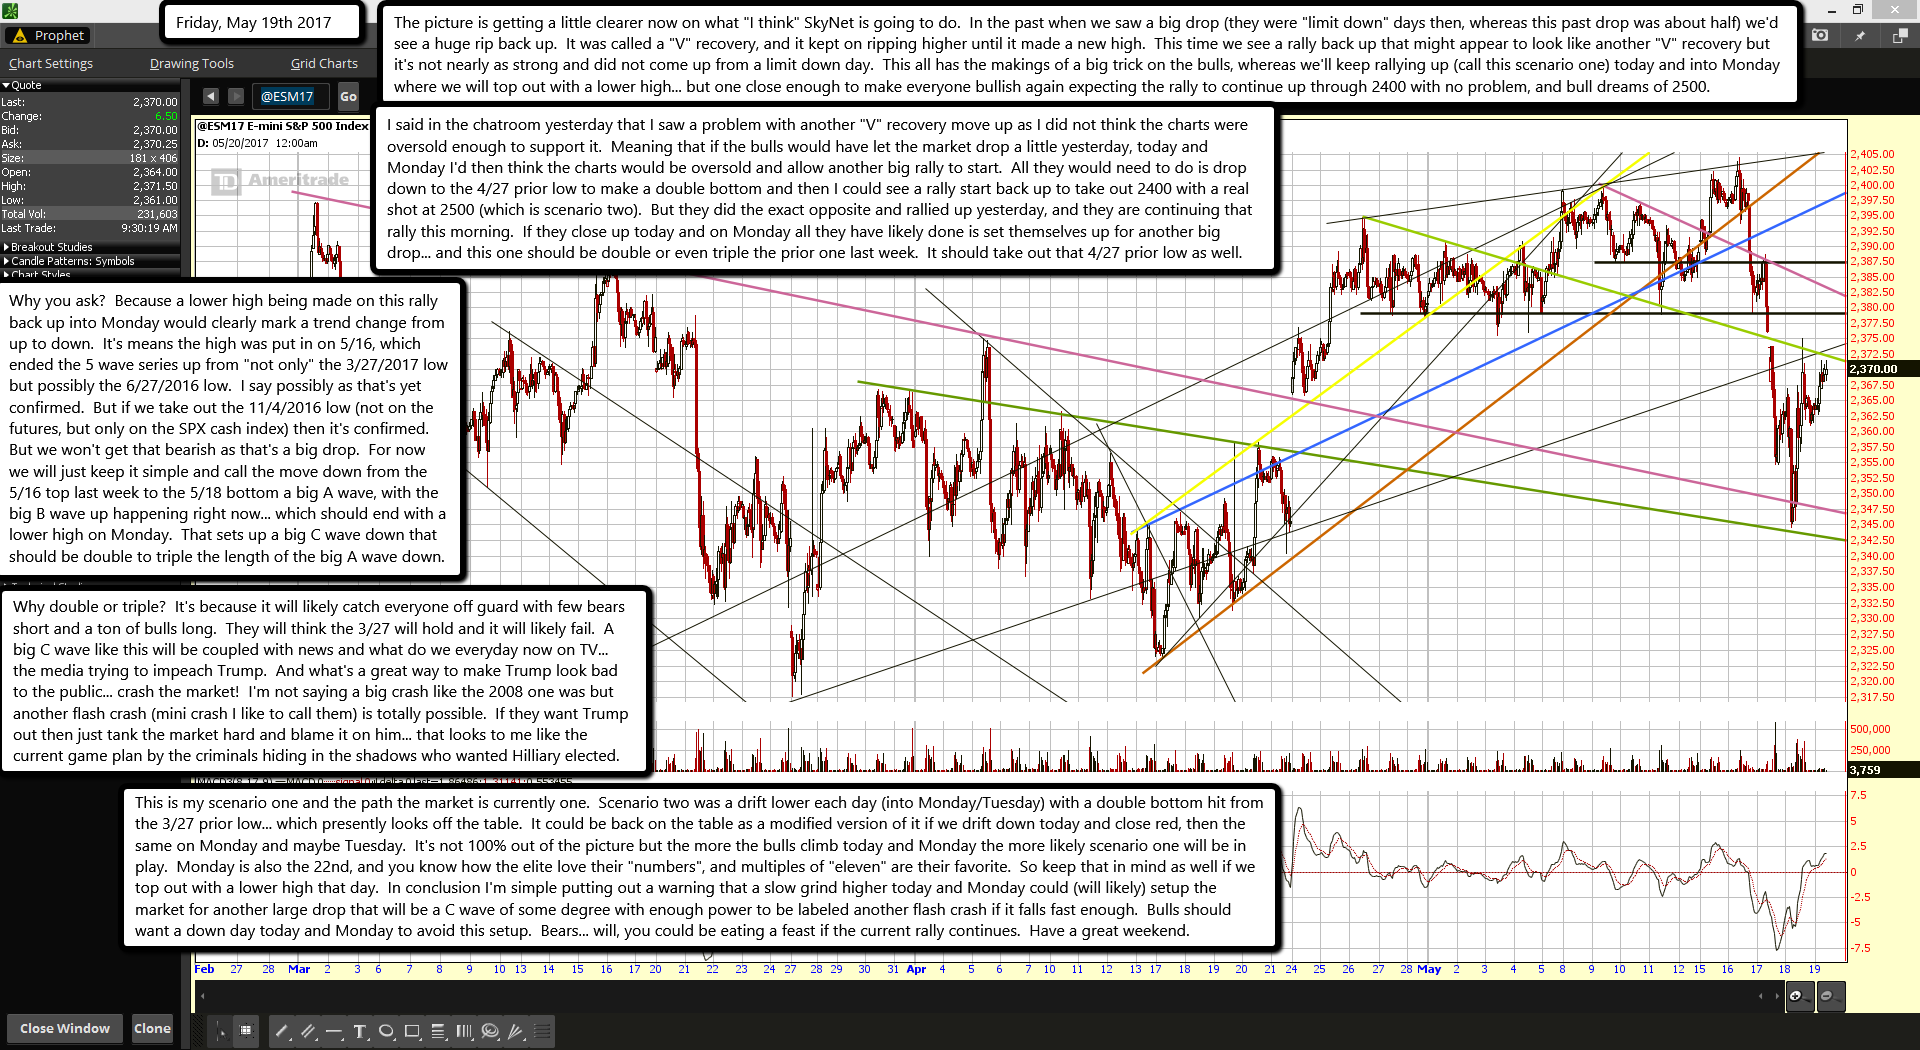
The picture is getting a little clearer now on what "I think" SkyNet is going to do.  In the past when we saw a big drop (they were "limit down" days then, whereas this past drop was about half) we'd see a huge rip back up.  It was called a "V" recovery, and it kept on ripping higher until it made a new high.  This time we see a rally back up that might appear to look like another "V" recovery but it's not nearly as strong and did not come up from a limit down day.  This all has the makings of a big trick on the bulls, whereas we'll keep rallying up (call this scenario one) today and into Monday where we will top out with a lower high... but one close enough to make everyone bullish again expecting the rally to continue up through 2400 with no problem, and bull dreams of 2500.

I said in the chatroom yesterday that I saw a problem with another "V" recovery move up as I did not think the charts were oversold enough to support it.  Meaning that if the bulls would have let the market drop a little yesterday, today and Monday I'd then think the charts would be oversold and allow another big rally to start.  All they would need to do is drop down to the 4/27 prior low to make a double bottom and then I could see a rally start back up to take out 2400 with a real shot at 2500 (which is scenario two).  But they did the exact opposite and rallied up yesterday, and they are continuing that rally this morning.  If they close up today and on Monday all they have likely done is set themselves up for another big drop... and this one should be double or even triple the prior one last week.  It should take out that 4/27 prior low as well.

Why you ask?  Because a lower high being made on this rally back up into Monday would clearly mark a trend change from up to down.  It's means the high was put in on 5/16, which ended the 5 wave series up from "not only" the 3/27/2017 low but possibly the 6/27/2016 low.  I say possibly as that's yet confirmed.  But if we take out the 11/4/2016 low (not on the futures, but only on the SPX cash index) then it's confirmed.  But we won't get that bearish as that's a big drop.  For now we will just keep it simple and call the move down from the 5/16 top last week to the 5/18 bottom a big A wave, with the big B wave up happening right now... which should end with a lower high on Monday.  That sets up a big C wave down that should be double to triple the length of the big A wave down.

Why double or triple?  It's because it will likely catch everyone off guard with few bears short and a ton of bulls long.  They will think the 3/27 will hold and it will likely fail.  A big C wave like this will be coupled with news and what do we everyday now on TV... the media trying to impeach Trump.  And what's a great way to make Trump look bad to the public... crash the market!  I'm not saying a big crash like the 2008 one was but another flash crash (mini crash I like to call them) is totally possible.  If they want Trump out then just tank the market hard and blame it on him... that looks to me like the current game plan by the criminals hiding in the shadows who wanted Hilliary elected.

This is my scenario one and the path the market is currently one.  Scenario two was a drift lower each day (into Monday/Tuesday) with a double bottom hit from the 3/27 prior low... which presently looks off the table.  It could be back on the table as a modified version of it if we drift down today and close red, then the same on Monday and maybe Tuesday.  It's not 100% out of the picture but the more the bulls climb today and Monday the more likely scenario one will be in play.  Monday is also the 22nd, and you know how the elite love their "numbers", and multiples of "eleven" are their favorite.  So keep that in mind as well if we top out with a lower high that day.  In conclusion I'm simple putting out a warning that a slow grind higher today and Monday could (will likely) setup the market for another large drop that will be a C wave of some degree with enough power to be labeled another flash crash if it falls fast enough.  Bulls should want a down day today and Monday to avoid this setup.  Bears... will, you could be eating a feast if the current rally continues.  Have a great weekend.

ES Morning Update May 18th 2017

0

WOW! They bears certainly kicked some butt yesterday!  It was unclear at the open yesterday whether or not the 2380 horizontal support area would hold but by the end of the day that level was long gone.  Gaps have been filled on most all charts now that were created on 4/24, and it looks like we've had a series of 5 waves down in total.  So we should be nearing a bottom today or tomorrow I believe, and then we'll have to play it by ear to see if the market runs back up to 2400+ in some super strong rally over the next few weeks or just puts in a lower high and drops again for a lower low.

Right now I'm trying to pick the bottom for a long entry.  At the open we should see the SPY fill its' 4/24 gap, as well as the SPX.  On the short term this market is quite oversold and ready for a bounce but on the daily there's plenty of downside left... so I'm not getting overly bullish for sure.  I'm only looking for a short term squeeze and then I'll have to re-calculate on whether the selling is done or another lower low is still coming.  But for today I'm not yet seeing a strong enough bottom, maybe we start some A wave up in the morning and B wave down into the close, where I'd then be interested in going long on the C wave up into Friday.  Today my attention will be on whether the futures hold the current low or not.

All in all I'm expected some up's and down's near the low most of the day and late in the day I'd expect a move up to start and close green... but how green is unknown?  Today will probably just setup tomorrow for a stronger rally up.  If I see a good spot to go long at where I think I've seen the A up and B down then I might jump in long, but if not I'd look for tomorrow for a better entry.  Anyway it goes though I don't see much more on the downside and a rally should start soon... like today or tomorrow.  But again, this might only be a move up for a lower high before another flush lower in a week or so.  It's just too early to know if this move up will squeeze and keep on squeezing the bears beyond 2400 or just some halfway point, or prior support now resistance level.  Anyway, today will be interesting to what I think but tough to trade.

ES Morning Update May 17th 2017

0

Looks like the rising wedge finally gave way last night as the futures fall back down to horizontal support around the 2380 area, which is super important right now as if it fails the big move down is likely started.  But if it holds I'd expect another run back up by the bulls to try once again to get past that 2400 area of major resistance.  Usually the bulls win as they have the Fed on their side.  So I'm really looking for a tease around the 2380 area several times today but no serious break.  Yeah, a quick pierce is likely but a real break would need the futures to close today below that level.  Therefore the bulls will want to dance on the line early in the day to tease the bears and then turn back late in the day and close over it.  The bears want a rally back up to start near the open that then can rollover later into the day allowing the downward momentum to carry afterhours where the 2380 could really be broken, not just pierced slightly.

For today I'd look to go long (small) if we the bulls tease the bears in the morning dance around 2380.  We should probably know by noon time I'd think but it really depends on how many bears take the bait and load short, therefore placing stops overhead... and that's the fuel the bulls are looking to build up so they can start another squeeze for the run to 2400 again.  If the bulls instead try to reverse this opening gap down early in the day we should see it stall out at some Fib. Level of 50% or 61.8%, where I'd be interesting in short it.  That's my plan of action for today.  While I'm not yet positive the high is in I'd still take these trades into tomorrow if they appear, and only small positions.  I'm still waiting the bigger setup to appear and I think it will be to the downside.  But I can't rule out some quick squeeze of 2400 that adds 10-15 points on to it, not just a point or two.  Looking back at prior drops like this (on the 6 hour chart) they usually reversed and went higher to shake out the bears, and then they rolled over.  Anyway, that's my plan for today.  Good Luck.

ES Morning Update May 16th 2017

0

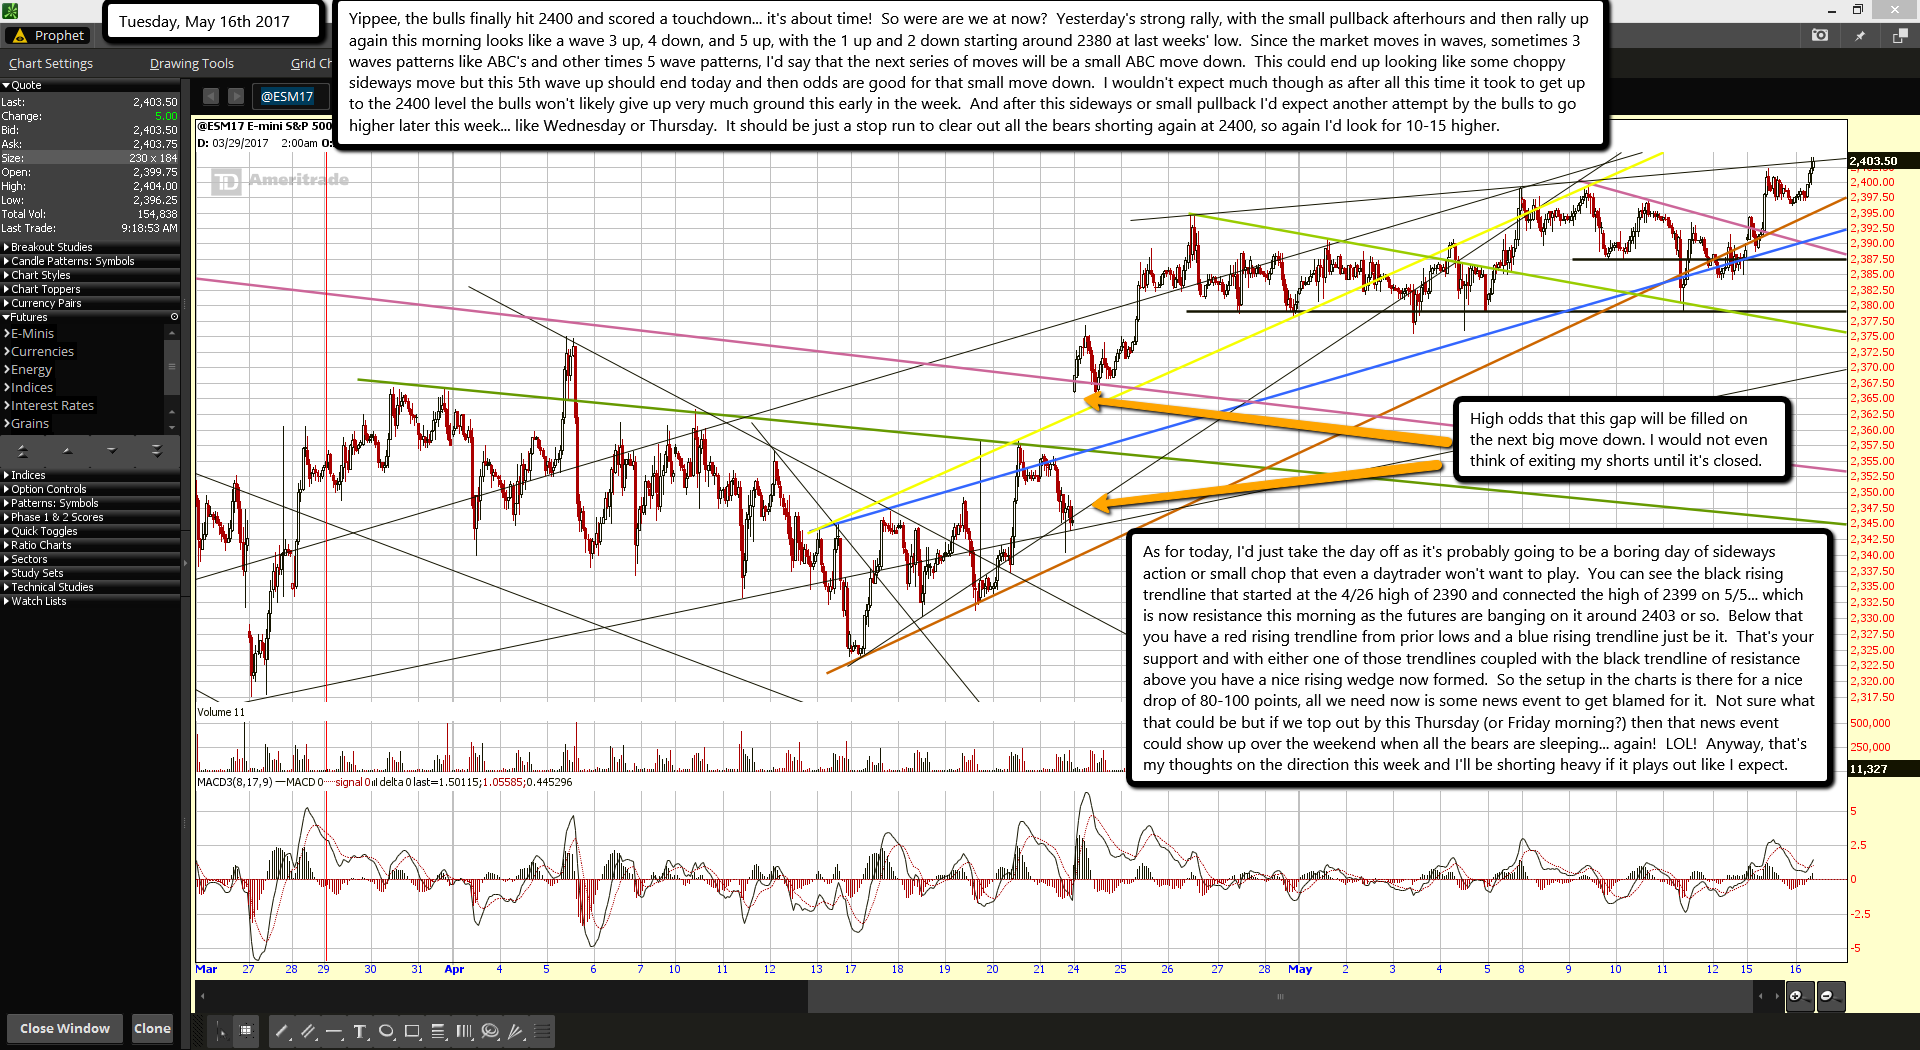
Yippee, the bulls finally hit 2400 and scored a touchdown... it's about time!  So were are we at now?  Yesterday's strong rally, with the small pullback afterhours and then rally up again this morning looks like a wave 3 up, 4 down, and 5 up, with the 1 up and 2 down starting around 2380 at last weeks' low.  Since the market moves in waves, sometimes 3 waves patterns like ABC's and other times 5 wave patterns, I'd say that the next series of moves will be a small ABC move down.  This could end up looking like some choppy sideways move but this 5th wave up should end today and then odds are good for that small move down.  I wouldn't expect much though as after all this time it took to get up to the 2400 level the bulls won't likely give up very much ground this early in the week.  And after this sideways or small pullback I'd expect another attempt by the bulls to go higher later this week... like Wednesday or Thursday.  It should be just a stop run to clear out all the bears shorting again at 2400, so again I'd look for 10-15 higher.

As for today, I'd just take the day off as it's probably going to be a boring day of sideways action or small chop that even a daytrader won't want to play.  You can see the black rising trendline that started at the 4/26 high of 2390 and connected the high of 2399 on 5/5... which is now resistance this morning as the futures are banging on it around 2403 or so.  Below that you have a red rising trendline from prior lows and a blue rising trendline just be it.  That's your support and with either one of those trendlines coupled with the black trendline of resistance above you have a nice rising wedge now formed.  So the setup in the charts is there for a nice drop of 80-100 points, all we need now is some news event to get blamed for it.  Not sure what that could be but if we top out by this Thursday (or Friday morning?) then that news event could show up over the weekend when all the bears are sleeping... again!  LOL!  Anyway, that's my thoughts on the direction this week and I'll be shorting heavy if it plays out like I expect.

ES Morning Update May 15th 2017

0

I hope everyone had a great mother's day weekend and spent quality time with your mother as I got the chance to do over the last 3 years of being back home close to mine.  While I love Florida and enjoyed spending 25 years there it was also about 700 miles away from my family.  I guess the old saying is true about kids leaving the nest egg as adults and going to other cities, but later in life they get that call to come back home again.

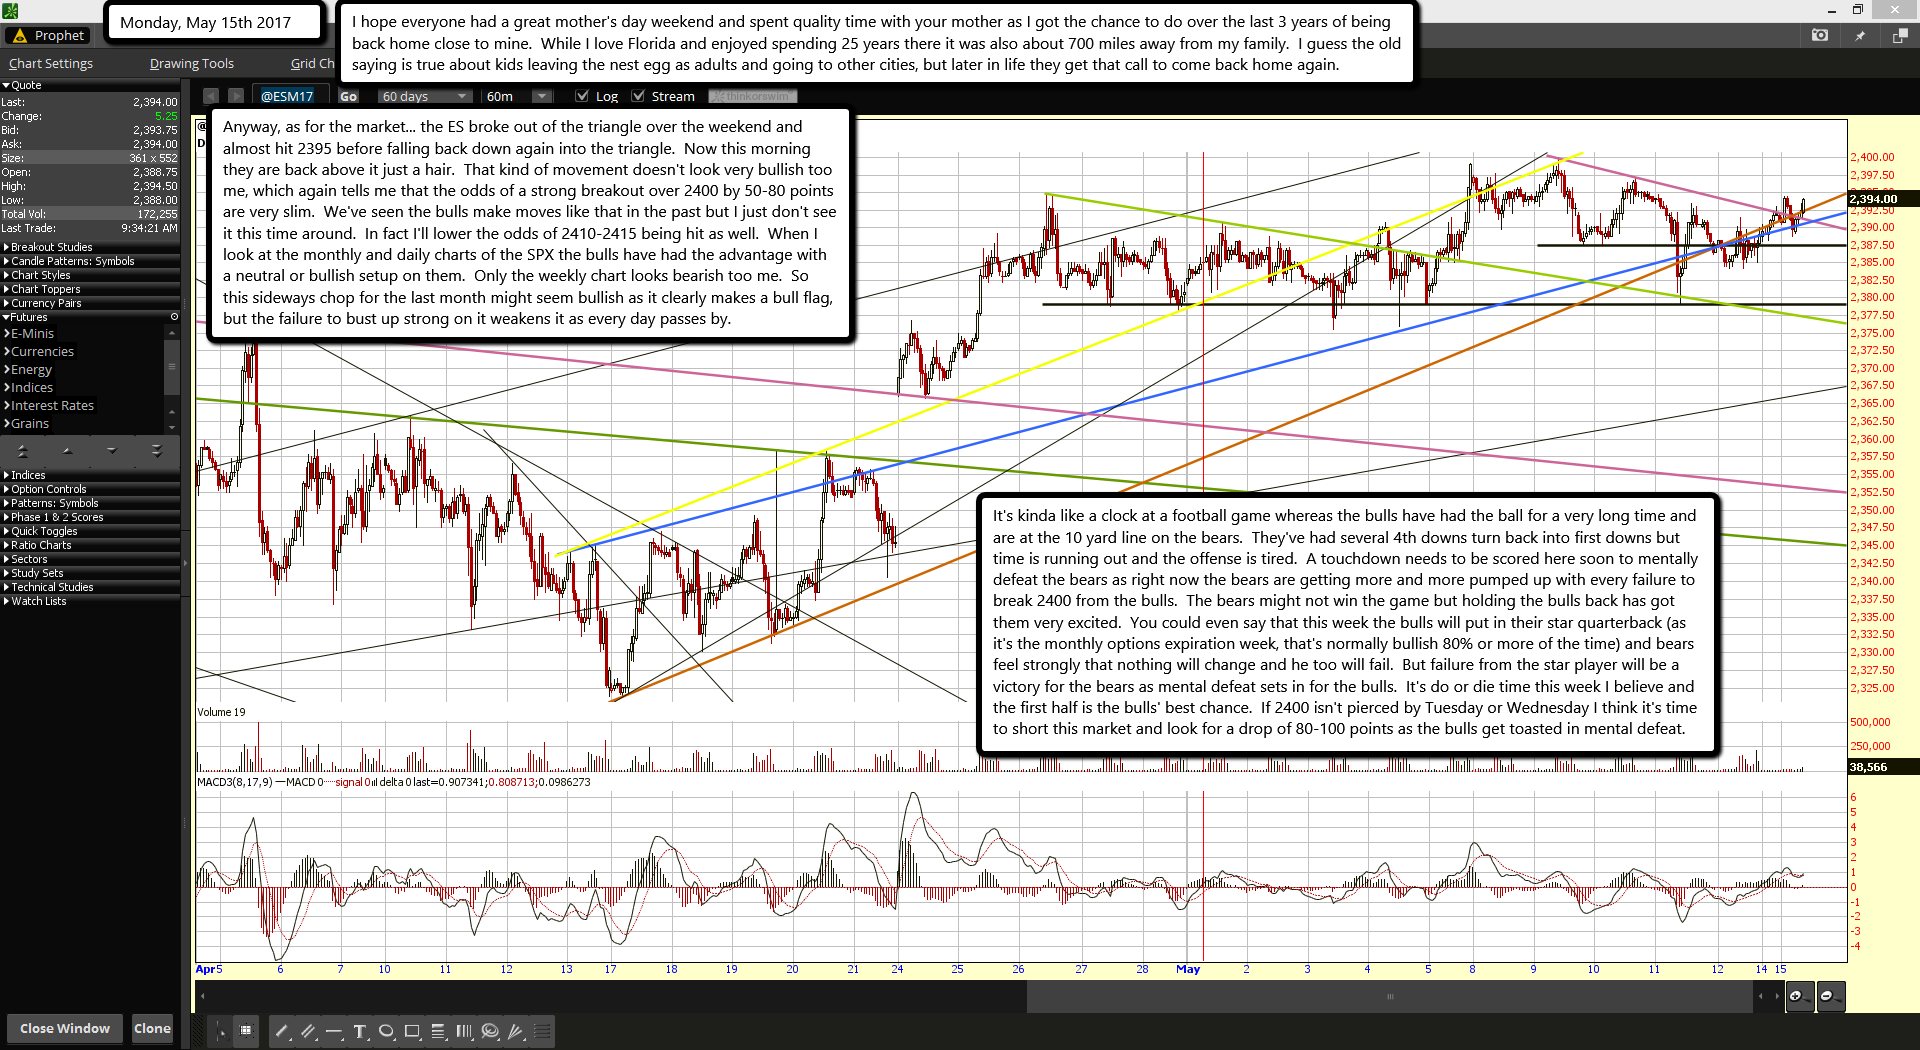
Anyway, as for the market... the ES broke out of the triangle over the weekend and almost hit 2395 before falling back down again into the triangle.  Now this morning they are back above it just a hair.  That kind of movement doesn't look very bullish too me, which again tells me that the odds of a strong breakout over 2400 by 50-80 points are very slim.  We've seen the bulls make moves like that in the past but I just don't see it this time around.  In fact I'll lower the odds of 2410-2415 being hit as well.  When I look at the monthly and daily charts of the SPX the bulls have had the advantage with a neutral or bullish setup on them.  Only the weekly chart looks bearish too me.  So this sideways chop for the last month might seem bullish as it clearly makes a bull flag, but the failure to bust up strong on it weakens it as every day passes by.

It's kinda like a clock at a football game whereas the bulls have had the ball for a very long time and are at the 10 yard line on the bears.  They've had several 4th downs turn back into first downs but time is running out and the offense is tired.  A touchdown needs to be scored here soon to mentally defeat the bears as right now the bears are getting more and more pumped up with every failure to break 2400 from the bulls.  The bears might not win the game but holding the bulls back has got them very excited.  You could even say that this week the bulls will put in their star quarterback (as it's the monthly options expiration week, that's normally bullish 80% or more of the time) and bears feel strongly that nothing will change and he too will fail.  But failure from the star player will be a victory for the bears as mental defeat sets in for the bulls.  It's do or die time this week I believe and the first half is the bulls' best chance.  If 2400 isn't pierced by Tuesday or Wednesday I think it's time to short this market and look for a drop of 80-100 points as the bulls get toasted in mental defeat.

s2Member®