Wednesday, August 26, 2026
Home Blog Page 60

ES Morning Update July 10th 2017

0

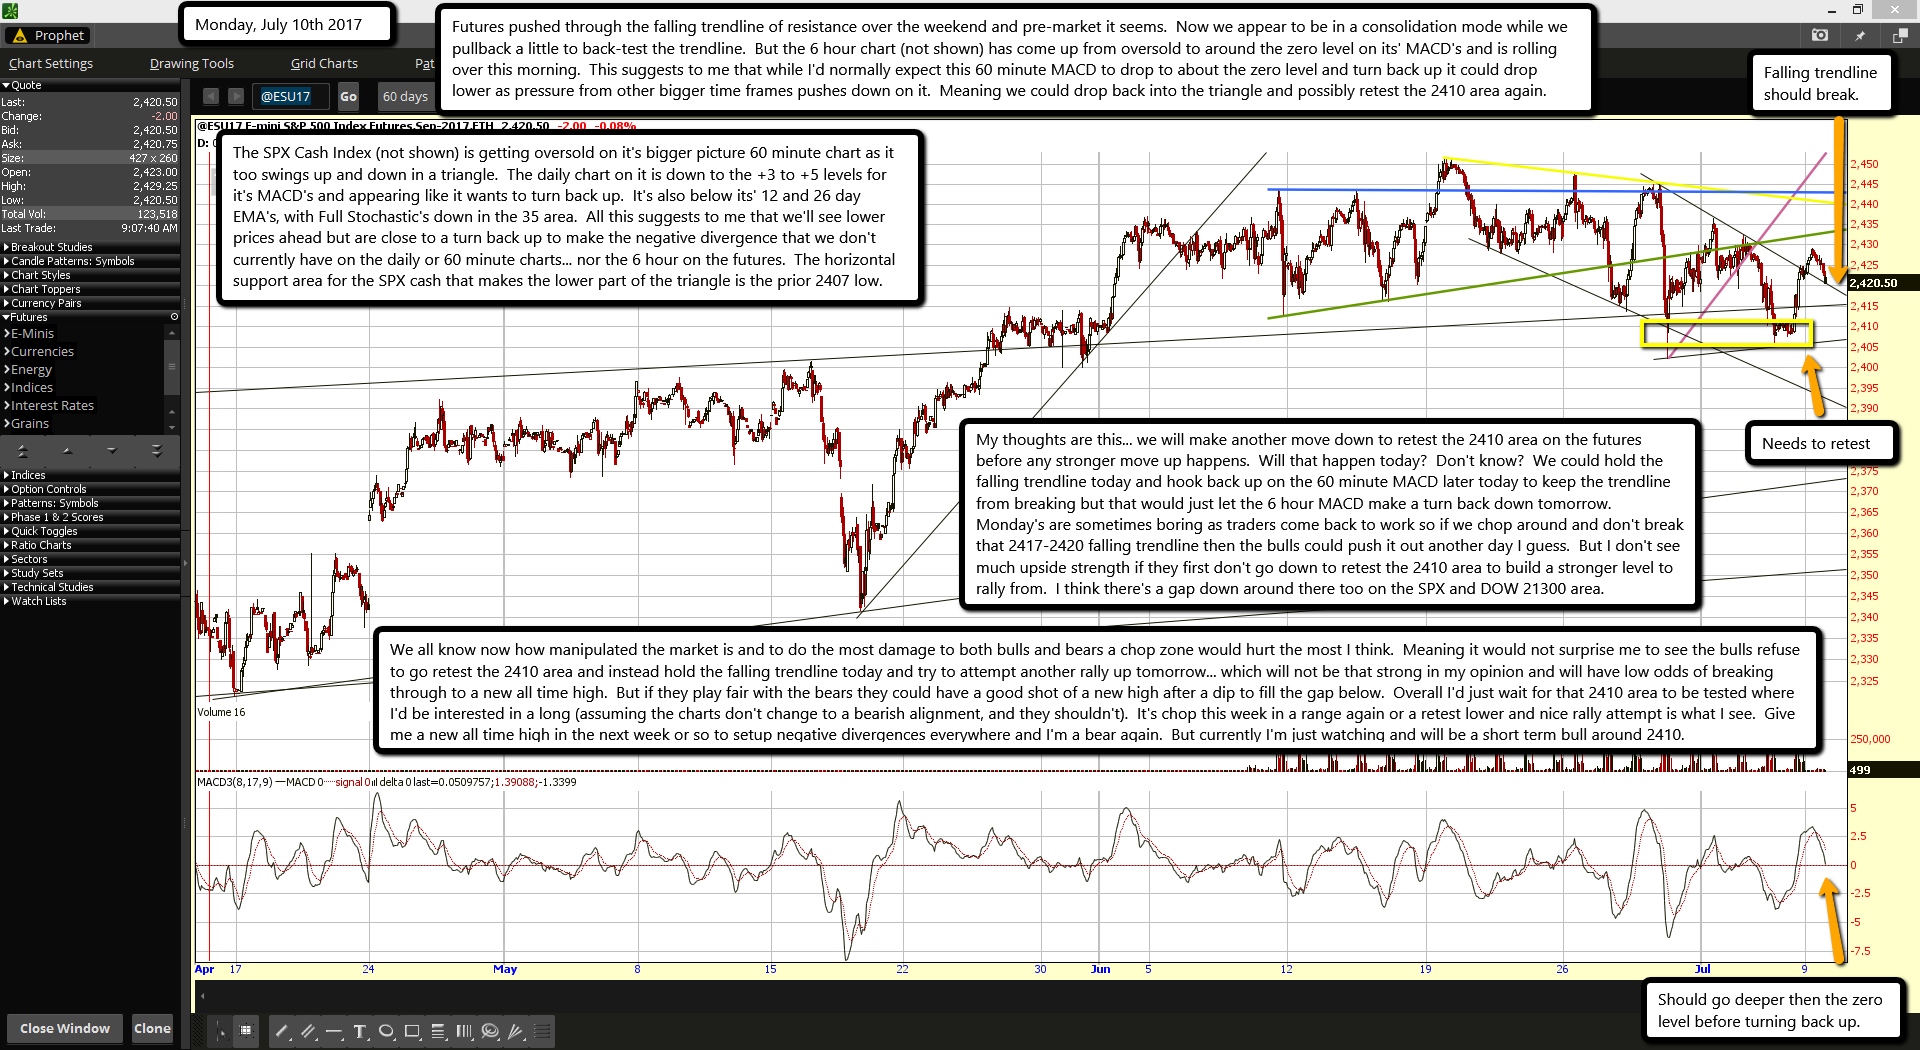
Futures pushed through the falling trendline of resistance over the weekend and pre-market it seems.  Now we appear to be in a consolidation mode while we pullback a little to back-test the trendline.  But the 6 hour chart (not shown) has come up from oversold to around the zero level on its' MACD's and is rolling over this morning.  This suggests to me that while I'd normally expect this 60 minute MACD to drop to about the zero level and turn back up it could drop lower as pressure from other bigger time frames pushes down on it.  Meaning we could drop back into the triangle and possibly retest the 2410 area again.

The SPX Cash Index (not shown) is getting oversold on it's bigger picture 60 minute chart as it too swings up and down in a triangle.  The daily chart on it is down to the +3 to +5 levels for it's MACD's and appearing like it wants to turn back up.  It's also below its' 12 and 26 day EMA's, with Full Stochastic's down in the 35 area.  All this suggests to me that we'll see lower prices ahead but are close to a turn back up to make the negative divergence that we don't currently have on the daily or 60 minute charts... nor the 6 hour on the futures.  The horizontal support area for the SPX cash that makes the lower part of the triangle is the prior 2407 low.

My thoughts are this... we will make another move down to retest the 2410 area on the futures before any stronger move up happens.  Will that happen today?  Don't know?  We could hold the falling trendline today and hook back up on the 60 minute MACD later today to keep the trendline from breaking but that would just let the 6 hour MACD make a turn back down tomorrow.  Monday's are sometimes boring as traders come back to work so if we chop around and don't break that 2417-2420 falling trendline then the bulls could push it out another day I guess.  But I don't see much upside strength if they first don't go down to retest the 2410 area to build a stronger level to rally from.  I think there's a gap down around there too on the SPX and DOW 21300 area.

We all know now how manipulated the market is and to do the most damage to both bulls and bears a chop zone would hurt the most I think.  Meaning it would not surprise me to see the bulls refuse to go retest the 2410 area and instead hold the falling trendline today and try to attempt another rally up tomorrow... which will not be that strong in my opinion and will have low odds of breaking through to a new all time high.  But if they play fair with the bears they could have a good shot of a new high after a dip to fill the gap below.  Overall I'd just wait for that 2410 area to be tested where I'd be interested in a long (assuming the charts don't change to a bearish alignment, and they shouldn't).  It's chop this week in a range again or a retest lower and nice rally attempt is what I see.  Give me a new all time high in the next week or so to setup negative divergences everywhere and I'm a bear again.  But currently I'm just watching and will be a short term bull around 2410.

ES Morning Update July 7th 2017

0

The futures have turned back up a little from being oversold yesterday.  Today looks very likely to be a bullish day as many charts are aligning up together on the futures and spx cash in different time frames.  Resistance is the falling trendline in black that's around 2421-2423 or so.  Support is of course yesterdays low, but charts don't support much downside today.  Maybe we see some small pullback late in the day but currently things are aligning up nicely for the bulls.

The question will be... can the bulls take out resistance and get stronger move going to squeeze the bears?  Hard to say at this point but the bulls have good alignment today in the charts and therefore have a good shot at busting through that falling trendline in black and making a run for 2430-2435 area.  But if they fail to get through it today odds will shift to the bears come Monday I believe as by then the bullish setup will no longer be valid.  So it's going to be a critical day for the bulls as if they can breakout to the upside the momentum can keep the charts bullish into early next week, but if they don't get past that falling trendline I fear the bear will take it back down Monday.  That's all I see for today.  Bulls need to get going to the upside or risk another move down early next week.

ES Morning Update July 6th 2017

0

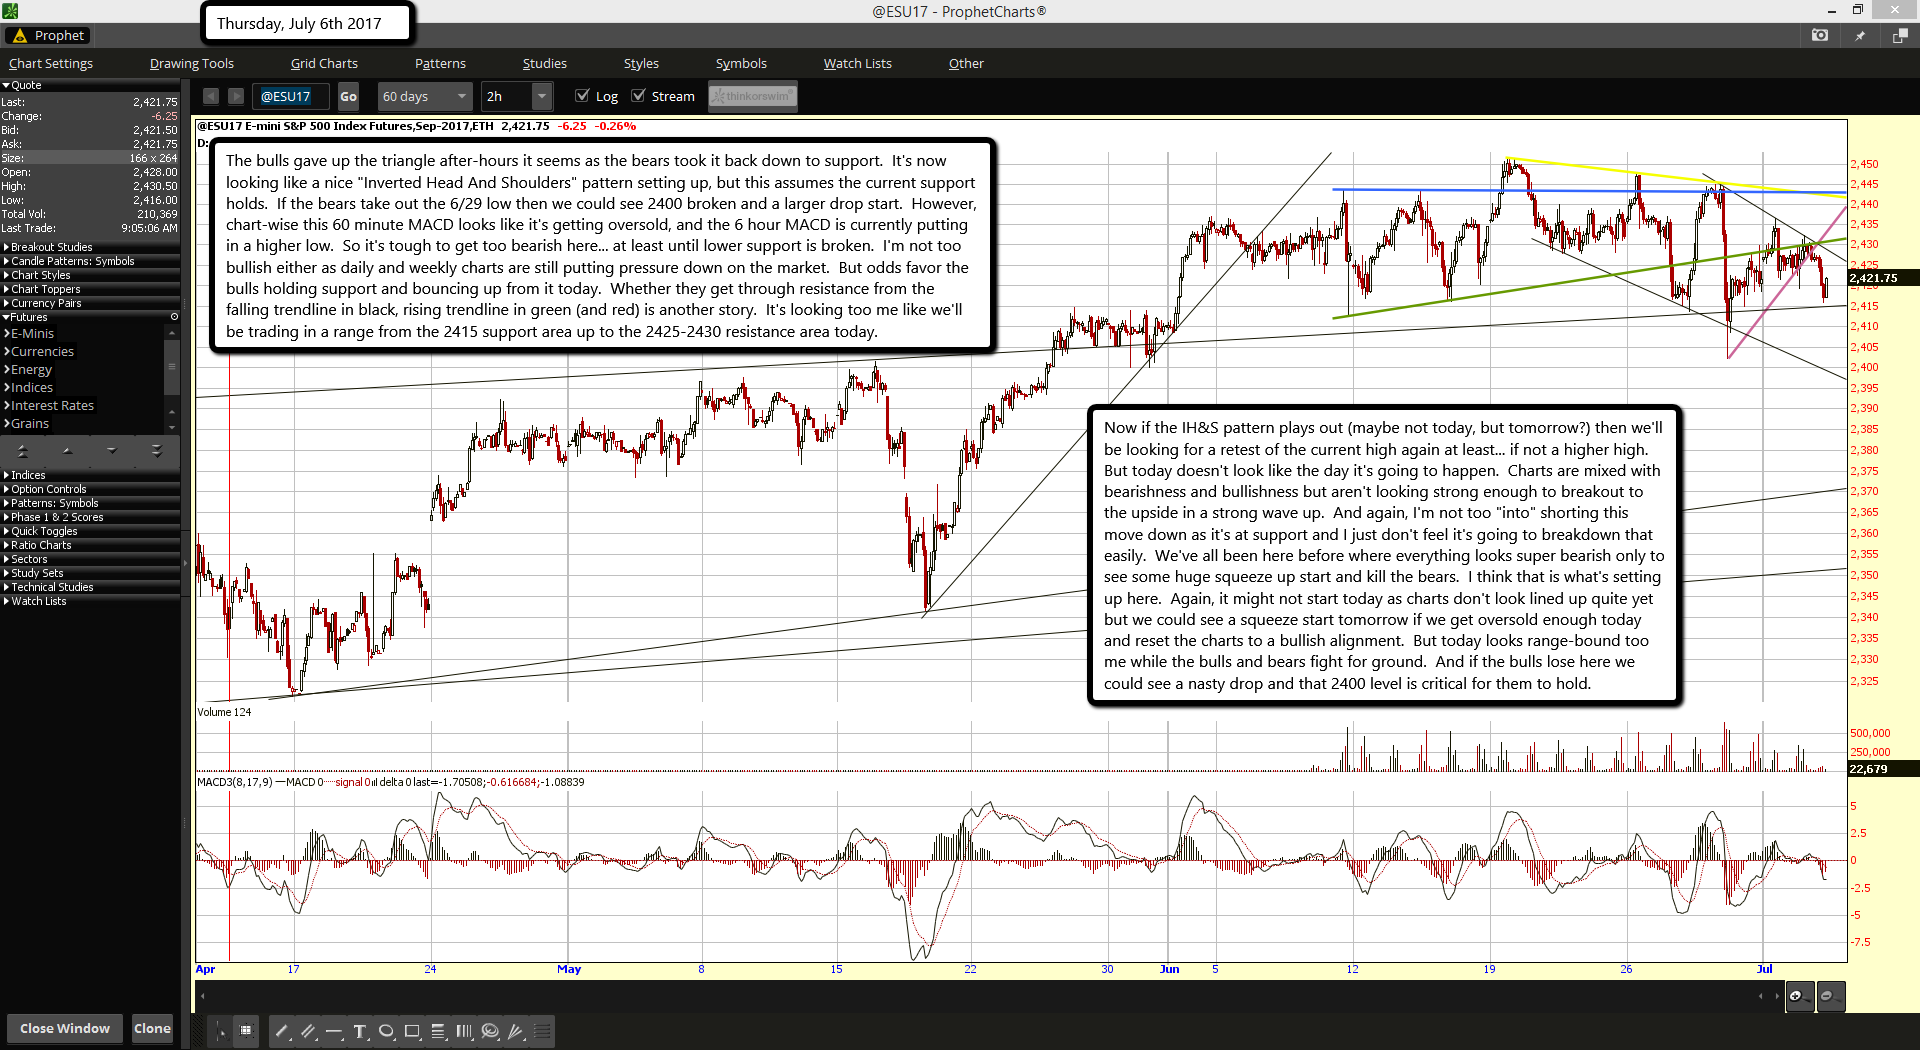
The bulls gave up the triangle after-hours it seems as the bears took it back down to support.  It's now looking like a nice "Inverted Head And Shoulders" pattern setting up, but this assumes the current support holds.  If the bears take out the 6/29 low then we could see 2400 broken and a larger drop start.  However, chart-wise this 60 minute MACD looks like it's getting oversold, and the 6 hour MACD is currently putting in a higher low.  So it's tough to get too bearish here... at least until lower support is broken.  I'm not too bullish either as daily and weekly charts are still putting pressure down on the market.  But odds favor the bulls holding support and bouncing up from it today.  Whether they get through resistance from the falling trendline in black, rising trendline in green (and red) is another story.  It's looking too me like we'll be trading in a range from the 2415 support area up to the 2425-2430 resistance area today.

Now if the IH&S pattern plays out (maybe not today, but tomorrow?) then we'll be looking for a retest of the current high again at least... if not a higher high.  But today doesn't look like the day it's going to happen.  Charts are mixed with bearishness and bullishness but aren't looking strong enough to breakout to the upside in a strong wave up.  And again, I'm not too "into" shorting this move down as it's at support and I just don't feel it's going to breakdown that easily.  We've all been here before where everything looks super bearish only to see some huge squeeze up start and kill the bears.  I think that is what's setting up here.  Again, it might not start today as charts don't look lined up quite yet but we could see a squeeze start tomorrow if we get oversold enough today and reset the charts to a bullish alignment.  But today looks range-bound too me while the bulls and bears fight for ground.  And if the bulls lose here we could see a nasty drop and that 2400 level is critical for them to hold.

ES Morning Update July 5th 2017

0

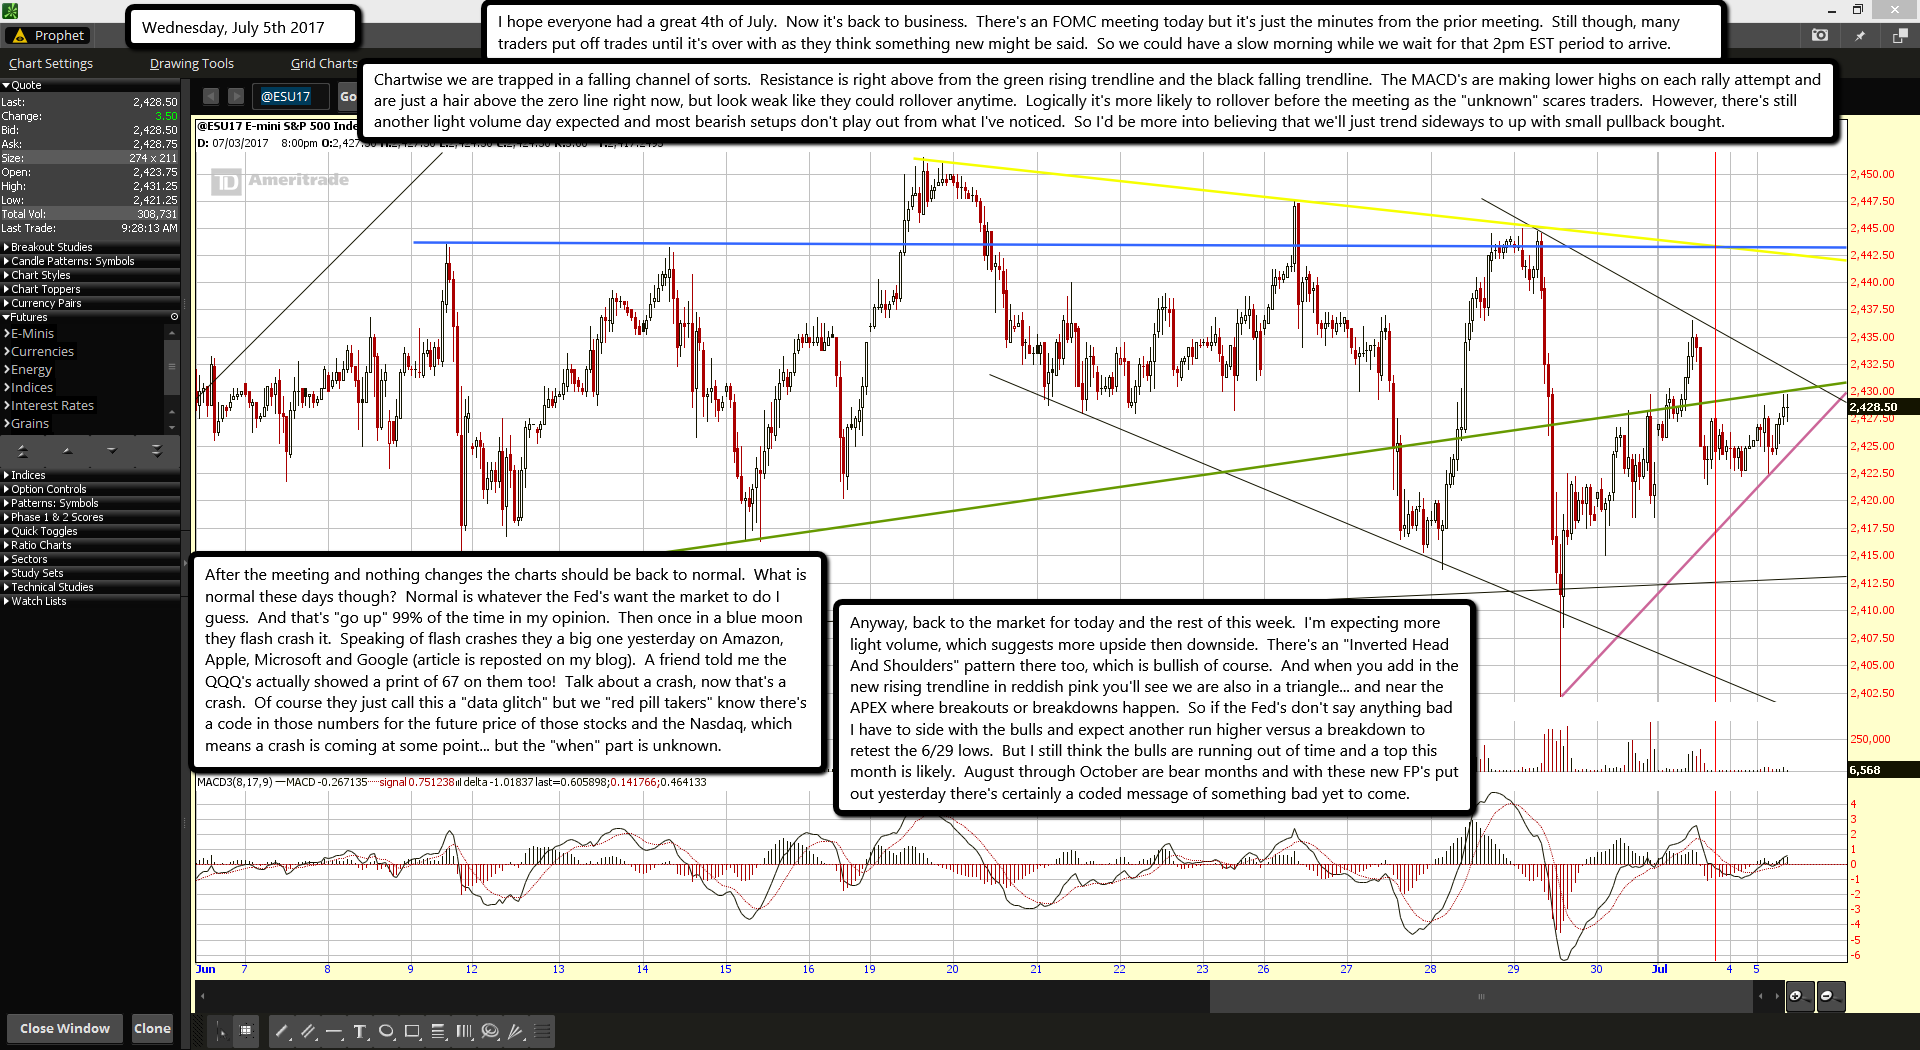
I hope everyone had a great 4th of July.  Now it's back to business.  There's an FOMC meeting today but it's just the minutes from the prior meeting.  Still though, many traders put off trades until it's over with as they think something new might be said.  So we could have a slow morning while we wait for that 2pm EST period to arrive.

Chartwise we are trapped in a falling channel of sorts.  Resistance is right above from the green rising trendline and the black falling trendline.  The MACD's are making lower highs on each rally attempt and are just a hair above the zero line right now, but look weak like they could rollover anytime.  Logically it's more likely to rollover before the meeting as the "unknown" scares traders.  However, there's still another light volume day expected and most bearish setups don't play out from what I've noticed.  So I'd be more into believing that we'll just trend sideways to up with small pullback bought.

After the meeting and nothing changes the charts should be back to normal.  What is normal these days though?  Normal is whatever the Fed's want the market to do I guess.  And that's "go up" 99% of the time in my opinion.  Then once in a blue moon they flash crash it.  Speaking of flash crashes they a big one yesterday on Amazon, Apple, Microsoft and Google (article is re-posted on my blog).  A friend told me the QQQ's actually showed a print of 67 on them too!  Talk about a crash, now that's a crash.  Of course they just call this a "data glitch" but we "red pill takers" know there's a code in those numbers for the future price of those stocks and the Nasdaq, which means a crash is coming at some point... but the "when" part is unknown.

Anyway, back to the market for today and the rest of this week.  I'm expecting more light volume, which suggests more upside then downside.  There's an "Inverted Head And Shoulders" pattern there too, which is bullish of course.  And when you add in the new rising trendline in reddish pink you'll see we are also in a triangle... and near the APEX where breakouts or breakdowns happen.  So if the Fed's don't say anything bad I have to side with the bulls and expect another run higher versus a breakdown to retest the 6/29 lows.  But I still think the bulls are running out of time and a top this month is likely.  August through October are bear months and with these new FP's put out yesterday there's certainly a coded message of something bad yet to come.

Data glitch sets tech company stock prices at $123.47

0

Amazon went down 87 percent, and Zynga was up 3,292 percent

ES Morning Update July 3rd 2017

0

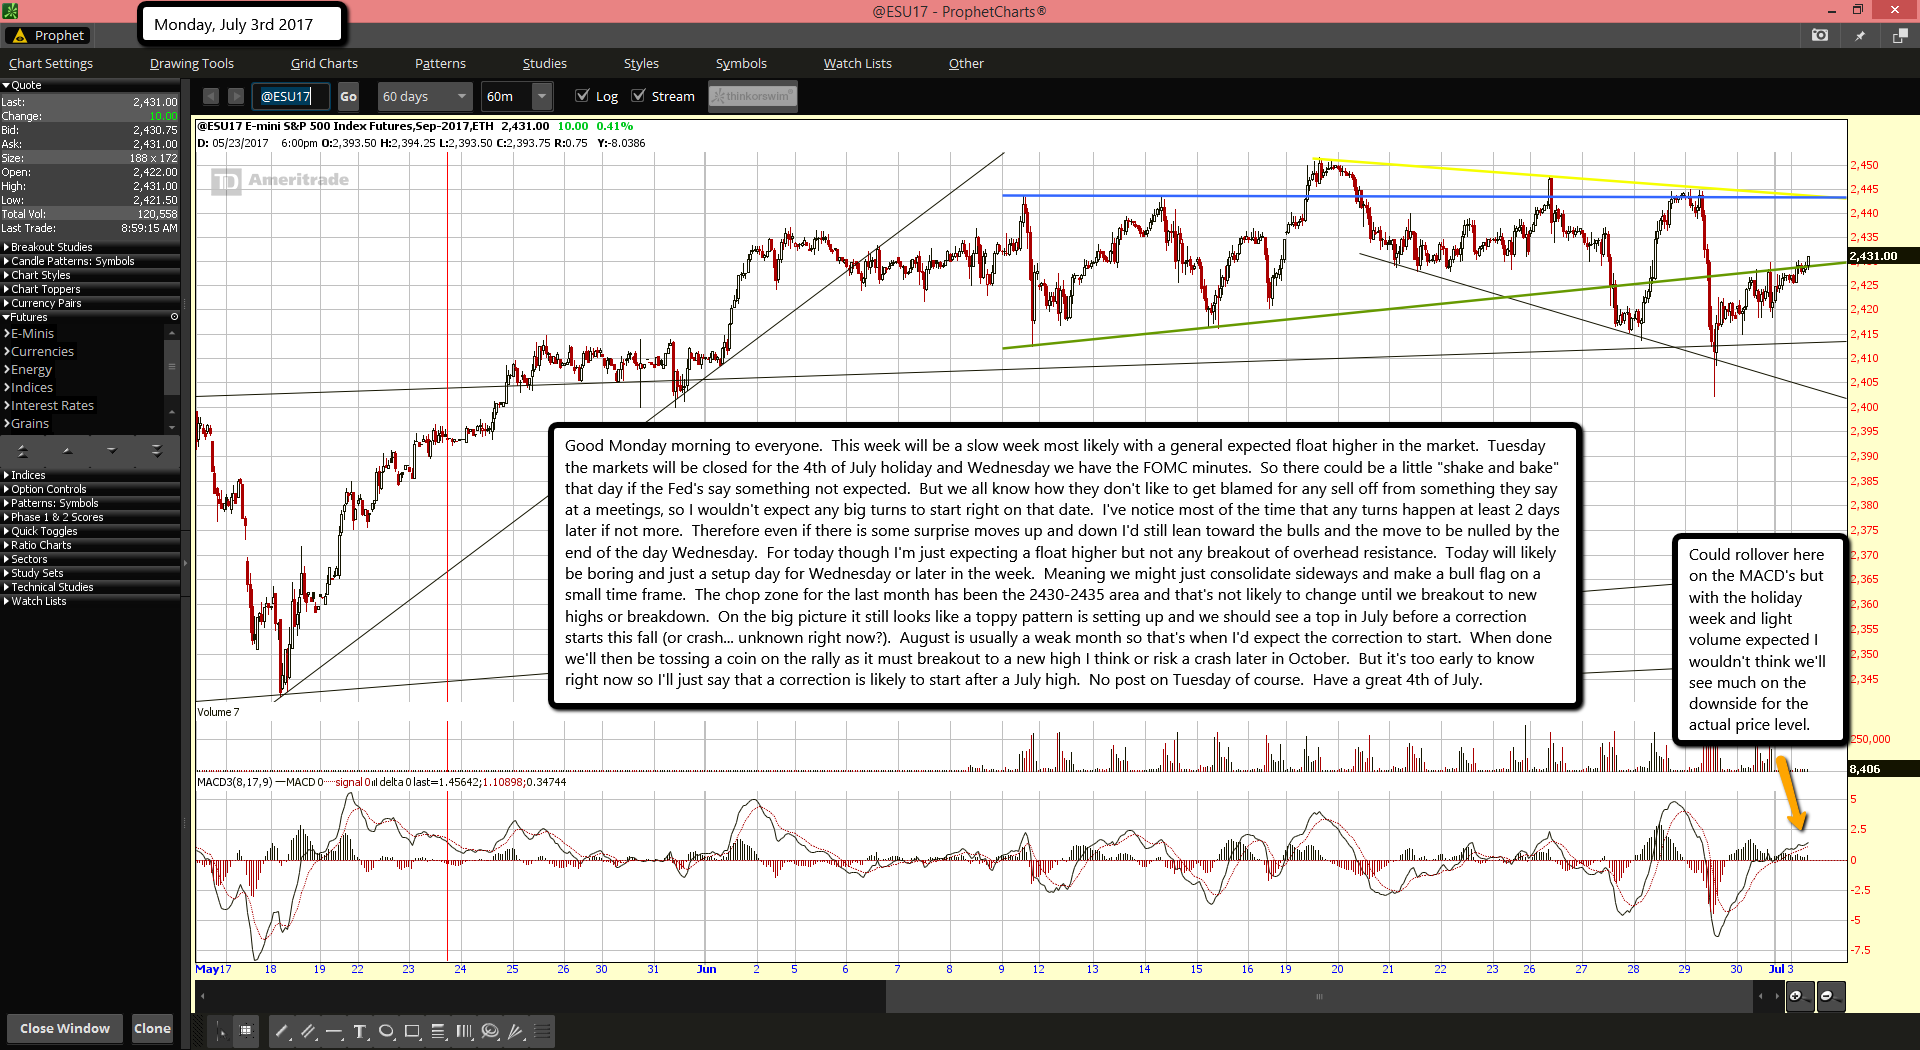
Good Monday morning to everyone.  This week will be a slow week most likely with a general expected float higher in the market.  Tuesday the markets will be closed for the 4th of July holiday and Wednesday we have the FOMC minutes.  So there could be a little "shake and bake" that day if the Fed's say something not expected.  But we all know how they don't like to get blamed for any sell off from something they say at a meetings, so I wouldn't expect any big turns to start right on that date.  I've notice most of the time that any turns happen at least 2 days later if not more.  Therefore even if there is some surprise moves up and down I'd still lean toward the bulls and the move to be nulled by the end of the day Wednesday.  For today though I'm just expecting a float higher but not any breakout of overhead resistance.  Today will likely be boring and just a setup day for Wednesday or later in the week.  Meaning we might just consolidate sideways and make a bull flag on a small time frame.  The chop zone for the last month has been the 2430-2435 area and that's not likely to change until we breakout to new highs or breakdown.  On the big picture it still looks like a toppy pattern is setting up and we should see a top in July before a correction starts this fall (or crash... unknown right now?).  August is usually a weak month so that's when I'd expect the correction to start.  When done we'll then be tossing a coin on the rally as it must breakout to a new high I think or risk a crash later in October.  But it's too early to know right now so I'll just say that a correction is likely to start after a July high.  No post on Tuesday of course.  Have a great 4th of July.

ES Morning Update June 30th 2017

0

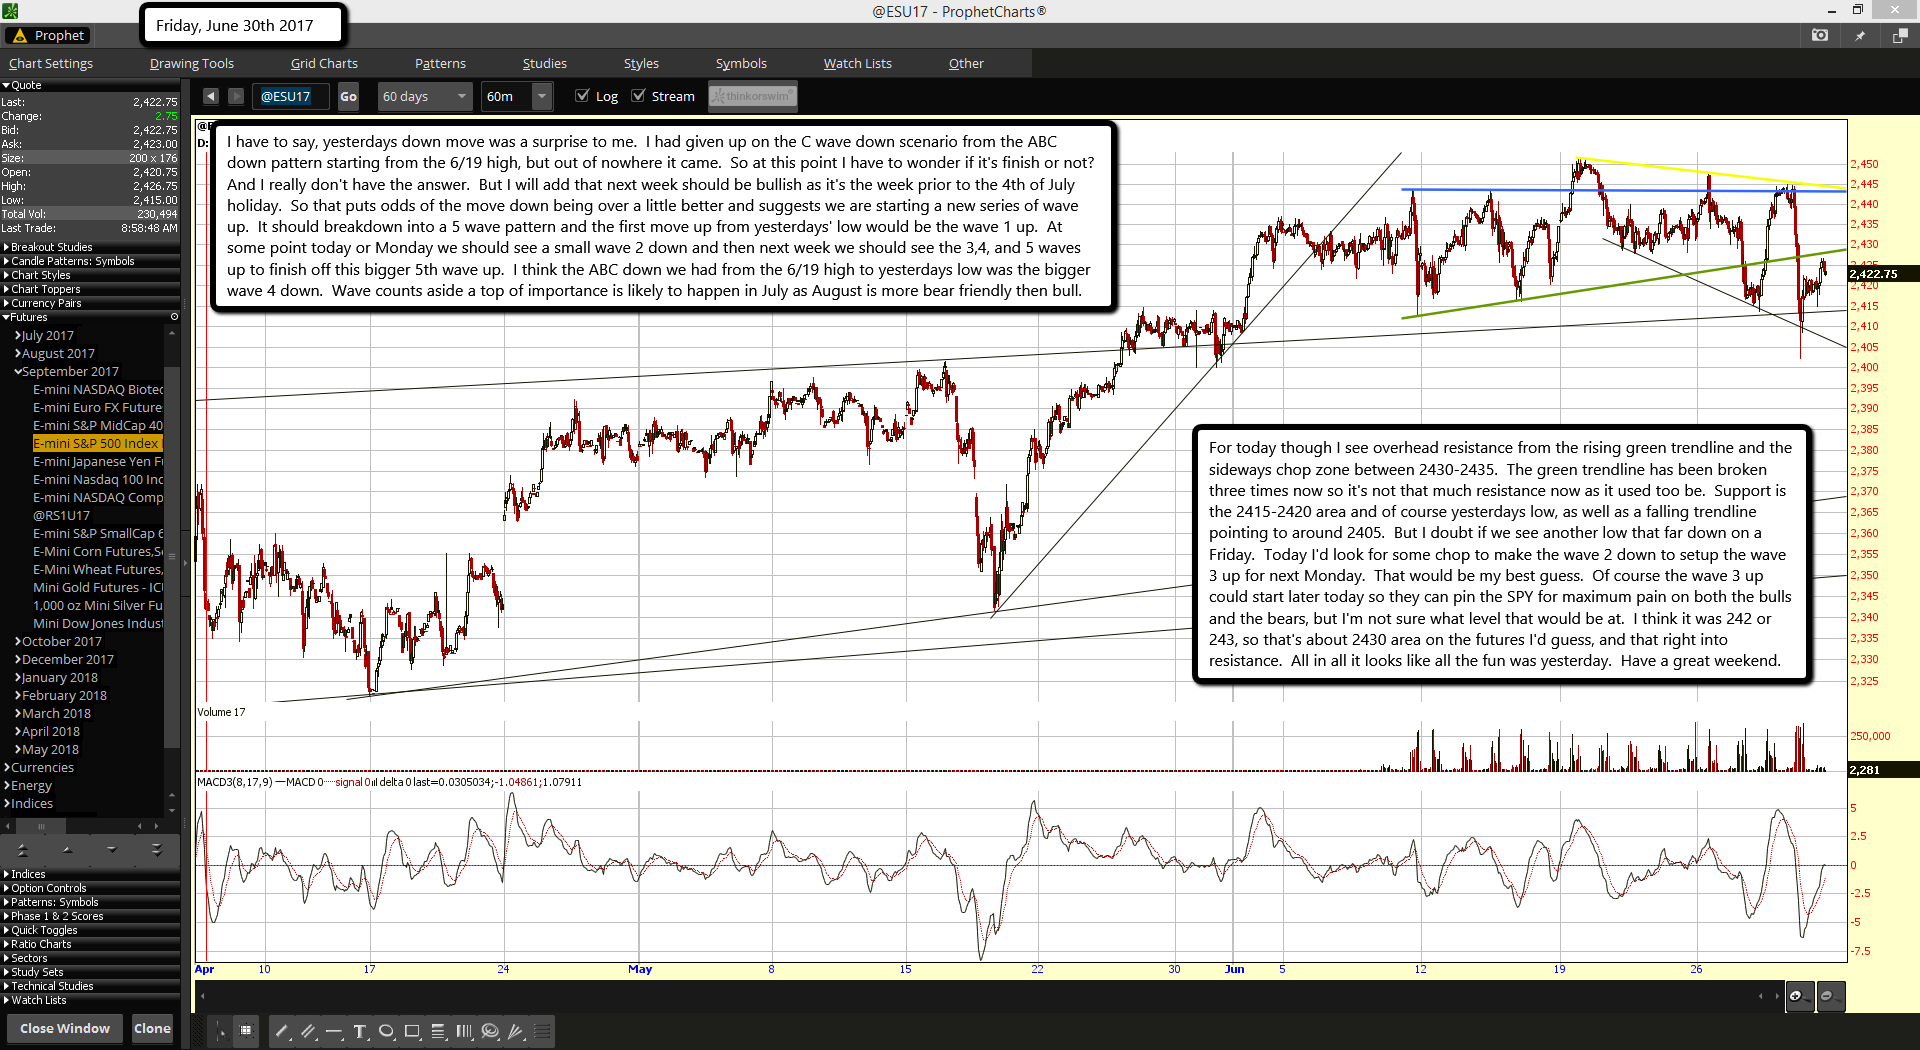
I have to say, yesterdays down move was a surprise to me.  I had given up on the C wave down scenario from the ABC down pattern starting from the 6/19 high, but out of nowhere it came.  So at this point I have to wonder if it's finish or not?  And I really don't have the answer.  But I will add that next week should be bullish as it's the week prior to the 4th of July holiday.  So that puts odds of the move down being over a little better and suggests we are starting a new series of wave up.  It should breakdown into a 5 wave pattern and the first move up from yesterdays' low would be the wave 1 up.  At some point today or Monday we should see a small wave 2 down and then next week we should see the 3,4, and 5 waves up to finish off this bigger 5th wave up.  I think the ABC down we had from the 6/19 high to yesterdays low was the bigger wave 4 down.  Wave counts aside a top of importance is likely to happen in July as August is more bear friendly then bull.

For today though I see overhead resistance from the rising green trendline and the sideways chop zone between 2430-2435.  The green trendline has been broken three times now so it's not that much resistance now as it used too be.  Support is the 2415-2420 area and of course yesterdays low, as well as a falling trendline pointing to around 2405.  But I doubt if we see another low that far down on a Friday.  Today I'd look for some chop to make the wave 2 down to setup the wave 3 up for next Monday.  That would be my best guess.  Of course the wave 3 up could start later today so they can pin the SPY for maximum pain on both the bulls and the bears, but I'm not sure what level that would be at.  I think it was 242 or 243, so that's about 2430 area on the futures I'd guess, and that right into resistance.  All in all it looks like all the fun was yesterday.  Have a great weekend.

ES Morning Update June 29th 2017

0

A strong rally yesterday puts bulls back in control.  While I was looking for another lower low from Tuesdays low it seems the bulls had other ideas.  So at this point I'd lean the odds in favor of the bulls with the Tuesday low as being the low for that ABC move down from 6/19.  But, it does look like the bulls have exhausted themselves with that move up and should pullback today.  They are up against falling resistance from a yellow trendline and extended on charts.  However, I'm expecting a new lower low at this point.  I'd have to go with the move up yesterday starting a smaller wave 1 up inside a final 5th wave up.  So the move down today should just make a higher low and be called the smaller wave 2 down.  Support for this wave 2 down is still the 2435 area and then the green rising trendline.

Overall today looks like it's going to setup a smaller wave 3 up inside the 5th wave up that should start on Friday or Monday... depending on how long this wave 2 down takes I guess?  It could be a choppy sideways move so the bulls don't give back much on all their gains they got yesterday.  But either way the bulls still have control of this market and are just teasing the bears ever now and then.  At some point soon though that should all change as the bears tend to come out in the fall season and late summer, so the bulls should make the most of the current time left I think as summer will be over with before you know it and the bears will be nice and hungry while the bulls will be fat and slow.  Good times never last forever... LOL!

ES Morning Update June 28th 2017

0

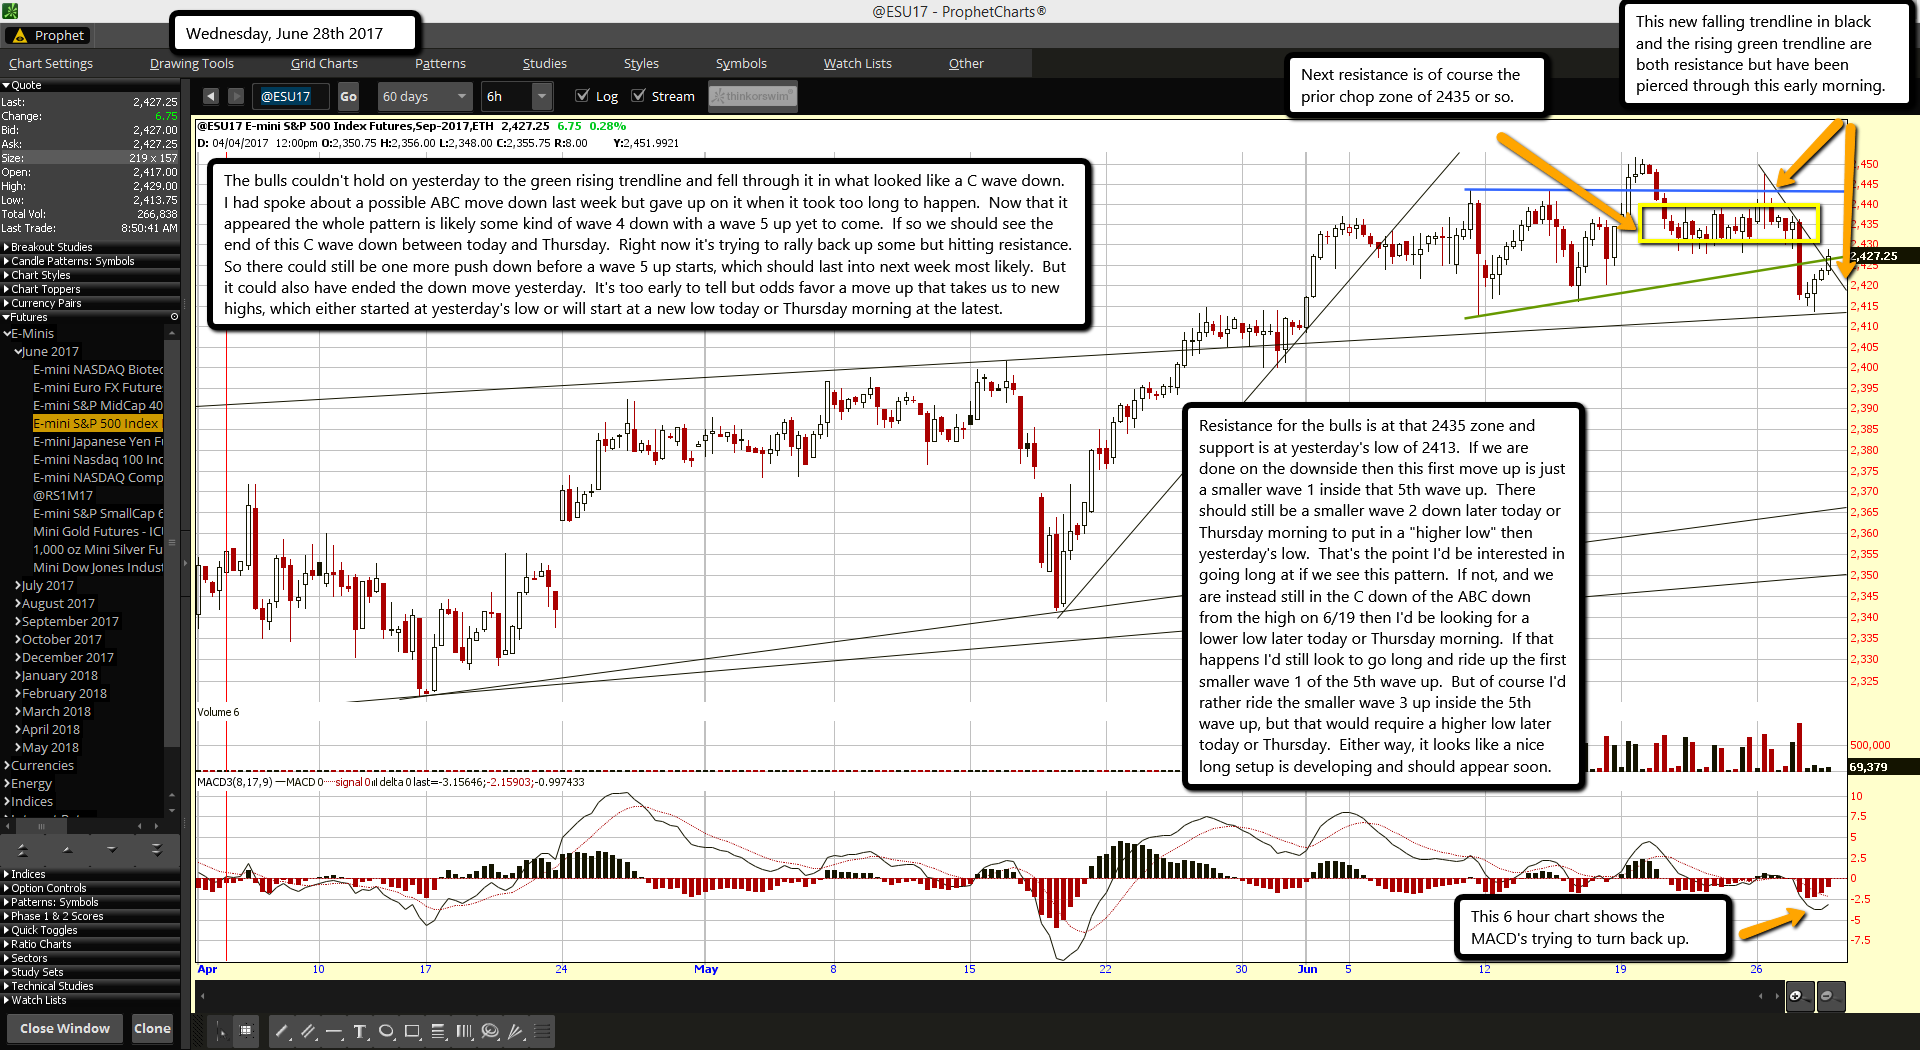
The bulls couldn't hold on yesterday to the green rising trendline and fell through it in what looked like a C wave down.  I had spoke about a possible ABC move down last week but gave up on it when it took too long to happen.  Now that it appeared the whole pattern is likely some kind of wave 4 down with a wave 5 up yet to come.  If so we should see the end of this C wave down between today and Thursday.  Right now it's trying to rally back up some but hitting resistance.  So there could still be one more push down before a wave 5 up starts, which should last into next week most likely.  But it could also have ended the down move yesterday.  It's too early to tell but odds favor a move up that takes us to new highs, which either started at yesterday's low or will start at a new low today or Thursday morning at the latest.

Resistance for the bulls is at that 2435 zone and support is at yesterday's low of 2413.  If we are done on the downside then this first move up is just a smaller wave 1 inside that 5th wave up.  There should still be a smaller wave 2 down later today or Thursday morning to put in a "higher low" then yesterday's low.  That's the point I'd be interested in going long at if we see this pattern.  If not, and we are instead still in the C down of the ABC down from the high on 6/19 then I'd be looking for a lower low later today or Thursday morning.  If that happens I'd still look to go long and ride up the first smaller wave 1 of the 5th wave up.  But of course I'd rather ride the smaller wave 3 up inside the 5th wave up, but that would require a higher low later today or Thursday.  Either way, it looks like a nice long setup is developing and should appear soon.

ES Morning Update June 27th 2017

0

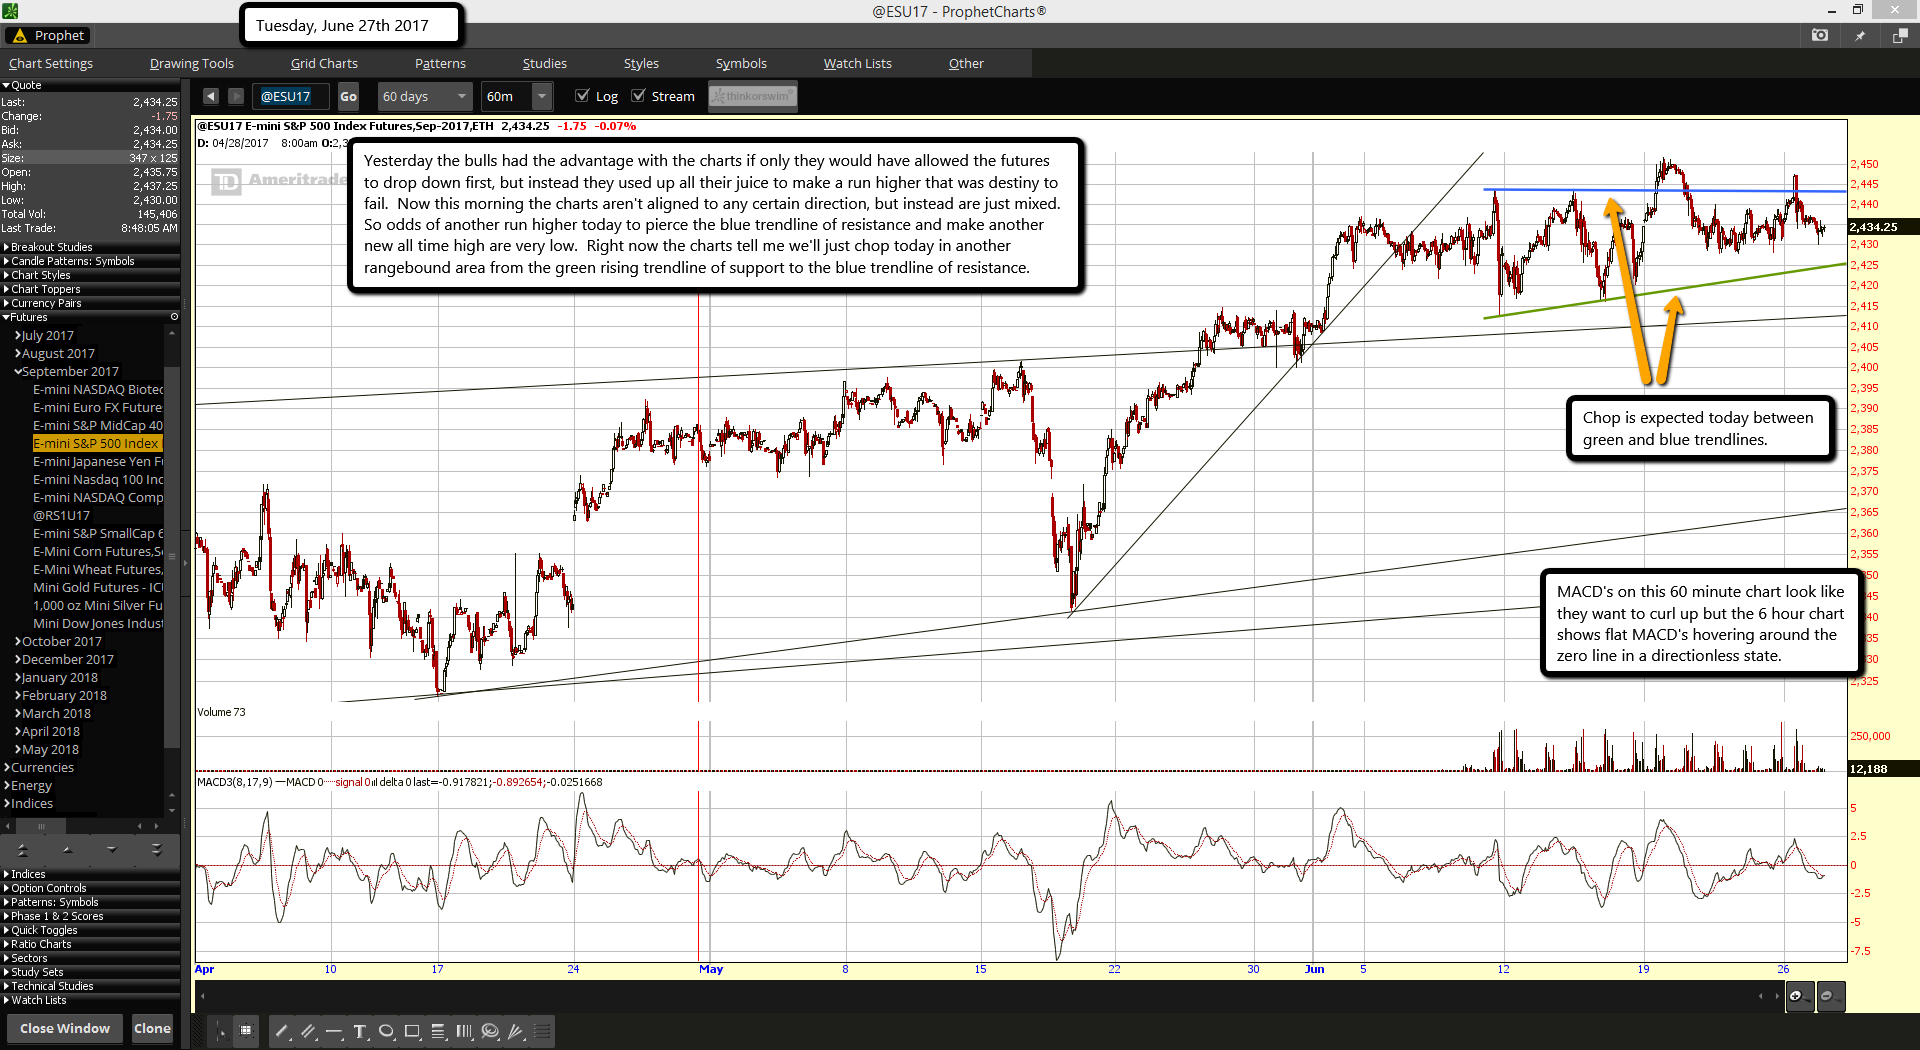
Yesterday the bulls had the advantage with the charts if only they would have allowed the futures to drop down first, but instead they used up all their juice to make a run higher that was destiny to fail.  Now this morning the charts aren't aligned to any certain direction, but instead are just mixed.  So odds of another run higher today to pierce the blue trendline of resistance and make another new all time high are very low.  Right now the charts tell me we'll just chop today in another rangebound area from the green rising trendline of support to the blue trendline of resistance.

Biggest U.S. banks clear first hurdle in Fed’s annual stress tests

0

The 34 largest U.S. banks have all cleared the first stage of an annual stress test, showing they would be able to maintain enough capital in an extreme recession to meet regulatory requirements, the Federal Reserve said on Thursday.

Although the banks, including household names like JPMorgan Chase & Co and Bank of America Corp, would suffer $383 billion in loan losses in the Fed's most severe scenario, their level of high-quality capital would be substantially higher than the threshold that regulators demand, and an improvement over last year's level.

"This year's results show that, even during a severe recession, our large banks would remain well capitalized," said Fed Governor Jerome Powell, who leads banking regulation for the central bank. "This would allow them to lend throughout the economic cycle, and support households and businesses when times are tough."

The Fed introduced the stress tests in the wake of the financial crisis to ensure the health of the banking industry, whose ability to lend is considered crucial to the health of the economy.

Since the first test was conducted in 2009, big banks have seen losses abate, loan portfolios improve and profits grow. The banks that now undergo the exam have also strengthened their balance sheets by adding more than $750 billion in top-notch capital, the Fed said.

Banks and their investors have been hoping the improvements would prompt the Fed to allow them to use more capital for stock buybacks and dividends, especially as the Trump administration is seeking to relax financial regulations.

Wall Street analysts and trade groups quickly cheered the results on Thursday, saying regulators should feel comfortable easing tough rules put in place since the financial crisis.

"We see today's...stress test results as a positive for Trump administration efforts to deregulate the banks," said Jaret Seiberg, a policy analyst with Cowen & Co.

Rob Nichols, president and chief executive officer of the American Bankers Association, said the Fed should consider a number of recommendations recently laid out by the Treasury Department, including making the stress tests more transparent and less frequent.

"From this solid foundation, the focus should now turn to what can be done to help U.S. banks promote economic growth even further," he said.

Thursday's results are the first of a two-part exam. It showed whether the banks would meet minimum requirements under the Fed's methodology, using materials they submitted.

The second portion of the test, to be released on Wednesday, will show whether the Fed approves or denies banks' capital plans. Banks now have an opportunity to resubmit those plans if they find their own projections were much sunnier than the Fed's.

Under the Fed's worst-case stress-test scenario, the U.S. unemployment rate more than doubles to 10 percent.

However, even with the losses in that scenario, the banks' aggregate level of high-quality capital would still cover 9.2 percent of their risk-weighted assets, according to the Fed. That is much better than the 4.5 percent threshold that regulators demand, and an improvement on the 8.4 percent common equity tier 1 (CET1) capital ratio assessed last year.

Analysts say Citigroup Inc has the most to gain or lose in the stress tests. Shareholders of the fourth-largest U.S. bank have been clamoring for management to buy back more of its stock, which is trading below what its assets are worth. But the bank cannot do so without the Fed's approval.


Lies, Lies, Lies...

If that is true then I have some ocean front property for sell in Kansas!

Red

ES Morning Update June 26th 2017

0

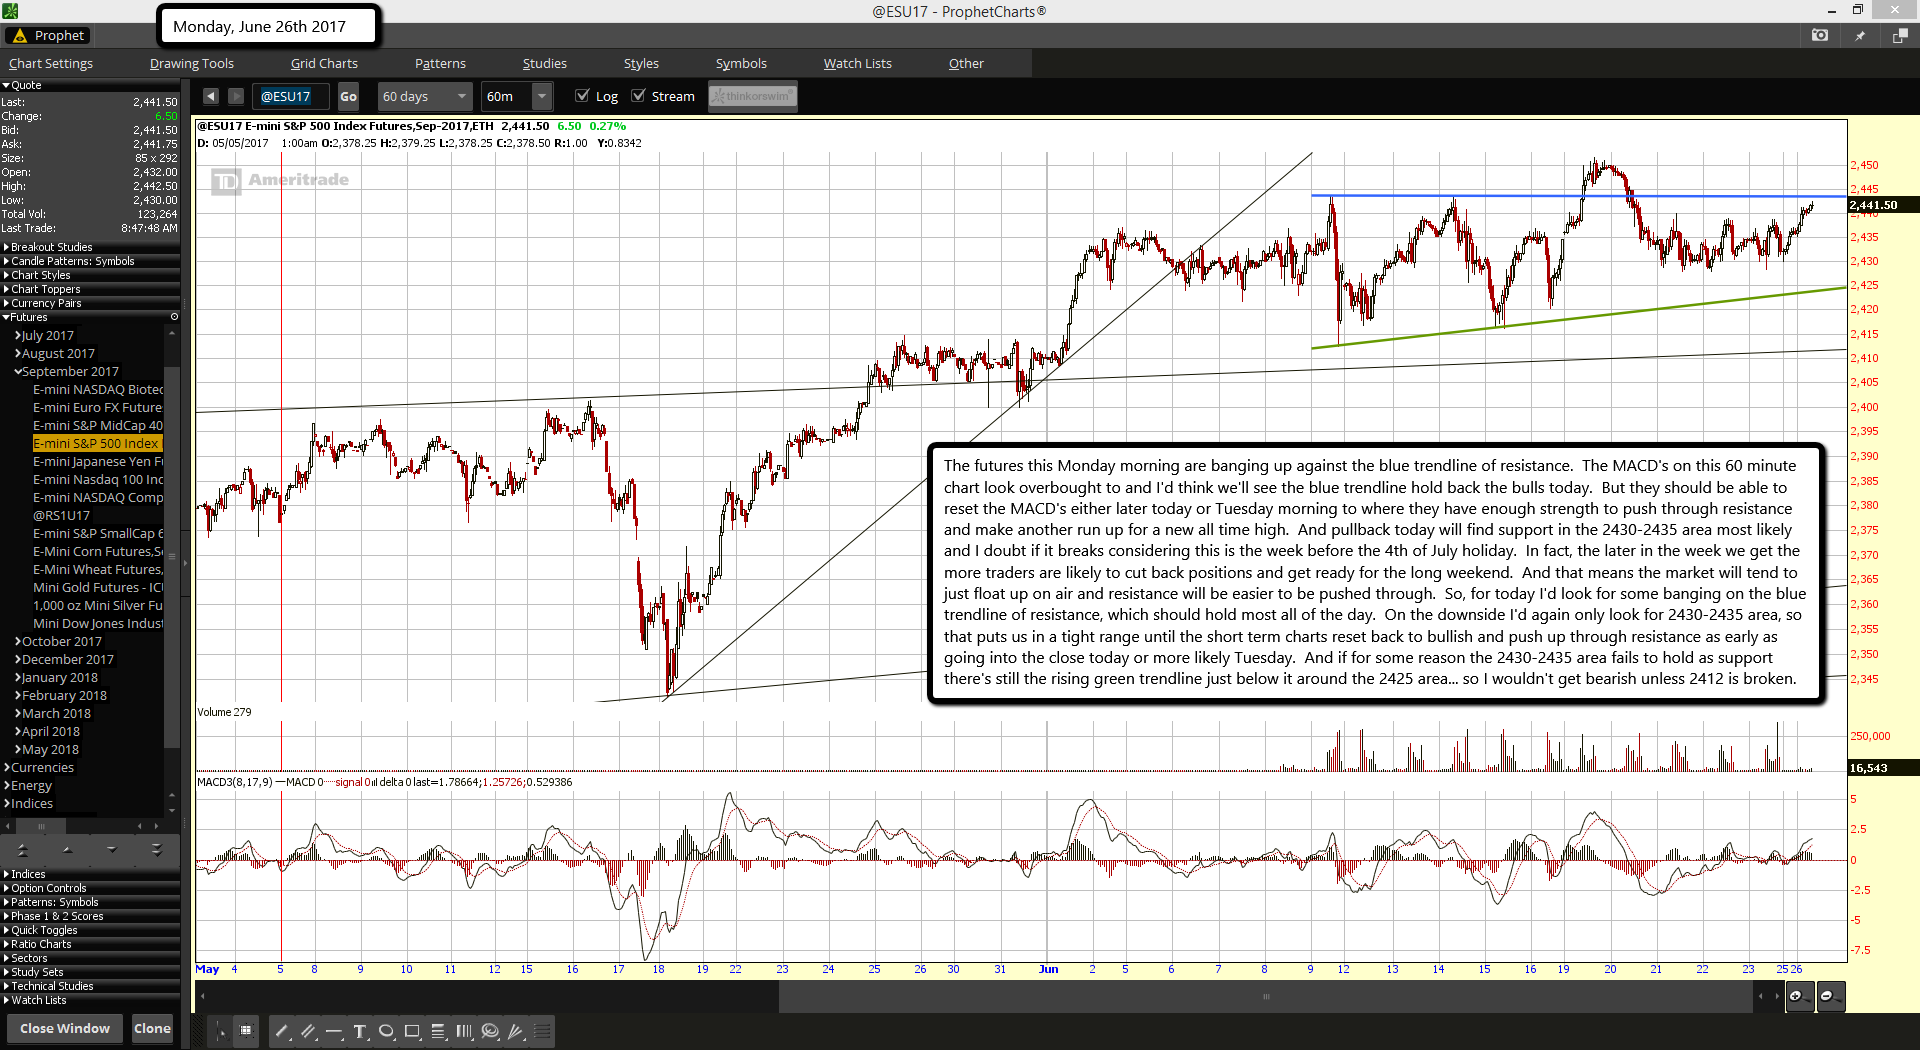
The futures this Monday morning are banging up against the blue trendline of resistance.  The MACD's on this 60 minute chart look overbought to and I'd think we'll see the blue trendline hold back the bulls today.  But they should be able to reset the MACD's either later today or Tuesday morning to where they have enough strength to push through resistance and make another run up for a new all time high.  And pullback today will find support in the 2430-2435 area most likely and I doubt if it breaks considering this is the week before the 4th of July holiday.  In fact, the later in the week we get the more traders are likely to cut back positions and get ready for the long weekend.  And that means the market will tend to just float up on air and resistance will be easier to be pushed through.  So, for today I'd look for some banging on the blue trendline of resistance, which should hold most all of the day.  On the downside I'd again only look for 2430-2435 area, so that puts us in a tight range until the short term charts reset back to bullish and push up through resistance as early as going into the close today or more likely Tuesday.  And if for some reason the 2430-2435 area fails to hold as support there's still the rising green trendline just below it around the 2425 area... so I wouldn't get bearish unless 2412 is broken.

ES Morning Update June 23ed 2017

0

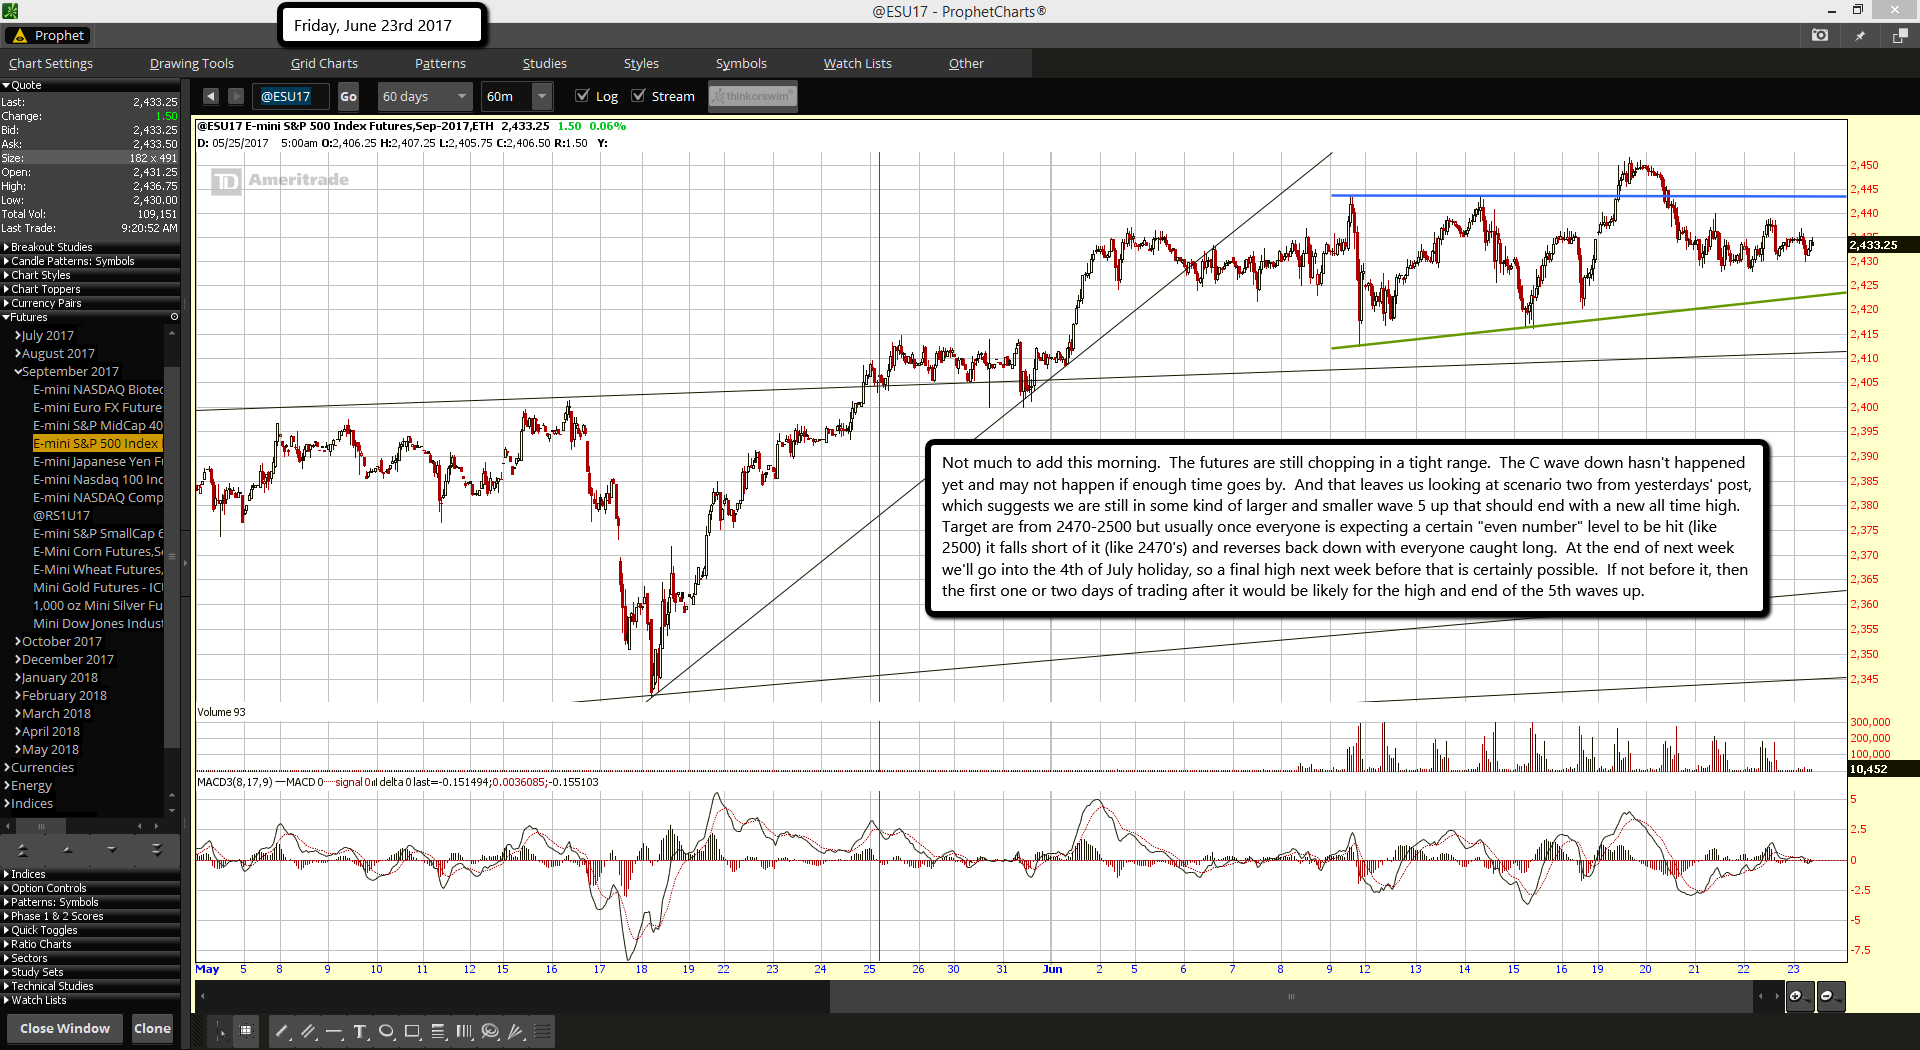
Not much to add this morning.  The futures are still chopping in a tight range.  The C wave down hasn't happened yet and may not happen if enough time goes by.  And that leaves us looking at scenario two from yesterdays' post, which suggests we are still in some kind of larger and smaller wave 5 up that should end with a new all time high.  Target are from 2470-2500 but usually once everyone is expecting a certain "even number" level to be hit (like 2500) it falls short of it (like 2470's) and reverses back down with everyone caught long.  At the end of next week we'll go into the 4th of July holiday, so a final high next week before that is certainly possible.  If not before it, then the first one or two days of trading after it would be likely for the high and end of the 5th waves up.

ES Morning Update June 22nd 2017

0

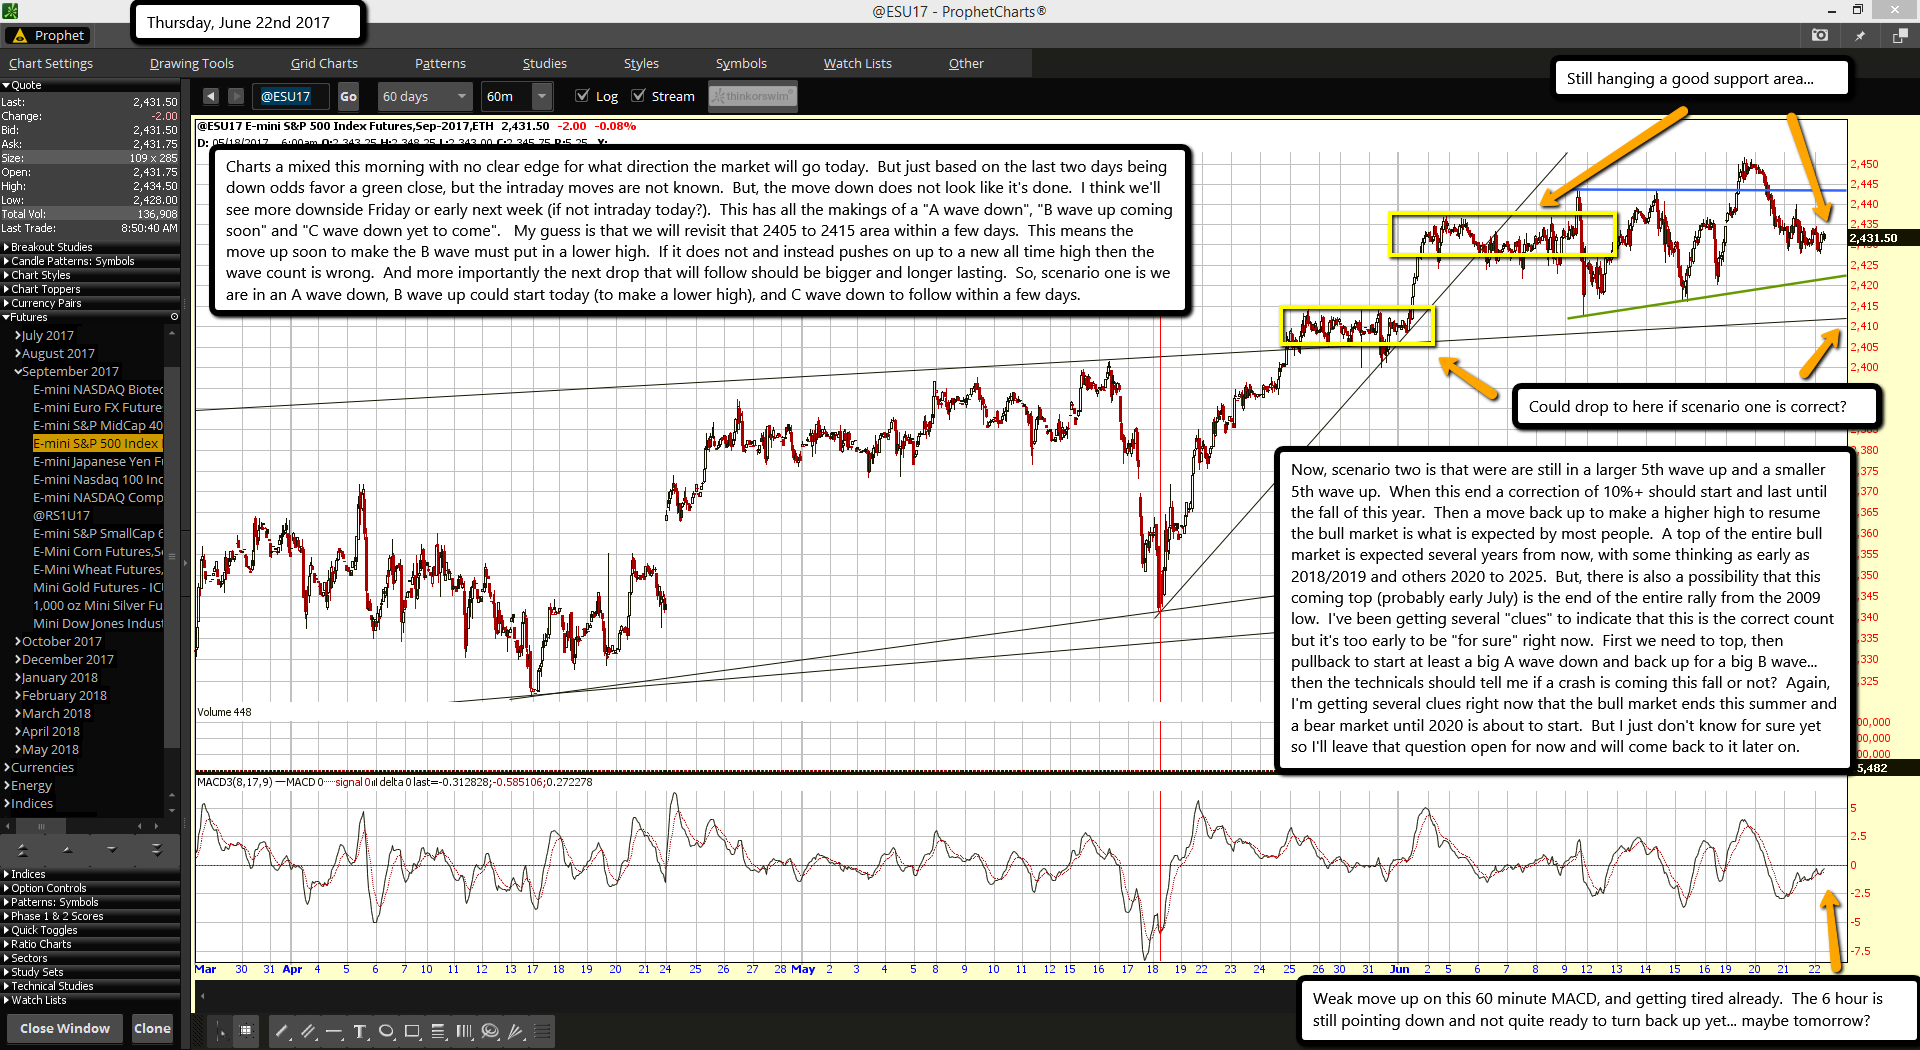
Charts a mixed this morning with no clear edge for what direction the market will go today.  But just based on the last two days being down odds favor a green close, but the intraday moves are not known.  But, the move down does not look like it's done.  I think we'll see more downside Friday or early next week (if not intraday today?).  This has all the makings of a "A wave down", "B wave up coming soon" and "C wave down yet to come".   My guess is that we will revisit that 2405 to 2415 area within a few days.  This means the move up soon to make the B wave must put in a lower high.  If it does not and instead pushes on up to a new all time high then the wave count is wrong.  And more importantly the next drop that will follow should be bigger and longer lasting.  So, scenario one is we are in an A wave down, B wave up could start today (to make a lower high), and C wave down to follow within a few days.

Now, scenario two is that were are still in a larger 5th wave up and a smaller 5th wave up.  When this end a correction of 10%+ should start and last until the fall of this year.  Then a move back up to make a higher high to resume the bull market is what is expected by most people.  A top of the entire bull market is expected several years from now, with some thinking as early as 2018/2019 and others 2020 to 2025.  But, there is also a possibility that this coming top (probably early July) is the end of the entire rally from the 2009 low.  I've been getting several "clues" to indicate that this is the correct count but it's too early to be "for sure" right now.  First we need to top, then pullback to start at least a big A wave down and back up for a big B wave... then the technical's should tell me if a crash is coming this fall or not?  Again, I'm getting several clues right now that the bull market ends this summer and a bear market until 2020 is about to start.  But I just don't know for sure yet so I'll leave that question open for now and will come back to it later on.

ES Morning Update June 21st 2017

0

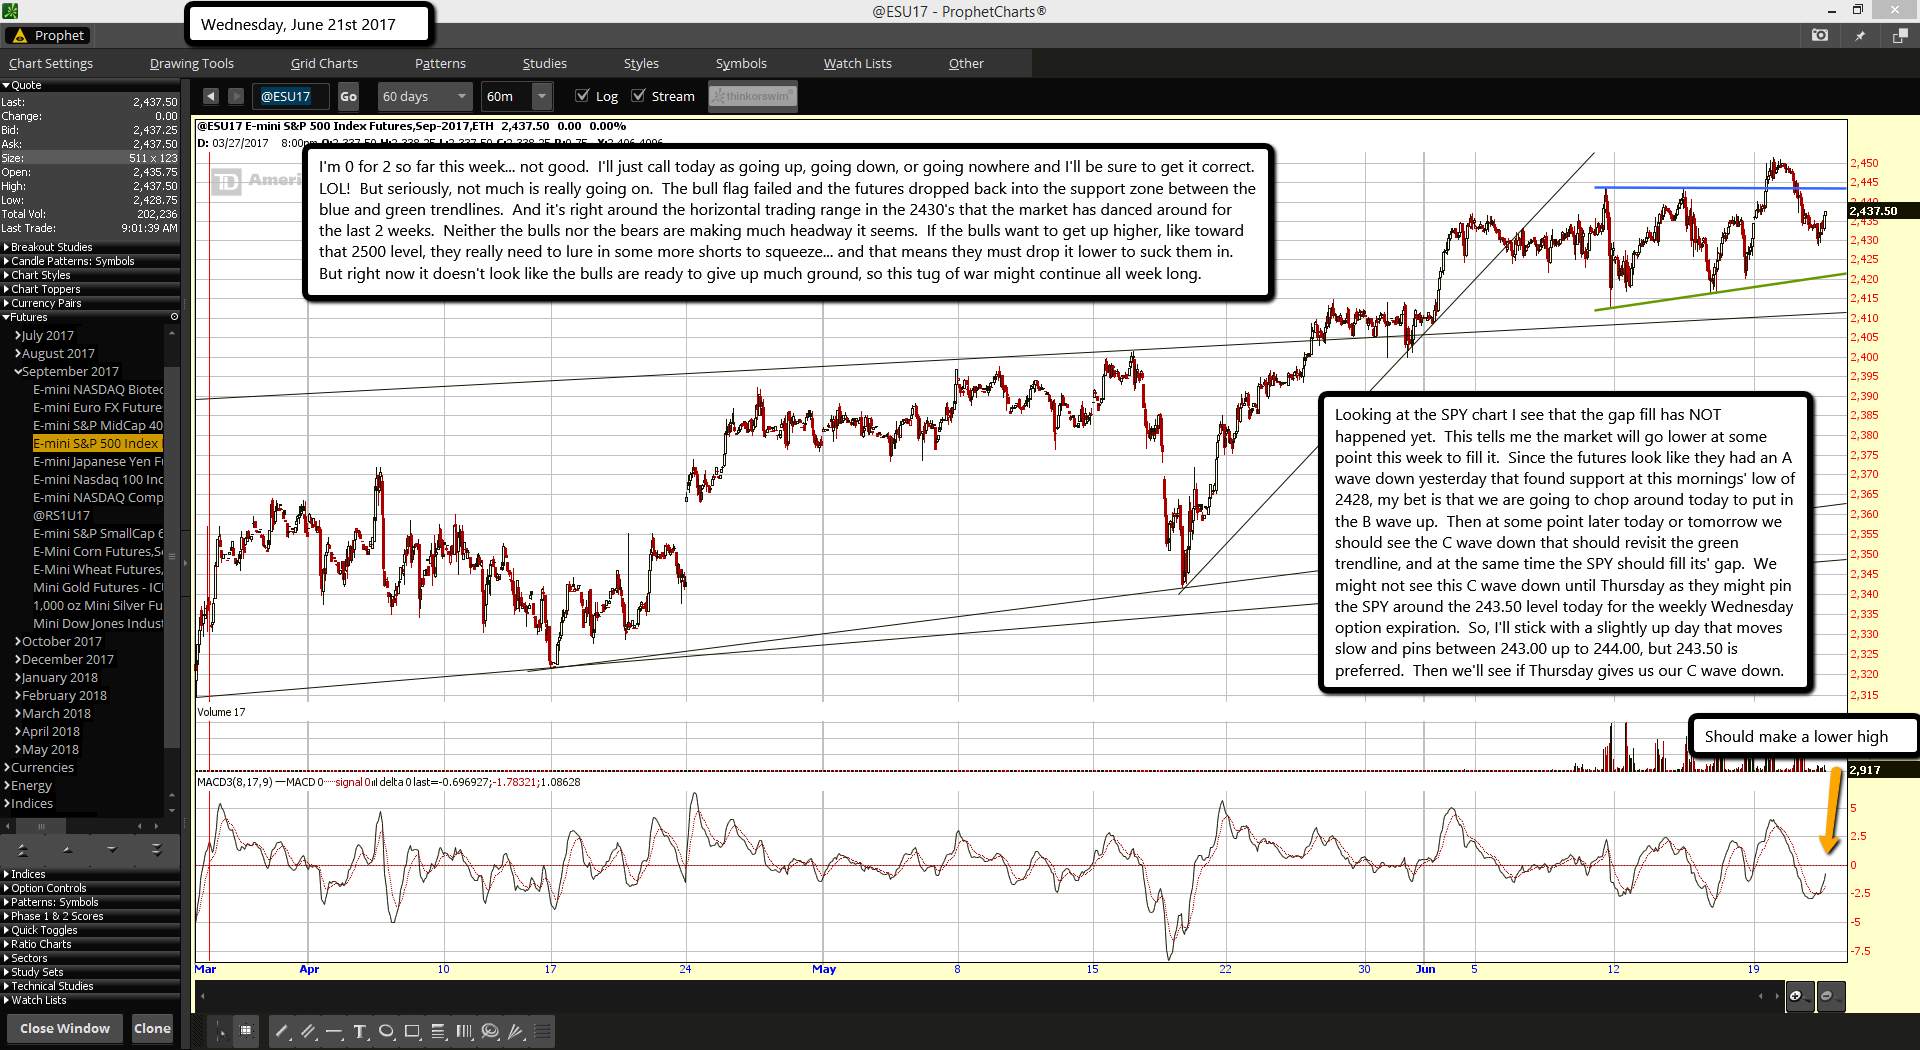
I'm 0 for 2 so far this week... not good.  I'll just call today as going up, going down, or going nowhere and I'll be sure to get it correct.  LOL!  But seriously, not much is really going on.  The bull flag failed and the futures dropped back into the support zone between the blue and green trendlines.  And it's right around the horizontal trading range in the 2430's that the market has danced around for the last 2 weeks.  Neither the bulls nor the bears are making much headway it seems.  If the bulls want to get up higher, like toward that 2500 level, they really need to lure in some more shorts to squeeze... and that means they must drop it lower to suck them in.  But right now it doesn't look like the bulls are ready to give up much ground, so this tug of war might continue all week long.

Looking at the SPY chart I see that the gap fill has NOT happened yet.  This tells me the market will go lower at some point this week to fill it.  Since the futures look like they had an A wave down yesterday that found support at this mornings' low of 2428, my bet is that we are going to chop around today to put in the B wave up.  Then at some point later today or tomorrow we should see the C wave down that should revisit the green trendline, and at the same time the SPY should fill its' gap.  We might not see this C wave down until Thursday as they might pin the SPY around the 243.50 level today for the weekly Wednesday option expiration.  So, I'll stick with a slightly up day that moves slow and pins between 243.00 up to 244.00, but 243.50 is preferred.  Then we'll see if Thursday gives us our C wave down.

ES Morning Update June 20th 2017

0

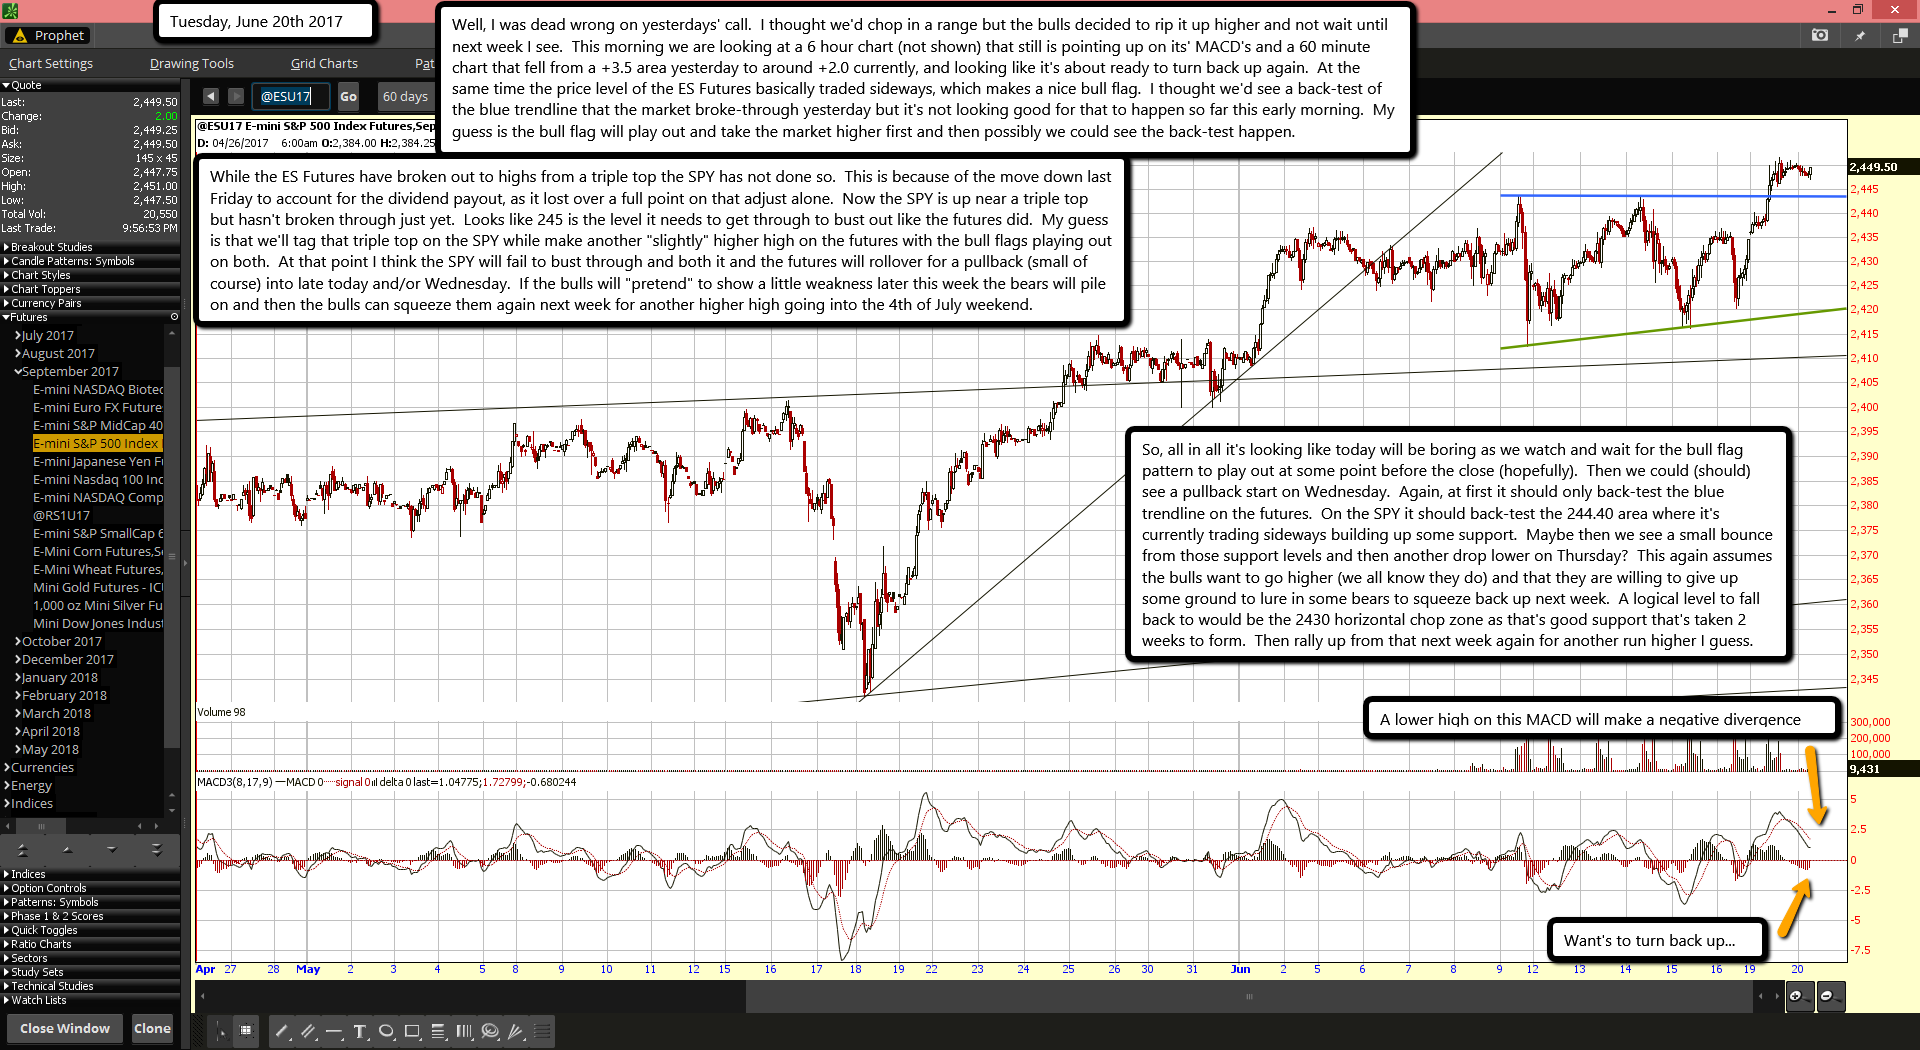
Well, I was dead wrong on yesterdays' call.  I thought we'd chop in a range but the bulls decided to rip it up higher and not wait until next week I see.  This morning we are looking at a 6 hour chart (not shown) that still is pointing up on its' MACD's and a 60 minute chart that fell from a +3.5 area yesterday to around +2.0 currently, and looking like it's about ready to turn back up again.  At the same time the price level of the ES Futures basically traded sideways, which makes a nice bull flag.  I thought we'd see a back-test of the blue trendline that the market broke-through yesterday but it's not looking good for that to happen so far this early morning.  My guess is the bull flag will play out and take the market higher first and then possibly we could see the back-test happen.

While the ES Futures have broken out to highs from a triple top the SPY has not done so.  This is because of the move down last Friday to account for the dividend payout, as it lost over a full point on that adjust alone.  Now the SPY is up near a triple top but hasn't broken through just yet.  Looks like 245 is the level it needs to get through to bust out like the futures did.  My guess is that we'll tag that triple top on the SPY while make another "slightly" higher high on the futures with the bull flags playing out on both.  At that point I think the SPY will fail to bust through and both it and the futures will rollover for a pullback (small of course) into late today and/or Wednesday.  If the bulls will "pretend" to show a little weakness later this week the bears will pile on and then the bulls can squeeze them again next week for another higher high going into the 4th of July weekend.

So, all in all it's looking like today will be boring as we watch and wait for the bull flag pattern to play out at some point before the close (hopefully).  Then we could (should) see a pullback start on Wednesday.  Again, at first it should only back-test the blue trendline on the futures.  On the SPY it should back-test the 244.40 area where it's currently trading sideways building up some support.  Maybe then we see a small bounce from those support levels and then another drop lower on Thursday?  This again assumes the bulls want to go higher (we all know they do) and that they are willing to give up some ground to lure in some bears to squeeze back up next week.  A logical level to fall back to would be the 2430 horizontal chop zone as that's good support that's taken 2 weeks to form.  Then rally up from that next week again for another run higher I guess.

ES Morning Update June 19th 2017

0

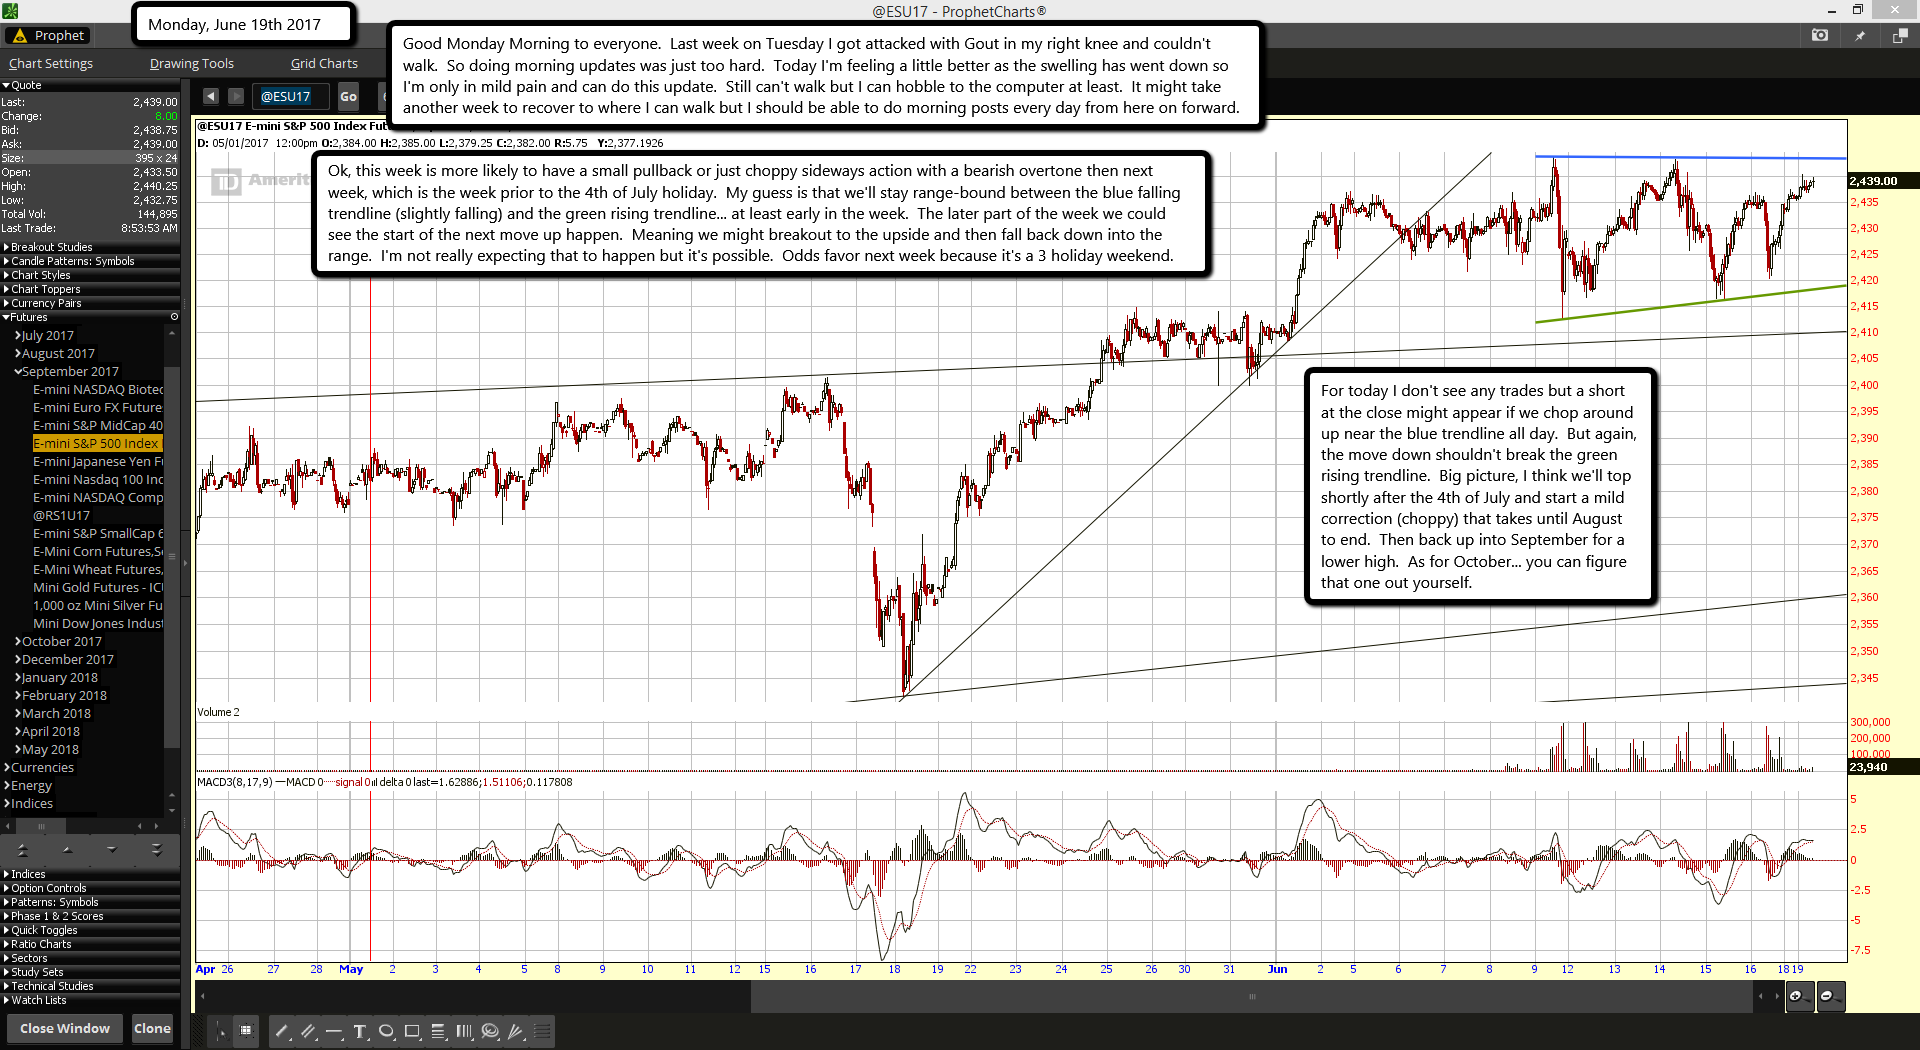
Good Monday Morning to everyone.  Last week on Tuesday I got attacked with Gout in my right knee and couldn't walk.  So doing morning updates was just too hard.  Today I'm feeling a little better as the swelling has went down so I'm only in mild pain and can do this update.  Still can't walk but I can hobble to the computer at least.  It might take another week to recover to where I can walk but I should be able to do morning posts every day from here on forward.

Ok, this week is more likely to have a small pullback or just choppy sideways action with a bearish overtone then next week, which is the week prior to the 4th of July holiday.  My guess is that we'll stay range-bound between the blue falling trendline (slightly falling) and the green rising trendline... at least early in the week.  The later part of the week we could see the start of the next move up happen.  Meaning we might breakout to the upside and then fall back down into the range.  I'm not really expecting that to happen but it's possible.  Odds favor next week because it's a 3 holiday weekend.

For today I don't see any trades but a short at the close might appear if we chop around up near the blue trendline all day.  But again, the move down shouldn't break the green rising trendline.  Big picture, I think we'll top shortly after the 4th of July and start a mild correction (choppy) that takes until August to end.  Then back up into September for a lower high.  As for October... you can figure that one out yourself.

ES Morning Update June 14th 2017

0

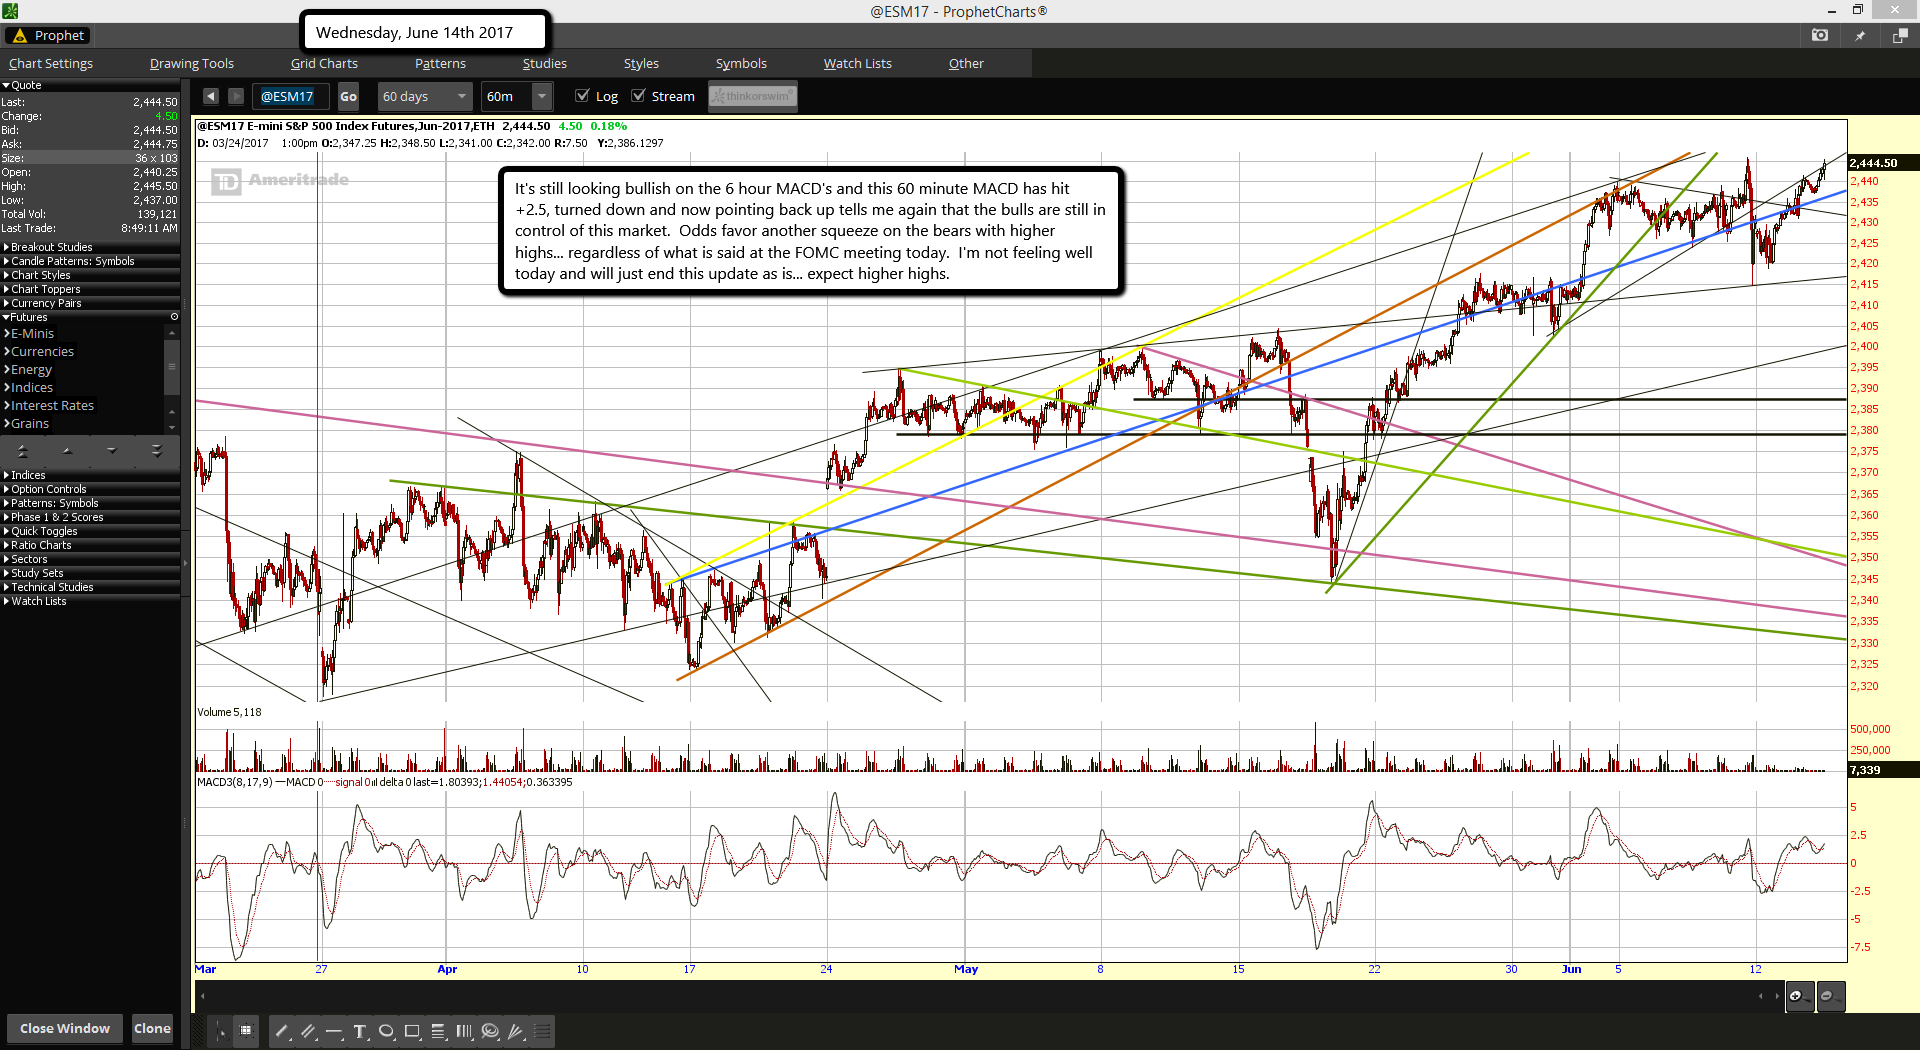
It's still looking bullish on the 6 hour MACD's and this 60 minute MACD has hit +2.5, turned down and now pointing back up tells me again that the bulls are still in control of this market.  Odds favor another squeeze on the bears with higher highs... regardless of what is said at the FOMC meeting today.  I'm not feeling well today and will just end this update as is... expect higher highs.

ES Morning Update June 13th 2017

0

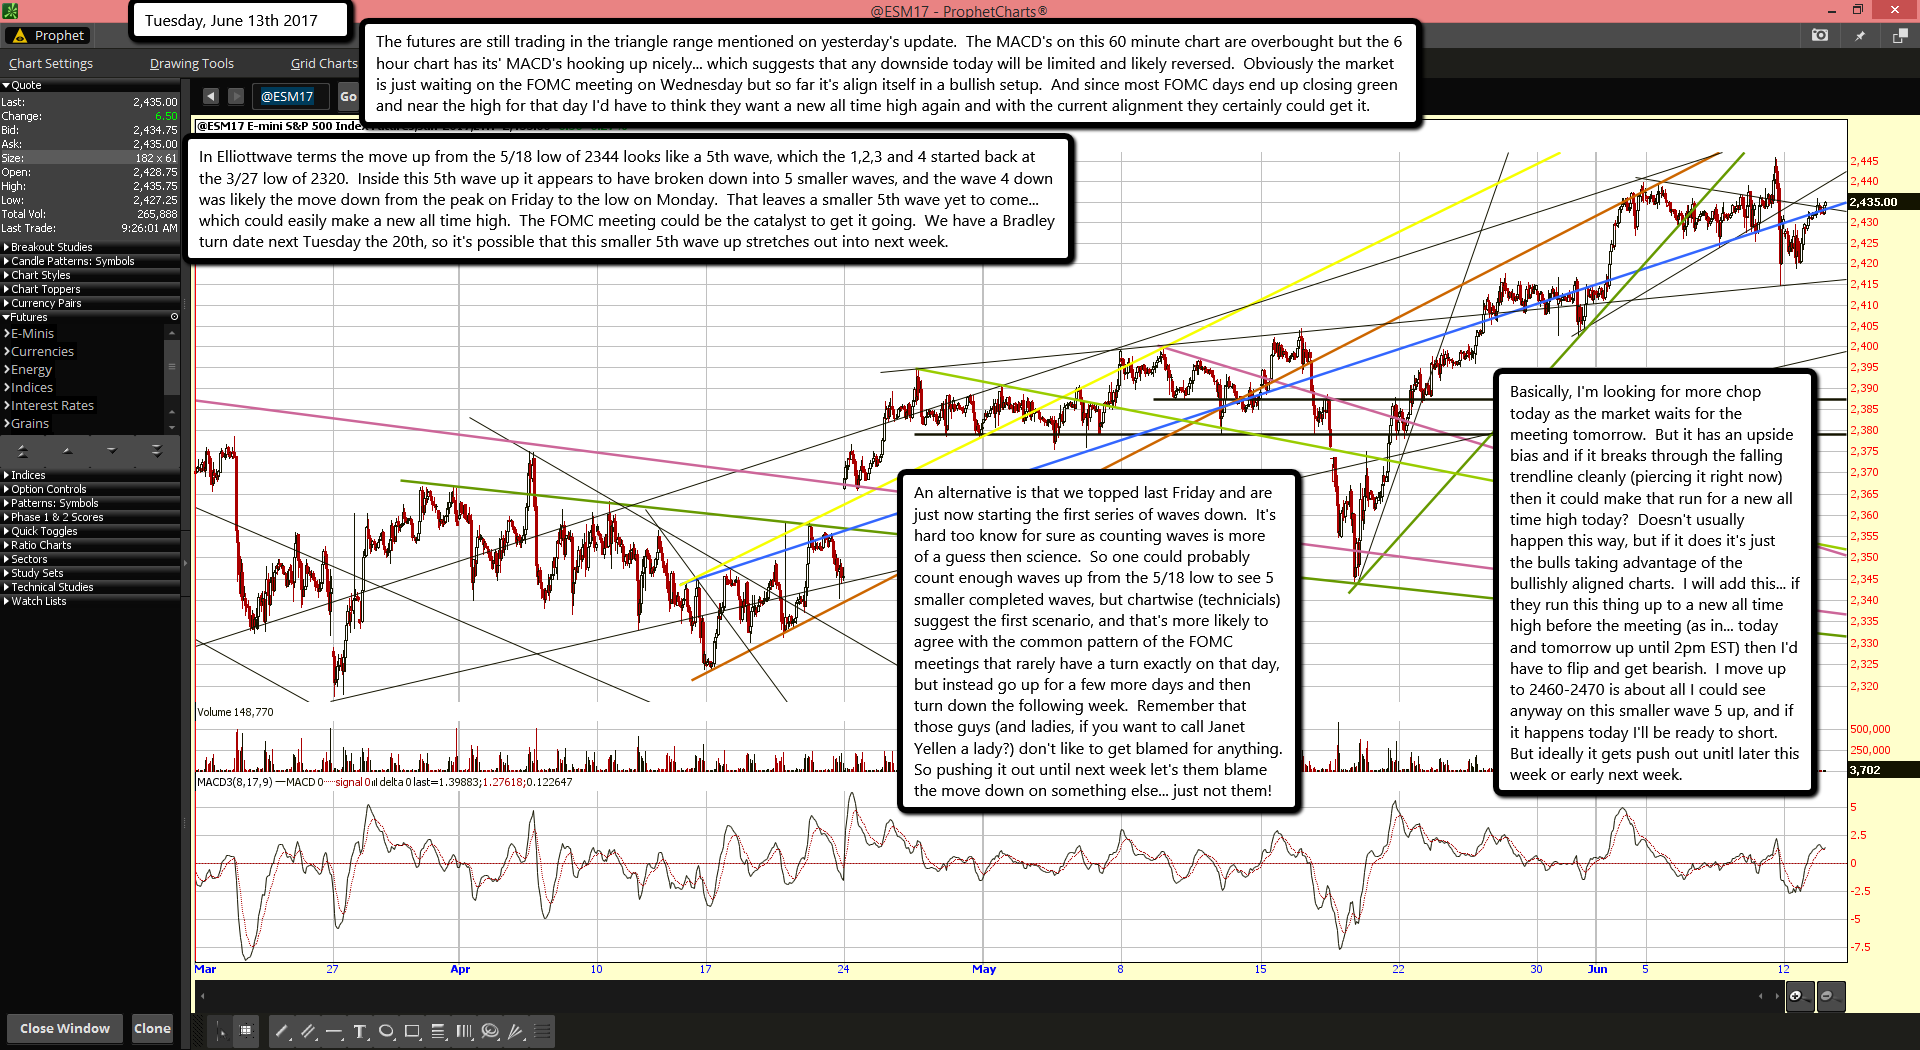
The futures are still trading in the triangle range mentioned on yesterday's update.  The MACD's on this 60 minute chart are overbought but the 6 hour chart has its' MACD's hooking up nicely... which suggests that any downside today will be limited and likely reversed.  Obviously the market is just waiting on the FOMC meeting on Wednesday but so far it's align itself in a bullish setup.  And since most FOMC days end up closing green and near the high for that day I'd have to think they want a new all time high again and with the current alignment they certainly could get it.

In Elliottwave terms the move up from the 5/18 low of 2344 looks like a 5th wave, which the 1,2,3 and 4 started back at the 3/27 low of 2320.  Inside this 5th wave up it appears to have broken down into 5 smaller waves, and the wave 4 down was likely the move down from the peak on Friday to the low on Monday.  That leaves a smaller 5th wave yet to come... which could easily make a new all time high.  The FOMC meeting could be the catalyst to get it going.  We have a Bradley turn date next Tuesday the 20th, so it's possible that this smaller 5th wave up stretches out into next week.

An alternative is that we topped last Friday and are just now starting the first series of waves down.  It's hard too know for sure as counting waves is more of a guess then science.  So one could probably count enough waves up from the 5/18 low to see 5 smaller completed waves, but chartwise (technicials) suggest the first scenario, and that's more likely to agree with the common pattern of the FOMC meetings that rarely have a turn exactly on that day, but instead go up for a few more days and then turn down the following week.  Remember that those guys (and ladies, if you want to call Janet Yellen a lady?) don't like to get blamed for anything.  So pushing it out until next week let's them blame the move down on something else... just not them!

Basically, I'm looking for more chop today as the market waits for the meeting tomorrow.  But it has an upside bias and if it breaks through the falling trendline cleanly (piercing it right now) then it could make that run for a new all time high today?  Doesn't usually happen this way, but if it does it's just the bulls taking advantage of the bullishly aligned charts.  I will add this... if they run this thing up to a new all time high before the meeting (as in... today and tomorrow up until 2pm EST) then I'd have to flip and get bearish.  I move up to 2460-2470 is about all I could see anyway on this smaller wave 5 up, and if it happens today I'll be ready to short.  But ideally it gets push out unitl later this week or early next week.

ES Morning Update June 12th 2017

0

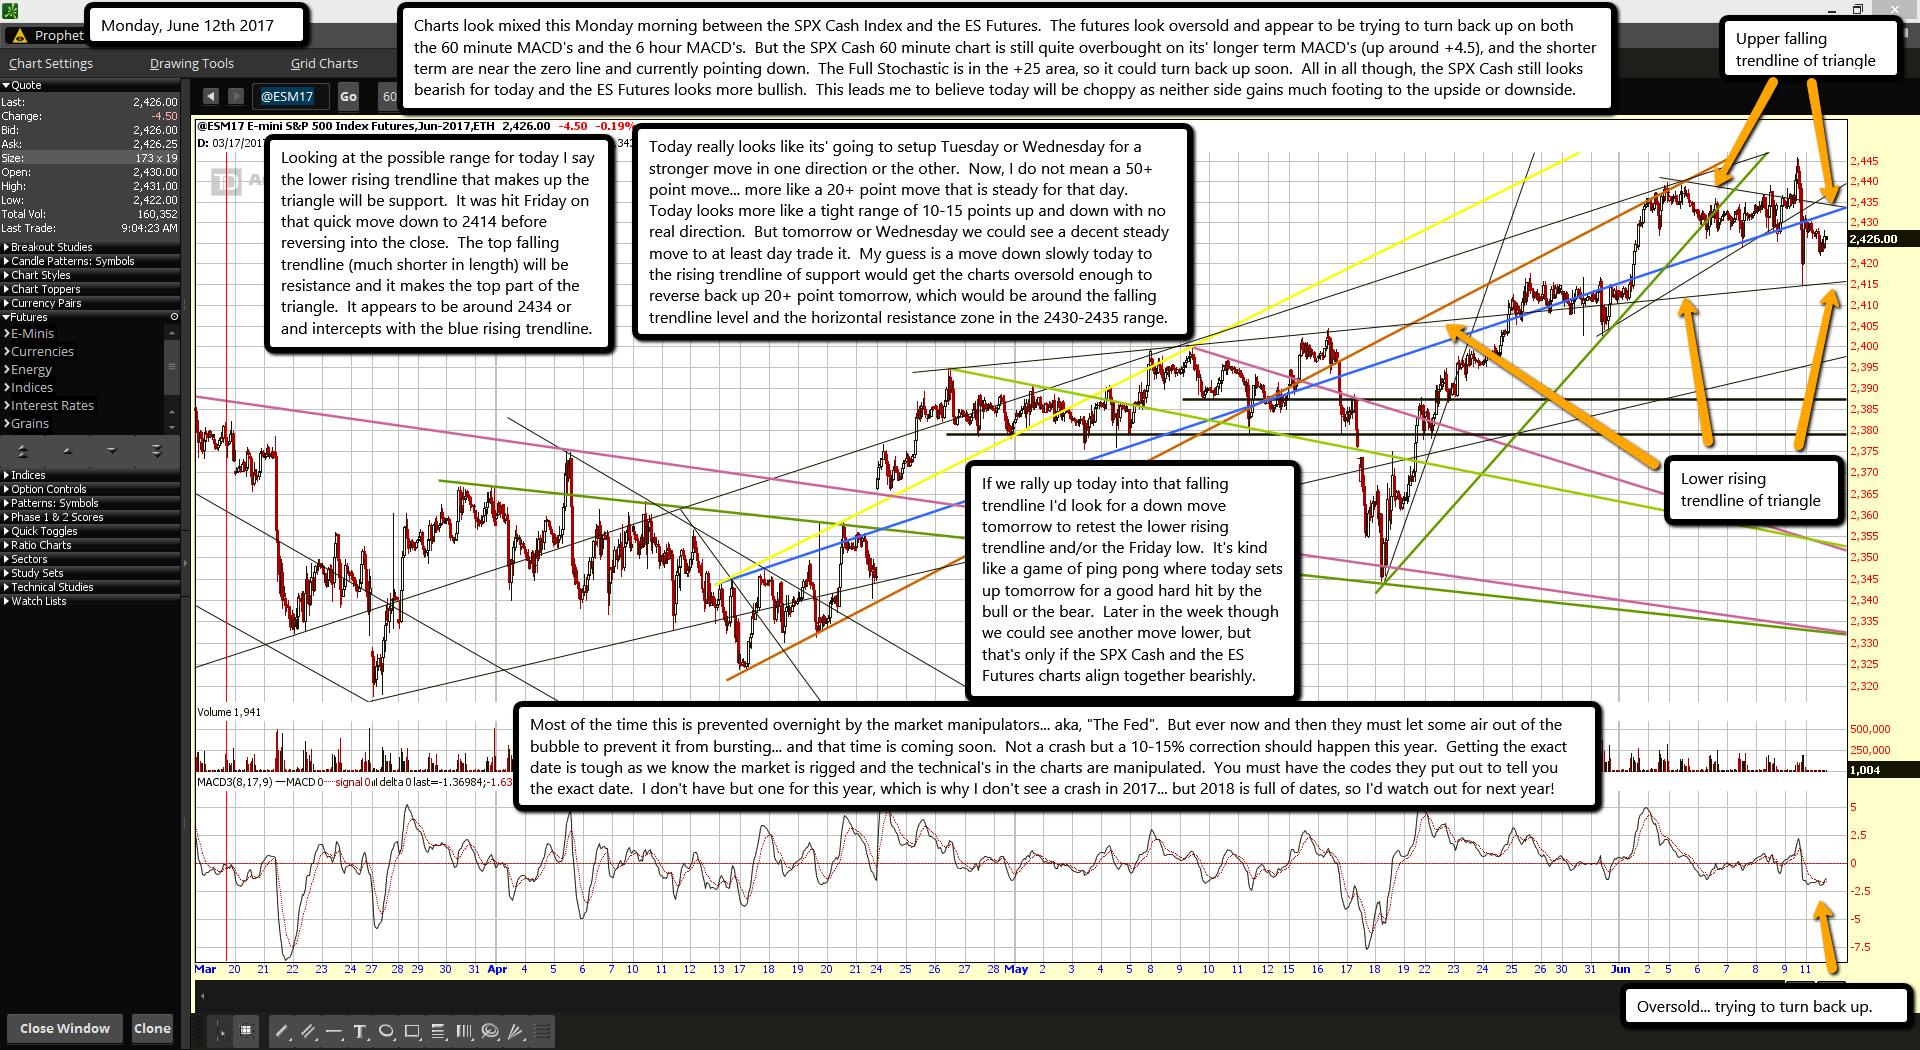
Charts look mixed this Monday morning between the SPX Cash Index and the ES Futures.  The futures look oversold and appear to be trying to turn back up on both the 60 minute MACD's and the 6 hour MACD's.  But the SPX Cash 60 minute chart is still quite overbought on its' longer term MACD's (up around +4.5), and the shorter term are near the zero line and currently pointing down.  The Full Stochastic is in the +25 area, so it could turn back up soon.  All in all though, the SPX Cash still looks bearish for today and the ES Futures looks more bullish.  This leads me to believe today will be choppy as neither side gains much footing to the upside or downside.

Looking at the possible range for today I say the lower rising trendline that makes up the triangle will be support.  It was hit Friday on that quick move down to 2414 before reversing into the close.  The top falling trendline (much shorter in length) will be resistance and it makes the top part of the triangle.  It appears to be around 2434 or and intercepts with the blue rising trendline.

Today really looks like its' going to setup Tuesday or Wednesday for a stronger move in one direction or the other.  Now, I do not mean a 50+ point move... more like a 20+ point move that is steady for that day.  Today looks more like a tight range of 10-15 points up and down with no real direction.  But tomorrow or Wednesday we could see a decent steady move to at least day trade it.  My guess is a move down slowly today to the rising trendline of support would get the charts oversold enough to reverse back up 20+ point tomorrow, which would be around the falling trendline level and the horizontal resistance zone in the 2430-2435 range.

If we rally up today into that falling trendline I'd look for a down move tomorrow to retest the lower rising trendline and/or the Friday low.  It's kind like a game of ping pong where today sets up tomorrow for a good hard hit by the bull or the bear.  Later in the week though we could see another move lower, but that's only if the SPX Cash and the ES Futures charts align together bearishly.

Most of the time this is prevented overnight by the market manipulators... aka, "The Fed".  But ever now and then they must let some air out of the bubble to prevent it from bursting... and that time is coming soon.  Not a crash but a 10-15% correction should happen this year.  Getting the exact date is tough as we know the market is rigged and the technical's in the charts are manipulated.  You must have the codes they put out to tell you the exact date.  I don't have but one for this year, which is why I don't see a crash in 2017... but 2018 is full of dates, so I'd watch out for next year!

s2Member®