Wednesday, August 26, 2026
Home Blog Page 59

Goldman wins patent for its own cryptocoin technology..what could go wrong?

0

Goldman Sachs has clinched an important victory in its race to transition from a stodgy investment bank into a fintech powerhouse: it was awarded a patent for its proposed "SETLcoin" cryptocurrency settlement system, according to CoinDesk, the first to report on the patent.

“The US Patent and Trademark Office (USPTO) published Goldman's patent on July 11, entitled "Cryptographic currency for securities settlement". The bank made headlines when the existence of the patent application was revealed in late 2015.”

The concept envisions a system for settling securities trades using cryptocurrency instead of cash or other cash equivalents. When filed in December of 2015, the application notably outlined methods for exchanging SETLcoins for digitized stocks for firms like Google and Microsoft, as well as cryptocurrencies, naming bitcoin and litecoin in particular, as CoinDesk explains.

In its patent application, Goldman highlights the shortcomings of the clearing and settlement system, explaining how counterparties are forced to bear unnecessary risk during the period between when a trade is made and when it is settled, which can be up to three days for stock trades.

“The settlement of securities involves a process whereby securities or interests in securities (e.g., debt, equity, or derivative contracts) are delivered, usually against payment of money. A number of risks arise for the parties during the settlement interval that follows trading and precedes settlement. For example, after a trade for a security and before settlement, the rights of the purchaser are contractual and therefore personal; however, because such rights are merely personal, these rights are at risk in the event of the insolvency of the either counterparty to the trade. After settlement, the purchaser owns the securities, and the purchaser` rights are proprietary. Clearing involves modifying contractual obligations to facilitate settlement. Clearing houses, such as the National Securities Clearing Corporation (NSCC), provide clearing, settlement, risk management, central counterparty services, and a guarantee of completion for certain transactions (e.g., broker-to-broker trades, depositary receipts, and exchange-traded funds), and they serve as the central counterparty for trades in the U.S. securities markets. In the United States, the settlement date for marketable stocks can be an extended length of time--three business days after the trade is executed and for listed options and government securities it is usually one day after the execution.”

Then Goldman describes how cryptocurrencies like bitcoin work.

“A cryptographic currency is a digital medium of exchange that enables distributed, rapid, cryptographically secure, confirmed transactions for goods and/or services. One of the first cryptographic currencies to come to broad attention was Bitcoin, which is based on a peer-to-peer network, in 2009. Since then, numerous cryptographic currencies have become available, such as Litecoin, Novacoin, Namecoin, Feathercoin, Terracoin, Dogecoin, and Peercoin. Fundamentally, cryptographic currencies are specifications regarding the use of currency that seek to incorporate principles of cryptography (e.g., public-key cryptography) to implement a distributed and decentralized information economy. A digital currency, e.g., a bitcoin used in Bitcoin, is computationally brought into existence by an issuer (e.g., a bitcoin is "mined"). Digital currency can be stored in a virtual cryptographic wallet, (hereinafter "wallet"), i.e., a software and/or hardware technology to store cryptographic keys and cryptographic currency. Digital currency can be purchased (e.g., for U.S. dollars at an ATM or at an exchange), sold (e.g., for goods and/or services), traded, or exchanged for a different currency or cryptographic currency, for example. A sender makes a payment (or otherwise transfers ownership) of digital currency by broadcasting (e.g., in packets or other data structures) a transaction message to nodes on a peer-to-peer network. The transaction message includes the quantity of virtual currency changing ownership (e.g., 4 bitcoins) and the receiver's (i.e., the new owner's) public key-based address. Transaction messages are sent through the Internet, without the need to trust a third party, so settlements are extremely timely and efficient.”

...before providing a detailed description of how its SETLCoin system works, along with a summary of its most important innovation: the reduction in settlement times.

“The described technology concerns one or more methods, systems, apparatuses, and mediums storing processor-executable process steps to substantively instantly settle securities, based on cryptographic currency technology, without the risks associated with traditional settlement technologies.”

To be sure, Goldman knows what it is doing: a recent chart showing the blockchain ecosystem confirms that it is ripe for a major bank stepping in and profiting from the numerous "externalities":

According to Goldman, SETLCoin is a cryptocurrency that can be exchanged for financial securities over a peer-to-peer network, allowing trades to settle instantly because transfer of the SETLCoin is instant. Here’s how it will work:

“…SETLcoin wallet holds multiple positionable items (e.g., a security item, such as a share), herein referred to as a Positional Item inside Cryptographic currency (PIC), and a position (i.e., a quantity of the PIC represented by an SETLcoin wallet). A PIC is an agreed upon reference used by the peer-to-peer network to refer to, e.g., a particular security. For example, "IBM" (the stock market symbol of the company by the same name) can also be a PIC used by the peer-to-peer network to refer to IBM stock. A PIC, in some embodiments, is determined (and invalidated) by an issuer. An issuer (e.g., a company, underwriter, municipality, government, etc.) can have multiple PICS to represent different types of securities. For example, IBM stocks can be represented by PIC "IBM-S" and IBM bonds by PIC "IBM-B". In some embodiments, PICS are issued (and destroyed) by highly authoritative entities. For example, dollars available on the SETLcoin network represented by, e.g., PIC "USD" may be authoritatively issued by, for example, the U.S. Treasury. However, the described technology can issue PICS based on various other techniques (e.g., network node agreement, exchange regulation, lease or purchase, auction, etc.) and can be named based on, e.g., a company's name, its market symbol, its branding, its security name, availability, or a preferred format (e.g., length, abbreviation, etc.).

An SETLcoin wallet or transaction can house a single security, as described above, or multiple denominations of the same security (e.g., 1 IBM-S SETLcoin valued at 100 IBM shares). SETLcoin wallets or transactions may also house multiple securities (e.g., 1 IBM-S SETLcoin and 2 GOOG-S SETLcoins). SETLcoins are exchangeable for, e.g., other SETLcoins and/or other cryptographic currencies (e.g., peercoins). For example, a single IBM-S SETLcoin may be exchangeable for one or more "GOOG" SETLcoins (i.e., Google shares), for 13,000 USD SETLcoins, 100 litecoins, and/or for 5 bitcoins.”

It is unclear if and how Goldman's foray into blockchain will impact prices of existing tokens. You can read the whole patent here.


Lest we not forget that this "new world currency" was foretold back in 1988 on the cover of "The Economist" magazine.

Do you every wonder how that cover with that coin looks so similar to BitCoin today?  I mean, how could anyone have thought about "mining coins" when there wasn't even an internet back then?

It's so bizarre to think about and scary to look at that coin and how accurate it looks that you'll have to think someone planned it many, many years ago (or had a time machine... LOL).  So, tell me how you are going to get people to accept this new currency?  I'd have to say that the only way possible is to crash the stock market so hard that people will be begging for help from the government in any form of money they will give them... and of course 2018 is just around the corner now.

So, if I were "them" I'd start with a stock market crash this year... as in October of 2017 or so.  Then I'd carry it into all of 2018 so that by the time the year ended we'd see half or more of the market erased.  A scare like that would make so many innocent people lose most or all of their 401k money that they would accept this new digital money.

Remember that the government has already got a system of money in placed called SDR's (Special Drawing Rights) that is supposed to be backed up with a basket of currencies.  Now I don't know if that will be the new money  or not, but certainly we are going to become a lot more digital after 2018.

It's always been my belief that "they" (as in the rulers of the world... the elite) let BitCoin (and other Crypto-currencies) get started and accepted by the public as they wanted everyone to get used to a digital system of money.  In fact it wouldn't surprise me if "they" didn't fund the creation of it and trick the public into thinking they were safer to stop using the US Dollar and go to BitCoin.

It's the biggest trick of all... tell everyone that hates the elite and what they've done to make the dollar almost worthless (in buying power) that there is a way to bypass "them" by switching to a new digital currency called "BitCoin".  They even let the stock price soar to record highs.  Then when everyone is "ok" with digital money they create their own through one of their satan run banks... aka, Goldman Sachs (GS).

Next would be to start taxing all other digital money except the GS Coins so that people will abandon BitCoin for their new money.  It's coming folks... and it's been a multi-decade plan by "them" that so far is playing out just like they expected.

Red.
ES Morning Update July 28th 2017

0

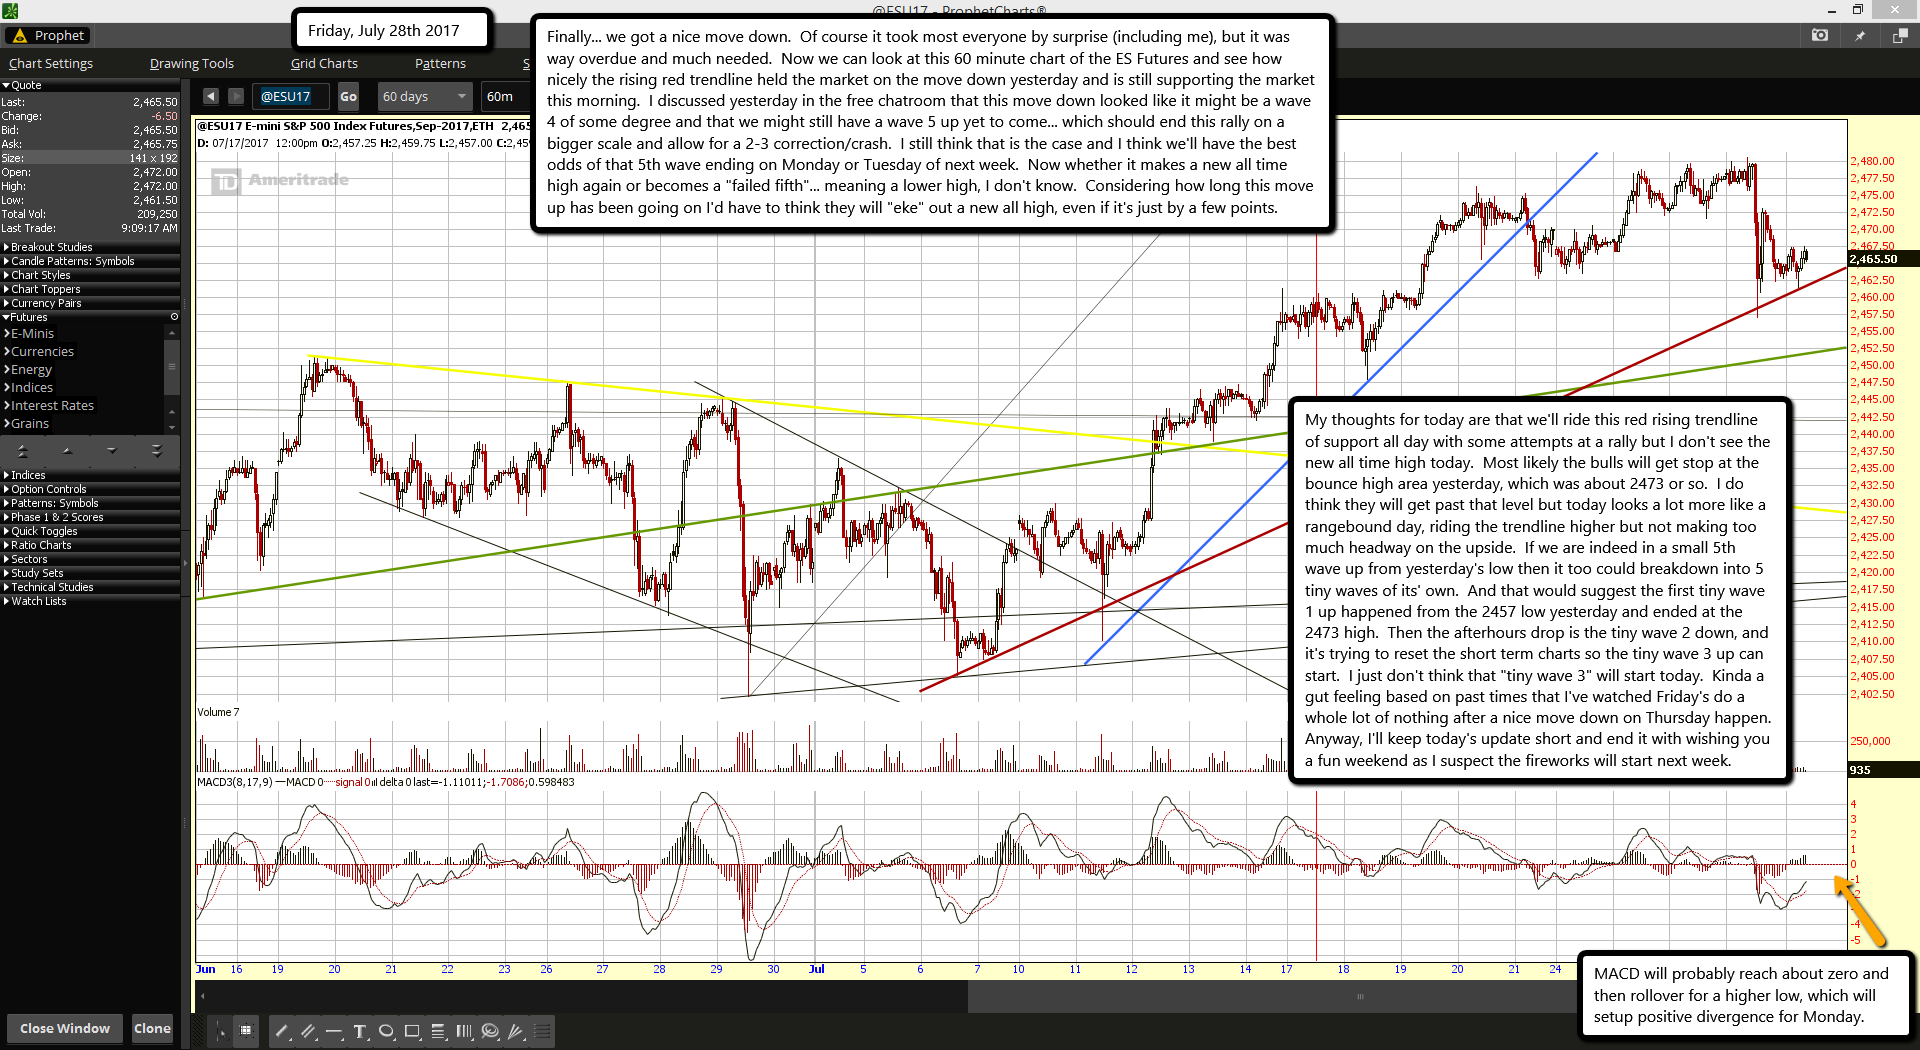
Finally... we got a nice move down.  Of course it took most everyone by surprise (including me), but it was way overdue and much needed.  Now we can look at this 60 minute chart of the ES Futures and see how nicely the rising red trendline held the market on the move down yesterday and is still supporting the market this morning.  I discussed yesterday in the free chatroom that this move down looked like it might be a wave 4 of some degree and that we might still have a wave 5 up yet to come... which should end this rally on a bigger scale and allow for a 2-3 correction/crash.  I still think that is the case and I think we'll have the best odds of that 5th wave ending on Monday or Tuesday of next week.  Now whether it makes a new all time high again or becomes a "failed fifth"... meaning a lower high, I don't know.  Considering how long this move up has been going on I'd have to think they will "eke" out a new all high, even if it's just by a few points.

My thoughts for today are that we'll ride this red rising trendline of support all day with some attempts at a rally but I don't see the new all time high today.  Most likely the bulls will get stop at the bounce high area yesterday, which was about 2473 or so.  I do think they will get past that level but today looks a lot more like a rangebound day, riding the trendline higher but not making too much headway on the upside.  If we are indeed in a small 5th wave up from yesterday's low then it too could breakdown into 5 tiny waves of its' own.  And that would suggest the first tiny wave 1 up happened from the 2457 low yesterday and ended at the 2473 high.  Then the afterhours drop is the tiny wave 2 down, and it's trying to reset the short term charts so the tiny wave 3 up can start.  I just don't think that "tiny wave 3" will start today.  Kinda a gut feeling based on past times that I've watched Friday's do a whole lot of nothing after a nice move down on Thursday happen.  Anyway, I'll keep today's update short and end it with wishing you a fun weekend as I suspect the fireworks will start next week.

ES Morning Update July 27th 2017

0

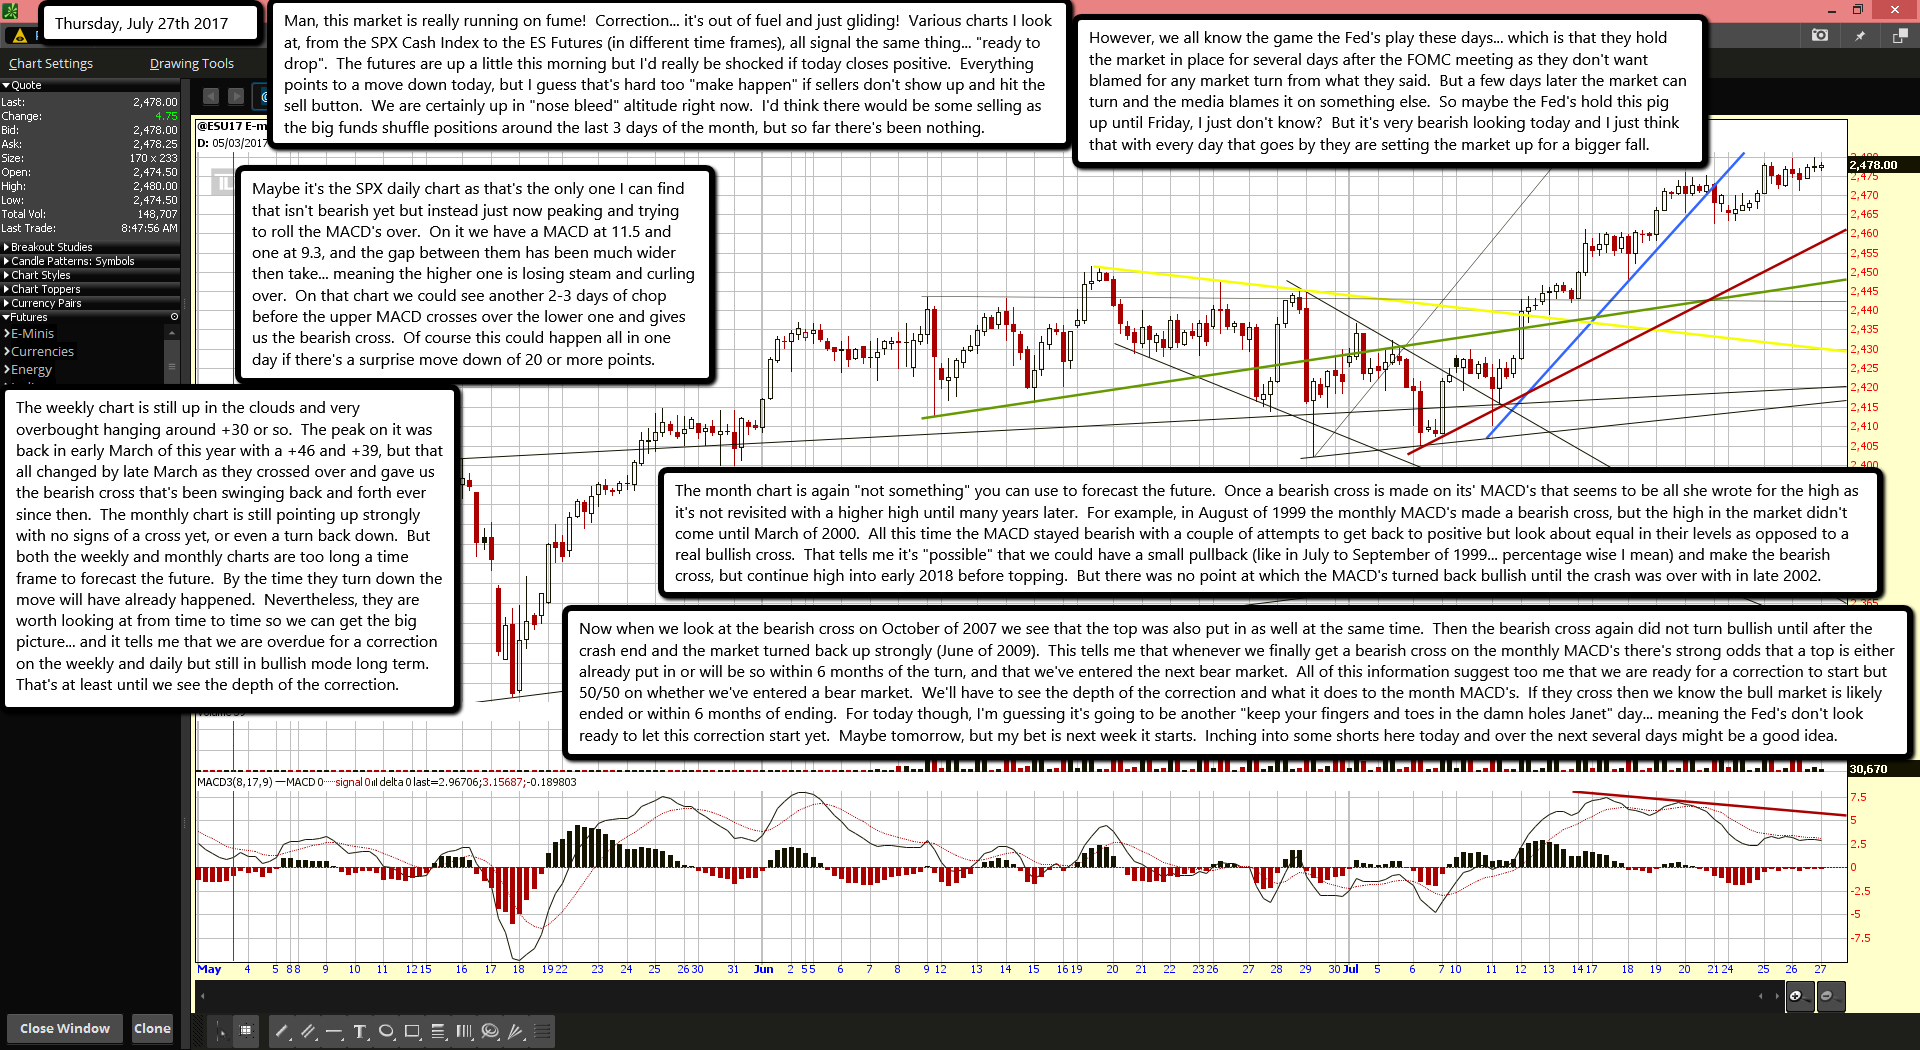
Man, this market is really running on fume!  Correction... it's out of fuel and just gliding!  Various charts I look at, from the SPX Cash Index to the ES Futures (in different time frames), all signal the same thing... "ready to drop".  The futures are up a little this morning but I'd really be shocked if today closes positive.  Everything points to a move down today, but I guess that's hard too "make happen" if sellers don't show up and hit the sell button.  We are certainly up in "nose bleed" altitude right now.  I'd think there would be some selling as the big funds shuffle positions around the last 3 days of the month, but so far there's been nothing.

However, we all know the game the Fed's play these days... which is that they hold the market in place for several days after the FOMC meeting as they don't want blamed for any market turn from what they said.  But a few days later the market can turn and the media blames it on something else.  So maybe the Fed's hold this pig up until Friday, I just don't know?  But it's very bearish looking today and I just think that with every day that goes by they are setting the market up for a bigger fall.

Maybe it's the SPX daily chart as that's the only one I can find that isn't bearish yet but instead just now peaking and trying to roll the MACD's over.  On it we have a MACD at 11.5 and one at 9.3, and the gap between them has been much wider then take... meaning the higher one is losing steam and curling over.  On that chart we could see another 2-3 days of chop before the upper MACD crosses over the lower one and gives us the bearish cross.  Of course this could happen all in one day if there's a surprise move down of 20 or more points.

The weekly chart is still up in the clouds and very overbought hanging around +30 or so.  The peak on it was back in early March of this year with a +46 and +39, but that all changed by late March as they crossed over and gave us the bearish cross that's been swinging back and forth ever since then.  The monthly chart is still pointing up strongly with no signs of a cross yet, or even a turn back down.  But both the weekly and monthly charts are too long a time frame to forecast the future.  By the time they turn down the move will have already happened.  Nevertheless, they are worth looking at from time to time so we can get the big picture... and it tells me that we are overdue for a correction on the weekly and daily but still in bullish mode long term.  That's at least until we see the depth of the correction.

The month chart is again "not something" you can use to forecast the future.  Once a bearish cross is made on its' MACD's that seems to be all she wrote for the high as it's not revisited with a higher high until many years later.  For example, in August of 1999 the monthly MACD's made a bearish cross, but the high in the market didn't come until March of 2000.  All this time the MACD stayed bearish with a couple of attempts to get back to positive but look about equal in their levels as opposed to a real bullish cross.  That tells me it's "possible" that we could have a small pullback (like in July to September of 1999... percentage wise I mean) and make the bearish cross, but continue high into early 2018 before topping.  But there was no point at which the MACD's turned back bullish until the crash was over with in late 2002.

Now when we look at the bearish cross on October of 2007 we see that the top was also put in as well at the same time.  Then the bearish cross again did not turn bullish until after the crash end and the market turned back up strongly (June of 2009).  This tells me that whenever we finally get a bearish cross on the monthly MACD's there's strong odds that a top is either already put in or will be so within 6 months of the turn, and that we've entered the next bear market.  All of this information suggest too me that we are ready for a correction to start but 50/50 on whether we've entered a bear market.  We'll have to see the depth of the correction and what it does to the month MACD's.  If they cross then we know the bull market is likely ended or within 6 months of ending.  For today though, I'm guessing it's going to be another "keep your fingers and toes in the damn holes Janet" day... meaning the Fed's don't look ready to let this correction start yet.  Maybe tomorrow, but my bet is next week it starts.  Inching into some shorts here today and over the next several days might be a good idea.

American company microchips employees with device the size of a grain of rice

0

American company microchips employees with device the size of a grain of rice

A US company is microchipping its employees to enable them more convenient access to workplace amenities.

The Wisconsin company -  Three Square Market – designs software for break room markets that are commonly found in office complexes.

Now ABC News reports just as people can purchase items at the market using phones, Three Square Market wants to do the same using a microchip implanted inside a person’s hand.

Todd Westby, Three Square Market CEO, said: "It's the next thing that's inevitably going to happen, and we want to be a part of it.”

More than 50 employees have volunteered to have the devices implanted with a chip that is about the size of a single grain of rice.

Along with purchasing market kiosk items, employees will be able to use the chip to enter the building via the front door and log onto their computers.

The chip – which costs $300 and is currently being paid for by the company – is implanted between a person’s thumb and forefinger.

Westby assured ABC News the chip does not use GPS tracking and the data is both encrypted and secure.

No one who works at Three Square Market is required to get the chip implant.

ES Morning Update July 26th 2017

0

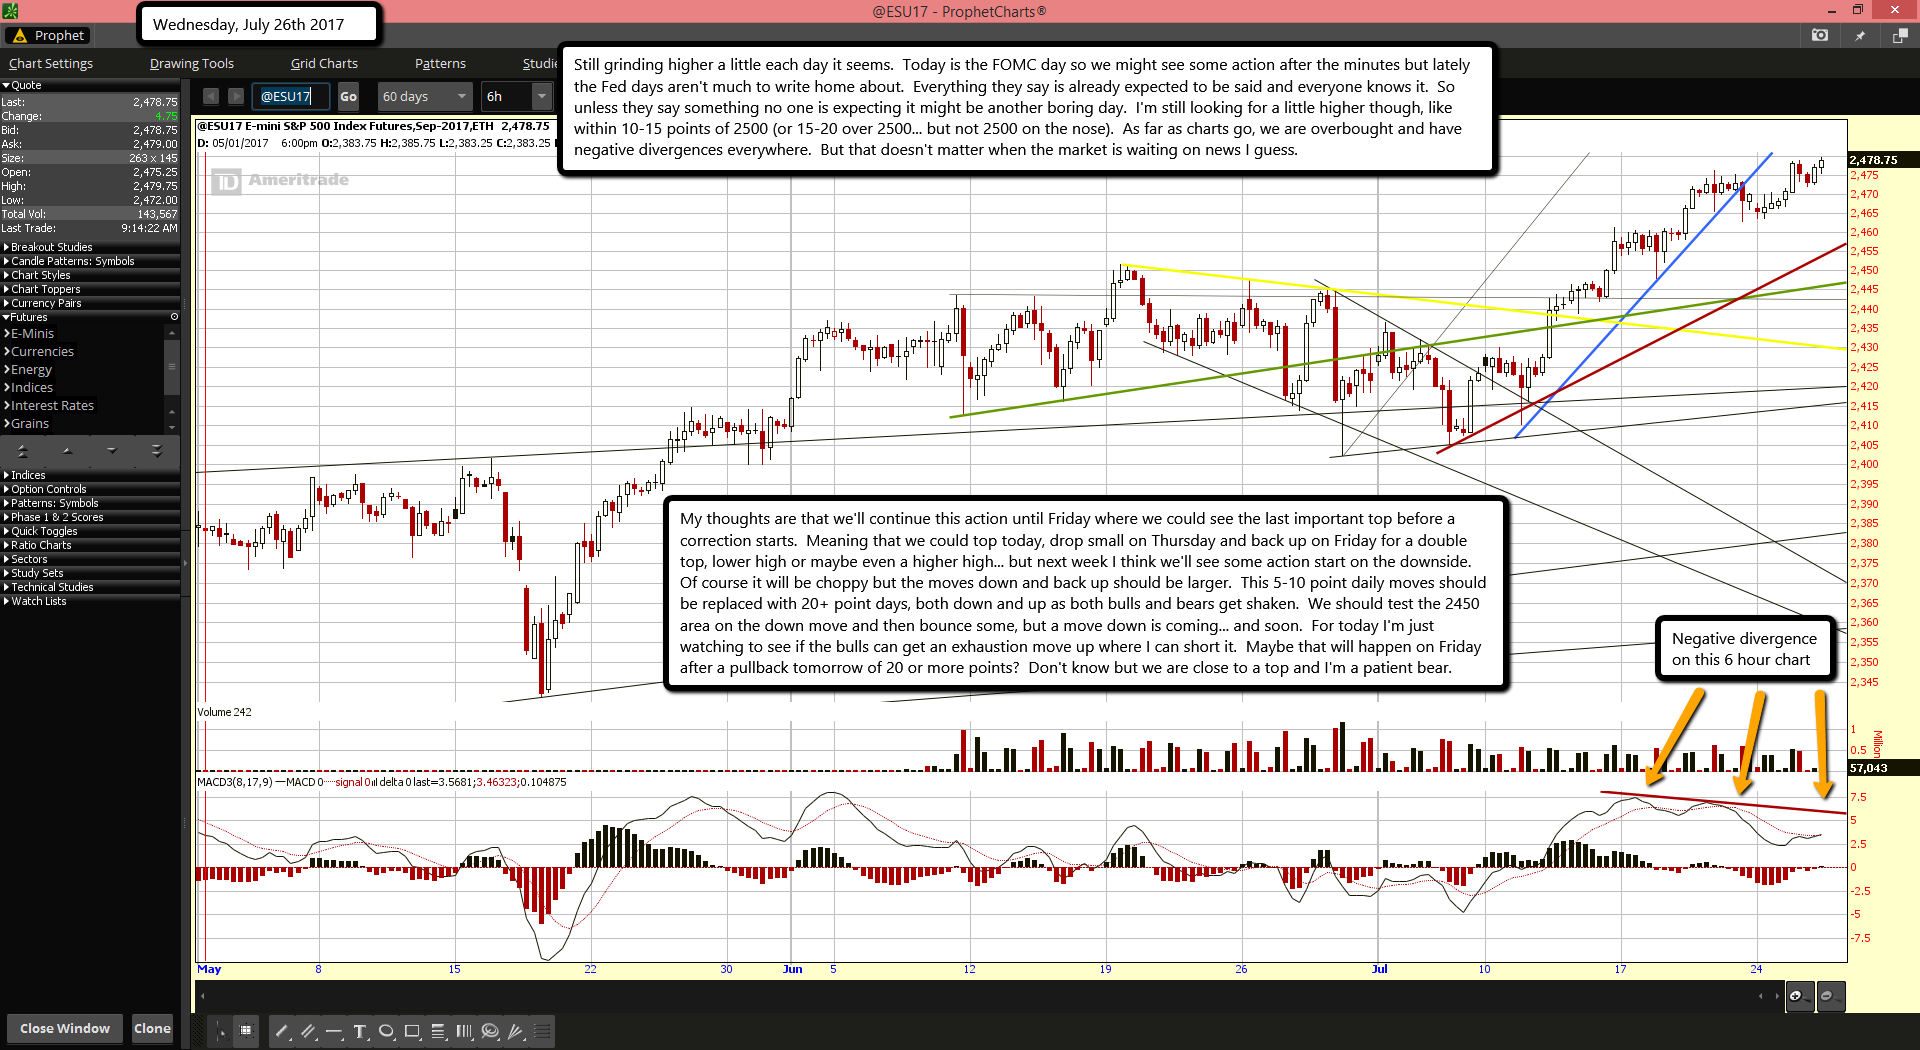
Still grinding higher a little each day it seems.  Today is the FOMC day so we might see some action after the minutes but lately the Fed days aren't much to write home about.  Everything they say is already expected to be said and everyone knows it.  So unless they say something no one is expecting it might be another boring day.  I'm still looking for a little higher though, like within 10-15 points of 2500 (or 15-20 over 2500... but not 2500 on the nose).  As far as charts go, we are overbought and have negative divergences everywhere.  But that doesn't matter when the market is waiting on news I guess.

My thoughts are that we'll continue this action until Friday where we could see the last important top before a correction starts.  Meaning that we could top today, drop small on Thursday and back up on Friday for a double top, lower high or maybe even a higher high... but next week I think we'll see some action start on the downside.  Of course it will be choppy but the moves down and back up should be larger.  This 5-10 point daily moves should be replaced with 20+ point days, both down and up as both bulls and bears get shaken.  We should test the 2450 area on the down move and then bounce some, but a move down is coming... and soon.  For today I'm just watching to see if the bulls can get an exhaustion move up where I can short it.  Maybe that will happen on Friday after a pullback tomorrow of 20 or more points?  Don't know but we are close to a top and I'm a patient bear.

ES Morning Update July 25th 2017

0

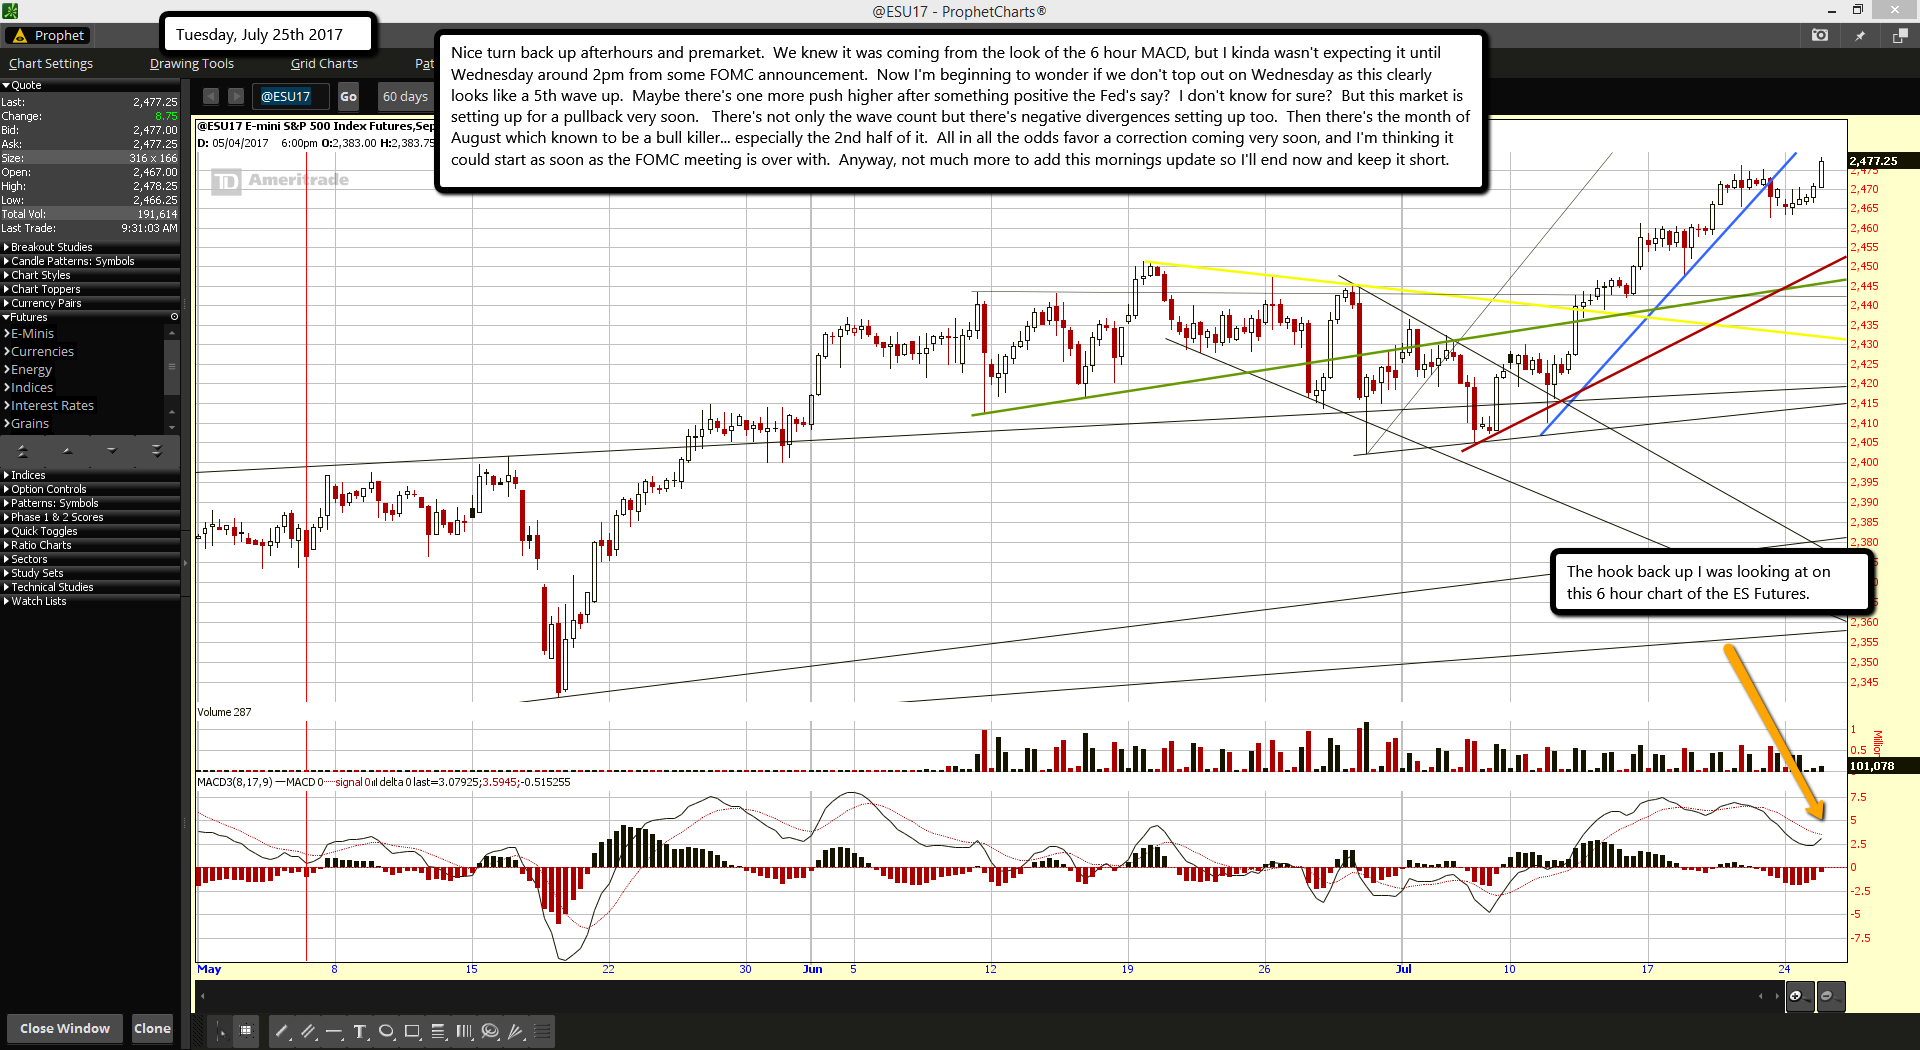
Nice turn back up afterhours and premarket.  We knew it was coming from the look of the 6 hour MACD, but I kinda wasn't expecting it until Wednesday around 2pm from some FOMC announcement.  Now I'm beginning to wonder if we don't top out on Wednesday as this clearly looks like a 5th wave up.  Maybe there's one more push higher after something positive the Fed's say?  I don't know for sure?  But this market is setting up for a pullback very soon.   There's not only the wave count but there's negative divergences setting up too.  Then there's the month of August which known to be a bull killer... especially the 2nd half of it.  All in all the odds favor a correction coming very soon, and I'm thinking it could start as soon as the FOMC meeting is over with.  Anyway, not much more to add this mornings update so I'll end now and keep it short.

ES Morning Update July 24th 2017

0

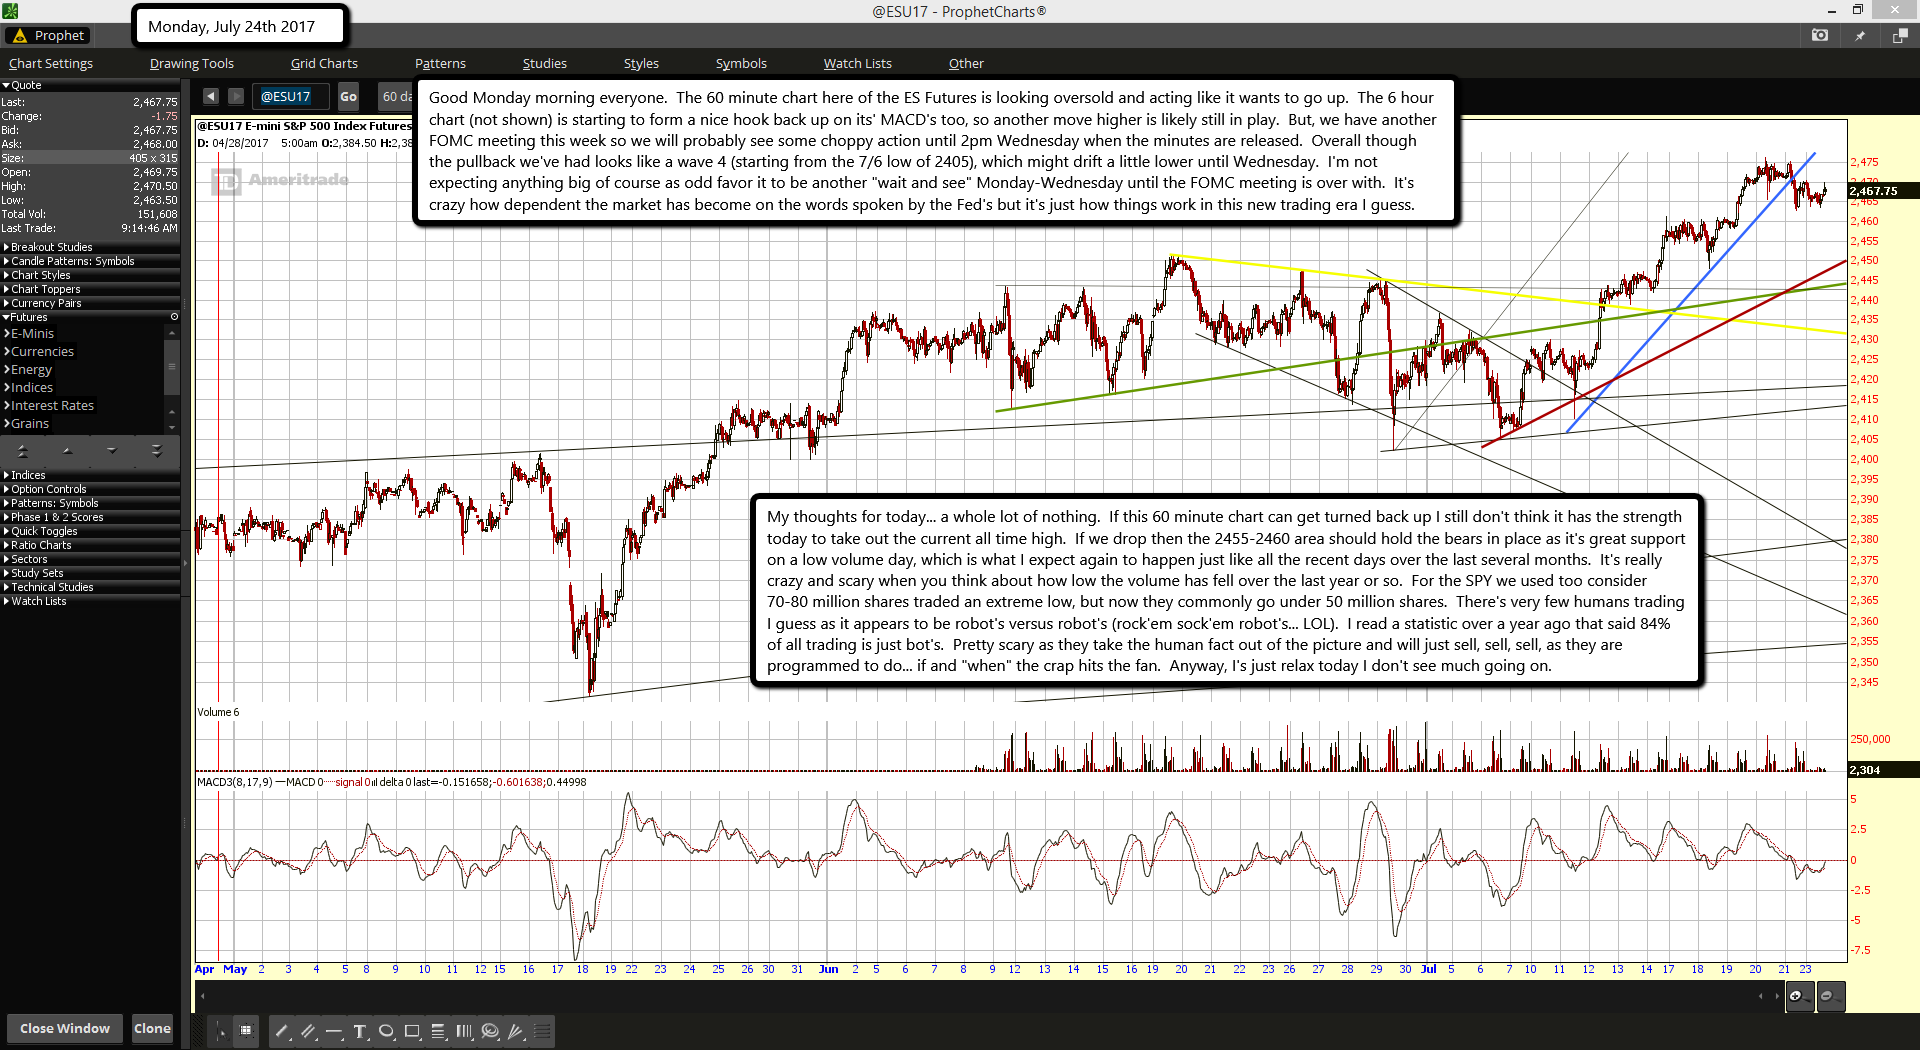
Good Monday morning everyone.  The 60 minute chart here of the ES Futures is looking oversold and acting like it wants to go up.  The 6 hour chart (not shown) is starting to form a nice hook back up on its' MACD's too, so another move higher is likely still in play.  But, we have another FOMC meeting this week so we will probably see some choppy action until 2pm Wednesday when the minutes are released.  Overall though the pullback we've had looks like a wave 4 (starting from the 7/6 low of 2405), which might drift a little lower until Wednesday.  I'm not expecting anything big of course as odd favor it to be another "wait and see" Monday-Wednesday until the FOMC meeting is over with.  It's crazy how dependent the market has become on the words spoken by the Fed's but it's just how things work in this new trading era I guess.

My thoughts for today... a whole lot of nothing.  If this 60 minute chart can get turned back up I still don't think it has the strength today to take out the current all time high.  If we drop then the 2455-2460 area should hold the bears in place as it's great support on a low volume day, which is what I expect again to happen just like all the recent days over the last several months.  It's really crazy and scary when you think about how low the volume has fell over the last year or so.  For the SPY we used too consider 70-80 million shares traded an extreme low, but now they commonly go under 50 million shares.  There's very few humans trading I guess as it appears to be robot's versus robot's (rock'em sock'em robot's... LOL).  I read a statistic over a year ago that said 84% of all trading is just bot's.  Pretty scary as they take the human fact out of the picture and will just sell, sell, sell, as they are programmed to do... if and "when" the crap hits the fan.  Anyway, I's just relax today I don't see much going on.

ES Morning Update July 21st 2017

0

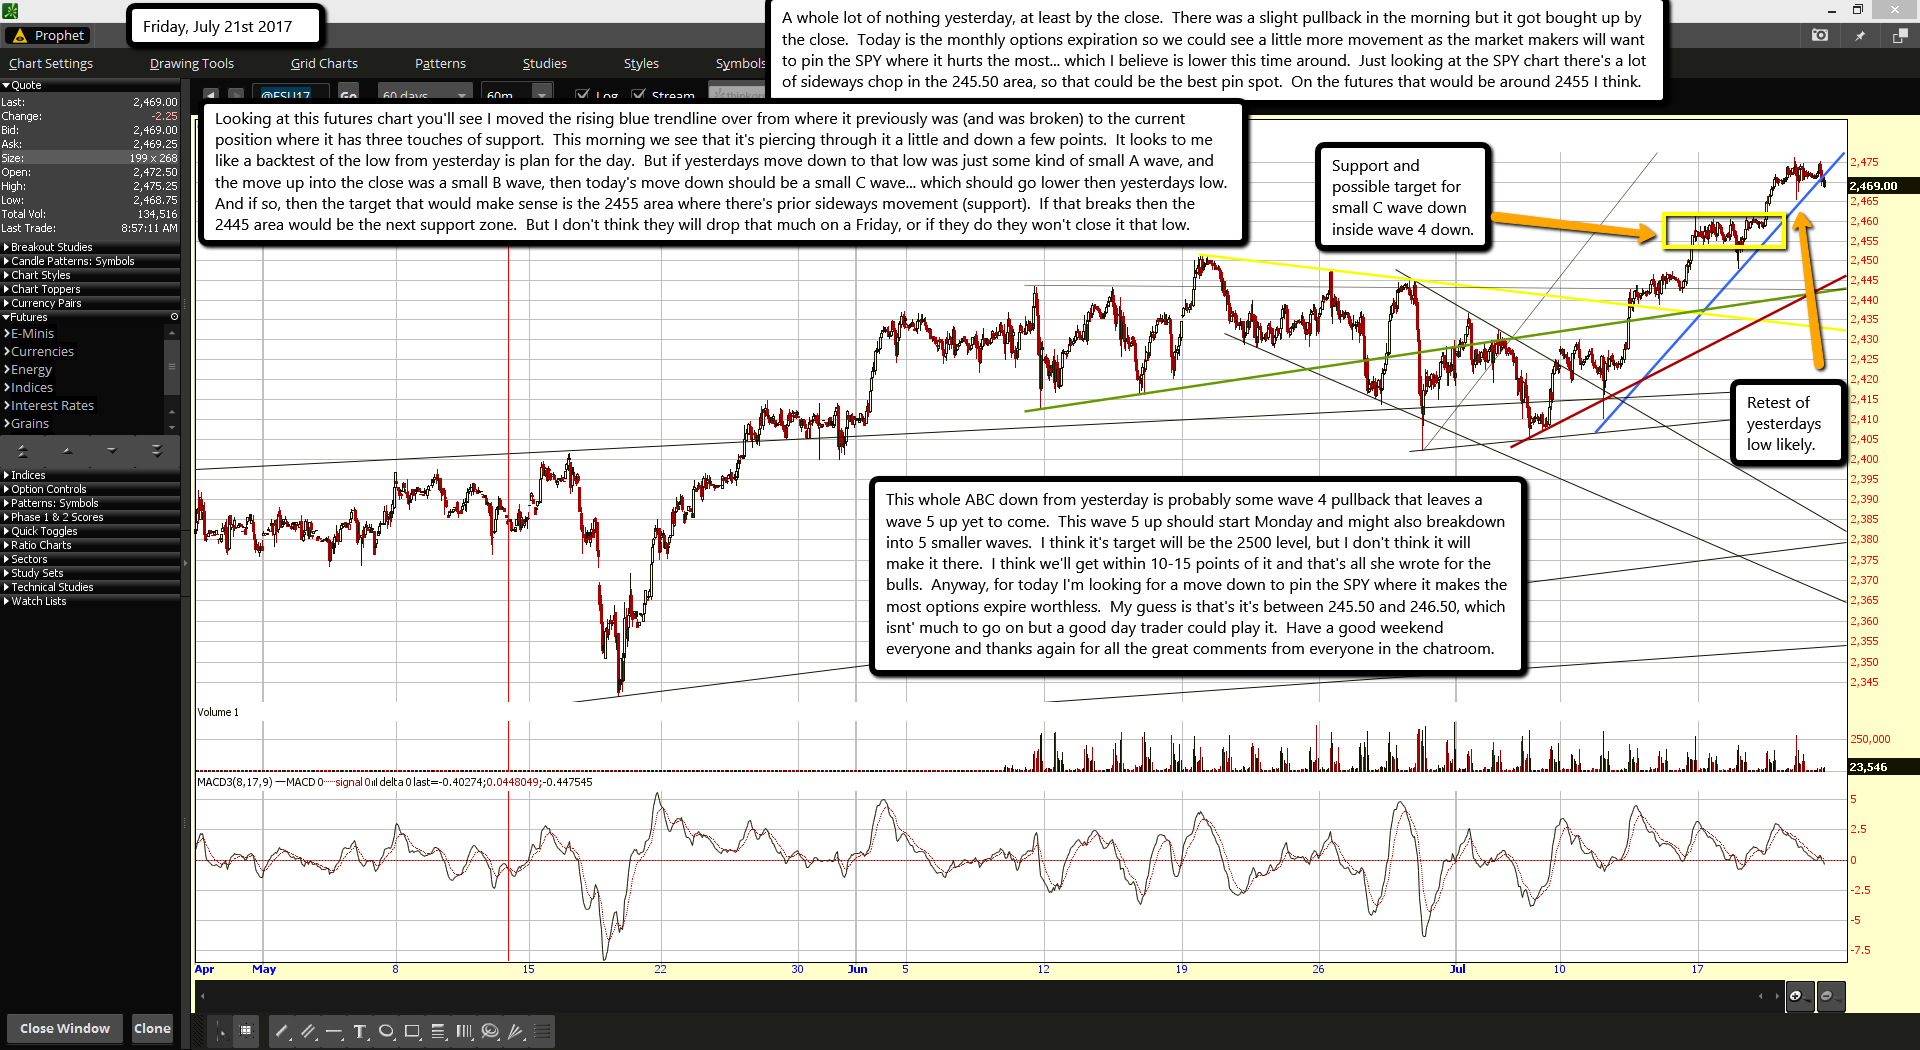
A whole lot of nothing yesterday, at least by the close.  There was a slight pullback in the morning but it got bought up by the close.  Today is the monthly options expiration so we could see a little more movement as the market makers will want to pin the SPY where it hurts the most... which I believe is lower this time around.  Just looking at the SPY chart there's a lot of sideways chop in the 245.50 area, so that could be the best pin spot.  On the futures that would be around 2455 I think.

Looking at this futures chart you'll see I moved the rising blue trendline over from where it previously was (and was broken) to the current position where it has three touches of support.  This morning we see that it's piercing through it a little and down a few points.  It looks to me like a backtest of the low from yesterday is plan for the day.  But if yesterdays move down to that low was just some kind of small A wave, and the move up into the close was a small B wave, then today's move down should be a small C wave... which should go lower then yesterdays low.  And if so, then the target that would make sense is the 2455 area where there's prior sideways movement (support).  If that breaks then the 2445 area would be the next support zone.  But I don't think they will drop that much on a Friday, or if they do they won't close it that low.

This whole ABC down from yesterday is probably some wave 4 pullback that leaves a wave 5 up yet to come.  This wave 5 up should start Monday and might also breakdown into 5 smaller waves.  I think it's target will be the 2500 level, but I don't think it will make it there.  I think we'll get within 10-15 points of it and that's all she wrote for the bulls.  Anyway, for today I'm looking for a move down to pin the SPY where it makes the most options expire worthless.  My guess is that's it's between 245.50 and 246.50, which isnt' much to go on but a good day trader could play it.  Have a good weekend everyone and thanks again for all the great comments from everyone in the chatroom.

Last week the Fed raised the white flag on further rate hikes. There won’t be any for the foreseeable future.

0

No rate hikes are coming at the July, September or November Fed FOMC meetings. The earliest rate hike might be at the December 13, 2017 FOMC meeting, but even that has a less than 50% probability as of today. I’ll update those probabilities using my proprietary models in the weeks and months ahead.

The white flag of surrender came in two public comments by two of the only four FOMC members whose opinions really count. The four voting members of the FOMC worth listening to are Janet Yellen, Stan Fischer, Bill Dudley and Lael Brainard.

Yellen and Brainard made public remarks last week. Yellen’s testimony before Congress received the usual saturation coverage. Brainard’s remarks to an academic conference at Columbia University received far less coverage, but were perhaps far more important in terms of the impact of Fed policy on markets including gold.

These comments by the two FOMC members should be put in the context of my model forecast for Fed behavior. I expect the Fed to raise rates 0.25% at FOMC meetings every March, June, September and December from now until mid-2019 until the Fed’s policy rate reaches a “normalized” level of 3.25%.

However, the Fed will “pause” in these rate hikes when if seek weak job creation (below 75,000 jobs per month), persistent disinflation, or a disorderly stock market decline of more than 5%. Absent those pause factors, the Fed is on auto-pilot to raise rates.

The Fed will also reduce its balance sheet starting this September at a level of $10 billion per month, ramping up to $50 billion per month, until the balance sheet is “normalized” at about $2.5 trillion (down from over $4 trillion today).

The balance sheet reduction is intended to “run on background” and will not be dialed-up or dialed-down as a policy tool. Balance sheet normalization is a “set it, and forget it” tool that will not be subject to the pause factors.

That’s the baseline for normalization. Now for the exceptions. If I am forecasting no rate hike in September, which pause factor applies?

The answer is disinflation. The Fed’s preferred metric for inflation is the Core PCE price deflator year-over-year. The Fed’s goal for this metric is 2%.

Here’s the actual data:

February 1.8%

March 1.6%

April 1.5%

May 1.4%

The June data has not yet been released. However, June data was released for a similar measure, which is Core PPI year-over-year. That measure was 2.1% in May and 2.0% in June.

Taken together, this data shows that disinflation is strong, the Fed is moving further away from its goals, and the trend is not transitory. That’s what Yellen publicly acknowledged on July 13, and that’s why she threw in the towel on a September rate hike.

Brainard’s July 11 speech was much more technical than Yellen’s testimony and more interesting. She made it clear she would not vote for a rate hike in September. Brainard said much the same thing in an earlier speech on May 30, 2017 in New York, but the July 11 speech put the last nail in the coffin of a rate hike.

But, the July 11 speech spent far more time on the difference between rate hikes and balance sheet reduction as forms of normalization. Brainard recognized that both forms of normalization constitute monetary tightening and have the potential to make the dollar stronger, weaken other currencies, and create international “spillover” effects including capital outflows and market crashes in our trading partners and emerging markets.

These kind of spillovers were seen in May 2013 (the taper tantrum), August 2015 (the China shock devaluation and U.S. market crash), and January 2016 (the China stealth devaluation and another U.S. market crash). Brainard understands the importance of avoiding international spillovers as the Fed goes about the business of tightening.

Brainard took the view that balance sheet reductions have a much smaller impact on exchange rates than interest rates hikes. She also took the view that one is a substitute for the other in terms of normalization. Therefore, when economic conditions are weak, as they are now, the Fed could continue balance sheet reductions, but pause on rate hikes to continue normalization while minimizing foreign exchange spillovers.

Brainard bases this view on something called the “interest rate parity” theory that says changes in short-term rates (those affected by the Fed policy rate) are a stronger determinant of exchange rates than intermediate term rates (those affect by balance sheet reductions).

The problem, as usual, is that the Fed’s theories bear no relation to reality.

Interest rate parity is an old idea that has little or no explanatory power today. I first learned it in the 1970s shortly after the end of fixed-exchange rates. Exchange rates today are driven by capital flows, which are driven by investor perceptions across a range of indicators that include all forms of Fed normalization.

The result of applying an obsolete theory will be an economic crack-up, probably in the form of a recession. This will produce a 20% decline in stock prices at best, and possibly a 30% market crash before the end of the year. This will be caused by Fed tightening (whether by the policy rate or balance sheet reductions) into weakness.

First quarter GDP growth was 1.4%, Second quarter growth is currently estimated by the Atlanta Fed at 2.4%. (That 2.4% estimate was down from the May 1 estimate of 4.3%, and the June 13 estimate of 3.0%; another clear sign of economic slowing).

If the second quarter is reported at at 2.4% level, it would put first-half GDP at 1.9%, which is lower than the historically weak 2.03% average annual growth since the end of the last recession in June 2009.

In short, growth is weak, inflation is weak, retail sales and real incomes are weak, labor force participation is low and stocks are at all-time highs. Brainard and Yellen made it clear that the Fed will continue to tighten through balance sheet reductions even if rate hikes are on hold.

Tight money, a weak economy, and a stock market bubble is a classic recipe for a stock market crash. It’s time for investors to go into a defensive crouch by selling stocks and reallocating assets to cash, Treasury notes, gold and gold mining shares.

In particular, gold will be the big winner when the Fed suddenly realizes its blunder and has to pivot quickly to ease, probably by late summer. The time to position in gold is right now.”

Regards,

http://2.bp.blogspot.com/-hKVMNMEQZHA/UzB0APtMl9I/AAAAAAAABfA/DmaerwdbN14/s1600/James+Rickards.jpg

Jim Rickards
for The Daily Reckoning

ES Morning Update July 20th 2017

0

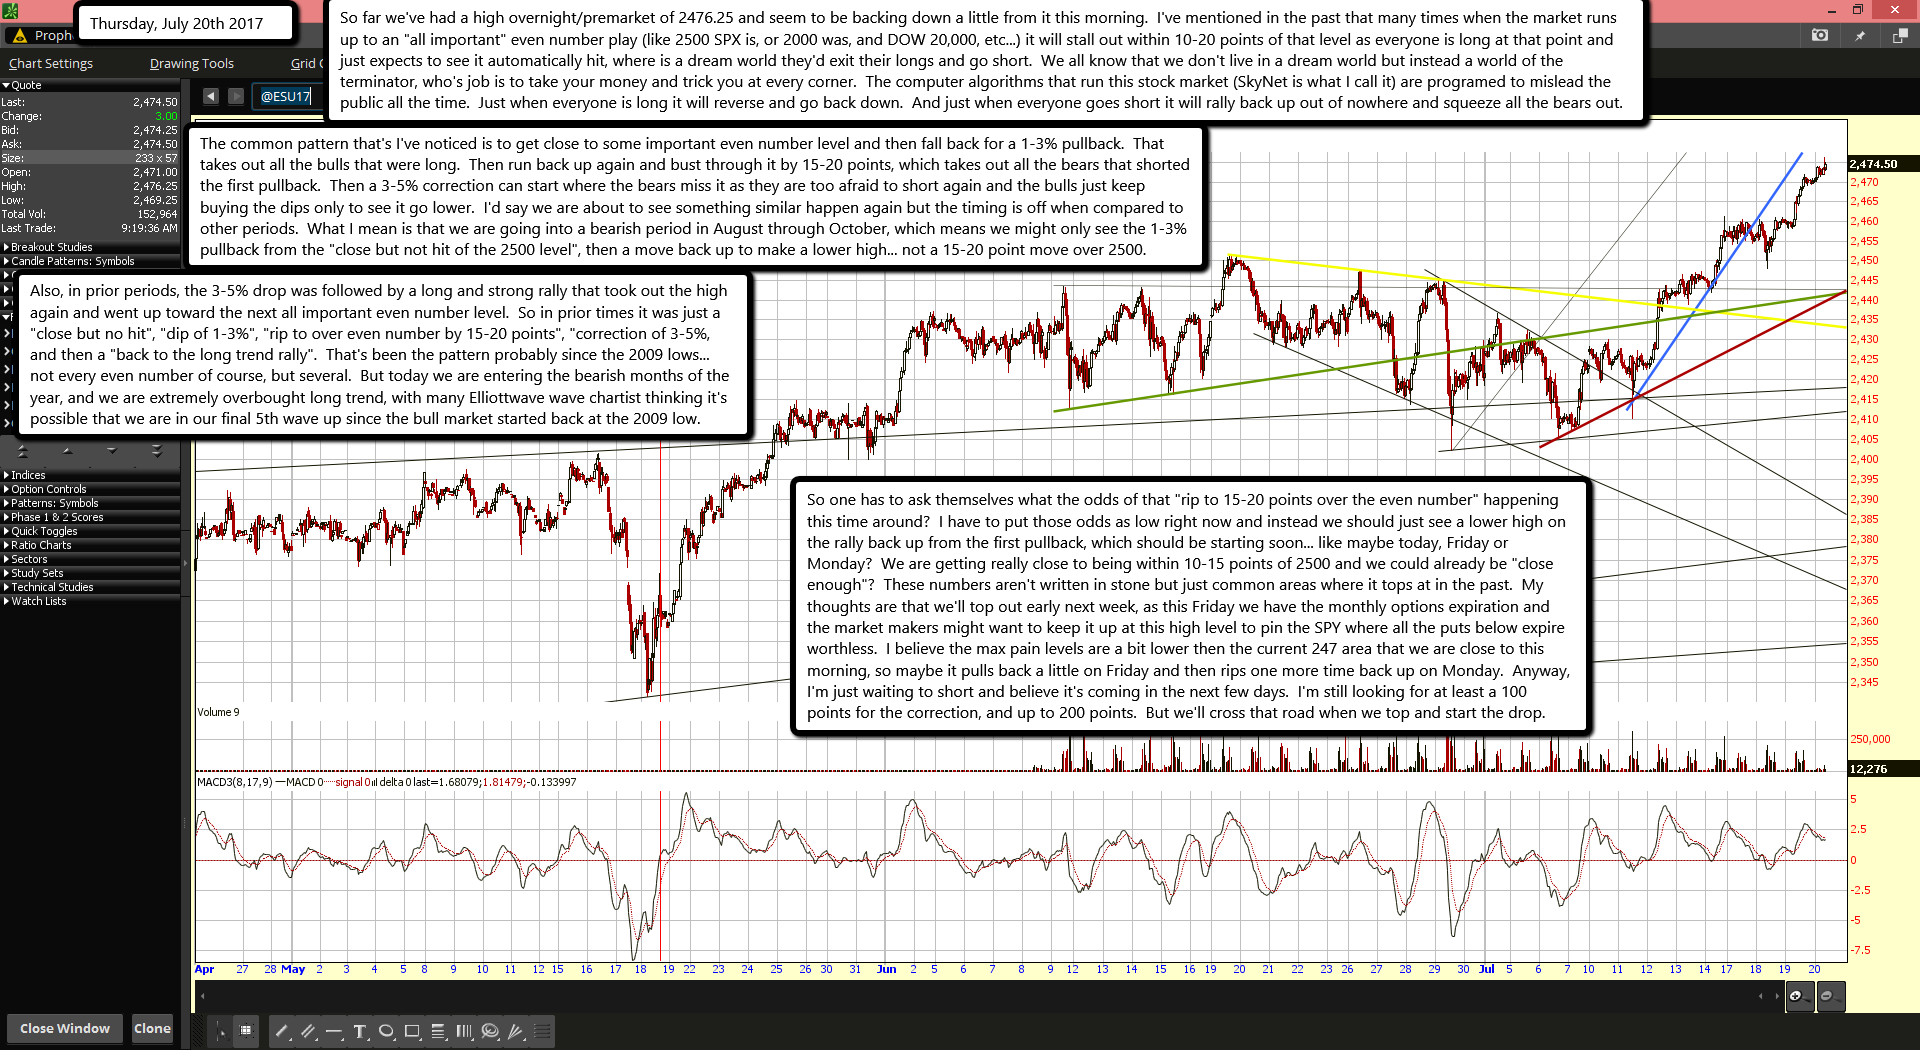
So far we've had a high overnight/premarket of 2476.25 and seem to be backing down a little from it this morning.  I've mentioned in the past that many times when the market runs up to an "all important" even number play (like 2500 SPX is, or 2000 was, and DOW 20,000, etc...) it will stall out within 10-20 points of that level as everyone is long at that point and just expects to see it automatically hit, where is a dream world they'd exit their longs and go short.  We all know that we don't live in a dream world but instead a world of the terminator, who's job is to take your money and trick you at every corner.  The computer algorithms that run this stock market (SkyNet is what I call it) are programed to mislead the public all the time.  Just when everyone is long it will reverse and go back down.  And just when everyone goes short it will rally back up out of nowhere and squeeze all the bears out.

The common pattern that's I've noticed is to get close to some important even number level and then fall back for a 1-3% pullback.  That takes out all the bulls that were long.  Then run back up again and bust through it by 15-20 points, which takes out all the bears that shorted the first pullback.  Then a 3-5% correction can start where the bears miss it as they are too afraid to short again and the bulls just keep buying the dips only to see it go lower.  I'd say we are about to see something similar happen again but the timing is off when compared to other periods.  What I mean is that we are going into a bearish period in August through October, which means we might only see the 1-3% pullback from the "close but not hit of the 2500 level", then a move back up to make a lower high... not a 15-20 point move over 2500.

Also, in prior periods, the 3-5% drop was followed by a long and strong rally that took out the high again and went up toward the next all important even number level.  So in prior times it was just a "close but no hit", "dip of 1-3%", "rip to over even number by 15-20 points", "correction of 3-5%, and then a "back to the long trend rally".  That's been the pattern probably since the 2009 lows... not every even number of course, but several.  But today we are entering the bearish months of the year, and we are extremely overbought long trend, with many Elliottwave wave chartist thinking it's possible that we are in our final 5th wave up since the bull market started back at the 2009 low.

So one has to ask themselves what the odds of that "rip to 15-20 points over the even number" happening this time around?  I have to put those odds as low right now and instead we should just see a lower high on the rally back up from the first pullback, which should be starting soon... like maybe today, Friday or Monday?  We are getting really close to being within 10-15 points of 2500 and we could already be "close enough"?  These numbers aren't written in stone but just common areas where it tops at in the past.  My thoughts are that we'll top out early next week, as this Friday we have the monthly options expiration and the market makers might want to keep it up at this high level to pin the SPY where all the puts below expire worthless.  I believe the max pain levels are a bit lower then the current 247 area that we are close to this morning, so maybe it pulls back a little on Friday and then rips one more time back up on Monday.  Anyway, I'm just waiting to short and believe it's coming in the next few days.  I'm still looking for at least a 100 points for the correction, and up to 200 points.  But we'll cross that road when we top and start the drop.

ES Morning Update July 19th 2017

0

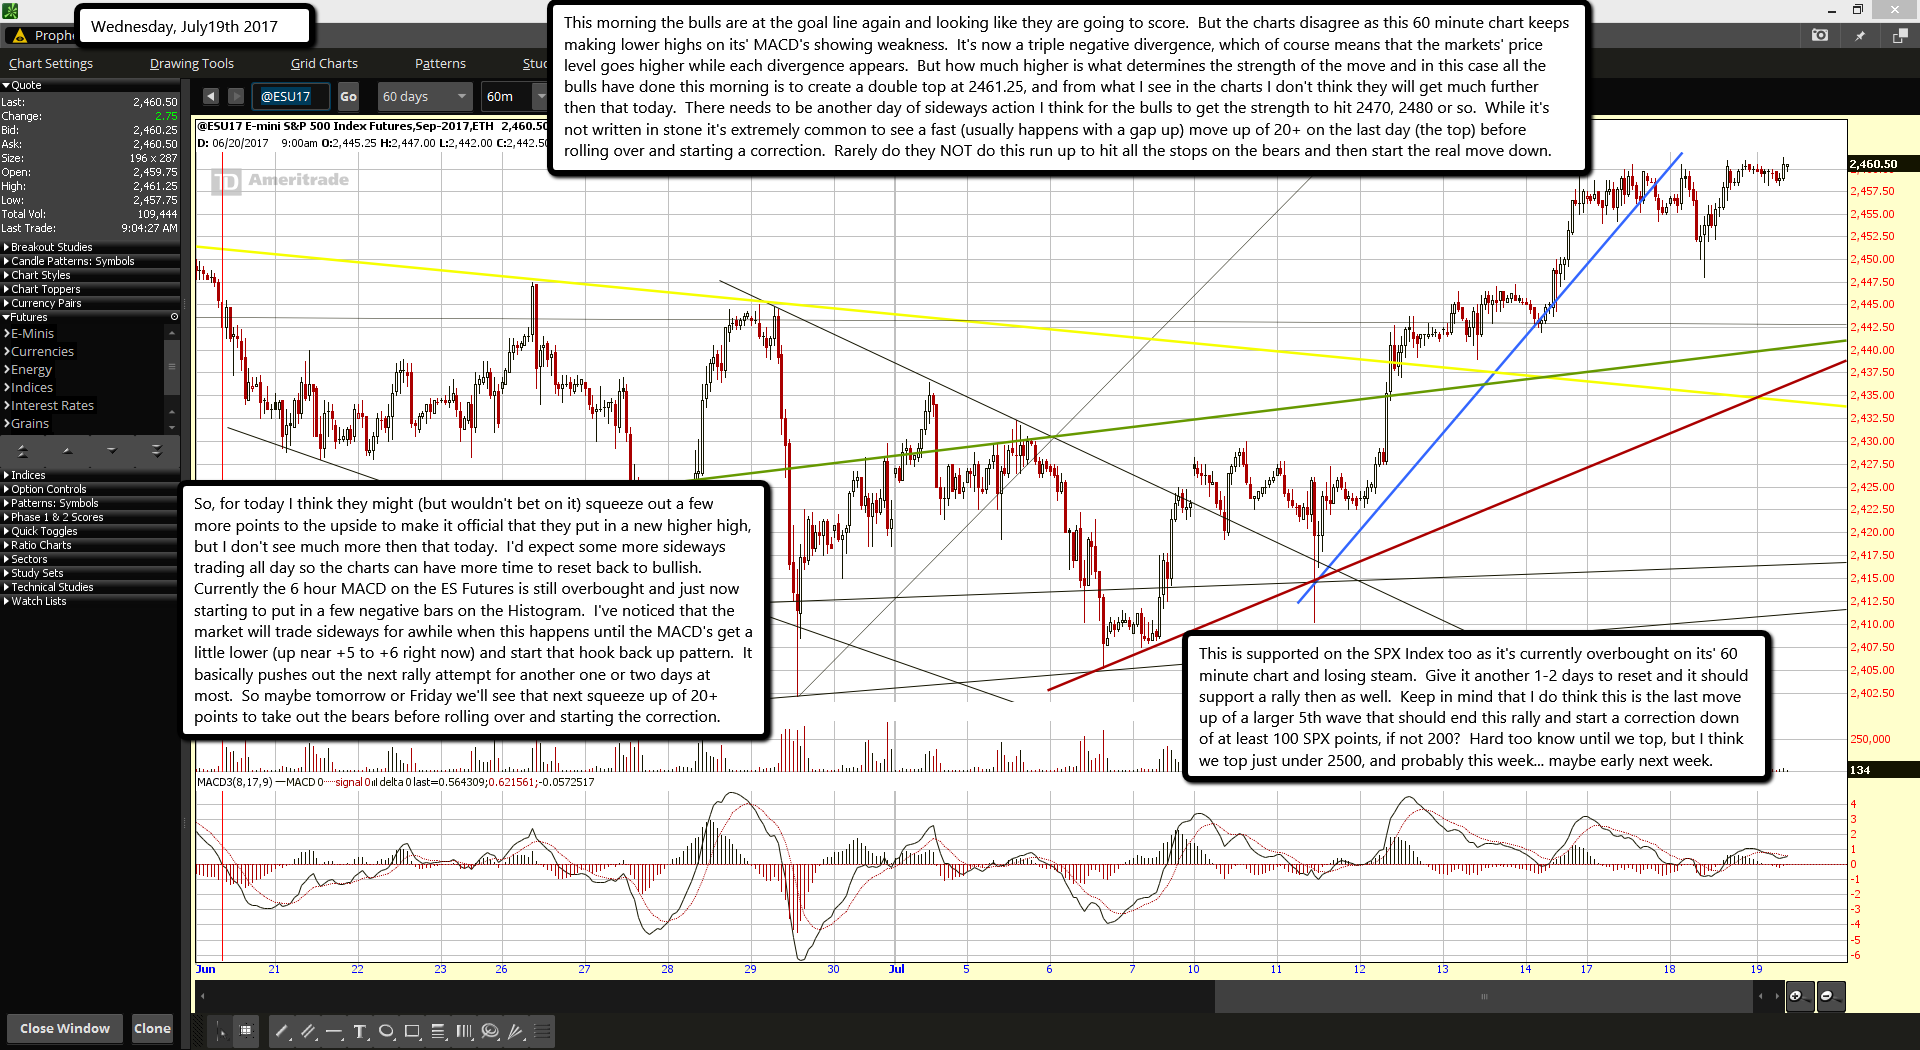
This morning the bulls are at the goal line again and looking like they are going to score.  But the charts disagree as this 60 minute chart keeps making lower highs on its' MACD's showing weakness.  It's now a triple negative divergence, which of course means that the markets' price level goes higher while each divergence appears.  But how much higher is what determines the strength of the move and in this case all the bulls have done this morning is to create a double top at 2461.25, and from what I see in the charts I don't think they will get much further then that today.  There needs to be another day of sideways action I think for the bulls to get the strength to hit 2470, 2480 or so.  While it's not written in stone it's extremely common to see a fast (usually happens with a gap up) move up of 20+ on the last day (the top) before rolling over and starting a correction.  Rarely do they NOT do this run up to hit all the stops on the bears and then start the real move down.

So, for today I think they might (but wouldn't bet on it) squeeze out a few more points to the upside to make it official that they put in a new higher high, but I don't see much more then that today.  I'd expect some more sideways trading all day so the charts can have more time to reset back to bullish.  Currently the 6 hour MACD on the ES Futures is still overbought and just now starting to put in a few negative bars on the Histogram.  I've noticed that the market will trade sideways for awhile when this happens until the MACD's get a little lower (up near +5 to +6 right now) and start that hook back up pattern.  It basically pushes out the next rally attempt for another one or two days at most.  So maybe tomorrow or Friday we'll see that next squeeze up of 20+ points to take out the bears before rolling over and starting the correction.

This is supported on the SPX Index too as it's currently overbought on its' 60 minute chart and losing steam.  Give it another 1-2 days to reset and it should support a rally then as well.  Keep in mind that I do think this is the last move up of a larger 5th wave that should end this rally and start a correction down of at least 100 SPX points, if not 200?  Hard too know until we top, but I think we top just under 2500, and probably this week... maybe early next week.

The Fed’s New Plan Could Kill the Market as Soon as September

0

As far as the markets go, they've had an incredible run since 2009.

That's because the U.S. Federal Reserve bought more than $4 trillion worth of bonds and securities in the open market to flatten interest rates and buoy said markets.

But going forward, starting in September, the Fed's stopping its monthly purchases of billions of dollars' worth of bonds… and that could send the markets into a tailspin.

Today, I'm covering what Fed Chair Janet Yellen said in her recent Humphrey-Hawkins testimony to Congress. More importantly, I'm covering what she didn't say, and what could happen starting in September.

If you own stocks, you're going to want to take this seriously…

How the Fed Is Currently Propping Up Our Markets

The bottom line is that the Fed doesn't have any capital to speak of. It buys bonds on made-up credit.

When it purchases bonds in the open market, from the big bank "primary dealers" it deals directly with, it pays them by issuing electronic credits. Banks and dealers use those credits to make loans or buy more bonds and securities themselves, which the Fed comes back to them to buy, again and again.

That's how that game was played.

The direct winners in that game were, of course, the big banks who were crushed by the financial meltdown in 2008 and needed rescuing.

The secondary winners were the markets. With so much credit available to borrowers who wanted to buy stocks and to companies who wanted to buy back their own shares, the markets not only recovered, they went on a tear.

Not only did the Fed buy bonds banks couldn't sell to other banks (because none of the big banks were technically solvent and were afraid if they sold bonds or securities to other banks, they would never get paid), and not only did the Fed buy bonds and securities that were at the time almost worthless. The Fed lent banks money so they could buy more government bonds from the Treasury and in the open market, which the Fed would then buy from the banks.

All that bond buying by banks – which helped lift bond prices and lower interest rates, which they then sold to the Fed for a nice profit, left the Fed with a balance sheet laden with $4.5 trillion worth of bonds and securities.

While all eyes have been on the Fed's interest rate moves (especially the three interest rate hikes it's made over the past three quarters), the Fed's balance sheet's been off everyone's radar.

Not anymore.

The process of "normalization," meaning letting interest rates rise from the artificially manipulated levels they were knocked down to, starts with the Fed hiking the fed funds rate.

The fed funds rate is the interest rate banks charge each other when they lend each other money overnight. After the three hikes the Fed induced, the fed funds rate is now between 1% and 1.25%. That's an annualized rate.

It's the only rate the Fed directly influences, but it influences all other rates along the yield curve for government bonds, corporate and junk bonds, and, of course, loans. Hiking that is the outward path to normalization.

But the 800-pound gorilla in the room, the Fed's enormous balance sheet, has to be reduced to some normal level if we are ever to have free markets again.

The Shadows in the Fed's Solution

In her testimony to Congress this week, Fed Chair Janet Yellen addressed the Fed's intention to start to unwind its balance sheet starting, she said, "probably in September."

No one really knows what's going to happen when the Fed starts to unwind.

Unwinding doesn't mean selling the inventory of bonds and securities on their balance sheet. The Fed would never do that. Selling their inventory into the open market would crush bond prices, cause interest rates to spike, and probably cause markets (both stock and bond) to crash from the weight of their selling.

Instead of selling their inventory, the Fed's going to let the balance sheet "run off."

All that means is that, as bonds in inventory mature, they run off the balance sheet and aren't replaced.

The Fed actually stopped inflating its balance sheet in October 2014. However, it maintained the total amount of inventory it held by buying more bonds with the money they got when bonds they held matured. So even though they stopped inflating their balance sheet in 2014, they've still been buying just enough to replace maturing bonds.

Starting in September, they are going to let the balance sheet run off, let bonds mature, and not replace them. They will stop buying bonds altogether.

No one knows how the markets will react when the largest buyer of bonds on the planet (except for the Bank of Japan, the Japanese central bank) stops being a support for the markets.

The one thing I can tell you is rather frightening…

If the Fed stops rolling over its inventory, flat out stops buying bonds at the pace it has been, and lets its balance sheet run off? It will result in a whopping $600 billion in securities the "free market" will have to absorb over 2019 and 2020. That's equivalent to doubling the federal budget deficit.

Markets aren't going to take that lying down. If there isn't substantial economic growth (meaning the GDP expanding at 3.5% to 4%, at least), there could be an overhang of bonds in the market that depresses prices, causes interest rates to spike, the economy to stagnate, and the stock market to tank.

How the bond markets and then the stock market reacts to the Fed's unwind starting in September will be a crucial barometer for investors.

The first sign of distress in the markets may be your first and only warning. There might not be another.

I'll be watching all the big and little metrics that reveal what's really going on in "Bond and Stock Land." And you can be sure I'll tell you when it's time to sell.

Because it could be hammer time before you realize it.

This expert insight from SG-headshot-Shah.jpg (250×290)

ES Morning Update July 18th 2017

0

Yesterday I spoke of the blue rising trendline where the bulls needed to hit afterhours and bounce up from it or else they would be at risk of retesting the 2440 zone again. Looks like they failed to hold the line and are now in retest mode. There's a lot of support in that zone from various trendlines as you can see, so if we get down there I do expect it to hold. To me this move down looks like a wave 4 of some degree and next will be the wave 5 up that should end the move up from the 2405 starting point. On a larger scale we likely in some final 5th wave up on it too... meaning this should be the final rally before an ABC down correction starts, and it should last into early November. This will be the point where a crash could happen. No one's knows for sure but every thing is setup for one to appear. But we'll cross that bridge when we get there.

For now we'll just focus on the A wave down that should be somewhere between 100 and 200 SPX points. A retest of the May 18th low seems very likely for the A wave, which is currently a little over a 100 points lower. Personally I think it will retest the March 27th and April 13th lows but again we'll take it one day at a time. For today lets just expect this wave 4 down to retest prior resistance by the close today, or by Wednesday morning. This move down could sub-divide into an ABC down pattern to make the wave 4, so don't get too excited on going long on the first bottom and turn back up as it's likely just a small B wave up with a C down later that will retest that 2440 area. Maybe it takes until tomorrow to happen, or does it all today, but odds favor a move down to 2447.25 at minimum as that's the top of that sideways chop zone from last week.

ES Morning Update July 17th 2017

0

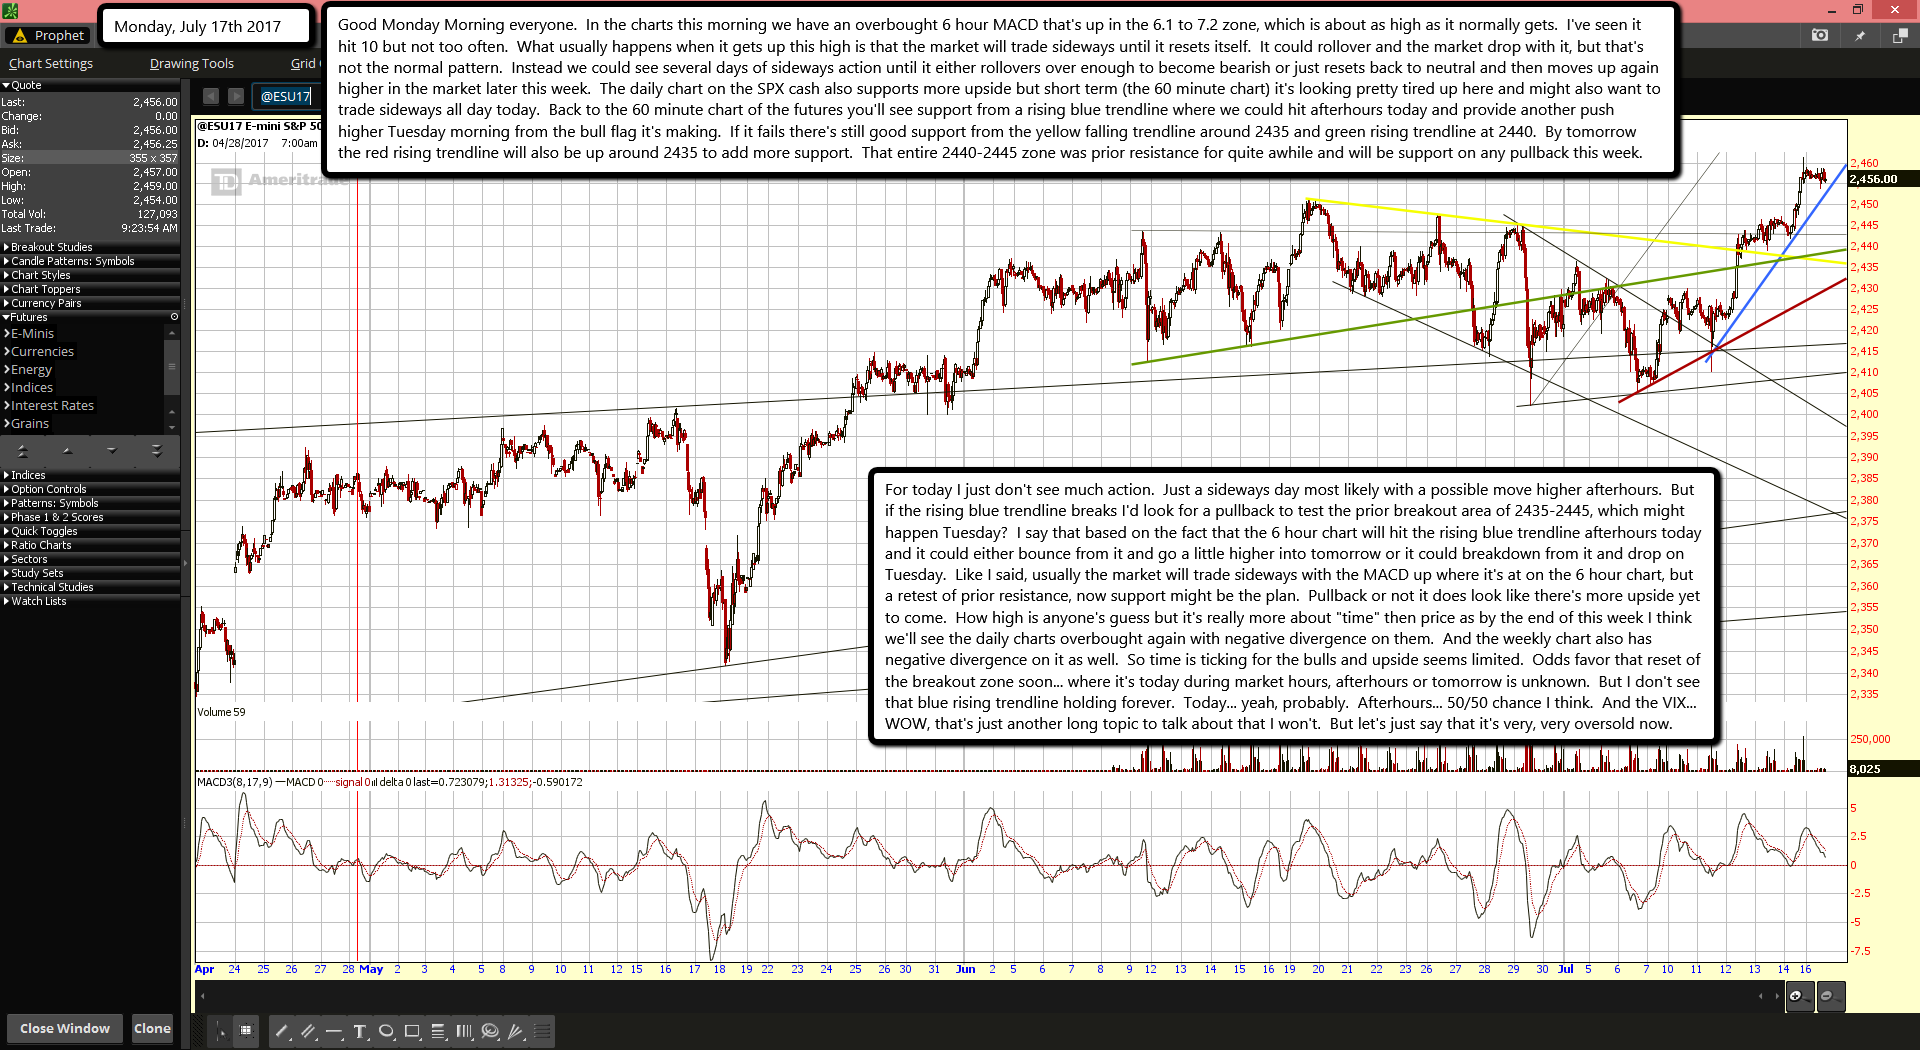
Good Monday Morning everyone.  In the charts this morning we have an overbought 6 hour MACD that's up in the 6.1 to 7.2 zone, which is about as high as it normally gets.  I've seen it hit 10 but not too often.  What usually happens when it gets up this high is that the market will trade sideways until it resets itself.  It could rollover and the market drop with it, but that's not the normal pattern.  Instead we could see several days of sideways action until it either rollovers over enough to become bearish or just resets back to neutral and then moves up again higher in the market later this week.  The daily chart on the SPX cash also supports more upside but short term (the 60 minute chart) it's looking pretty tired up here and might also want to trade sideways all day today.  Back to the 60 minute chart of the futures you'll see support from a rising blue trendline where we could hit afterhours today and provide another push higher Tuesday morning from the bull flag it's making.  If it fails there's still good support from the yellow falling trendline around 2435 and green rising trendline at 2440.  By tomorrow the red rising trendline will also be up around 2435 to add more support.  That entire 2440-2445 zone was prior resistance for quite awhile and will be support on any pullback this week.

For today I just don't see much action.  Just a sideways day most likely with a possible move higher afterhours.  But if the rising blue trendline breaks I'd look for a pullback to test the prior breakout area of 2435-2445, which might happen Tuesday?  I say that based on the fact that the 6 hour chart will hit the rising blue trendline afterhours today and it could either bounce from it and go a little higher into tomorrow or it could breakdown from it and drop on Tuesday.  Like I said, usually the market will trade sideways with the MACD up where it's at on the 6 hour chart, but a retest of prior resistance, now support might be the plan.  Pullback or not it does look like there's more upside yet to come.  How high is anyone's guess but it's really more about "time" then price as by the end of this week I think we'll see the daily charts overbought again with negative divergence on them.  And the weekly chart also has negative divergence on it as well.  So time is ticking for the bulls and upside seems limited.  Odds favor that reset of the breakout zone soon... where it's today during market hours, afterhours or tomorrow is unknown.  But I don't see that blue rising trendline holding forever.  Today... yeah, probably.  Afterhours... 50/50 chance I think.  And the VIX... WOW, that's just another long topic to talk about that I won't.  But let's just say that it's very, very oversold now.

IMF’s Lagarde doesn’t rule out another global financial crisis

0
IMF’s Lagarde doesn’t rule out another global financial crisis

Another financial crisis is still possible, according to International Monetary Chief Christine Lagarde. She was commenting on a statement by US Federal Reserve Chair Janet Yellen, who predicted she would not see another financial crisis in her lifetime.

A specialist trader works at his post on the floor of the New York Stock Exchange © Brendan McDermid

"There may, one day, be another crisis. I plan on having a long life, and I hope she (Yellen) does, too, so I wouldn't absolutely bet on that because there are cycles that we have seen over the past decade and I wouldn't exclude that,” Lagarde told CNBC on Tuesday.

She said that crises are usually unpredictable and come unexpectedly.

"Where it will come from, what form it takes, how international and broad-based it will be is to be seen, and typically the crisis never comes from where we expect it," Lagarde said.

"Our duty … is to make sure that your financial sector is under good supervision, that it's well regulated, that the institutions are rock-solid, and anticipate at home with enough buffers so that you can resist the potential crisis," she added.

The previous global financial crisis took place in 2007-2008 and is considered the biggest economic downturn since the Great Depression.

It happened after the crash in the US housing market, and massive amounts of mortgage-backed securities and derivatives lost significant value. In the US alone, more than 7.5 million people lost their jobs. According to estimates, American households lost roughly $16 trillion in net worth as a result of the stock market plunge.

ES Morning Update July 14th 2017

0

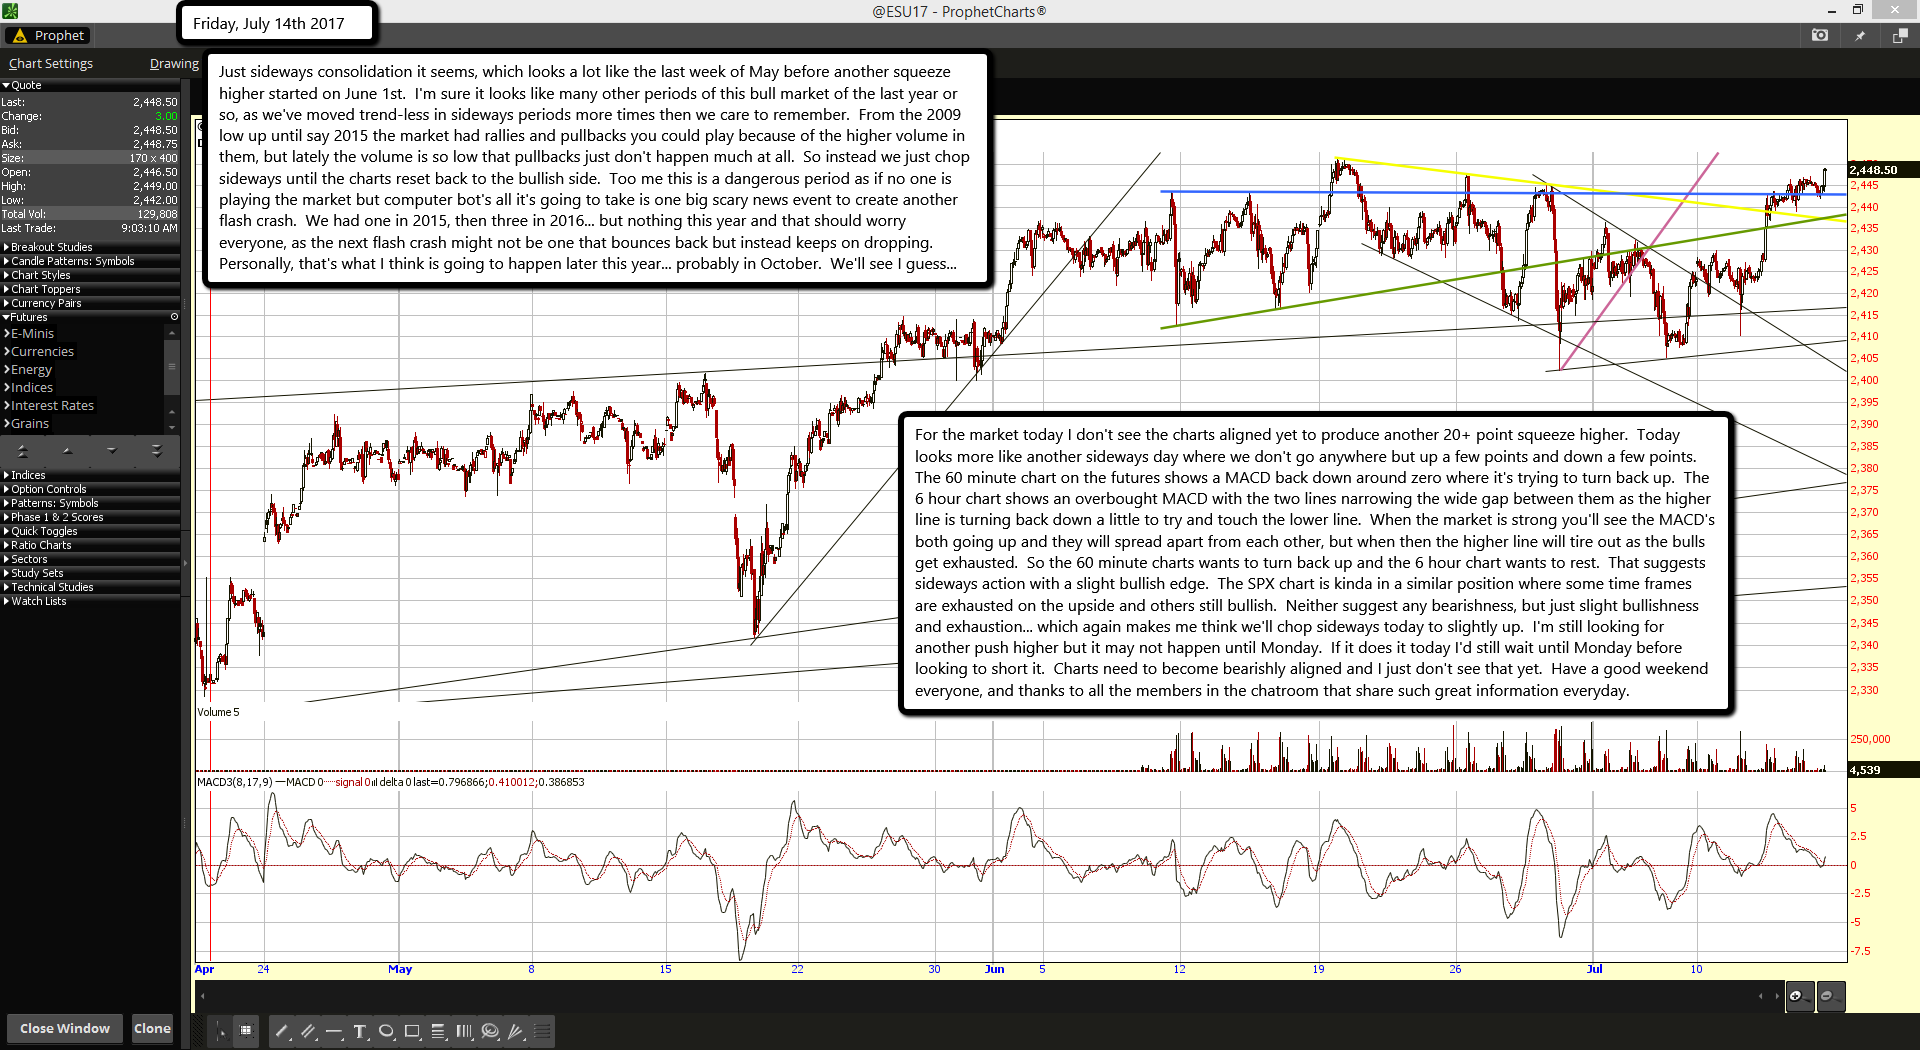
Just sideways consolidation it seems, which looks a lot like the last week of May before another squeeze higher started on June 1st.  I'm sure it looks like many other periods of this bull market of the last year or so, as we've moved trend-less in sideways periods more times then we care to remember.  From the 2009 low up until say 2015 the market had rallies and pullbacks you could play because of the higher volume in them, but lately the volume is so low that pullbacks just don't happen much at all.  So instead we just chop sideways until the charts reset back to the bullish side.  Too me this is a dangerous period as if no one is playing the market but computer bot's all it's going to take is one big scary news event to create another flash crash.  We had one in 2015, then three in 2016... but nothing this year and that should worry everyone, as the next flash crash might not be one that bounces back but instead keeps on dropping.  Personally, that's what I think is going to happen later this year... probably in October.  We'll see I guess...

For the market today I don't see the charts aligned yet to produce another 20+ point squeeze higher.  Today looks more like another sideways day where we don't go anywhere but up a few points and down a few points.  The 60 minute chart on the futures shows a MACD back down around zero where it's trying to turn back up.  The 6 hour chart shows an overbought MACD with the two lines narrowing the wide gap between them as the higher line is turning back down a little to try and touch the lower line.  When the market is strong you'll see the MACD's both going up and they will spread apart from each other, but when then the higher line will tire out as the bulls get exhausted.  So the 60 minute charts wants to turn back up and the 6 hour chart wants to rest.  That suggests sideways action with a slight bullish edge.  The SPX chart is kinda in a similar position where some time frames are exhausted on the upside and others still bullish.  Neither suggest any bearishness, but just slight bullishness and exhaustion... which again makes me think we'll chop sideways today to slightly up.  I'm still looking for another push higher but it may not happen until Monday.  If it does it today I'd still wait until Monday before looking to short it.  Charts need to become bearishly aligned and I just don't see that yet.  Have a good weekend everyone, and thanks to all the members in the chatroom that share such great information everyday.

ES Morning Update July 13th 2017

0

Yesterday I thought the falling yellow trendline would hold the bulls back and that we'd stay inside the triangle, but the bulls pushed through and formed a base from sideways consolidation all day just under the blue horizontal trendline.  Afterhours they pushed through it as well but fell back below it this premarket morning.  Odds are good that area will hold the bulls back today and I'd say most all of the bears have been squeezed out now.  The key for the bulls will be for them to hold this new support long enough to reset the overbought charts so they can push on up again and make a new all time high.

Now for the bears time is ticking as they longer the bulls consolidate the better odds that they will get not only the short term charts reset back to bullish but the daily chart oversold enough that it will turn back up strongly as well... and that should lead to another strong move up with new all time highs of course.  Bears really need the bulls to push up here again today and make that new high on some exhuast move that just barely gets over that 2450 high by a point or so.  Bulls should drop back some today (small) and close negative to rest up their overbought charts (maybe do the same on Friday?) and make a much strong run up all next week.  Then they could shoot for 2500 if they want (but I think it will fall short a little).

My thoughts and plans... for today I'd just watch as I think it's just a setup day for Friday or Monday.  Moving up today and barely putting in a new all time high would be a short but I'd really NOT like to see that happen as I'd prefer a move up of 10-30 points over the current high to hit all the stops over the current 2450 all time high.  Ideally we pullback a little and close down a few points and then make that stronger rally up on Friday and/or Monday to get close to 2500 but probably not hit it.  Maybe it stops at 2477.75 or something like that?  It's a nice ritual set of numbers for the magical number 7 that good ol' Christine Lagarde spoke of several years back in that creep speach she did.  And triple 7's was on the train in the movie "Unstoppable" in 2010.  If it doesn't show up in the ES Futures maybe some number show up in the SPX Cash Index, or the DOW, Russell or Nasdaq... but I do think we'll see some kind of "numbers" to tell us the top is in.

Extra thoughts... this top could very well be the final top before a 2-3 year bear market starts.  I've been getting many clues over the last few months that we'll top out this year and start the bear market this fall versus what I was thinking earlier this year that we'd top out in 2018 or even 2019.  I now believe the bull market from 2009 ends this summer and a 50%+ bear market is going to start later this year.  So this top will be very important and should have ritual numbers in it.  Please look at the open, close, intraday high and low of every index and contact me if you see something weird as I could miss it.  By the way, next Monday is 07/17/17 which has three 7's in it.  That alone could be the signal from the train movie in 2010 and Lagarde's speech?  Anyway, I'll be looking to go mega short when I see this final top as even if there's a higher high next year and I'm wrong about the bear market there's still very strong odds that this coming high will produce a large drop over the coming months.

ES Morning Update July 12th 2017

0

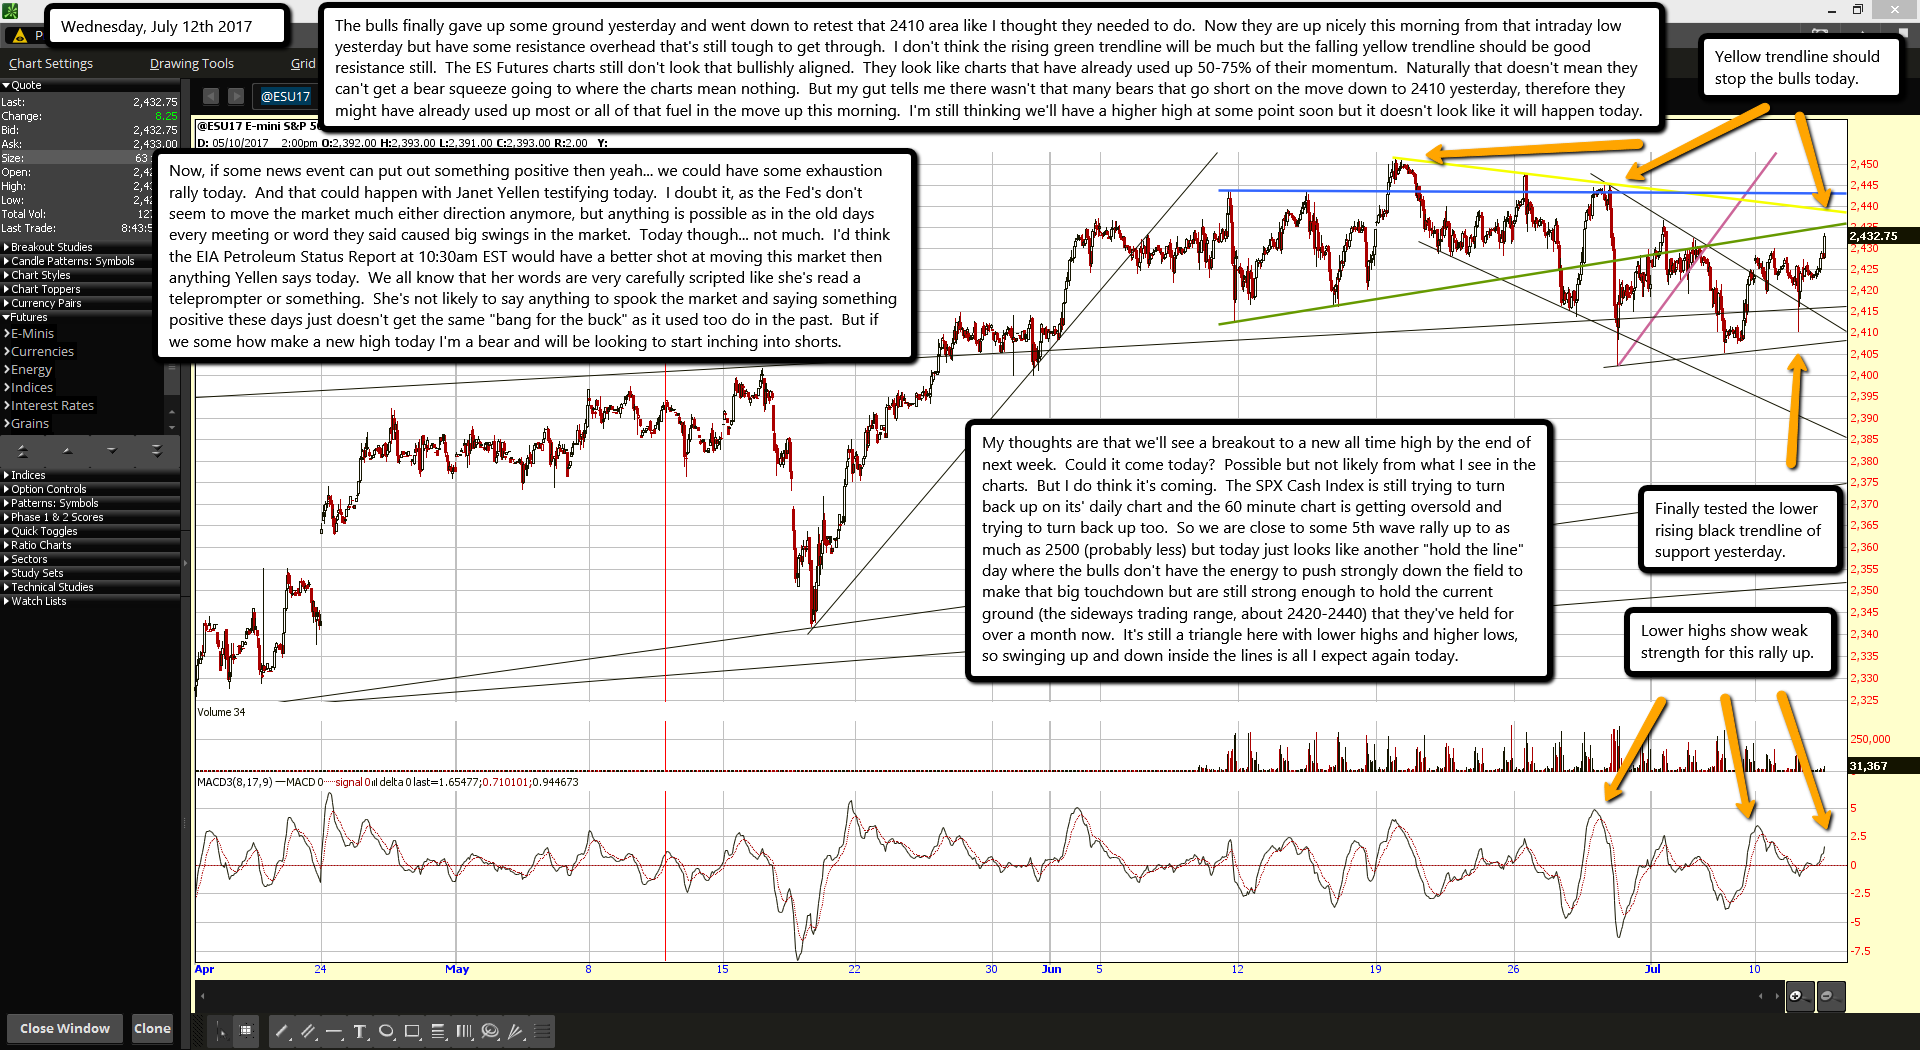
The bulls finally gave up some ground yesterday and went down to retest that 2410 area like I thought they needed to do.  Now they are up nicely this morning from that intraday low yesterday but have some resistance overhead that's still tough to get through.  I don't think the rising green trendline will be much but the falling yellow trendline should be good resistance still.  The ES Futures charts still don't look that bullishly aligned.  They look like charts that have already used up 50-75% of their momentum.  Naturally that doesn't mean they can't get a bear squeeze going to where the charts mean nothing.  But my gut tells me there wasn't that many bears that go short on the move down to 2410 yesterday, therefore they might have already used up most or all of that fuel in the move up this morning.  I'm still thinking we'll have a higher high at some point soon but it doesn't look like it will happen today.

Now, if some news event can put out something positive then yeah... we could have some exhaustion rally today.  And that could happen with Janet Yellen testifying today.  I doubt it, as the Fed's don't seem to move the market much either direction anymore, but anything is possible as in the old days every meeting or word they said caused big swings in the market.  Today though... not much.  I'd think the EIA Petroleum Status Report at 10:30am EST would have a better shot at moving this market then anything Yellen says today.  We all know that her words are very carefully scripted like she's read a teleprompter or something.  She's not likely to say anything to spook the market and saying something positive these days just doesn't get the same "bang for the buck" as it used too do in the past.  But if we some how make a new high today I'm a bear and will be looking to start inching into shorts.

My thoughts are that we'll see a breakout to a new all time high by the end of next week.  Could it come today?  Possible but not likely from what I see in the charts.  But I do think it's coming.  The SPX Cash Index is still trying to turn back up on its' daily chart and the 60 minute chart is getting oversold and trying to turn back up too.  So we are close to some 5th wave rally up to as much as 2500 (probably less) but today just looks like another "hold the line" day where the bulls don't have the energy to push strongly down the field to make that big touchdown but are still strong enough to hold the current ground (the sideways trading range, about 2420-2440) that they've held for over a month now.  It's still a triangle here with lower highs and higher lows, so swinging up and down inside the lines is all I expect again today.

ES Morning Update July 11th 2017

0

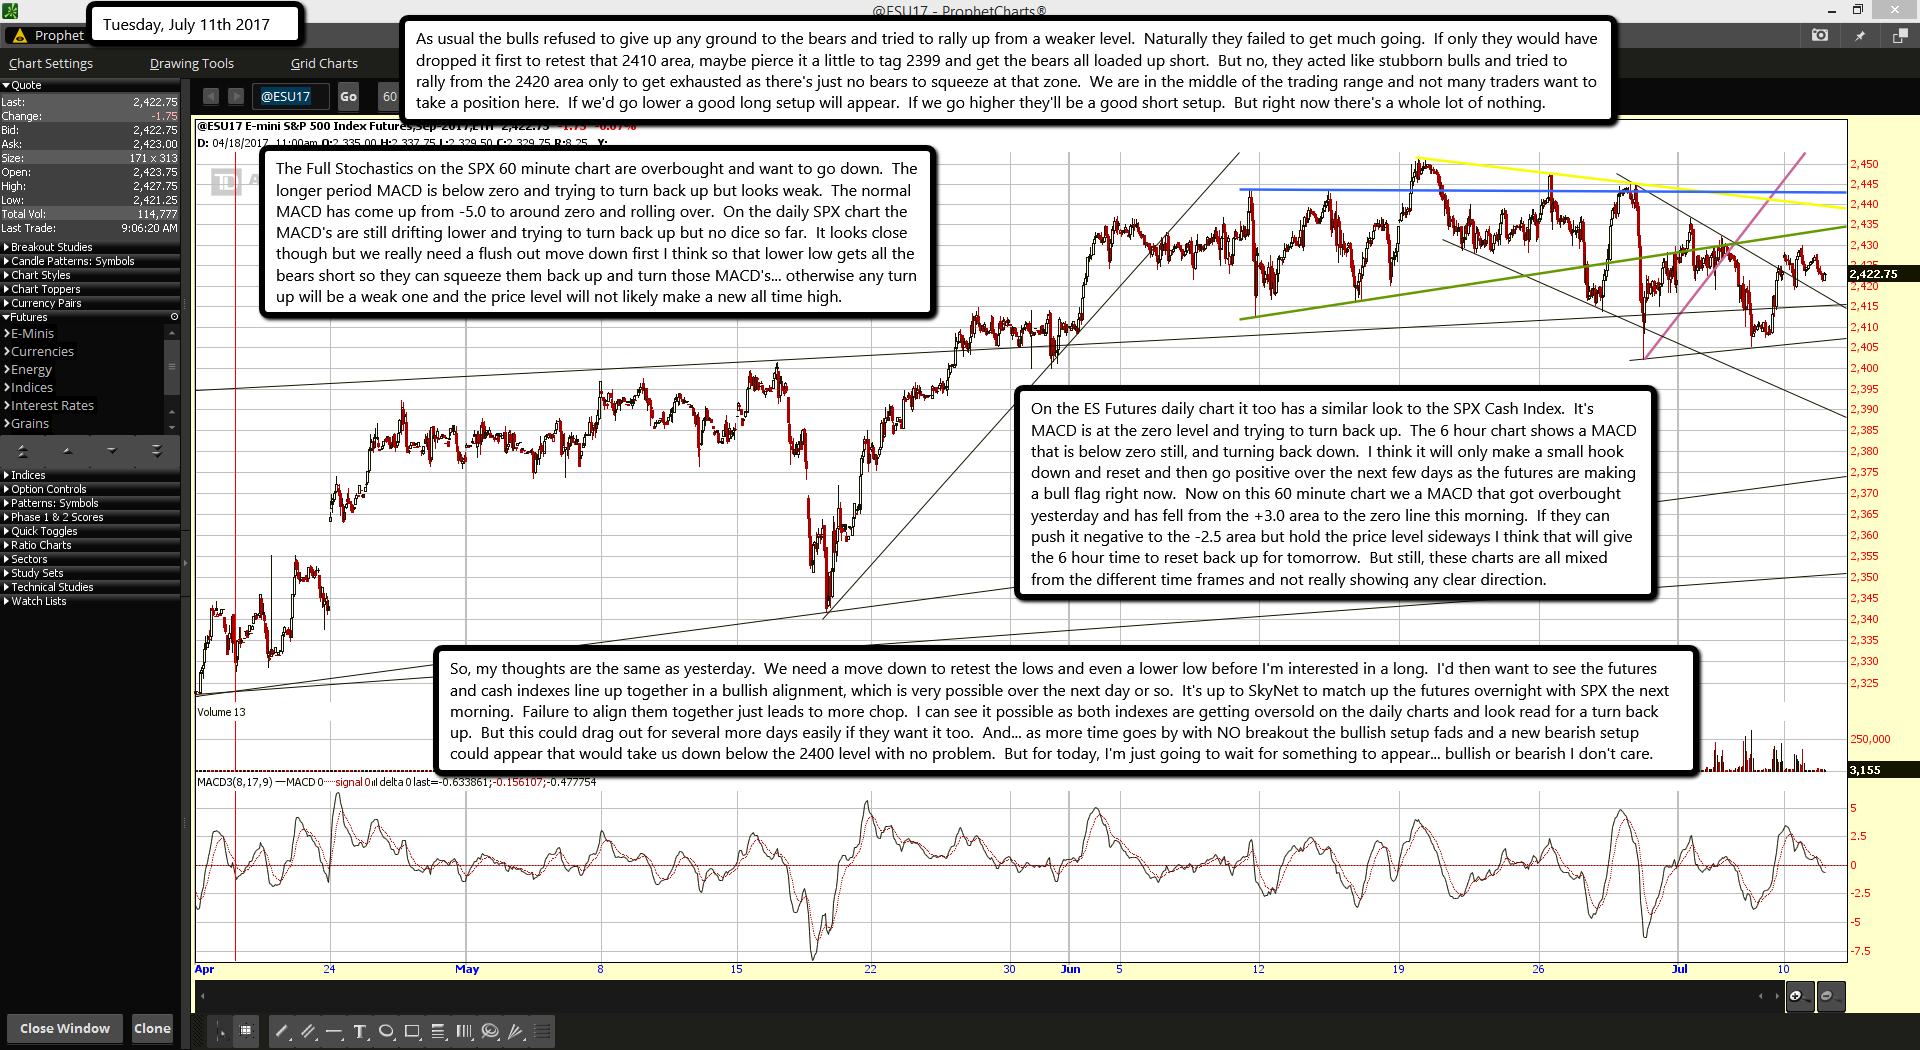
As usual the bulls refused to give up any ground to the bears and tried to rally up from a weaker level.  Naturally they failed to get much going.  If only they would have dropped it first to retest that 2410 area, maybe pierce it a little to tag 2399 and get the bears all loaded up short.  But no, they acted like stubborn bulls and tried to rally from the 2420 area only to get exhausted as there's just no bears to squeeze at that zone.  We are in the middle of the trading range and not many traders want to take a position here.  If we'd go lower a good long setup will appear.  If we go higher they'll be a good short setup.  But right now there's a whole lot of nothing.

The Full Stochastics on the SPX 60 minute chart are overbought and want to go down.  The longer period MACD is below zero and trying to turn back up but looks weak.  The normal MACD has come up from -5.0 to around zero and rolling over.  On the daily SPX chart the MACD's are still drifting lower and trying to turn back up but no dice so far.  It looks close though but we really need a flush out move down first I think so that lower low gets all the bears short so they can squeeze them back up and turn those MACD's... otherwise any turn up will be a weak one and the price level will not likely make a new all time high.

On the ES Futures daily chart it too has a similar look to the SPX Cash Index.  It's MACD is at the zero level and trying to turn back up.  The 6 hour chart shows a MACD that is below zero still, and turning back down.  I think it will only make a small hook down and reset and then go positive over the next few days as the futures are making a bull flag right now.  Now on this 60 minute chart we a MACD that got overbought yesterday and has fell from the +3.0 area to the zero line this morning.  If they can push it negative to the -2.5 area but hold the price level sideways I think that will give the 6 hour time to reset back up for tomorrow.  But still, these charts are all mixed from the different time frames and not really showing any clear direction.

So, my thoughts are the same as yesterday.  We need a move down to retest the lows and even a lower low before I'm interested in a long.  I'd then want to see the futures and cash indexes line up together in a bullish alignment, which is very possible over the next day or so.  It's up to SkyNet to match up the futures overnight with SPX the next morning.  Failure to align them together just leads to more chop.  I can see it possible as both indexes are getting oversold on the daily charts and look read for a turn back up.  But this could drag out for several more days easily if they want it too.  And... as more time goes by with NO breakout the bullish setup fads and a new bearish setup could appear that would take us down below the 2400 level with no problem.  But for today, I'm just going to wait for something to appear... bullish or bearish I don't care.

The Economist: World Currency By Jan. 9, 2018

0

Get Ready for the Phoenix
January 9, 1988, Vol. 306, pp 9-10

THIRTY years from now, Americans, Japanese, Europeans, and people in many other rich countries, and some relatively poor ones will probably be paying for their shopping with the same currency. Prices will be quoted not in dollars, yen or D-marks but in, let’s say, the phoenix. The phoenix will be favored by companies and shoppers because it will be more convenient than today’s national currencies, which by then will seem a quaint cause of much disruption to economic life in the last twentieth century.

At the beginning of 1988 this appears an outlandish prediction. Proposals for eventual monetary union proliferated five and ten years ago, but they hardly envisaged the setbacks of 1987. The governments of the big economies tried to move an inch or two towards a more managed system of exchange rates – a logical preliminary, it might seem, to radical monetary reform. For lack of co-operation in their underlying economic policies they bungled it horribly, and provoked the rise in interest rates that brought on the stock market crash of October. These events have chastened exchange-rate reformers. The market crash taught them that the pretense of policy co-operation can be worse than nothing, and that until real co-operation is feasible (i.e., until governments surrender some economic sovereignty) further attempts to peg currencies will flounder.

The new world economy
The biggest change in the world economy since the early 1970’s is that flows of money have replaced trade in goods as the force that drives exchange rates. as a result of the relentless integration of the world’s financial markets, differences in national economic policies can disturb interest rates (or expectations of future interest rates) only slightly, yet still call forth huge transfers of financial assets from one country to another. These transfers swamp the flow of trade revenues in their effect on the demand and supply for different currencies, and hence in their effect on exchange rates. As telecommunications technology continues to advance, these transactions will be cheaper and faster still. With uncoordinated economic policies, currencies can get only more volatile.
….
In all these ways national economic boundaries are slowly dissolving. As the trend continues, the appeal of a currency union across at least the main industrial countries will seem irresistible to everybody except foreign-exchange traders and governments. In the phoenix zone, economic adjustment to shifts in relative prices would happen smoothly and automatically, rather as it does today between different regions within large economies (a brief on pages 74-75 explains how.) The absence of all currency risk would spur trade, investment and employment.

The phoenix zone would impose tight constraints on national governments. There would be no such thing, for instance, as a national monetary policy. The world phoenix supply would be fixed by a new central bank, descended perhaps from the IMF. The world inflation rate – and hence, within narrow margins, each national inflation rate- would be in its charge. Each country could use taxes and public spending to offset temporary falls in demand, but it would have to borrow rather than print money to finance its budget deficit. With no recourse to the inflation tax, governments and their creditors would be forced to judge their borrowing and lending plans more carefully than they do today. This means a big loss of economic sovereignty, but the trends that make the phoenix so appealing are taking that sovereignty away in any case. Even in a world of more-or-less floating exchange rates, individual governments have seen their policy independence checked by an unfriendly outside world.

As the next century approaches, the natural forces that are pushing the world towards economic integration will offer governments a broad choice. They can go with the flow, or they can build barricades. Preparing the way for the phoenix will mean fewer pretended agreements on policy and more real ones. It will mean allowing and then actively promoting the private-sector use of an international money alongside existing national monies. That would let people vote with their wallets for the eventual move to full currency union. The phoenix would probably start as a cocktail of national currencies, just as the Special Drawing Right is today. In time, though, its value against national currencies would cease to matter, because people would choose it for its convenience and the stability of its purchasing power.
…..
The alternative – to preserve policy making autonomy- would involve a new proliferation of truly draconian controls on trade and capital flows. This course offers governments a splendid time. They could manage exchange-rate movements, deploy monetary and fiscal policy without inhibition, and tackle the resulting bursts of inflation with prices and incomes polices. It is a growth-crippling prospect. Pencil in the phoenix for around 2018, and welcome it when it comes.

Just to be clear: This is NOT fākenews. It is an article from The Economist published 29 years and six months ago, today.  We are counting down the minutes.


Red's NOTE's:

In my humble opinion this "New World Currency" forecast is still on track to happen in the year 2018, which also tells me that we are going to start down this year... like in the fall of 2017, as you MUST first crash the current system (the stock market and the dollar) in order to get the people to accept the new currency.

History proves that to be a fact as in 1929 when the stock market peaked and later bottomed in 1932 we had Gold Coins that were one ounce each and valued at $20.00 per coin.  Those coins each could have been bought for one Twenty Dollar Bill.  Then shortly after the bottom of the stock market in 1933 president Roosevelt resets the value of Gold.

Here's the complete story from the History Channel website.

FDR takes United States off gold standard - Jun 05, 1933

On June 5, 1933, the United States went off the gold standard, a monetary system in which currency is backed by gold, when Congress enacted a joint resolution nullifying the right of creditors to demand payment in gold. The United States had been on a gold standard since 1879, except for an embargo on gold exports during World War I, but bank failures during the Great Depression of the 1930s frightened the public into hoarding gold, making the policy untenable.

Soon after taking office in March 1933, Roosevelt declared a nationwide bank moratorium in order to prevent a run on the banks by consumers lacking confidence in the economy. He also forbade banks to pay out gold or to export it. According to Keynesian economic theory, one of the best ways to fight off an economic downturn is to inflate the money supply. And increasing the amount of gold held by the Federal Reserve would in turn increase its power to inflate the money supply. Facing similar pressures, Britain had dropped the gold standard in 1931, and Roosevelt had taken note.

On April 5, 1933, Roosevelt ordered all gold coins and gold certificates in denominations of more than $100 turned in for other money. It required all persons to deliver all gold coin, gold bullion and gold certificates owned by them to the Federal Reserve by May 1 for the set price of $20.67 per ounce. By May 10, the government had taken in $300 million of gold coin and $470 million of gold certificates. Two months later, a joint resolution of Congress abrogated the gold clauses in many public and private obligations that required the debtor to repay the creditor in gold dollars of the same weight and fineness as those borrowed. In 1934, the government price of gold was increased to $35 per ounce, effectively increasing the gold on the Federal Reserve’s balance sheets by 69 percent. This increase in assets allowed the Federal Reserve to further inflate the money supply.

The government held the $35 per ounce price until August 15, 1971, when President Richard Nixon announced that the United States would no longer convert dollars to gold at a fixed value, thus completely abandoning the gold standard. In 1974, President Gerald Ford signed legislation that permitted Americans again to own gold bullion.

Now... you tell me?  Do you think it couldn't happen again?  I certainly think it can and WILL happen again.  First you crash gold with the stock market crashing.  Then you reset it's value with some bank closure and reopen later with some insane new price for it.  And then it screams higher in a huge rally over then next few years to create a new bubble.

Red


s2Member®