Wednesday, August 26, 2026
Home Blog Page 58

ES Morning Update August 22nd 2017

0

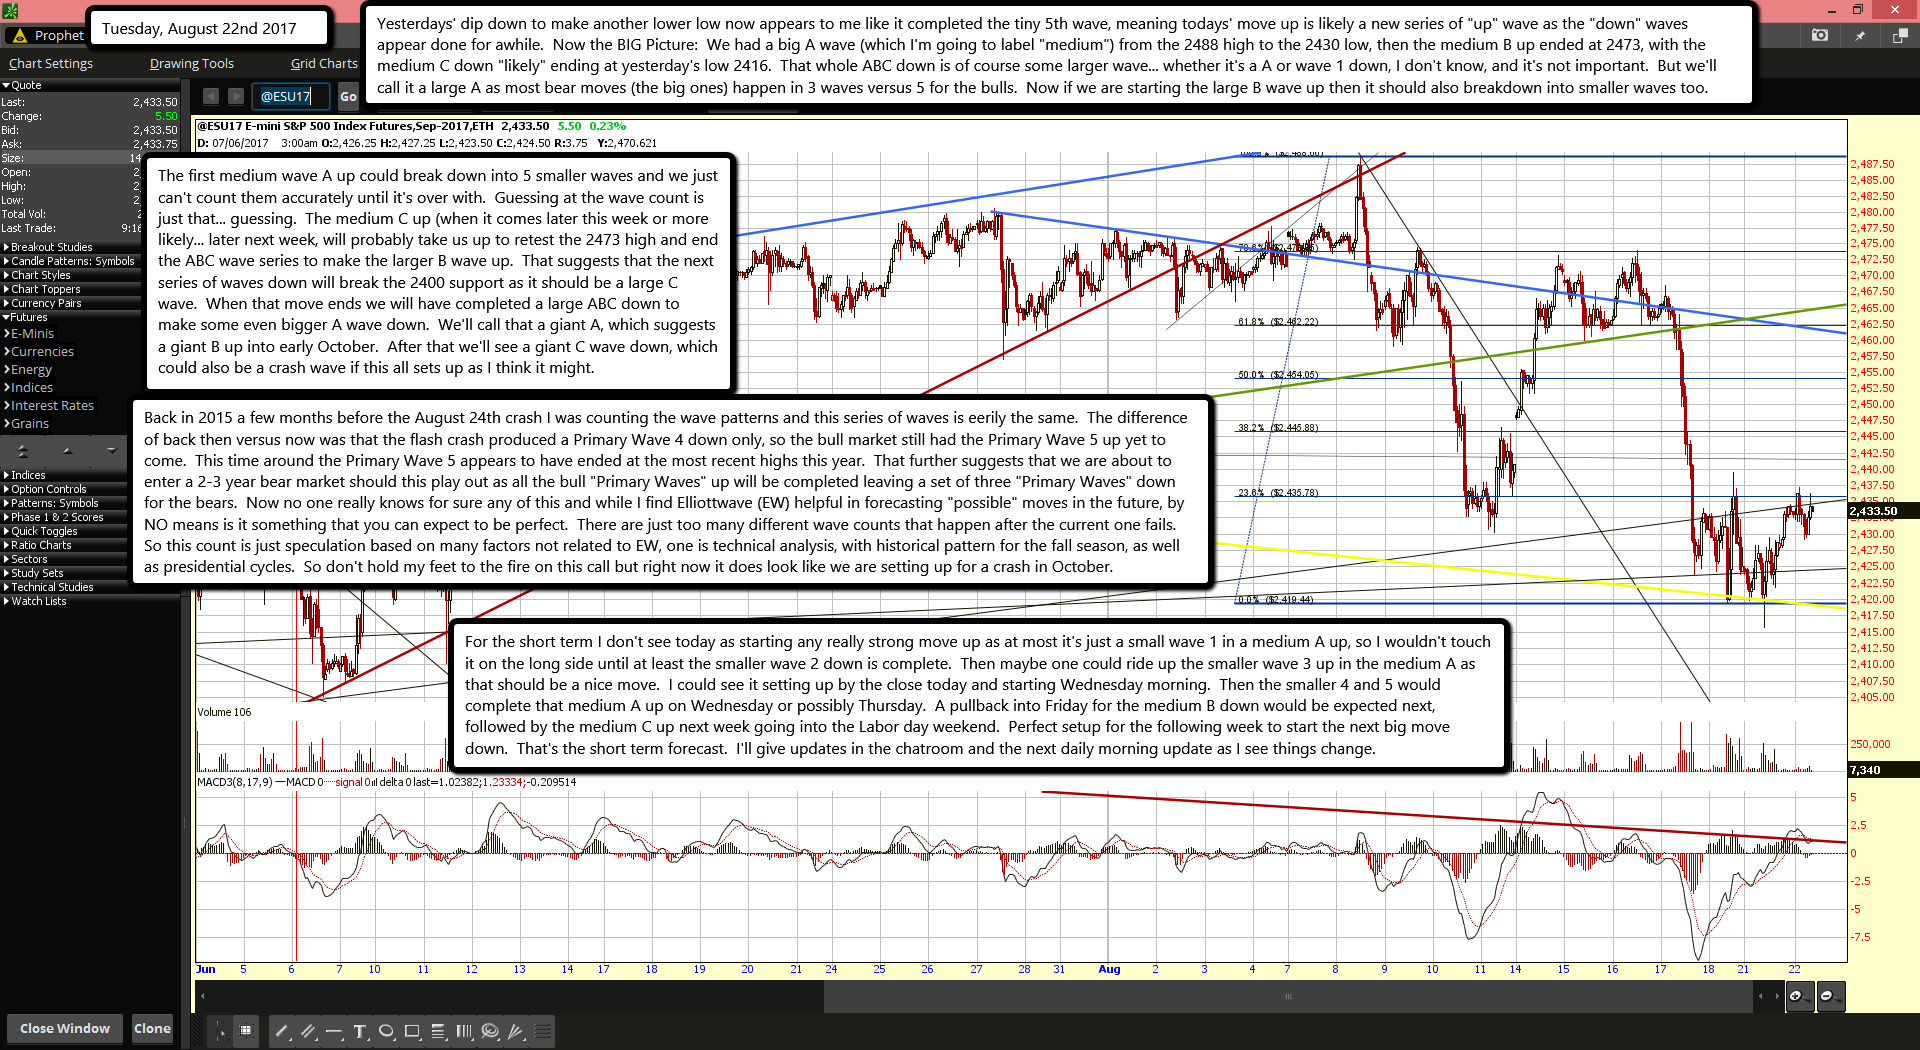
Yesterdays' dip down to make another lower low now appears to me like it completed the tiny 5th wave, meaning todays' move up is likely a new series of "up" wave as the "down" waves appear done for awhile.  Now the BIG Picture:  We had a big A wave (which I'm going to label "medium") from the 2488 high to the 2430 low, then the medium B up ended at 2473, with the medium C down "likely" ending at yesterday's low 2416.  That whole ABC down is of course some larger wave... whether it's a A or wave 1 down, I don't know, and it's not important.  But we'll call it a large A as most bear moves (the big ones) happen in 3 waves versus 5 for the bulls.  Now if we are starting the large B wave up then it should also breakdown into smaller waves too.

The first medium wave A up could break down into 5 smaller waves and we just can't count them accurately until it's over with.  Guessing at the wave count is just that... guessing.  The medium C up (when it comes later this week or more likely... later next week, will probably take us up to retest the 2473 high and end the ABC wave series to make the larger B wave up.  That suggests that the next series of waves down will break the 2400 support as it should be a large C wave.  When that move ends we will have completed a large ABC down to make some even bigger A wave down.  We'll call that a giant A, which suggests a giant B up into early October.  After that we'll see a giant C wave down, which could also be a crash wave if this all sets up as I think it might.

Back in 2015 a few months before the August 24th crash I was counting the wave patterns and this series of waves is eerily the same.  The difference of back then versus now was that the flash crash produced a Primary Wave 4 down only, so the bull market still had the Primary Wave 5 up yet to come.  This time around the Primary Wave 5 appears to have ended at the most recent highs this year.  That further suggests that we are about to enter a 2-3 year bear market should this play out as all the bull "Primary Waves" up will be completed leaving a set of three "Primary Waves" down for the bears.  Now no one really knows for sure any of this and while I find Elliottwave (EW) helpful in forecasting "possible" moves in the future, by NO means is it something that you can expect to be perfect.  There are just too many different wave counts that happen after the current one fails.  So this count is just speculation based on many factors not related to EW, one is technical analysis, with historical pattern for the fall season, as well as presidential cycles.  So don't hold my feet to the fire on this call but right now it does look like we are setting up for a crash in October.

For the short term I don't see today as starting any really strong move up as at most it's just a small wave 1 in a medium A up, so I wouldn't touch it on the long side until at least the smaller wave 2 down is complete.  Then maybe one could ride up the smaller wave 3 up in the medium A as that should be a nice move.  I could see it setting up by the close today and starting Wednesday morning.  Then the smaller 4 and 5 would complete that medium A up on Wednesday or possibly Thursday.  A pullback into Friday for the medium B down would be expected next, followed by the medium C up next week going into the Labor day weekend.  Perfect setup for the following week to start the next big move down.  That's the short term forecast.  I'll give updates in the chatroom and the next daily morning update as I see things change.

PS:  Here's the image of the wave count I did right before the August 24th, 2015 flash crash

You'll notice that I only forecasted a move down to about 2002.11 for the C wave (aka, the "crash" wave), which was obviously too conservative as the actually low that followed was 1867 SPX.

Back then I also had "passport codes" pointing to August 24th, 2015... which I only talk about now in the chatroom.  And yes, I have another code for this October.

Soros continues betting against US stock market despite mounting losses

0

US regulatory filings show George Soros is still investing in options that will profit him only if the stock market they are linked to declines in value.

Soros Fund Management held put options on PowerShares QQQ Trust, SPDR S&P 500 ETF, iShares Russell 2000 ETF as of June 30. Each is an exchange-traded fund that tracks a broad US stock market index. The bet is worth $1.8 billion. Soros stands to profit only if the stock market falls.

Michael Vachon, a spokesman for Soros Fund Management, said the company would not comment on the filing.

Soros continues betting against US stock market despite mounting losses

In January, Soros said "it's impossible to predict" US President Donald Trump's actions, but he was nonetheless sure the market would plunge.

Soon after the election, Soros lost over $1 billion by taking a short position on the market. While Soros called Trump a "would-be dictator," and predicted uncertainty and a sell-off after his win, the markets have rallied significantly.

The US S&P500 index is up over 10 percent this year, the Nasdaq is up 18 percent, and Dow Jones is up over 11 percent.

Soros is best known for making a fortune on his short play against the British pound. On 16 September 1992, Soros' $10 billion short position on the pound forced the Bank of England to withdraw Sterling from the European Exchange Rate Mechanism (ERM) after it was unable to keep the currency above its agreed lower limit in the ERM.

ES Morning Update August 21st 2017

0

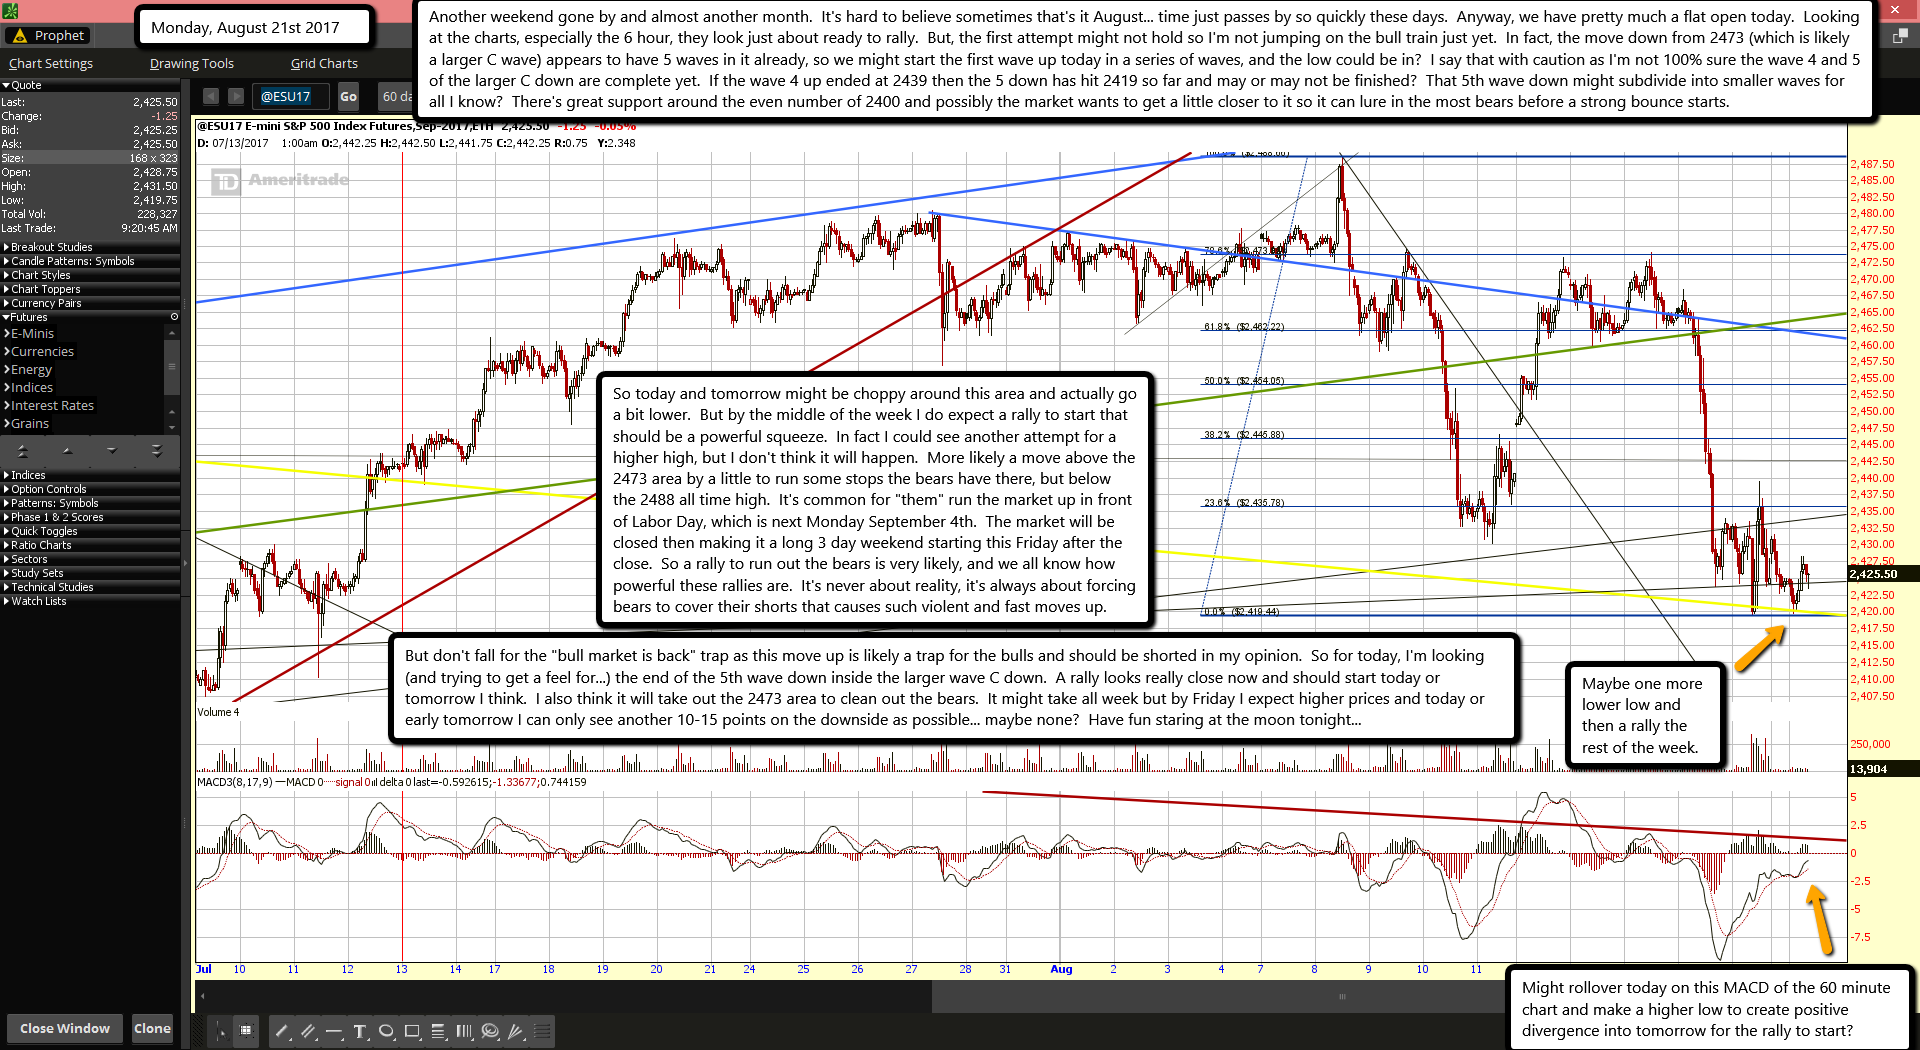
Another weekend gone by and almost another month.  It's hard to believe sometimes that's it August... time just passes by so quickly these days.  Anyway, we have pretty much a flat open today.  Looking at the charts, especially the 6 hour, they look just about ready to rally.  But, the first attempt might not hold so I'm not jumping on the bull train just yet.  In fact, the move down from 2473 (which is likely a larger C wave) appears to have 5 waves in it already, so we might start the first wave up today in a series of waves, and the low could be in?  I say that with caution as I'm not 100% sure the wave 4 and 5 of the larger C down are complete yet.  If the wave 4 up ended at 2439 then the 5 down has hit 2419 so far and may or may not be finished?  That 5th wave down might subdivide into smaller waves for all I know?  There's great support around the even number of 2400 and possibly the market wants to get a little closer to it so it can lure in the most bears before a strong bounce starts.

So today and tomorrow might be choppy around this area and actually go a bit lower.  But by the middle of the week I do expect a rally to start that should be a powerful squeeze.  In fact I could see another attempt for a higher high, but I don't think it will happen.  More likely a move above the 2473 area by a little to run some stops the bears have there, but below the 2488 all time high.  It's common for "them" run the market up in front of Labor Day, which is next Monday September 4th.  The market will be closed then making it a long 3 day weekend starting this Friday after the close.  So a rally to run out the bears is very likely, and we all know how powerful these rallies are.  It's never about reality, it's always about forcing bears to cover their shorts that causes such violent and fast moves up.

But don't fall for the "bull market is back" trap as this move up is likely a trap for the bulls and should be shorted in my opinion.  So for today, I'm looking (and trying to get a feel for...) the end of the 5th wave down inside the larger wave C down.  A rally looks really close now and should start today or tomorrow I think.  I also think it will take out the 2473 area to clean out the bears.  It might take all week but by Friday I expect higher prices and today or early tomorrow I can only see another 10-15 points on the downside as possible... maybe none?  Have fun staring at the moon tonight...

ES Morning Update August 18th 2017

0

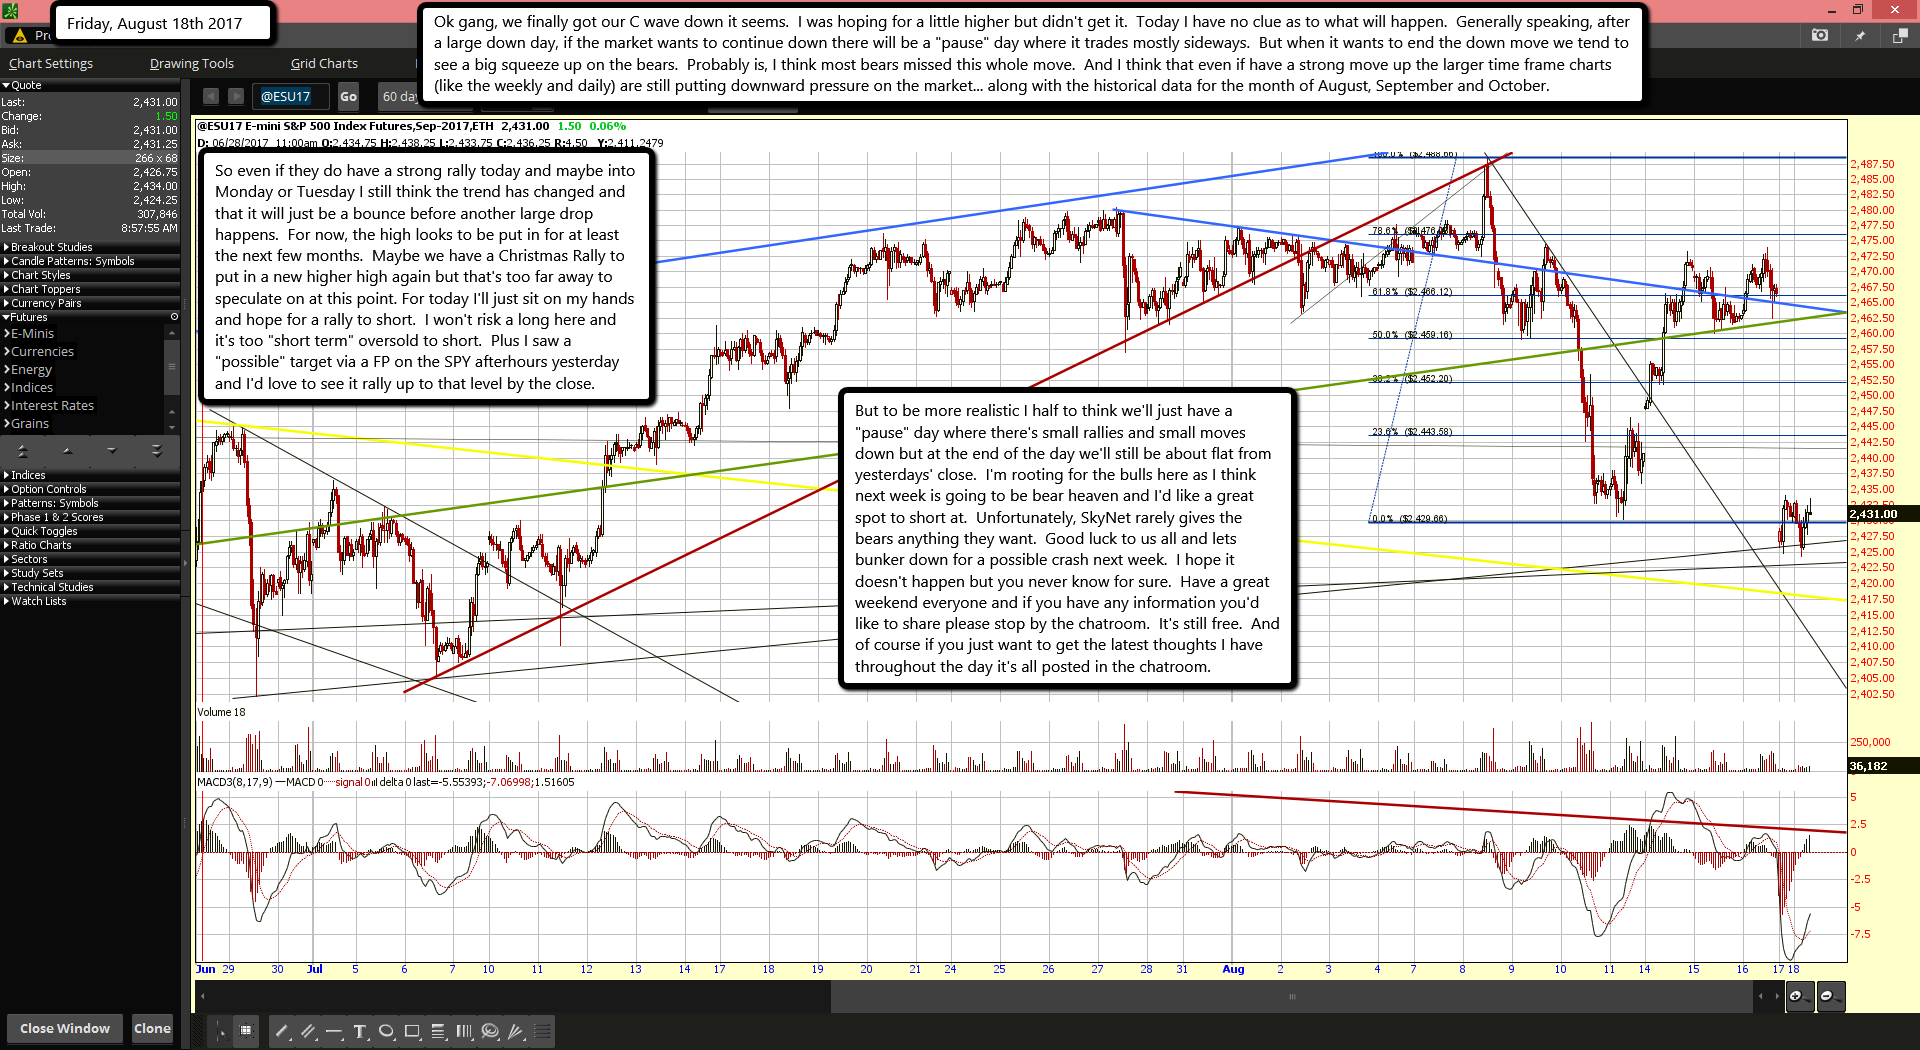
Ok gang, we finally got our C wave down it seems.  I was hoping for a little higher but didn't get it.  Today I have no clue as to what will happen.  Generally speaking, after a large down day, if the market wants to continue down there will be a "pause" day where it trades mostly sideways.  But when it wants to end the down move we tend to see a big squeeze up on the bears.  Probably is, I think most bears missed this whole move.  And I think that even if have a strong move up the larger time frame charts (like the weekly and daily) are still putting downward pressure on the market... along with the historical data for the month of August, September and October.

So even if they do have a strong rally today and maybe into Monday or Tuesday I still think the trend has changed and that it will just be a bounce before another large drop happens.  For now, the high looks to be put in for at least the next few months.  Maybe we have a Christmas Rally to put in a new higher high again but that's too far away to speculate on at this point. For today I'll just sit on my hands and hope for a rally to short.  I won't risk a long here and it's too "short term" oversold to short.  Plus I saw a "possible" target via a FP on the SPY afterhours yesterday and I'd love to see it rally up to that level by the close.

But to be more realistic I half to think we'll just have a "pause" day where there's small rallies and small moves down but at the end of the day we'll still be about flat from yesterdays' close.  I'm rooting for the bulls here as I think next week is going to be bear heaven and I'd like a great spot to short at.  Unfortunately, SkyNet rarely gives the bears anything they want.  Good luck to us all and lets bunker down for a possible crash next week.  I hope it doesn't happen but you never know for sure.  Have a great weekend everyone and if you have any information you'd like to share please stop by the chatroom.  It's still free.  And of course if you just want to get the latest thoughts I have throughout the day it's all posted in the chatroom.

ES Morning Update August 17th 2017

0

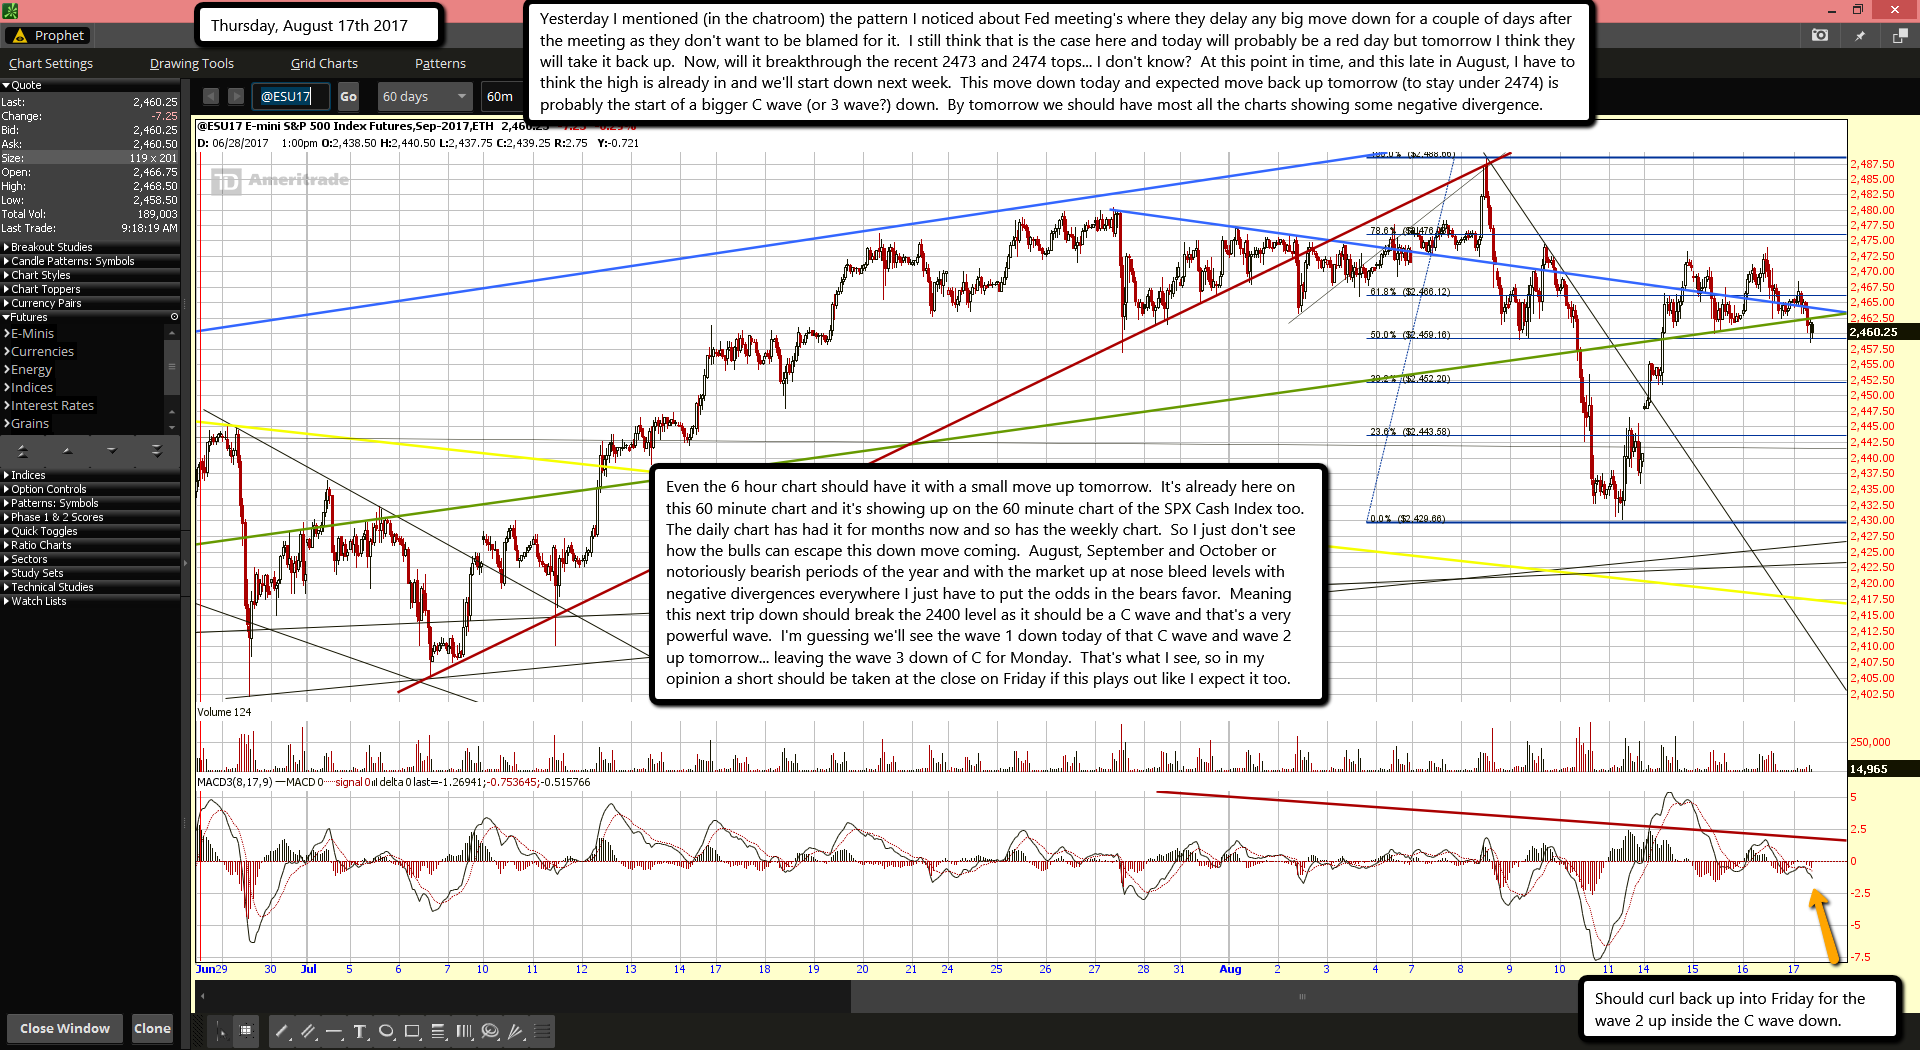
Yesterday I mentioned (in the chatroom) the pattern I noticed about Fed meeting's where they delay any big move down for a couple of days after the meeting as they don't want to be blamed for it.  I still think that is the case here and today will probably be a red day but tomorrow I think they will take it back up.  Now, will it breakthrough the recent 2473 and 2474 tops... I don't know?  At this point in time, and this late in August, I have to think the high is already in and we'll start down next week.  This move down today and expected move back up tomorrow (to stay under 2474) is probably the start of a bigger C wave (or 3 wave?) down.  By tomorrow we should have most all the charts showing some negative divergence.

Even the 6 hour chart should have it with a small move up tomorrow.  It's already here on this 60 minute chart and it's showing up on the 60 minute chart of the SPX Cash Index too.  The daily chart has had it for months now and so has the weekly chart.  So I just don't see how the bulls can escape this down move coming.  August, September and October or notoriously bearish periods of the year and with the market up at nose bleed levels with negative divergences everywhere I just have to put the odds in the bears favor.  Meaning this next trip down should break the 2400 level as it should be a C wave and that's a very powerful wave.  I'm guessing we'll see the wave 1 down today of that C wave and wave 2 up tomorrow... leaving the wave 3 down of C for Monday.  That's what I see, so in my opinion a short should be taken at the close on Friday if this plays out like I expect it too.

ES Morning Update August 16th 2017

0

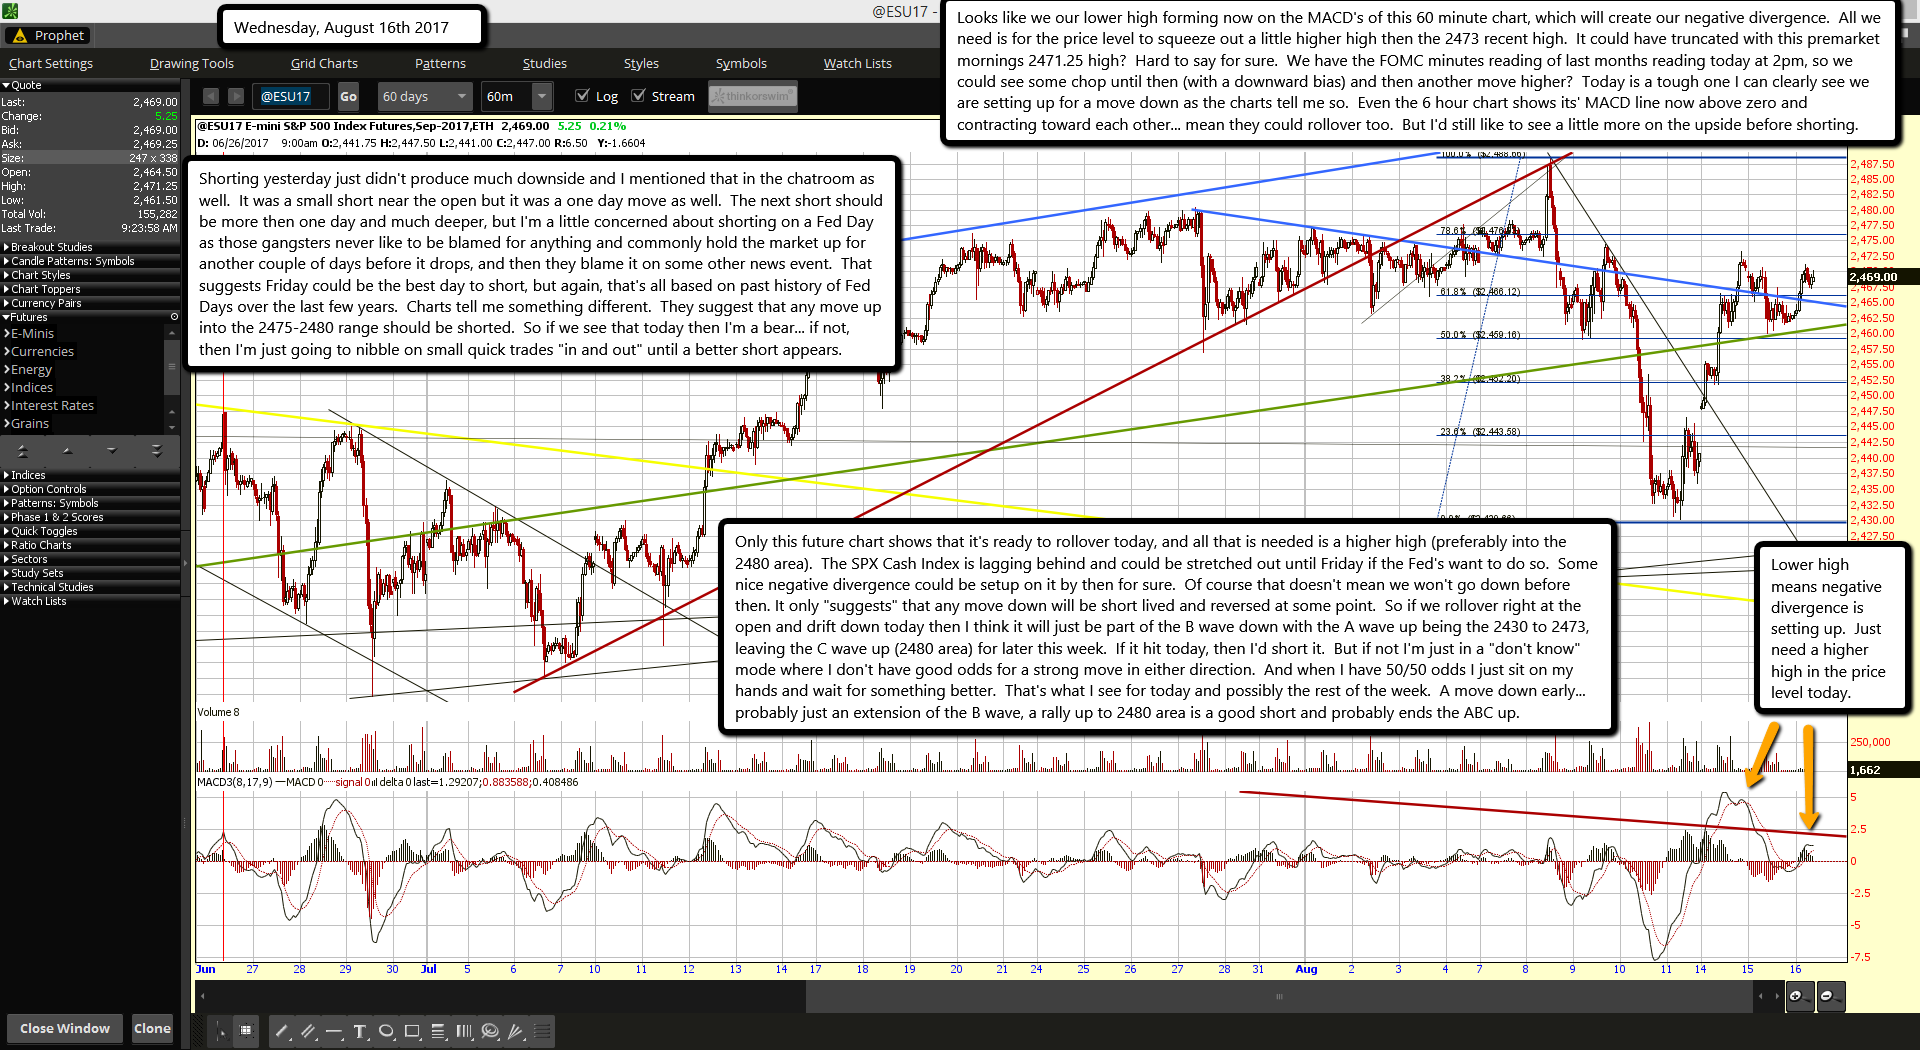
Looks like we our lower high forming now on the MACD's of this 60 minute chart, which will create our negative divergence.  All we need is for the price level to squeeze out a little higher high then the 2473 recent high.  It could have truncated with this premarket mornings 2471.25 high?  Hard to say for sure.  We have the FOMC minutes reading of last months reading today at 2pm, so we could see some chop until then (with a downward bias) and then another move higher?  Today is a tough one I can clearly see we are setting up for a move down as the charts tell me so.  Even the 6 hour chart shows its' MACD line now above zero and contracting toward each other... mean they could rollover too.  But I'd still like to see a little more on the upside before shorting.

Shorting yesterday just didn't produce much downside and I mentioned that in the chatroom as well.  It was a small short near the open but it was a one day move as well.  The next short should be more then one day and much deeper, but I'm a little concerned about shorting on a Fed Day as those gangsters never like to be blamed for anything and commonly hold the market up for another couple of days before it drops, and then they blame it on some other news event.  That suggests Friday could be the best day to short, but again, that's all based on past history of Fed Days over the last few years.  Charts tell me something different.  They suggest that any move up into the 2475-2480 range should be shorted.  So if we see that today then I'm a bear... if not, then I'm just going to nibble on small quick trades "in and out" until a better short appears.

Only this future chart shows that it's ready to rollover today, and all that is needed is a higher high (preferably into the 2480 area).  The SPX Cash Index is lagging behind and could be stretched out until Friday if the Fed's want to do so.  Some nice negative divergence could be setup on it by then for sure.  Of course that doesn't mean we won't go down before then. It only "suggests" that any move down will be short lived and reversed at some point.  So if we rollover right at the open and drift down today then I think it will just be part of the B wave down with the A wave up being the 2430 to 2473, leaving the C wave up (2480 area) for later this week.  If it hit today, then I'd short it.  But if not I'm just in a "don't know" mode where I don't have good odds for a strong move in either direction.  And when I have 50/50 odds I just sit on my hands and wait for something better.  That's what I see for today and possibly the rest of the week.  A move down early... probably just an extension of the B wave, a rally up to 2480 area is a good short and probably ends the ABC up.

ES Morning Update August 15th 2017

0

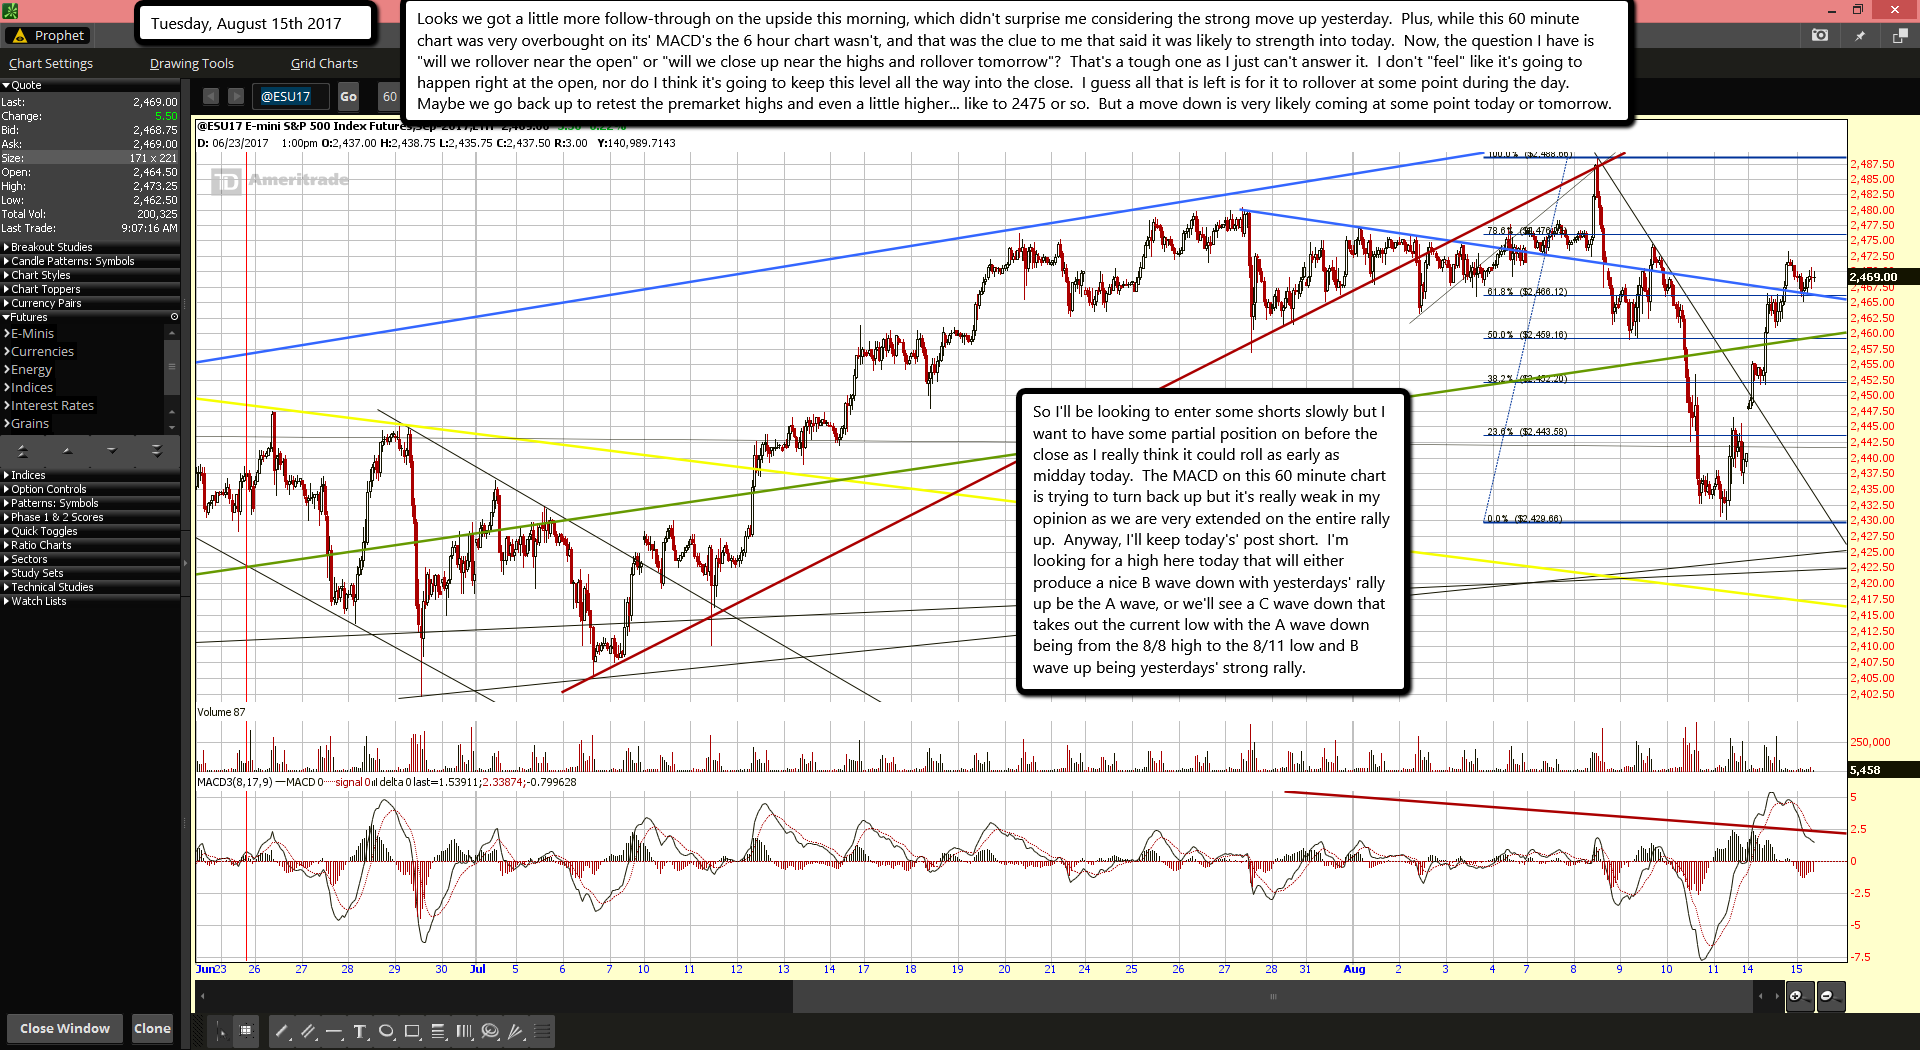
Looks we got a little more follow-through on the upside this morning, which didn't surprise me considering the strong move up yesterday.  Plus, while this 60 minute chart was very overbought on its' MACD's the 6 hour chart wasn't, and that was the clue to me that said it was likely to strength into today.  Now, the question I have is "will we rollover near the open" or "will we close up near the highs and rollover tomorrow"?  That's a tough one as I just can't answer it.  I don't "feel" like it's going to happen right at the open, nor do I think it's going to keep this level all the way into the close.  I guess all that is left is for it to rollover at some point during the day.  Maybe we go back up to retest the premarket highs and even a little higher... like to 2475 or so.  But a move down is very likely coming at some point today or tomorrow.

So I'll be looking to enter some shorts slowly but I want to have some partial position on before the close as I really think it could roll as early as midday today.  The MACD on this 60 minute chart is trying to turn back up but it's really weak in my opinion as we are very extended on the entire rally up.  Anyway, I'll keep today's' post short.  I'm looking for a high here today that will either produce a nice B wave down with yesterdays' rally up be the A wave, or we'll see a C wave down that takes out the current low with the A wave down being from the 8/8 high to the 8/11 low and B wave up being yesterdays' strong rally.

10 years after financial crisis..another crash is “almost inevitable”

0

Ten years on from the start of the global financial crisis, one of only a handful of economists to predict the crash, Professor Steve Keen, warns another one is “almost inevitable.”

On August 9, 2007, the French investment bank BNP Paribas announced it was shutting down three investment funds specializing in the US subprime market, explaining it was struggling to calculate their values against a backdrop of growing concerns over liquidity.

The rest is history. Banks collapsed, unemployment soared, and some governments even went bust. For a decade, politicians, regulators, and financiers have sought to find ways to recover and stop a similar catastrophe befalling the system.

Keen, now head of the economics department at Kingston University in London, anticipated the last financial crisis at a time when most academic economists complacently didn’t.

Speaking to RT, Keen said another financial crisis could be just around the corner unless a fundamentally different approach to debt is adopted. He says we are too focused on government debt, when what actually caused the crisis was “run-away private debt.”

“The economy in the UK is not stable. It’s in the aftermath of the biggest financial crisis since the great depression, and there’s still a lack of awareness in the political classes about what actually caused the crisis in the first place,” Keen said.

“The Tories were incredibly successful in convincing the electorate that the crisis was caused by government spending, which is absurd. That is technically saying government spending in the UK caused the financial crisis in the United States. Which is just nonsense.

“And that gave us austerity for the last 10 years. That austerity has actually further weakened the economy.”

Keen says the level of private debt in the UK peaked at about 195 percent of gross domestic product (GDP) post-crisis. While it is now down to about 170 percent of GDP, it is roughly three times the level of debt England carried before the Margaret Thatcher era, he says.

“That’s the stuff that’s being ignored. Nothing is really being done about that. With the amount of debt just sitting there we are still likely to have another crisis – but more likely, we are going to have stagnation.”

What is cause for concern, Keen says, is what he calls the “zombie-to-be” economies, such as Australia, Belgium, China, Canada, and South Korea, which avoided the 2008 crisis by borrowing their way through it.

Now they have a bigger debt burden to deal with when the next crisis hits, which could be between 2017 and 2020, he says.

“[The ‘zombie-to-be’ economies] are roughly equivalent in size to the American economy. So when they fall, then there will be a crisis that affects the rest of the world, including the UK.”

Keen sees China as a terminal case. It has expanded credit at an annualized rate of around 25 percent for years on end. With private sector debt exceeding 200 percent of GDP, China resembles the over-indebted economies of Ireland and Spain prior to 2008.

He also has little hope for his native Australia, whose credit and housing bubbles failed to burst in 2008. Last year, Australian private sector credit nudged above 200 percent of GDP, up more than 20 percentage points since the global financial crisis.

Australia shows “that you can avoid a debt crisis today only by putting it off until tomorrow,” Keen says.

ES Morning Update August 14th 2017

0

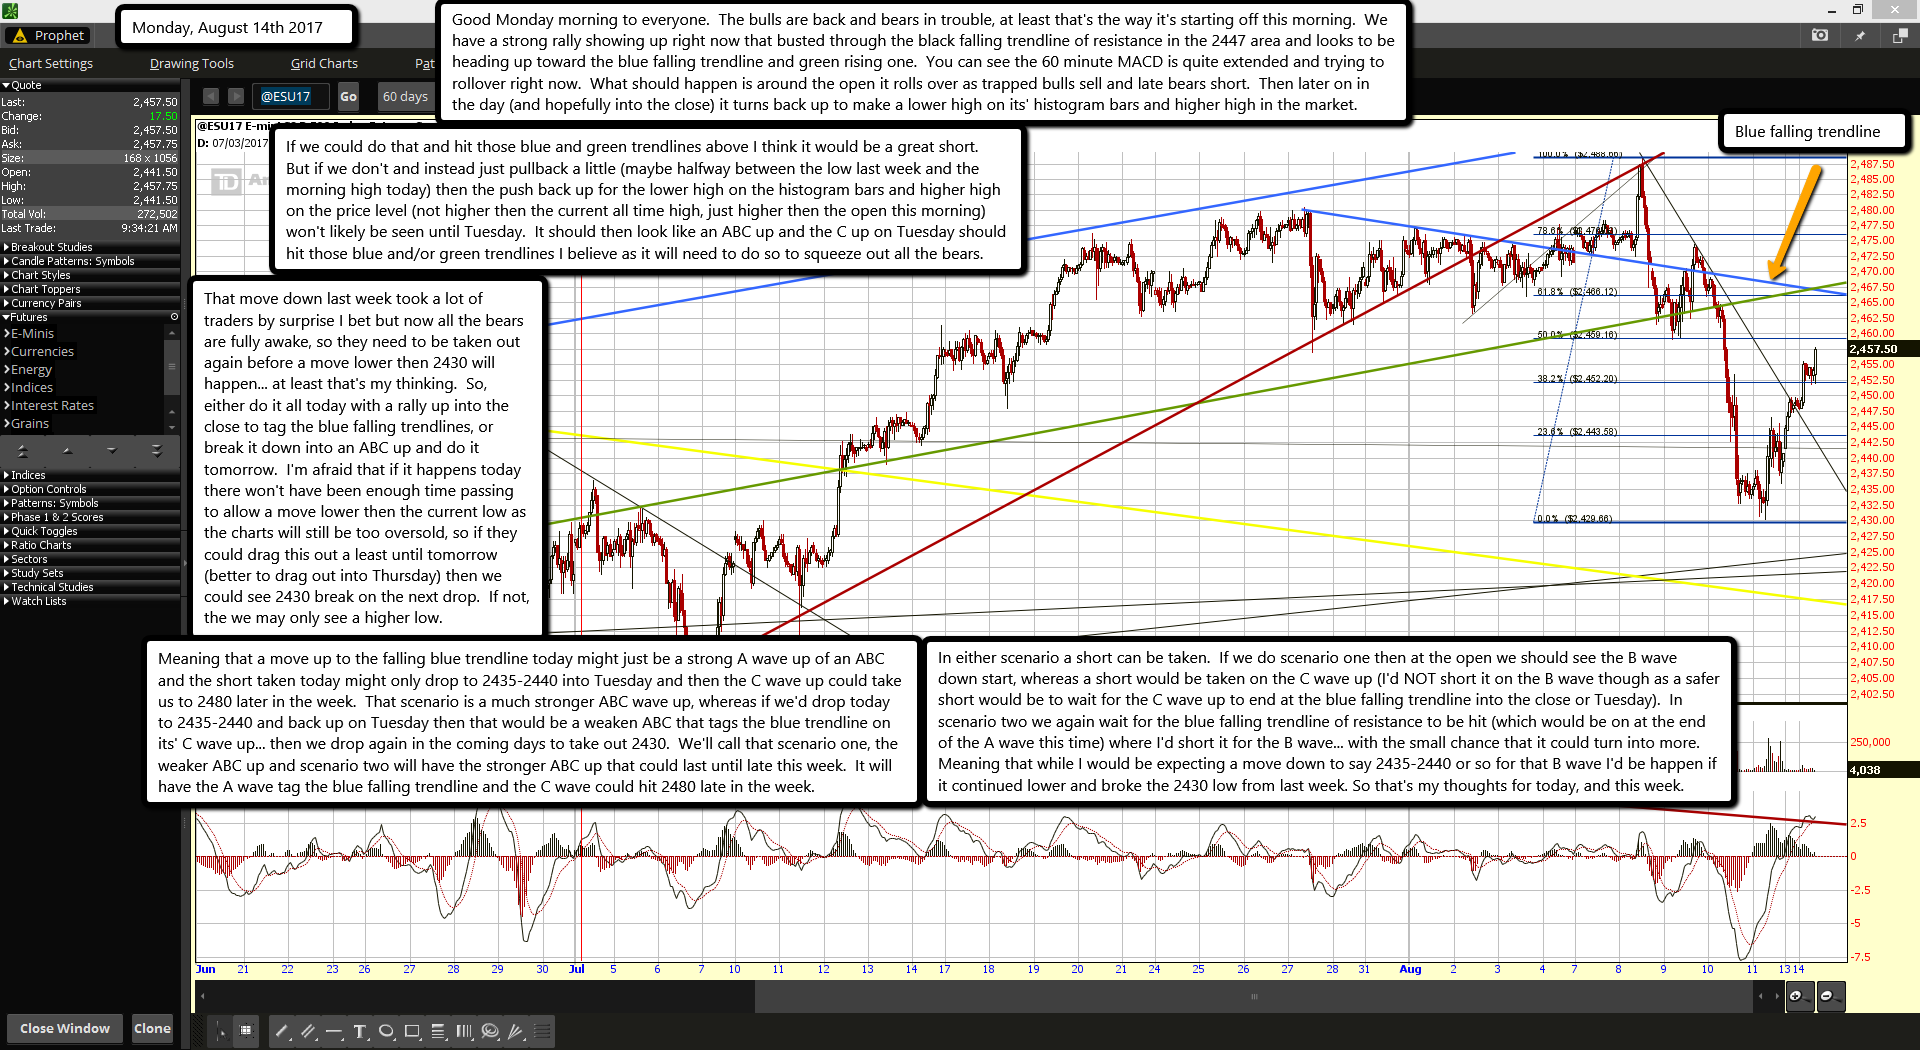
Good Monday morning to everyone.  The bulls are back and bears in trouble, at least that's the way it's starting off this morning.  We have a strong rally showing up right now that busted through the black falling trendline of resistance in the 2447 area and looks to be heading up toward the blue falling trendline and green rising one.  You can see the 60 minute MACD is quite extended and trying to rollover right now.  What should happen is around the open it rolls over as trapped bulls sell and late bears short.  Then later on in the day (and hopefully into the close) it turns back up to make a lower high on its' histogram bars and higher high in the market.

If we could do that and hit those blue and green trendlines above I think it would be a great short.  But if we don't and instead just pullback a little (maybe halfway between the low last week and the morning high today) then the push back up for the lower high on the histogram bars and higher high on the price level (not higher then the current all time high, just higher then the open this morning) won't likely be seen until Tuesday.  It should then look like an ABC up and the C up on Tuesday should hit those blue and/or green trendlines I believe as it will need to do so to squeeze out all the bears.

That move down last week took a lot of traders by surprise I bet but now all the bears are fully awake, so they need to be taken out again before a move lower then 2430 will happen... at least that's my thinking.  So, either do it all today with a rally up into the close to tag the blue falling trendlines, or break it down into an ABC up and do it tomorrow.  I'm afraid that if it happens today there won't have been enough time passing to allow a move lower then the current low as the charts will still be too oversold, so if they could drag this out a least until tomorrow (better to drag out into Thursday) then we could see 2430 break on the next drop.  If not, the we may only see a higher low.

Meaning that a move up to the falling blue trendline today might just be a strong A wave up of an ABC and the short taken today might only drop to 2435-2440 into Tuesday and then the C wave up could take us to 2480 later in the week.  That scenario is a much stronger ABC wave up, whereas if we'd drop today to 2435-2440 and back up on Tuesday then that would be a weaken ABC that tags the blue trendline on its' C wave up... then we drop again in the coming days to take out 2430.  We'll call that scenario one, the weaker ABC up and scenario two will have the stronger ABC up that could last until late this week.  It will have the A wave tag the blue falling trendline and the C wave could hit 2480 late in the week.

In either scenario a short can be taken.  If we do scenario one then at the open we should see the B wave down start, whereas a short would be taken on the C wave up (I'd NOT short it on the B wave though as a safer short would be to wait for the C wave up to end at the blue falling trendline into the close or Tuesday).  In scenario two we again wait for the blue falling trendline of resistance to be hit (which would be on at the end of the A wave this time) where I'd short it for the B wave... with the small chance that it could turn into more.  Meaning that while I would be expecting a move down to say 2435-2440 or so for that B wave I'd be happen if it continued lower and broke the 2430 low from last week. So that's my thoughts for today, and this week.

ES Morning Update August 11th 2017

0

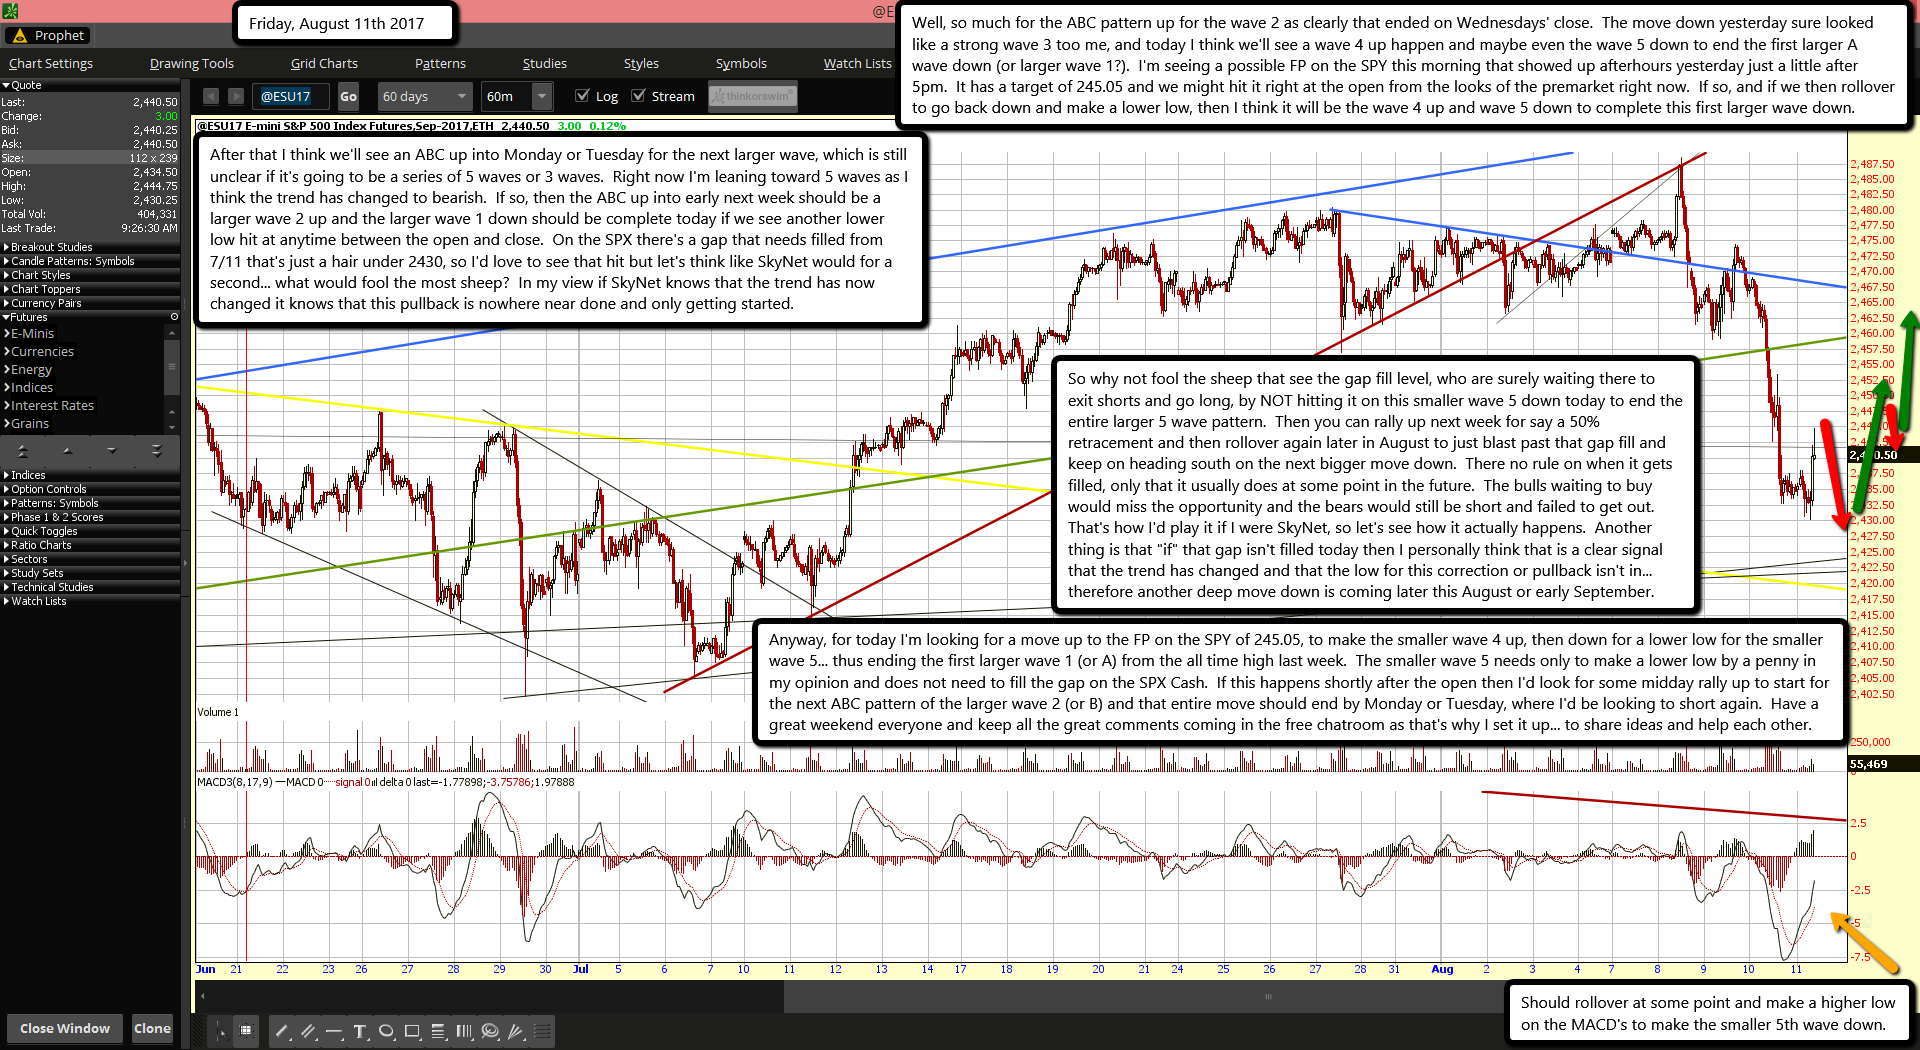
Well, so much for the ABC pattern up for the wave 2 as clearly that ended on Wednesdays' close.  The move down yesterday sure looked like a strong wave 3 too me, and today I think we'll see a wave 4 up happen and maybe even the wave 5 down to end the first larger A wave down (or larger wave 1?).  I'm seeing a possible FP on the SPY this morning that showed up afterhours yesterday just a little after 5pm.  It has a target of 245.05 and we might hit it right at the open from the looks of the premarket right now.  If so, and if we then rollover to go back down and make a lower low, then I think it will be the wave 4 up and wave 5 down to complete this first larger wave down.

After that I think we'll see an ABC up into Monday or Tuesday for the next larger wave, which is still unclear if it's going to be a series of 5 waves or 3 waves.  Right now I'm leaning toward 5 waves as I think the trend has changed to bearish.  If so, then the ABC up into early next week should be a larger wave 2 up and the larger wave 1 down should be complete today if we see another lower low hit at anytime between the open and close.  On the SPX there's a gap that needs filled from 7/11 that's just a hair under 2430, so I'd love to see that hit but let's think like SkyNet would for a second... what would fool the most sheep?  In my view if SkyNet knows that the trend has now changed it knows that this pullback is nowhere near done and only getting started.

So why not fool the sheep that see the gap fill level, who are surely waiting there to exit shorts and go long, by NOT hitting it on this smaller wave 5 down today to end the entire larger 5 wave pattern.  Then you can rally up next week for say a 50% retracement and then rollover again later in August to just blast past that gap fill and keep on heading south on the next bigger move down.  There no rule on when it gets filled, only that it usually does at some point in the future.  The bulls waiting to buy would miss the opportunity and the bears would still be short and failed to get out.  That's how I'd play it if I were SkyNet, so let's see how it actually happens.  Another thing is that "if" that gap isn't filled today then I personally think that is a clear signal that the trend has changed and that the low for this correction or pullback isn't in... therefore another deep move down is coming later this August or early September.

Anyway, for today I'm looking for a move up to the FP on the SPY of 245.05, to make the smaller wave 4 up, then down for a lower low for the smaller wave 5... thus ending the first larger wave 1 (or A) from the all time high last week.  The smaller wave 5 needs only to make a lower low by a penny in my opinion and does not need to fill the gap on the SPX Cash.  If this happens shortly after the open then I'd look for some midday rally up to start for the next ABC pattern of the larger wave 2 (or B) and that entire move should end by Monday or Tuesday, where I'd be looking to short again.  Have a great weekend everyone and keep all the great comments coming in the free chatroom as that's why I set it up... to share ideas and help each other.

ES Morning Update August 10th 2017

0

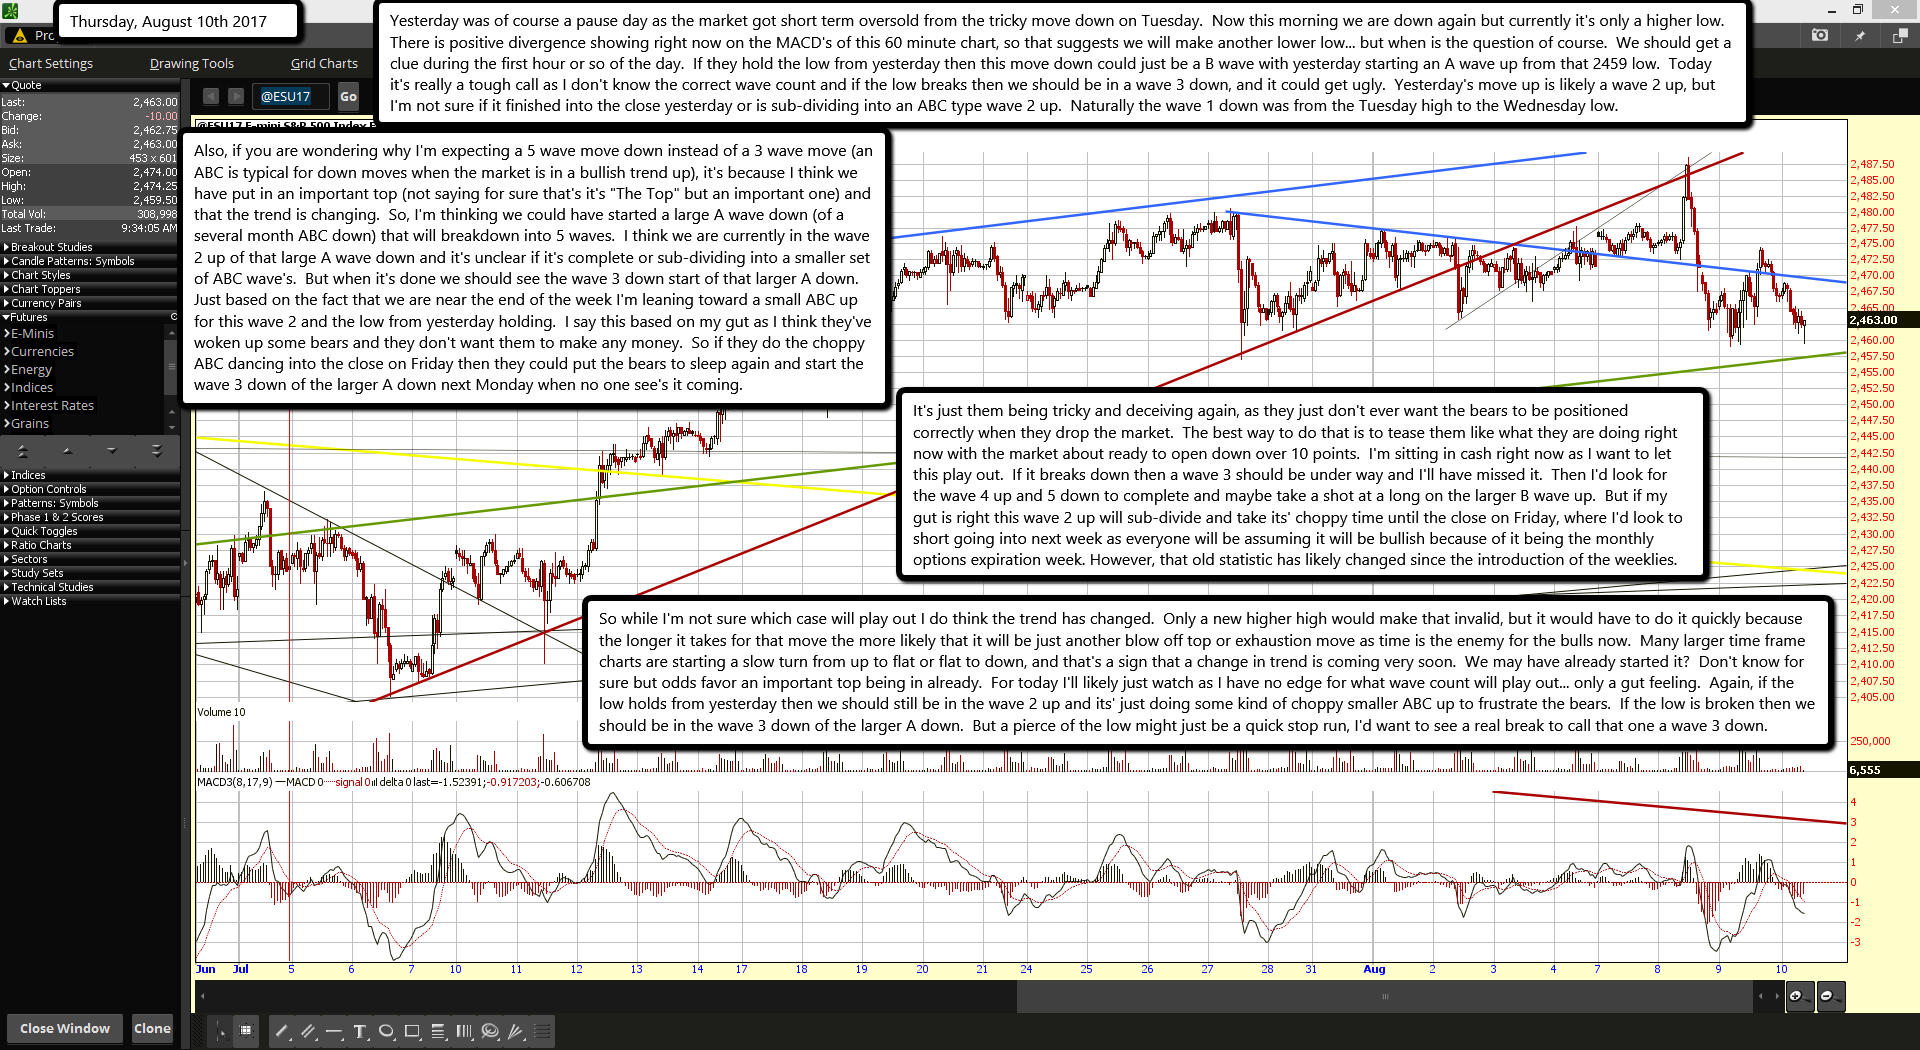
Yesterday was of course a pause day as the market got short term oversold from the tricky move down on Tuesday.  Now this morning we are down again but currently it's only a higher low.  There is positive divergence showing right now on the MACD's of this 60 minute chart, so that suggests we will make another lower low... but when is the question of course.  We should get a clue during the first hour or so of the day.  If they hold the low from yesterday then this move down could just be a B wave with yesterday starting an A wave up from that 2459 low.  Today it's really a tough call as I don't know the correct wave count and if the low breaks then we should be in a wave 3 down, and it could get ugly.  Yesterday's move up is likely a wave 2 up, but I'm not sure if it finished into the close yesterday or is sub-dividing into an ABC type wave 2 up.  Naturally the wave 1 down was from the Tuesday high to the Wednesday low.

Also, if you are wondering why I'm expecting a 5 wave move down instead of a 3 wave move (an ABC is typical for down moves when the market is in a bullish trend up), it's because I think we have put in an important top (not saying for sure that's it's "The Top" but an important one) and that the trend is changing.  So, I'm thinking we could have started a large A wave down (of a several month ABC down) that will breakdown into 5 waves.  I think we are currently in the wave 2 up of that large A wave down and it's unclear if it's complete or sub-dividing into a smaller set of ABC wave's.  But when it's done we should see the wave 3 down start of that larger A down.  Just based on the fact that we are near the end of the week I'm leaning toward a small ABC up for this wave 2 and the low from yesterday holding.  I say this based on my gut as I think they've woken up some bears and they don't want them to make any money.  So if they do the choppy ABC dancing into the close on Friday then they could put the bears to sleep again and start the wave 3 down of the larger A down next Monday when no one see's it coming.

It's just them being tricky and deceiving again, as they just don't ever want the bears to be positioned correctly when they drop the market.  The best way to do that is to tease them like what they are doing right now with the market about ready to open down over 10 points.  I'm sitting in cash right now as I want to let this play out.  If it breaks down then a wave 3 should be under way and I'll have missed it.  Then I'd look for the wave 4 up and 5 down to complete and maybe take a shot at a long on the larger B wave up.  But if my gut is right this wave 2 up will sub-divide and take its' choppy time until the close on Friday, where I'd look to short going into next week as everyone will be assuming it will be bullish because of it being the monthly options expiration week. However, that old statistic has likely changed since the introduction of the weeklies.

So while I'm not sure which case will play out I do think the trend has changed.  Only a new higher high would make that invalid, but it would have to do it quickly because the longer it takes for that move the more likely that it will be just another blow off top or exhaustion move as time is the enemy for the bulls now.  Many larger time frame charts are starting a slow turn from up to flat or flat to down, and that's a sign that a change in trend is coming very soon.  We may have already started it?  Don't know for sure but odds favor an important top being in already.  For today I'll likely just watch as I have no edge for what wave count will play out... only a gut feeling.  Again, if the low holds from yesterday then we should still be in the wave 2 up and its' just doing some kind of choppy smaller ABC up to frustrate the bears.  If the low is broken then we should be in the wave 3 down of the larger A down.  But a pierce of the low might just be a quick stop run, I'd want to see a real break to call that one a wave 3 down.

ES Morning Update August 9th 2017

0

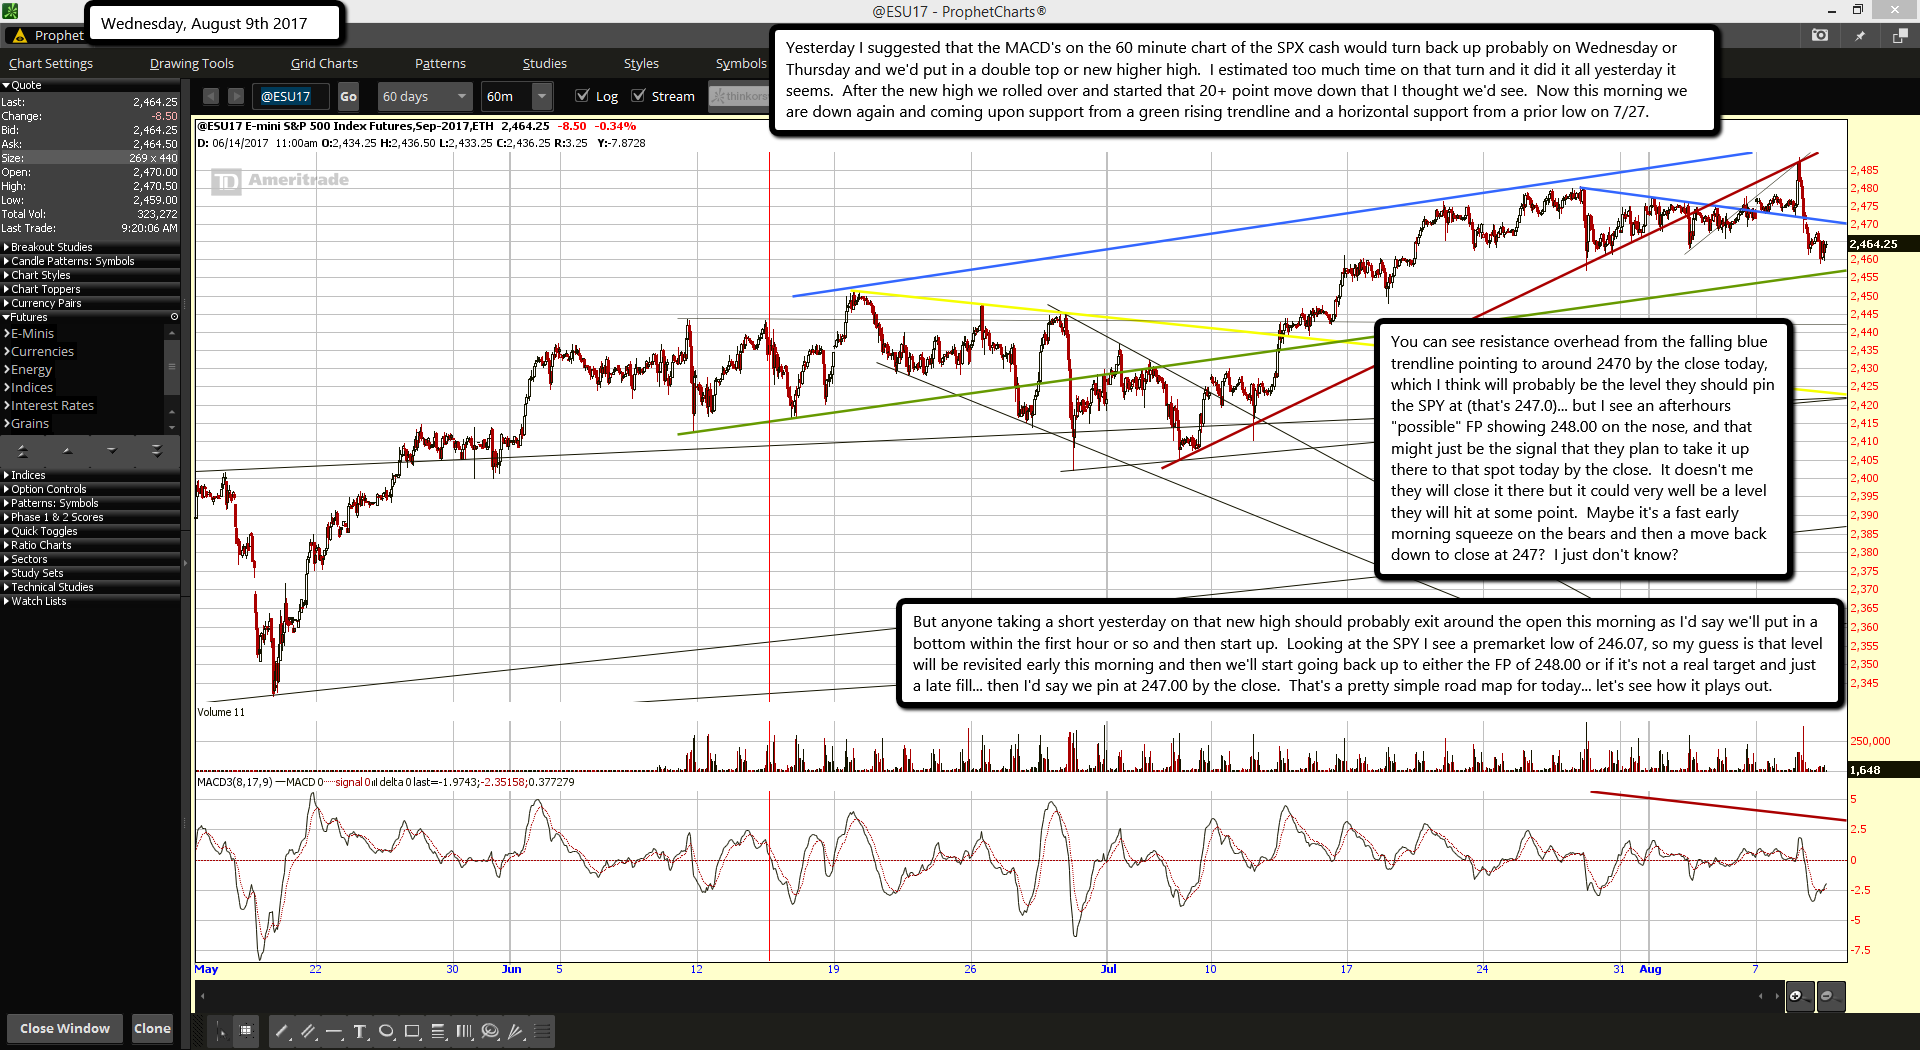
Yesterday I suggested that the MACD's on the 60 minute chart of the SPX cash would turn back up probably on Wednesday or Thursday and we'd put in a double top or new higher high.  I estimated too much time on that turn and it did it all yesterday it seems.  After the new high we rolled over and started that 20+ point move down that I thought we'd see.  Now this morning we are down again and coming upon support from a green rising trendline and a horizontal support from a prior low on 7/27.

You can see resistance overhead from the falling blue trendline pointing to around 2470 by the close today, which I think will probably be the level they should pin the SPY at (that's 247.0)... but I see an afterhours "possible" FP showing 248.00 on the nose, and that might just be the signal that they plan to take it up there to that spot today by the close.  It doesn't me they will close it there but it could very well be a level they will hit at some point.  Maybe it's a fast early morning squeeze on the bears and then a move back down to close at 247?  I just don't know?

But anyone taking a short yesterday on that new high should probably exit around the open this morning as I'd say we'll put in a bottom within the first hour or so and then start up.  Looking at the SPY I see a premarket low of 246.07, so my guess is that level will be revisited early this morning and then we'll start going back up to either the FP of 248.00 or if it's not a real target and just a late fill... then I'd say we pin at 247.00 by the close.  That's a pretty simple road map for today... let's see how it plays out.

ES Morning Update August 8th 2017

0

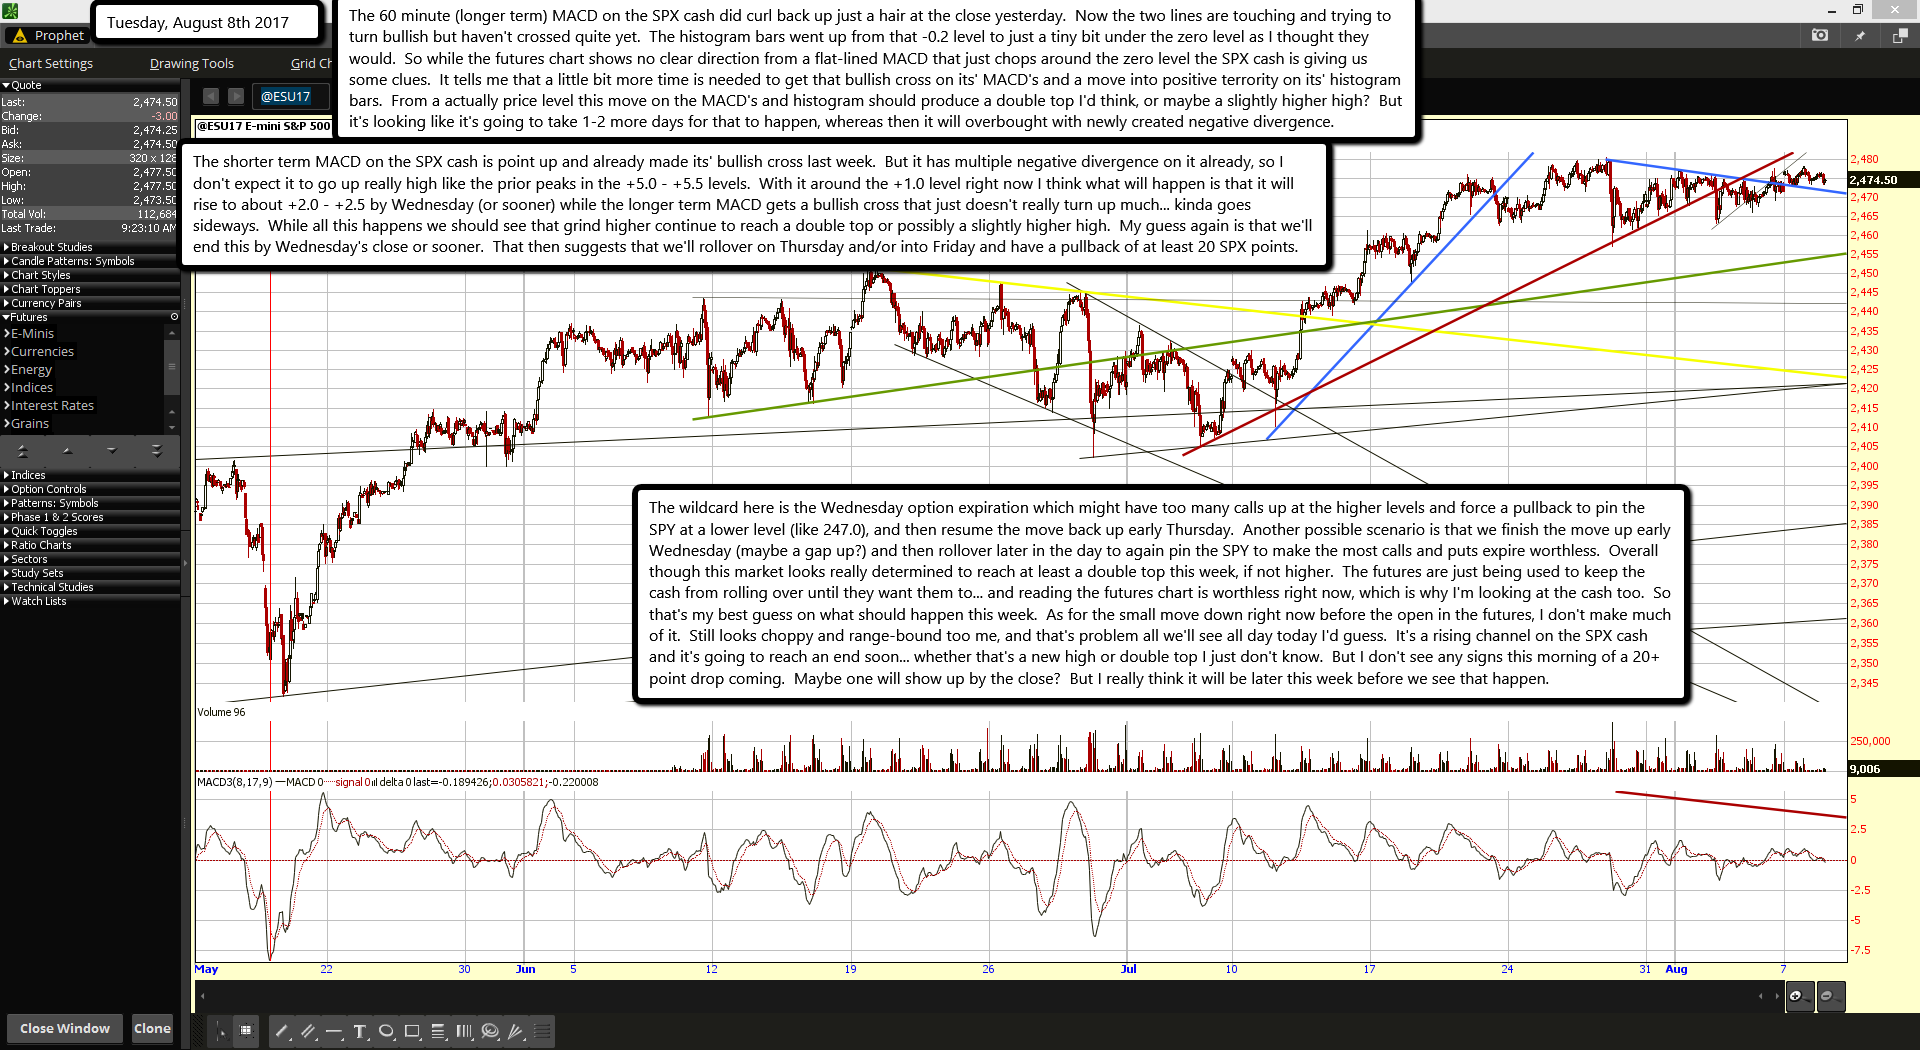
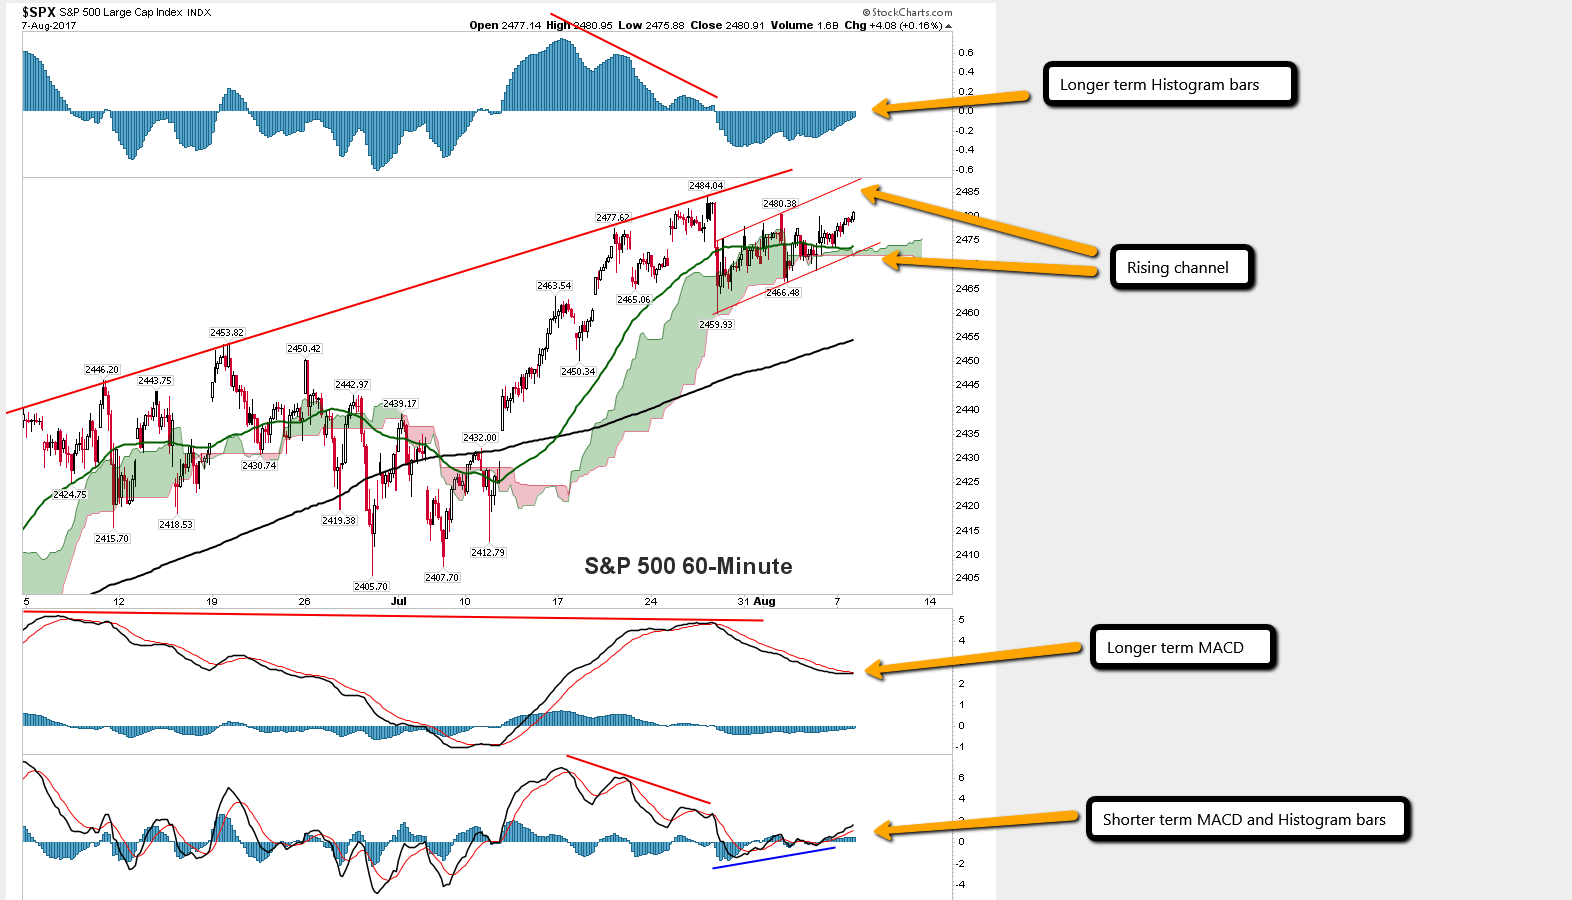
The 60 minute (longer term) MACD on the SPX cash did curl back up just a hair at the close yesterday.  Now the two lines are touching and trying to turn bullish but haven't crossed quite yet.  The histogram bars went up from that -0.2 level to just a tiny bit under the zero level as I thought they would.  So while the futures chart shows no clear direction from a flat-lined MACD that just chops around the zero level the SPX cash is giving us some clues.  It tells me that a little bit more time is needed to get that bullish cross on its' MACD's and a move into positive terrority on its' histogram bars.  From a actually price level this move on the MACD's and histogram should produce a double top I'd think, or maybe a slightly higher high?  But it's looking like it's going to take 1-2 more days for that to happen, whereas then it will overbought with newly created negative divergence.

The shorter term MACD on the SPX cash is point up and already made its' bullish cross last week.  But it has multiple negative divergence on it already, so I don't expect it to go up really high like the prior peaks in the +5.0 - +5.5 levels.  With it around the +1.0 level right now I think what will happen is that it will rise to about +2.0 - +2.5 by Wednesday (or sooner) while the longer term MACD gets a bullish cross that just doesn't really turn up much... kinda goes sideways.  While all this happens we should see that grind higher continue to reach a double top or possibly a slightly higher high.  My guess again is that we'll end this by Wednesday's close or sooner.  That then suggests that we'll rollover on Thursday and/or into Friday and have a pullback of at least 20 SPX points.

The wildcard here is the Wednesday option expiration which might have too many calls up at the higher levels and force a pullback to pin the SPY at a lower level (like 247.0), and then resume the move back up early Thursday.  Another possible scenario is that we finish the move up early Wednesday (maybe a gap up?) and then rollover later in the day to again pin the SPY to make the most calls and puts expire worthless.  Overall though this market looks really determined to reach at least a double top this week, if not higher.  The futures are just being used to keep the cash from rolling over until they want them to... and reading the futures chart is worthless right now, which is why I'm looking at the cash too.  So that's my best guess on what should happen this week.  As for the small move down right now before the open in the futures, I don't make much of it.  Still looks choppy and range-bound too me, and that's problem all we'll see all day today I'd guess.  It's a rising channel on the SPX cash and it's going to reach an end soon... whether that's a new high or double top I just don't know.  But I don't see any signs this morning of a 20+ point drop coming.  Maybe one will show up by the close?  But I really think it will be later this week before we see that happen.

ES Morning Update August 7th 2017

0

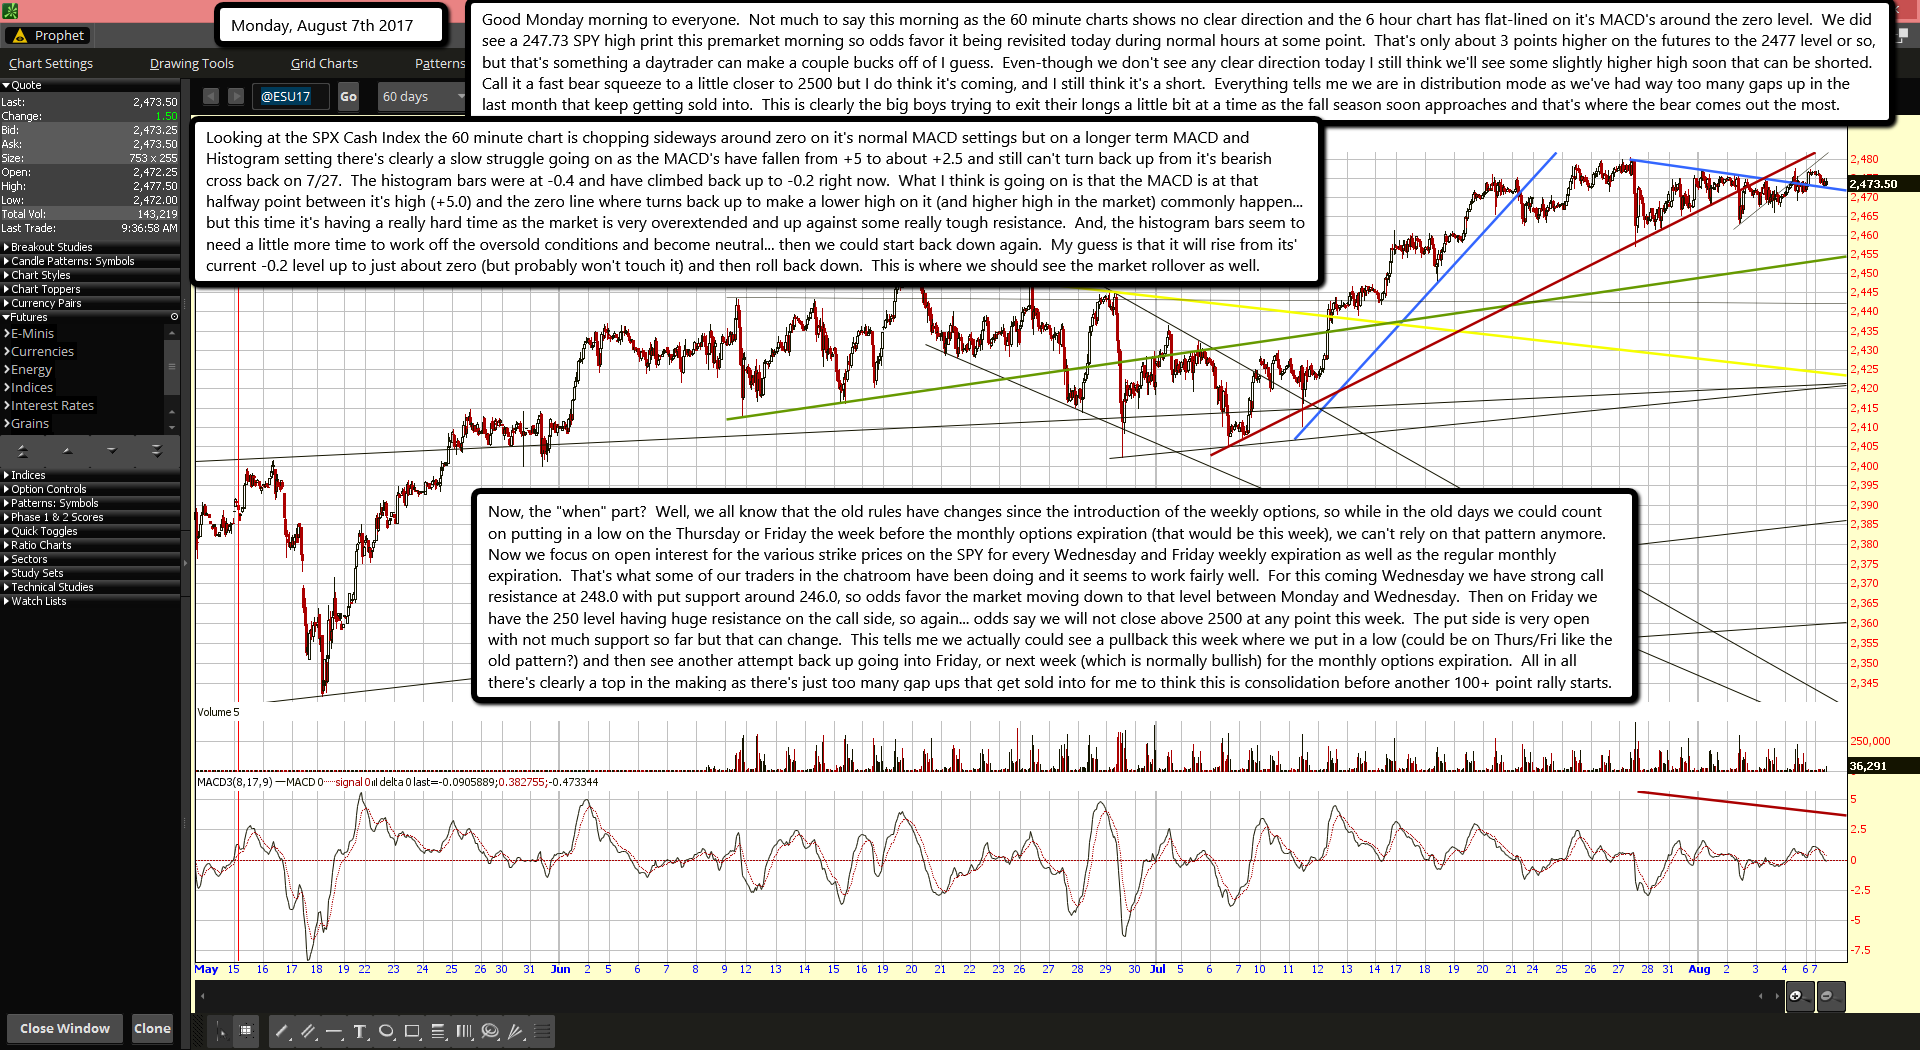
Good Monday morning to everyone.  Not much to say this morning as the 60 minute charts shows no clear direction and the 6 hour chart has flat-lined on it's MACD's around the zero level.  We did see a 247.73 SPY high print this premarket morning so odds favor it being revisited today during normal hours at some point.  That's only about 3 points higher on the futures to the 2477 level or so, but that's something a daytrader can make a couple bucks off of I guess.  Even-though we don't see any clear direction today I still think we'll see some slightly higher high soon that can be shorted.  Call it a fast bear squeeze to a little closer to 2500 but I do think it's coming, and I still think it's a short.  Everything tells me we are in distribution mode as we've had way too many gaps up in the last month that keep getting sold into.  This is clearly the big boys trying to exit their longs a little bit at a time as the fall season soon approaches and that's where the bear comes out the most.

Looking at the SPX Cash Index the 60 minute chart is chopping sideways around zero on it's normal MACD settings but on a longer term MACD and Histogram setting there's clearly a slow struggle going on as the MACD's have fallen from +5 to about +2.5 and still can't turn back up from it's bearish cross back on 7/27.  The histogram bars were at -0.4 and have climbed back up to -0.2 right now.  What I think is going on is that the MACD is at that halfway point between it's high (+5.0) and the zero line where turns back up to make a lower high on it (and higher high in the market) commonly happen... but this time it's having a really hard time as the market is very overextended and up against some really tough resistance.  And, the histogram bars seem to need a little more time to work off the oversold conditions and become neutral... then we could start back down again.  My guess is that it will rise from its' current -0.2 level up to just about zero (but probably won't touch it) and then roll back down.  This is where we should see the market rollover as well.

Now, the "when" part?  Well, we all know that the old rules have changes since the introduction of the weekly options, so while in the old days we could count on putting in a low on the Thursday or Friday the week before the monthly options expiration (that would be this week), we can't rely on that pattern anymore.  Now we focus on open interest for the various strike prices on the SPY for every Wednesday and Friday weekly expiration as well as the regular monthly expiration.  That's what some of our traders in the chatroom have been doing and it seems to work fairly well.  For this coming Wednesday we have strong call resistance at 248.0 with put support around 246.0, so odds favor the market moving down to that level between Monday and Wednesday.  Then on Friday we have the 250 level having huge resistance on the call side, so again... odds say we will not close above 2500 at any point this week.  The put side is very open with not much support so far but that can change.  This tells me we actually could see a pullback this week where we put in a low (could be on Thurs/Fri like the old pattern?) and then see another attempt back up going into Friday, or next week (which is normally bullish) for the monthly options expiration.  All in all there's clearly a top in the making as there's just too many gap ups that get sold into for me to think this is consolidation before another 100+ point rally starts.

ES Morning Update August 4th 2017

0

Yesterday at the close when they dropped the market I had a gut feeling that was the signal that the NFP Report (non-farm payroll, now called employment situation) would rally the market up when released, and sure enough that's what is going on right now.  They pierced through the blue falling trendline a little as well, but they did NOT put in a new all time high.  So, with the numbers now out and the big spike up from it over with the momentum is fading and that's not a true sign of strength in my opinion.  If they wanted to take out the current high they really need to do it before the market opens while the volume is still low.  Failure to do so lowers the bulls' chances and means the inverted head and shoulders pattern I spoke of yesterday is likely going to be a failed patten.

Remember that the target on that pattern was around 2484, and that's a new all time high.  But all we have so far this morning is 2477.00, a lower high.  It wouldn't be so bad if when they open it would cause a short squeeze on the bears but odds say that most bears have their stops above the 2480 all time high and won't be forced to buy back their position unless that level is broken, which then of course we could see a short squeeze on them.  But below that level and the bears are just sitting tight and not panicking.  I would have liked to seen a fast squeeze up to 2484 and a reversal back down below 2480 before the open as that would be a great sign that they plan to take the market down.

Now we have to wait around all day to see if they hold this level, push up a little more or rollover.  There's really no good evidence to say that we'll drop at the open and reverse this move up as we didn't go up high enough to take out the bears and today is a Friday where they like to chop around all day to pin the SPY where the most options expire worthless.  I see no edge for the bulls or bears today as failure to take out the all time high before the open tells me they will have a very hard time doing it during market hours, which means they likely won't be able too... and a failure to run the bears stops tells me they won't drop it hard either.  Maybe the high is put in today, who knows?  But I don't see the start of the move down on a Friday, meaning we'll have to wait until next week I guess to see what SkyNet has planned for us sheep.  I'd love to be wrong and see a sharp reveral today at the open but I'm not seeing it as "likely", meaning low odds of it happening.  My best guess is that they will pin the SPY around 247.00, so that's a small pullback on the futures to about 2470.00... which is just more chop in a rangebound market.  Have a great weekend everyone.

ES Morning Update August 3rd 2017

0

The market finally broke-down yesterday losing the red rising trendline of support.  Of course it rallied back hard as the bulls never seems to give up, but most bears now days expect that and take profits quickly and go back to sidelines to see what happens next.  Since I had that FP on the SPY showing 246.72 I exited my short once it hit.  It bounced and then went lower before the rally started to erase almost the entire move down, but that's to be expected when carving out a top.  There should be many more quick drops and fast recovery's before this ship really turns down south for a nice correction, but that's how works and there's nothing we can do about it but expect it and trade accordingly.

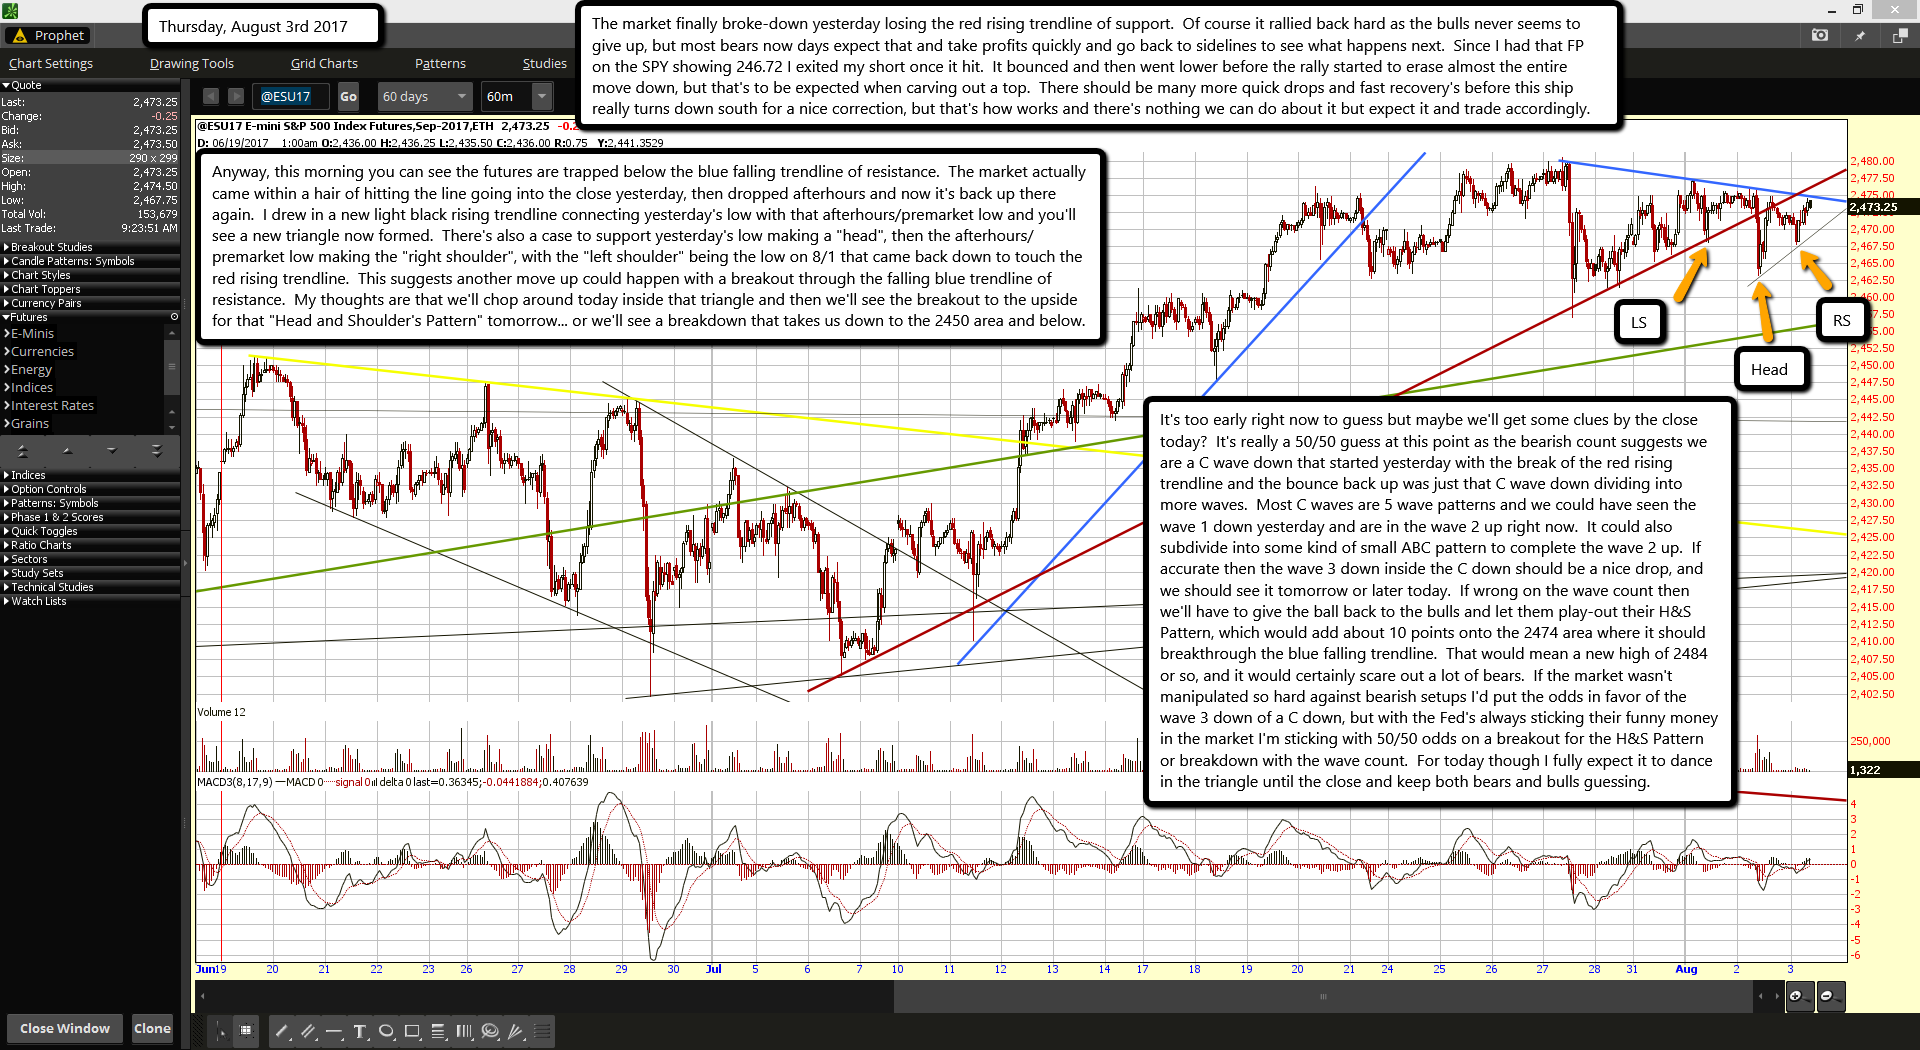
Anyway, this morning you can see the futures are trapped below the blue falling trendline of resistance.  The market actually came within a hair of hitting the line going into the close yesterday, then dropped afterhours and now it's back up there again.  I drew in a new light black rising trendline connecting yesterday's low with that afterhours/premarket low and you'll see a new triangle now formed.  There's also a case to support yesterday's low making a "head", then the afterhours/premarket low making the "right shoulder", with the "left shoulder" being the low on 8/1 that came back down to touch the red rising trendline.  This suggests another move up could happen with a breakout through the falling blue trendline of resistance.  My thoughts are that we'll chop around today inside that triangle and then we'll see the breakout to the upside for that "Head and Shoulder's Pattern" tomorrow... or we'll see a breakdown that takes us down to the 2450 area and below.

It's too early right now to guess but maybe we'll get some clues by the close today?  It's really a 50/50 guess at this point as the bearish count suggests we are a C wave down that started yesterday with the break of the red rising trendline and the bounce back up was just that C wave down dividing into more waves.  Most C waves are 5 wave patterns and we could have seen the wave 1 down yesterday and are in the wave 2 up right now.  It could also subdivide into some kind of small ABC pattern to complete the wave 2 up.  If accurate then the wave 3 down inside the C down should be a nice drop, and we should see it tomorrow or later today.  If wrong on the wave count then we'll have to give the ball back to the bulls and let them play-out their H&S Pattern, which would add about 10 points onto the 2474 area where it should breakthrough the blue falling trendline.  That would mean a new high of 2484 or so, and it would certainly scare out a lot of bears.  If the market wasn't manipulated so hard against bearish setups I'd put the odds in favor of the wave 3 down of a C down, but with the Fed's always sticking their funny money in the market I'm sticking with 50/50 odds on a breakout for the H&S Pattern or breakdown with the wave count.  For today though I fully expect it to dance in the triangle until the close and keep both bears and bulls guessing.

ES Morning Update August 2nd 2017

0

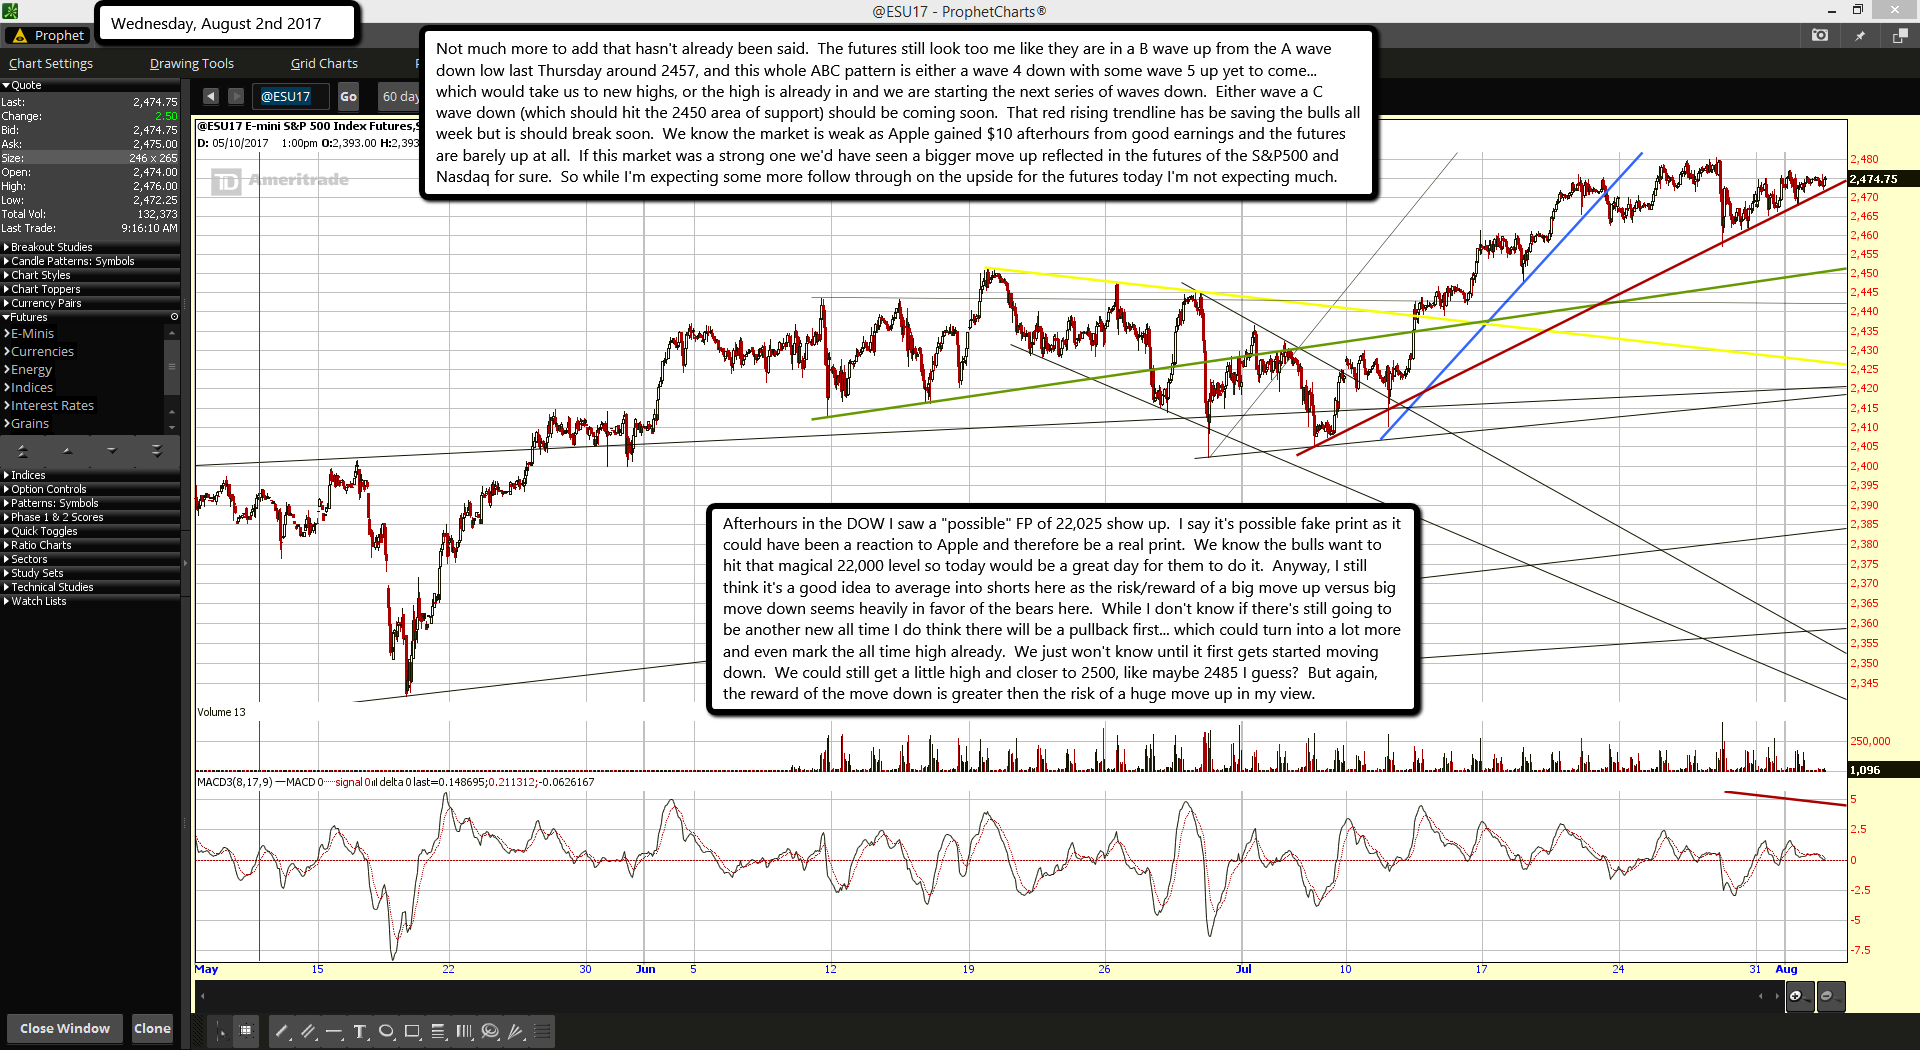
Not much more to add that hasn't already been said.  The futures still look too me like they are in a B wave up from the A wave down low last Thursday around 2457, and this whole ABC pattern is either a wave 4 down with some wave 5 up yet to come... which would take us to new highs, or the high is already in and we are starting the next series of waves down.  Either wave a C wave down (which should hit the 2450 area of support) should be coming soon.  That red rising trendline has be saving the bulls all week but is should break soon.  We know the market is weak as Apple gained $10 afterhours from good earnings and the futures are barely up at all.  If this market was a strong one we'd have seen a bigger move up reflected in the futures of the S&P500 and Nasdaq for sure.  So while I'm expecting some more follow through on the upside for the futures today I'm not expecting much.

Afterhours in the DOW I saw a "possible" FP of 22,025 show up.  I say it's possible fake print as it could have been a reaction to Apple and therefore be a real print.  We know the bulls want to hit that magical 22,000 level so today would be a great day for them to do it.  Anyway, I still think it's a good idea to average into shorts here as the risk/reward of a big move up versus big move down seems heavily in favor of the bears here.  While I don't know if there's still going to be another new all time I do think there will be a pullback first... which could turn into a lot more and even mark the all time high already.  We just won't know until it first gets started moving down.  We could still get a little high and closer to 2500, like maybe 2485 I guess?  But again, the reward of the move down is greater then the risk of a huge move up in my view.

The American Empire and its Media

0

Largely unbeknownst to the general public, many media executives and top journalists of almost all major U.S. news outlets, political and business magazines, public broadcasters and press agencies have long been members of the Council on Foreign Relations (CFR).

Established in 1921 as a private, bipartisan organization to “awaken America to its worldwide responsibilities”, the CFR and its close to 5000 elite members have for decades shaped U.S. foreign policy and public discourse about it. As one Council member famously explained, the goal has indeed been to establish an “empire”, albeit a “benevolent” one.

Based on official membership rosters, the following illustration for the first time depicts the extensive media network of the CFR and its two main international affiliate organizations: the Bilderberg Group (covering the U.S. and Europe) and the Trilateral Commission (covering North America, Europe and East Asia), both established by Council leaders to foster elite cooperation at the international level.cfr-media-network-hdb-spr.png (3781×2700)

In a column entitled “Ruling Class Journalists”, former Washington Post senior editor and ombudsman Richard Harwood once described the Council and its members approvingly as “the nearest thing we have to a ruling establishment in the United States”.

Harwood continued: “The membership of these journalists in the Council, however they may think of themselves, is an acknowledgment of their active and important role in public affairs and of their ascension into the American ruling class. They do not merely analyze and interpret foreign policy for the United States; they help make it. () They are part of that establishment whether they like it or not, sharing most of its values and world views.”

However, media personalities constitute only about five percent of the comprehensive CFR network. As the following illustration shows, key members of the private Council on Foreign Relations have included:

  • several U.S. Presidents and Vice Presidents of both parties;
  • almost all Secretaries of State, Defense, and the Treasury;
  • many high-ranking commanders of the U.S. military and NATO;
  • almost all National Security Advisors, CIA Directors, Ambassadors to the U.N., Chairs of the Federal Reserve, Presidents of the World Bank, and Directors of the National Economic Council;
  • some of the most influential Members of Congress (notably in foreign & security policy matters);
  • many top jounalists, media executives, and entertainment industry directors;
  • many prominent academics, especially in key fields such as Economics, International Relations, Political Science, History and Journalism;
  • many top executives of Wall Street, policy think tanks, universities, and NGOs;
  • as well as the key members of both the 9/11 Commission and the Warren Commission (JFK)

Eminent economist and Kennedy supporter, John K. Galbraith, confirmed the Council’s influence: “Those of us who had worked for the Kennedy election were tolerated in the government for that reason and had a say, but foreign policy was still with the Council on Foreign Relations people.”

And no less than John J. McCloy, the longtime chairman of the Council and advisor to nine U.S. presidents, told the New York Times about his time in Washington: “Whenever we needed a man we thumbed through the roll of the Council members and put through a call to New York.”cfr-american-empire-hdf-spr.png (5244×4054)

German news magazine Der Spiegel once described the CFR as the “most influential private institution of the United States and the Western world“ and a “politburo of capitalism”. Both the Roman-inspired logo of the Council (top right in the illustration above) as well as its slogan (ubique – omnipresent) appear to emphasize that ambition.

In his famous article about “The American Establishment”, political columnist Richard H. Rovere noted: “The directors of the CFR make up a sort of Presidium for that part of the Establishment that guides our destiny as a nation. () [I]t rarely fails to get one of its members, or at least one of its allies, into the White House. In fact, it generally is able to see to it that both nominees are men acceptable to it.”

Until recently, this assessment had indeed been justified. Thus, in 1993 former CFR director George H.W. Bush was followed by CFR member Bill Clinton, who in turn was followed by CFR “family member” George W. Bush. In 2008, CFR member John McCain lost against CFR candidate of choice, Barack Obama, who received the names of his entire Cabinet already one month prior to his election by CFR Senior Fellow (and Citigroup banker) Michael Froman. Froman later negotiated the TTP and TTIP free trade agreements, before returning to the CFR as a Distinguished Fellow.

It was not until the 2016 election that the Council couldn’t, apparently, prevail. At any rate, not yet.

References:

  1. Council on Foreign Relations:
  2. Bilderberg conference: participant lists 1954 to 2014 and 2015-2017
  3. Trilateral Commission: membership lists of 1973; 1978; 1985; 1995; 2010; and 2017
  4. Laurence H. Shoup (2015): Wall Street’s Think Tank: The Council on Foreign Relations and the Empire of Neoliberal Geopolitics, 1976-2014, Monthly Review Press
  5. Wikipedia pages about the CFR, the Bilderberg Group, and the Trilateral Commission

About the authors

Swiss Propaganda Research is an independent, academic research group focusing on geopolitical propaganda in Swiss and international media. You can contact us here.

ES Morning Update August 1st 2017

0

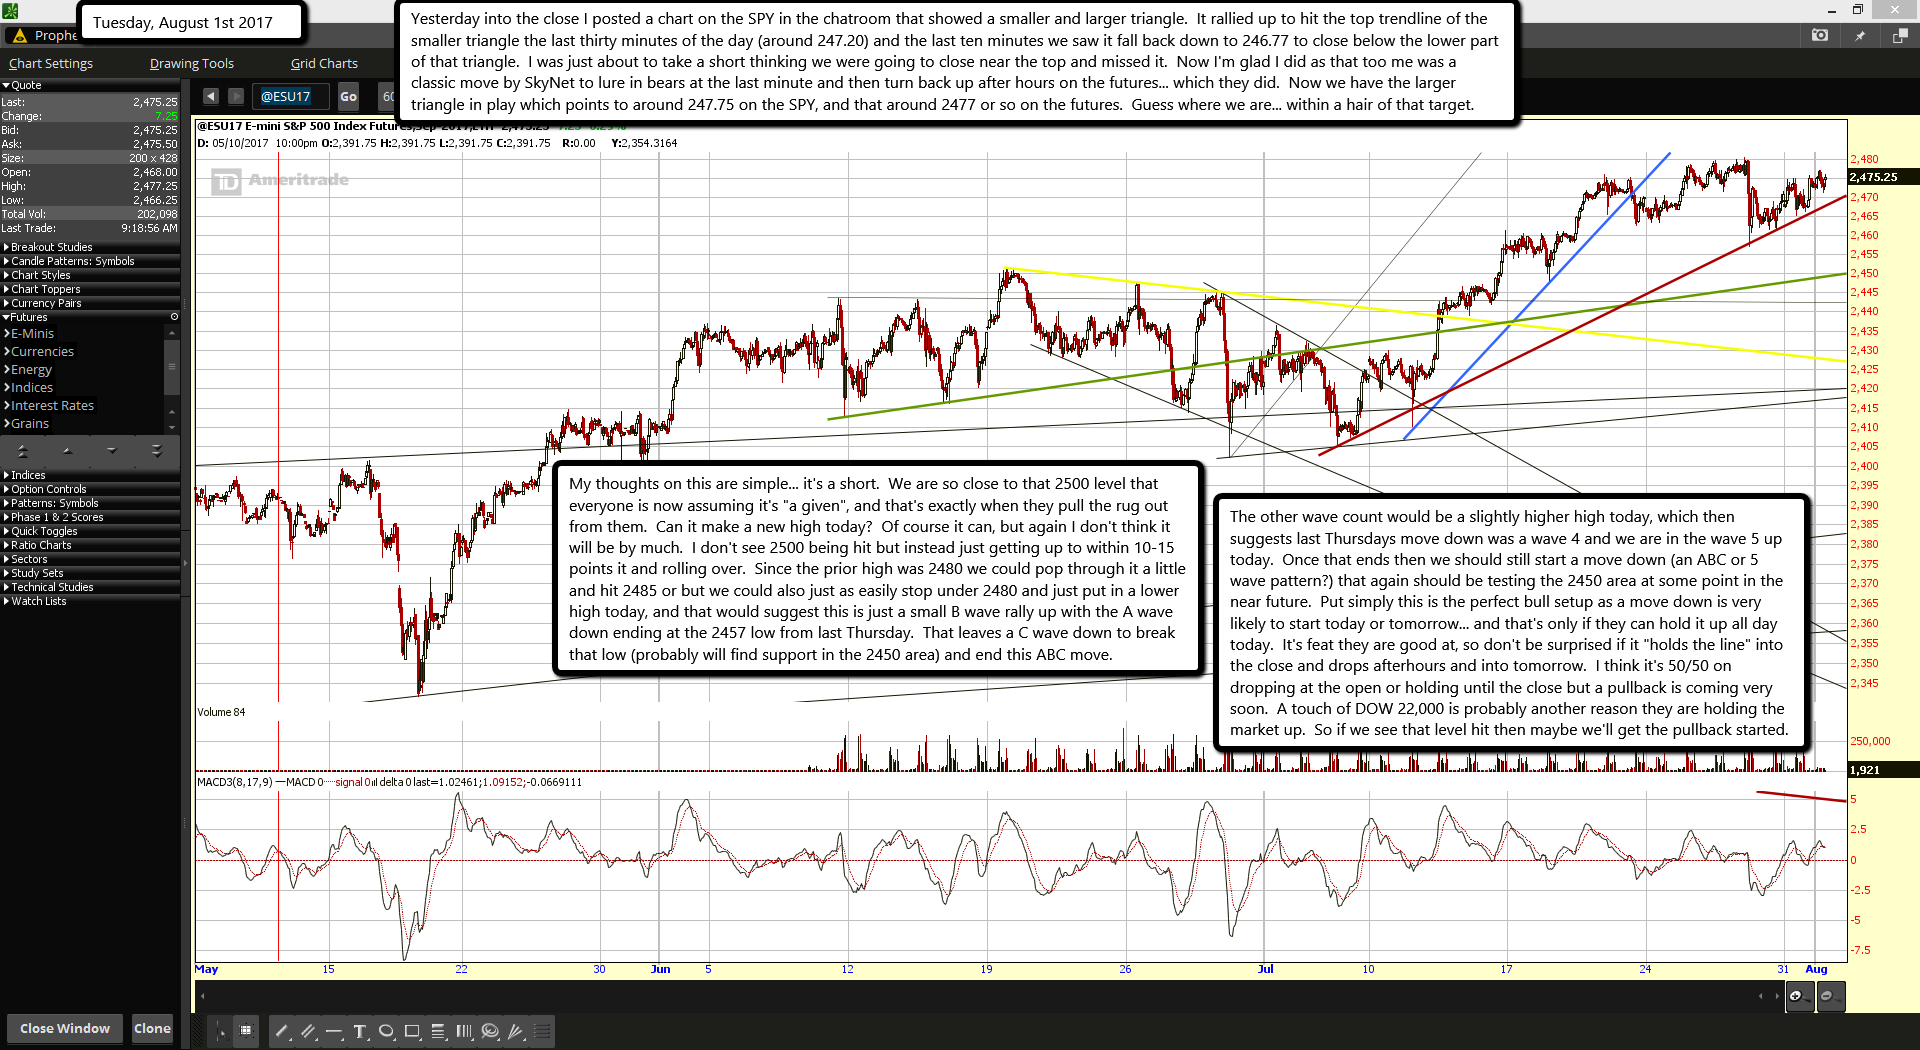
Yesterday into the close I posted a chart on the SPY in the chatroom that showed a smaller and larger triangle.  It rallied up to hit the top trendline of the smaller triangle the last thirty minutes of the day (around 247.20) and the last ten minutes we saw it fall back down to 246.77 to close below the lower part of that triangle.  I was just about to take a short thinking we were going to close near the top and missed it.  Now I'm glad I did as that too me was a classic move by SkyNet to lure in bears at the last minute and then turn back up after hours on the futures... which they did.  Now we have the larger triangle in play which points to around 247.75 on the SPY, and that around 2477 or so on the futures.  Guess where we are... within a hair of that target.

My thoughts on this are simple... it's a short.  We are so close to that 2500 level that everyone is now assuming it's "a given", and that's exactly when they pull the rug out from them.  Can it make a new high today?  Of course it can, but again I don't think it will be by much.  I don't see 2500 being hit but instead just getting up to within 10-15 points it and rolling over.  Since the prior high was 2480 we could pop through it a little and hit 2485 or but we could also just as easily stop under 2480 and just put in a lower high today, and that would suggest this is just a small B wave rally up with the A wave down ending at the 2457 low from last Thursday.  That leaves a C wave down to break that low (probably will find support in the 2450 area) and end this ABC move.

The other wave count would be a slightly higher high today, which then suggests last Thursdays move down was a wave 4 and we are in the wave 5 up today.  Once that ends then we should still start a move down (an ABC or 5 wave pattern?) that again should be testing the 2450 area at some point in the near future.  Put simply this is the perfect bull setup as a move down is very likely to start today or tomorrow... and that's only if they can hold it up all day today.  It's feat they are good at, so don't be surprised if it "holds the line" into the close and drops afterhours and into tomorrow.  I think it's 50/50 on dropping at the open or holding until the close but a pullback is coming very soon.  A touch of DOW 22,000 is probably another reason they are holding the market up.  So if we see that level hit then maybe we'll get the pullback started.

ES Morning Update July 31st 2017

0

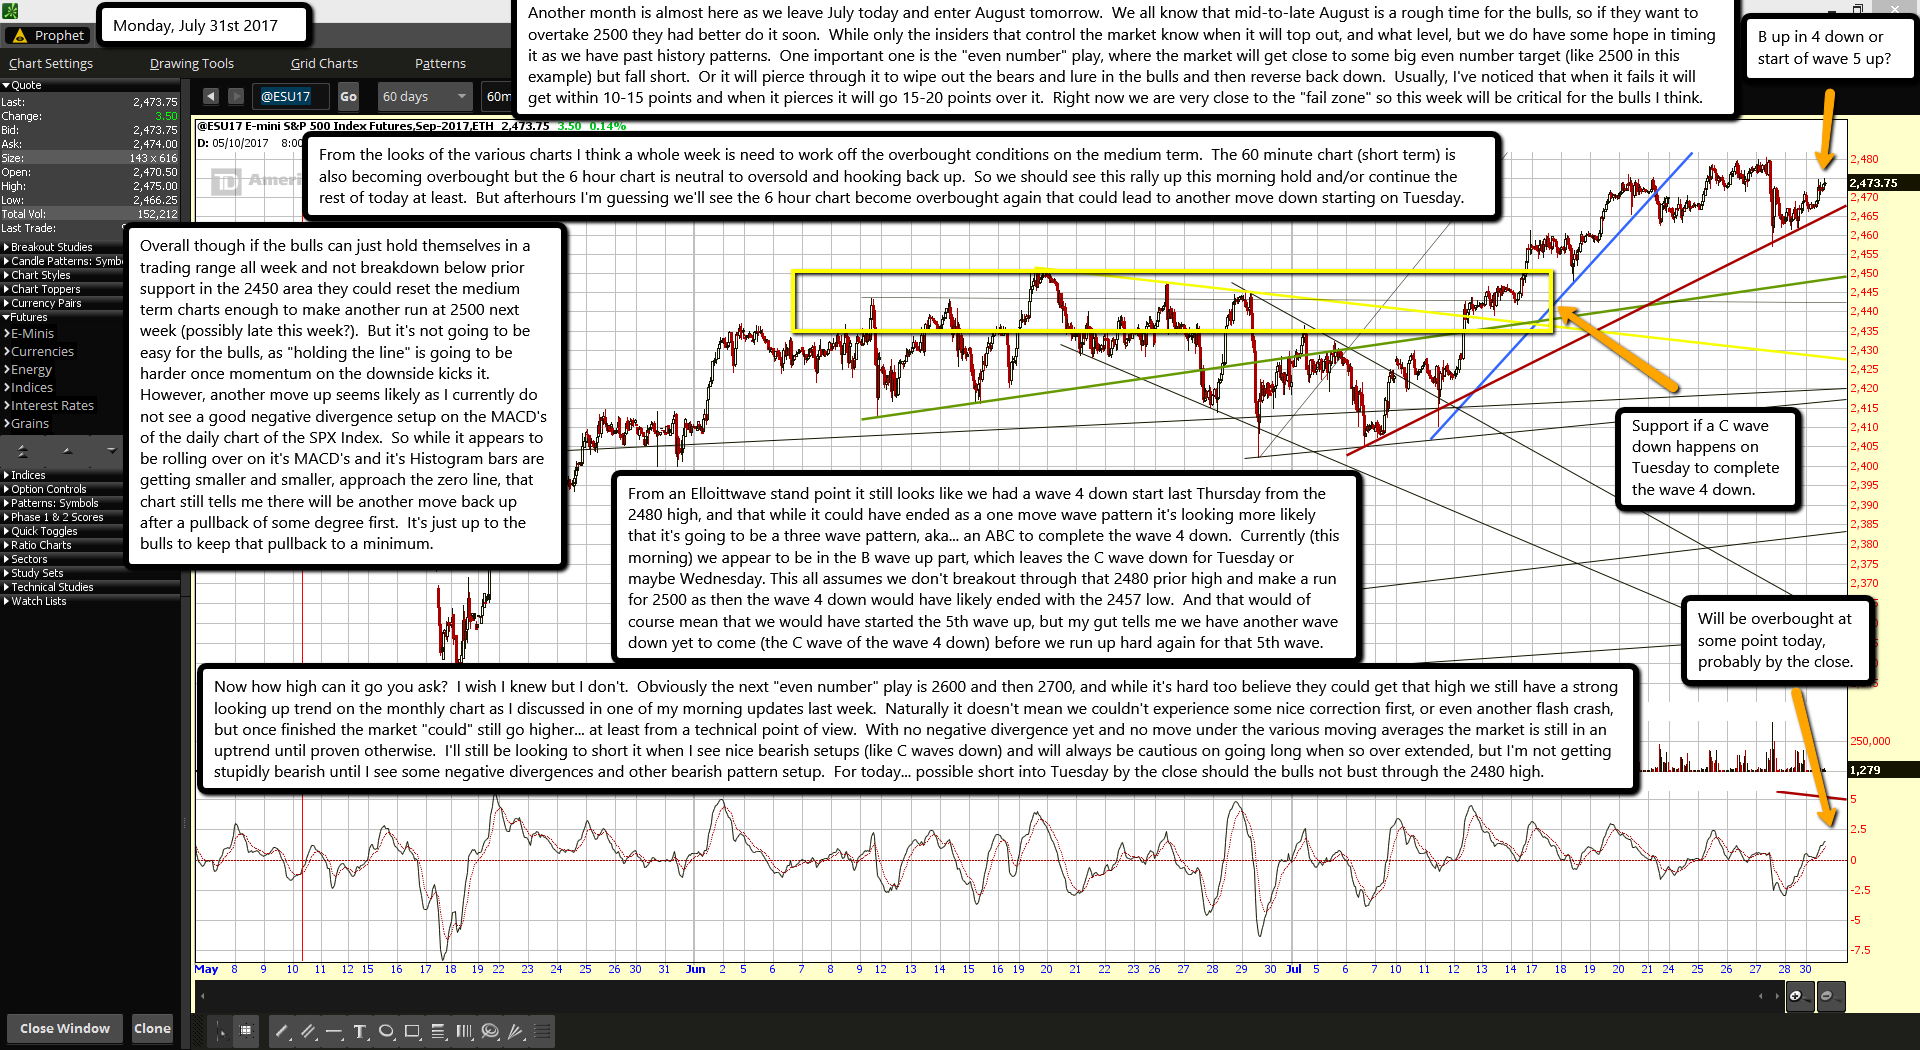
Another month is almost here as we leave July today and enter August tomorrow.  We all know that mid-to-late August is a rough time for the bulls, so if they want to overtake 2500 they had better do it soon.  While only the insiders that control the market know when it will top out, and what level, but we do have some hope in timing it as we have past history patterns.  One important one is the "even number" play, where the market will get close to some big even number target (like 2500 in this example) but fall short.  Or it will pierce through it to wipe out the bears and lure in the bulls and then reverse back down.  Usually, I've noticed that when it fails it will get within 10-15 points and when it pierces it will go 15-20 points over it.  Right now we are very close to the "fail zone" so this week will be critical for the bulls I think.

From the looks of the various charts I think a whole week is need to work off the overbought conditions on the medium term.  The 60 minute chart (short term) is also becoming overbought but the 6 hour chart is neutral to oversold and hooking back up.  So we should see this rally up this morning hold and/or continue the rest of today at least.  But afterhours I'm guessing we'll see the 6 hour chart become overbought again that could lead to another move down starting on Tuesday.

Overall though if the bulls can just hold themselves in a trading range all week and not breakdown below prior support in the 2450 area they could reset the medium term charts enough to make another run at 2500 next week (possibly late this week?).  But it's not going to be easy for the bulls, as "holding the line" is going to be harder once momentum on the downside kicks it.  However, another move up seems likely as I currently do not see a good negative divergence setup on the MACD's of the daily chart of the SPX Index.  So while it appears to be rolling over on it's MACD's and it's Histogram bars are getting smaller and smaller, approach the zero line, that chart still tells me there will be another move back up after a pullback of some degree first.  It's just up to the bulls to keep that pullback to a minimum.

From an Elloittwave stand point it still looks like we had a wave 4 down start last Thursday from the 2480 high, and that while it could have ended as a one move wave pattern it's looking more likely that it's going to be a three wave pattern, aka... an ABC to complete the wave 4 down.  Currently (this morning) we appear to be in the B wave up part, which leaves the C wave down for Tuesday or maybe Wednesday. This all assumes we don't breakout through that 2480 prior high and make a run for 2500 as then the wave 4 down would have likely ended with the 2457 low.  And that would of course mean that we would have started the 5th wave up, but my gut tells me we have another wave down yet to come (the C wave of the wave 4 down) before we run up hard again for that 5th wave.

Now how high can it go you ask?  I wish I knew but I don't.  Obviously the next "even number" play is 2600 and then 2700, and while it's hard too believe they could get that high we still have a strong looking up trend on the monthly chart as I discussed in one of my morning updates last week.  Naturally it doesn't mean we couldn't experience some nice correction first, or even another flash crash, but once finished the market "could" still go higher... at least from a technical point of view.  With no negative divergence yet and no move under the various moving averages the market is still in an uptrend until proven otherwise.  I'll still be looking to short it when I see nice bearish setups (like C waves down) and will always be cautious on going long when so over extended, but I'm not getting stupidly bearish until I see some negative divergences and other bearish pattern setup.  For today... possible short into Tuesday by the close should the bulls not bust through the 2480 high.

s2Member®