Is it over? Is it finally over? I mean the slaughtering of the bears last week of course. Not quite yet, as the bulls are just too close to 1150 to stop now. It would shock me if they didn't push up a little more and put in a double top. After that, well that another story...
It should be quite obvious to everyone by now that the big institutions haven't been buying or selling while this light volume market floats up to the clouds everyday. Why? Because they already bought at the low last February the 5th. They are now waiting for a final top to be put in before they unload again... to the unsuspecting public of course.
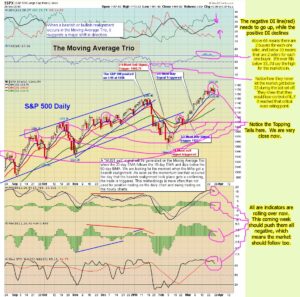
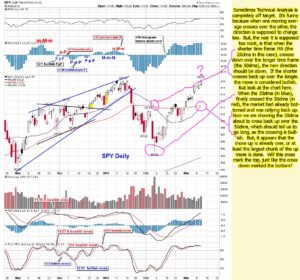
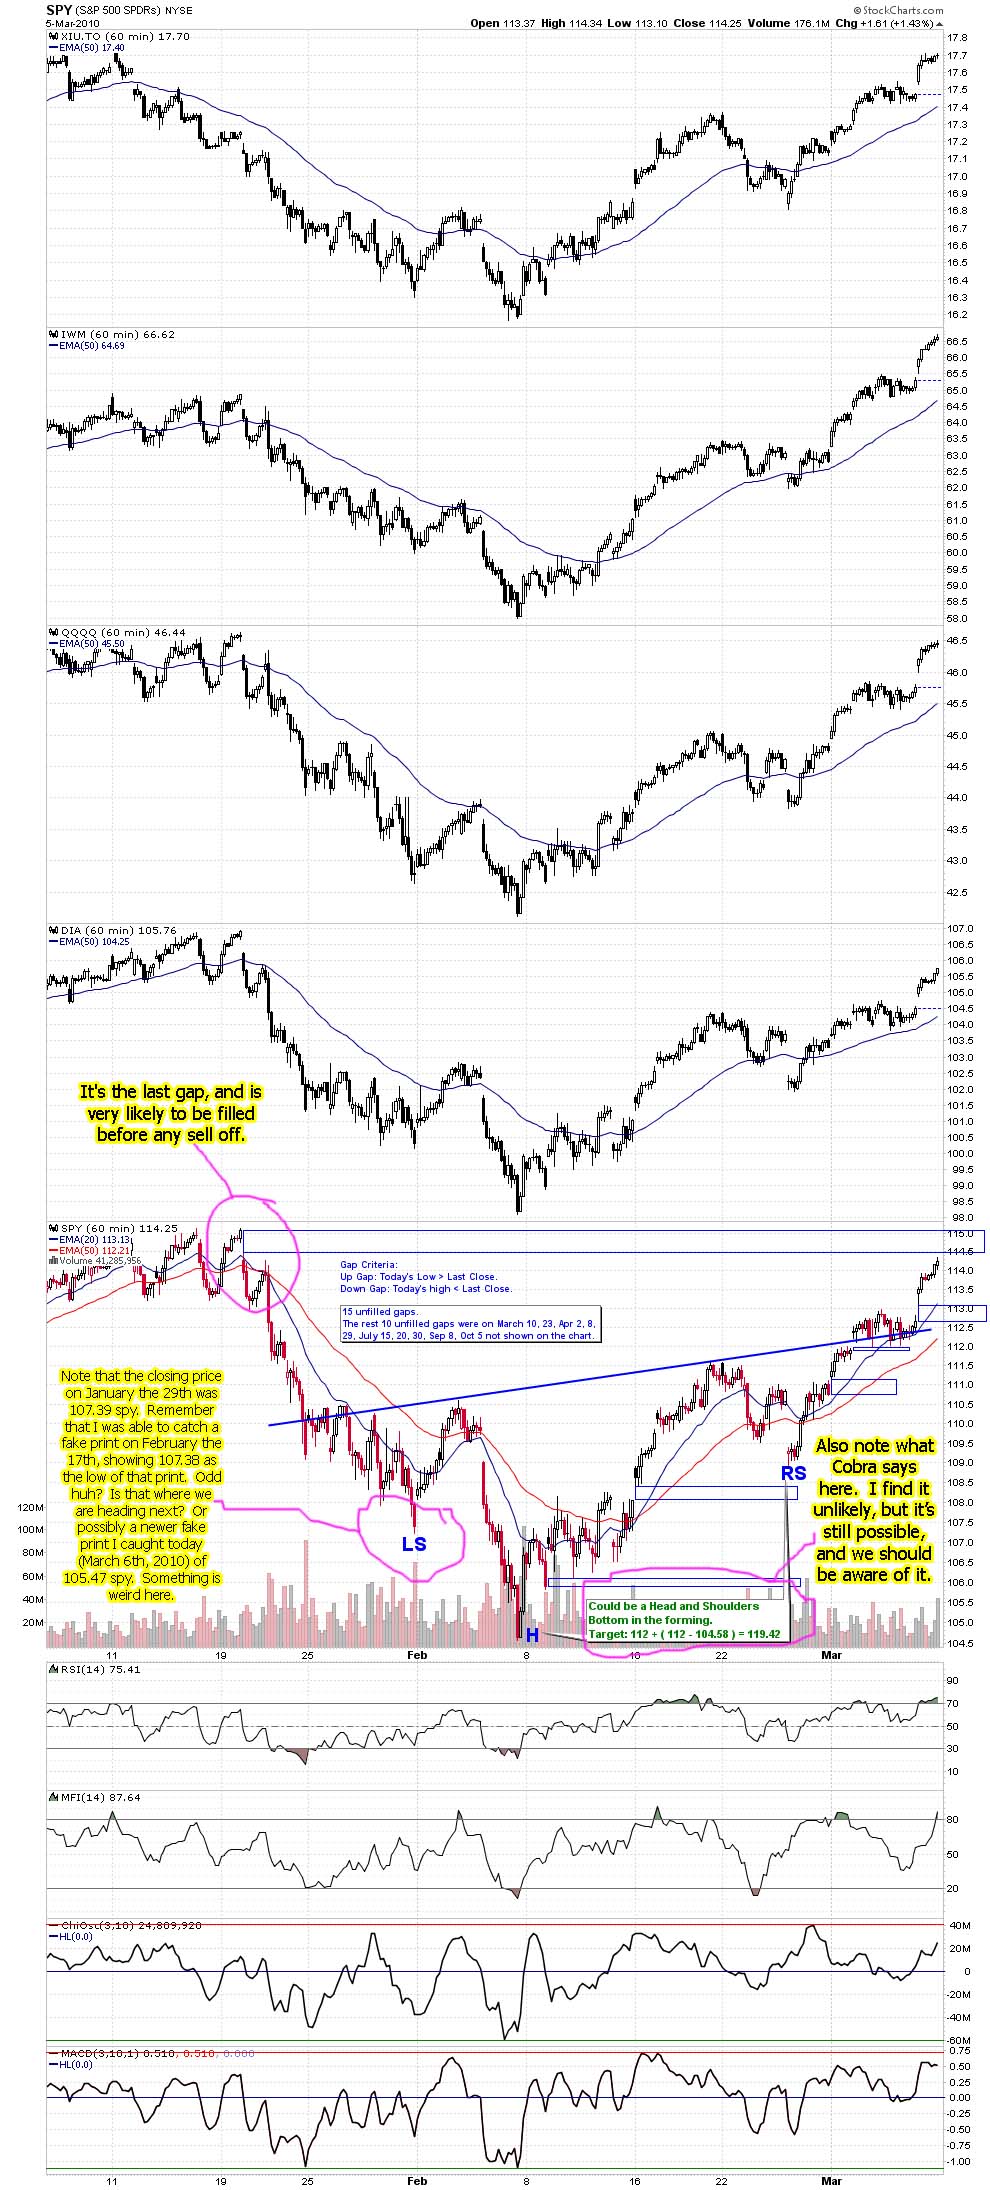
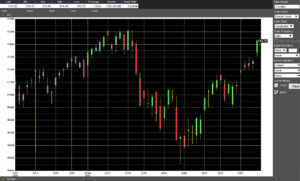
Look at this chart below (from Cobra's website) that shows where all the gaps are on the way up from that 104.58 spy low. (He drew rectangle boxes to point them out). Notice that there were also gaps on the way down from 115 to 104, and that all of those gaps have now been filled... except for one. That area between 114.50 and the 115.14 high still hasn't been filled. That's why the market will continue up on Monday or Tuesday most likely, and fill that gap.

In the chart above, note that the closing price on January the 29th was 107.39 spy. Remember that I was able to catch a fake print on February the 17th, showing 107.38 as the low of that print. Odd huh? Is that where we are heading next? Or possibly a newer fake print I caught today (March 6th, 2010) of 105.47 spy. Something is weird here.
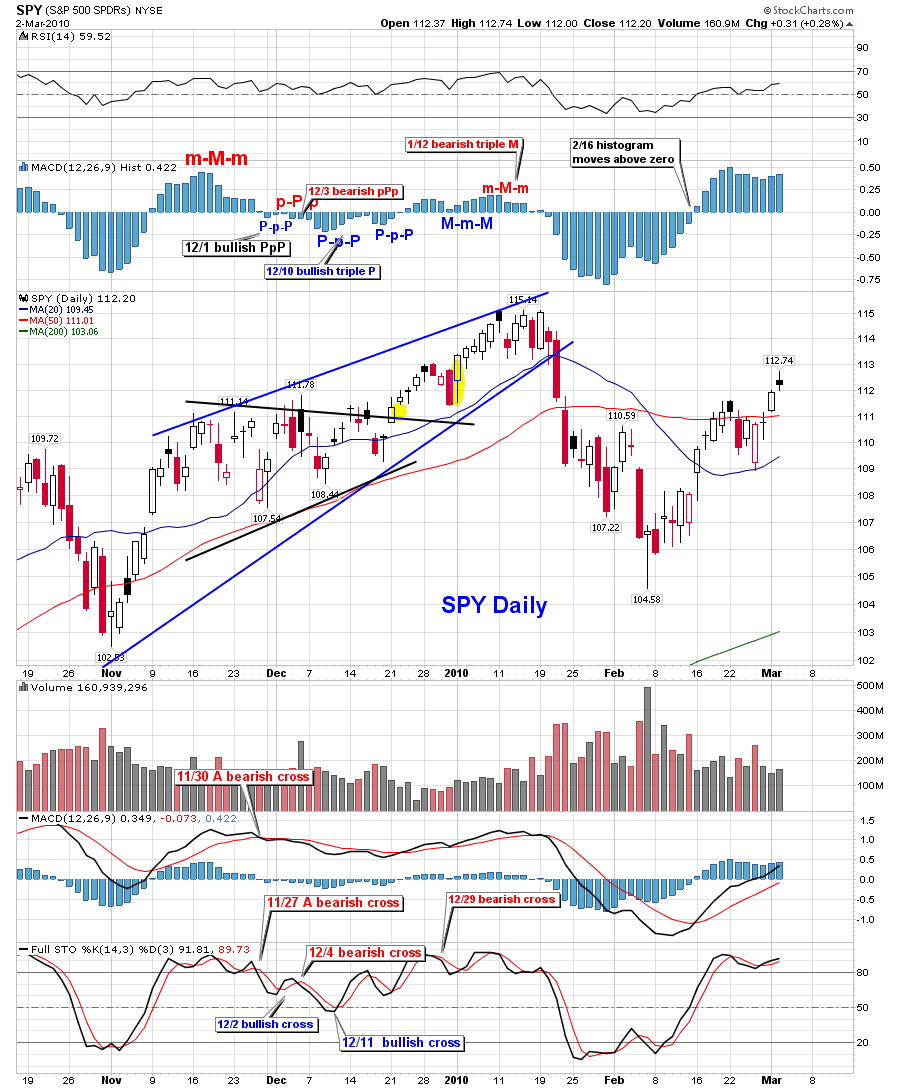
Maybe that print was always there, and I just missed it? I don't know? It's an old print now, as the date is from December 14th, 2009. Here's another one when I go back 6 months on the chart (I only went back 3 months in the chart above).

The low on November 18th, 2009 was 103.78 spy (that's the fake print number, not the real low for the day). Again, maybe these prints were already there, and maybe they don't mean anything. But, you should still keep those numbers in the back of your mind, as the previous major fake print of 1047.28 SPX did play out as the market dropped to 1044.50 just a month later on February the 5th, 2010. Of course it pierced the fake print level a little, but the hard reversal back up... with very large volume, was a clear sign that the fake print was accurate.
Back to next week...
What will cause a sell off to happen, you ask? How about some more bad news too be realized, so that the media will have something to blame the sell off on. The big institutions are going to start unloading those shares soon. When is still unknown? Since they haven't participated in buying on the way up, it's unlikely that they will start buying now, so that the market can push though the double top resistance and start a new bull rally.
I guess it's possible, but highly unlikely at this point. They have had plenty of bad news released in the last month to give them a reason to sell and take profits. I think we are going down to the 104 level for a double bottom. The 200dma is about there now, and probably will be at 104 by the time we get back down there.
How fast it gets there is really based on what level they want to close the SPY on by option expiration. I'm not sure if they will take one week, two weeks, or the rest of the month? Regardless, once they take it down to the level that have targeted (I'm only forecasting the double bottom area. It could only go down to put in a higher low), I do believe it will bounce back hard.
From that point... I don't know? Will the possible double bottom put in a solid support and allow a rally to go up and break the 1150 top? Or, will we only bounce to some Fib level, and then fall back again... taking out the 104 level on that trip?
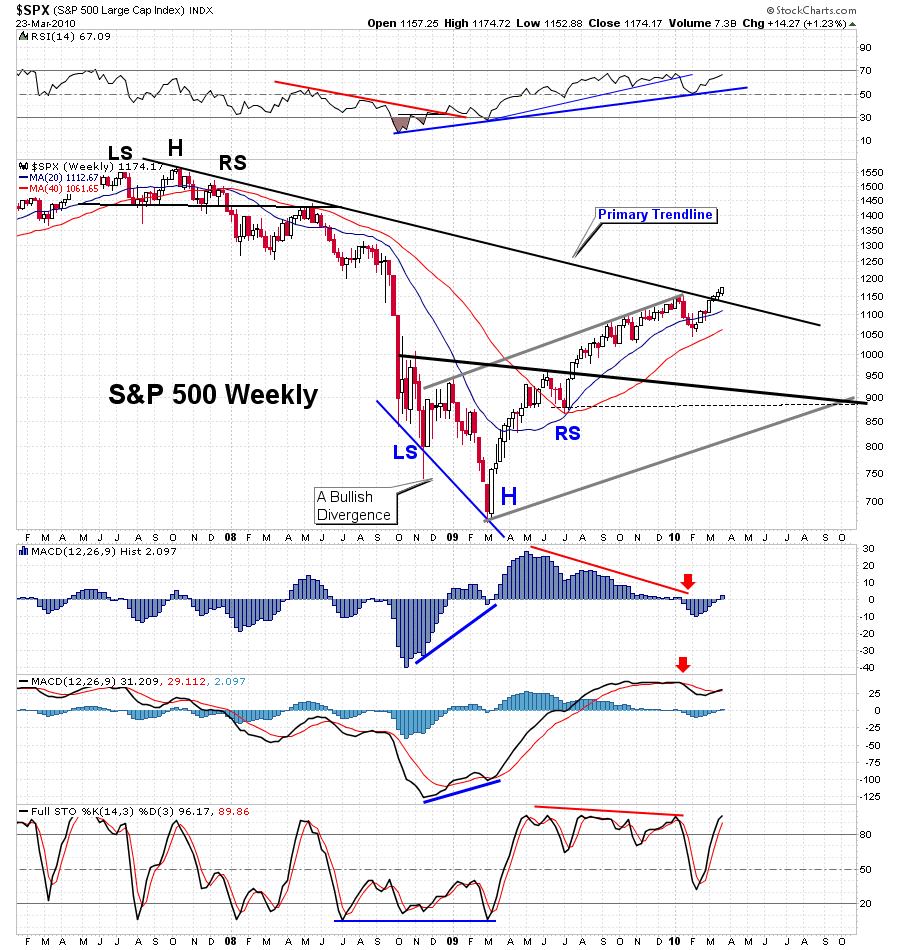
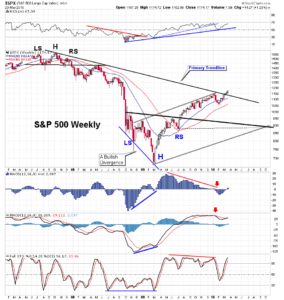
The weekly chart still hasn't had a cross back down on the moving averages. The 20ma is still above the 40ma, which tells me that the trend is still up. Also, the MACD is still putting in lower Histogram bars and they are still smaller, and rising to the zero mark. Will they cross and and go positive, putting in a lower tower then from the March 2009 area?

That will really depend on how much money the Fed's decide to pump back into the market. Right now, they are trying to pull back the quantitative easing. The average Joe trader doesn't have any money to put in this market, as they are probably trying to draw unemployment right now. The crooked banks aren't going to use their stolen profits to pump the market up more. So, that leaves the government.
At this point, the government is getting a lot of heat from other governments around the world, about the massive printing of the dollar. That of course devalues it, and since other countries hold dollar denominated notes of some kind, they stand to lose billions as the dollar goes down.
Which leads me to believe that the government can't afford to put too much more money into the market. That will put a topside limit on how high the market can go during the summer months. How high you ask? I can't answer that, as the top could already be in, or more stimulus money could push it up higher to 1300 or higher? The 200 week moving average is at 1227.67 today, and then there is the peak in May of 2008 around 1320 area. That would be the next level of resistance. It's too hard too tell right now.
My personal feeling is that they will go down to sideways throughout the summer, not taking out the 1150 high, but not totally crashing below 900 either. Then later this year, a big sell off. The in-between area from Spring to Summer could go either way?
Ok, enough of the longer term picture...
Let's move on to next week. Since there will probably be a ton of people waiting to go short at 1150, I don't think it will happen. Instead, I see two possibly scenario's. One, we go just shy of 1150, maybe to gap window on the 60 minute chart... which is about 114.50 spy, just a hair above where we closed on Friday. Then the sell off starts, not allowing the retail trader to get in on a short position. Or two, we go up to the 1150 level and pierce it by going a little higher. Anyone who went short would get squeezed, which would be the fuel needed to push up another 10 points or so.
Either way, a sell off is likely to occur afterwards. I really don't see the market getting through the double top, as a lot of bears are going to jump on at that level. I think they will continue adding short positions on any pierce of that level too. With that much selling pressure, and institutions wanting out of their long positions too, where is the money going to come from to rally higher? Will Goldman buy at 1150? I think not...
Most likely Goldman will be selling on every touch of 115, providing even more resistance to the unsuspecting retail bulls. We could trade flat for a few days, bouncing up to 115, and down to 112.50 while the big boys unload their shares. The problem with that idea is that they have very large positions, and when they really decide to sell their shares, the market will sell off hard.
However, it won't be the bears pushing the market down, it will be the big institutional bulls. So, I can see some light at the end of the tunnel now, as I believe this bull train is coming to a stop. Get your boarding tickets out bears, and be ready to climb aboard. Next stop... Dark Territory.
Red
_______________________________________________________
Update for Monday...
No point making a special post for Monday as this was about the flattest day of trading I've seen in a long time, and nothing has changed. The volume was the lowest all year, with only 106 million shares traded on the SPY. Since Monday's are usually the most bullish day of the week, and the spy only moved up .01 cents, not making a double top as many people expected... I'd say that's pretty bearish.
A big move is coming... up or down, who knows? I suspect down, but the market seems to fool me every time I say that. So, I'll only forecast a big move (I've ate enough crow to fill my belly for many weeks).
Red

