Sunday, July 26, 2026
Home Blog Page 62

ES Morning Update May 8th 2017

0

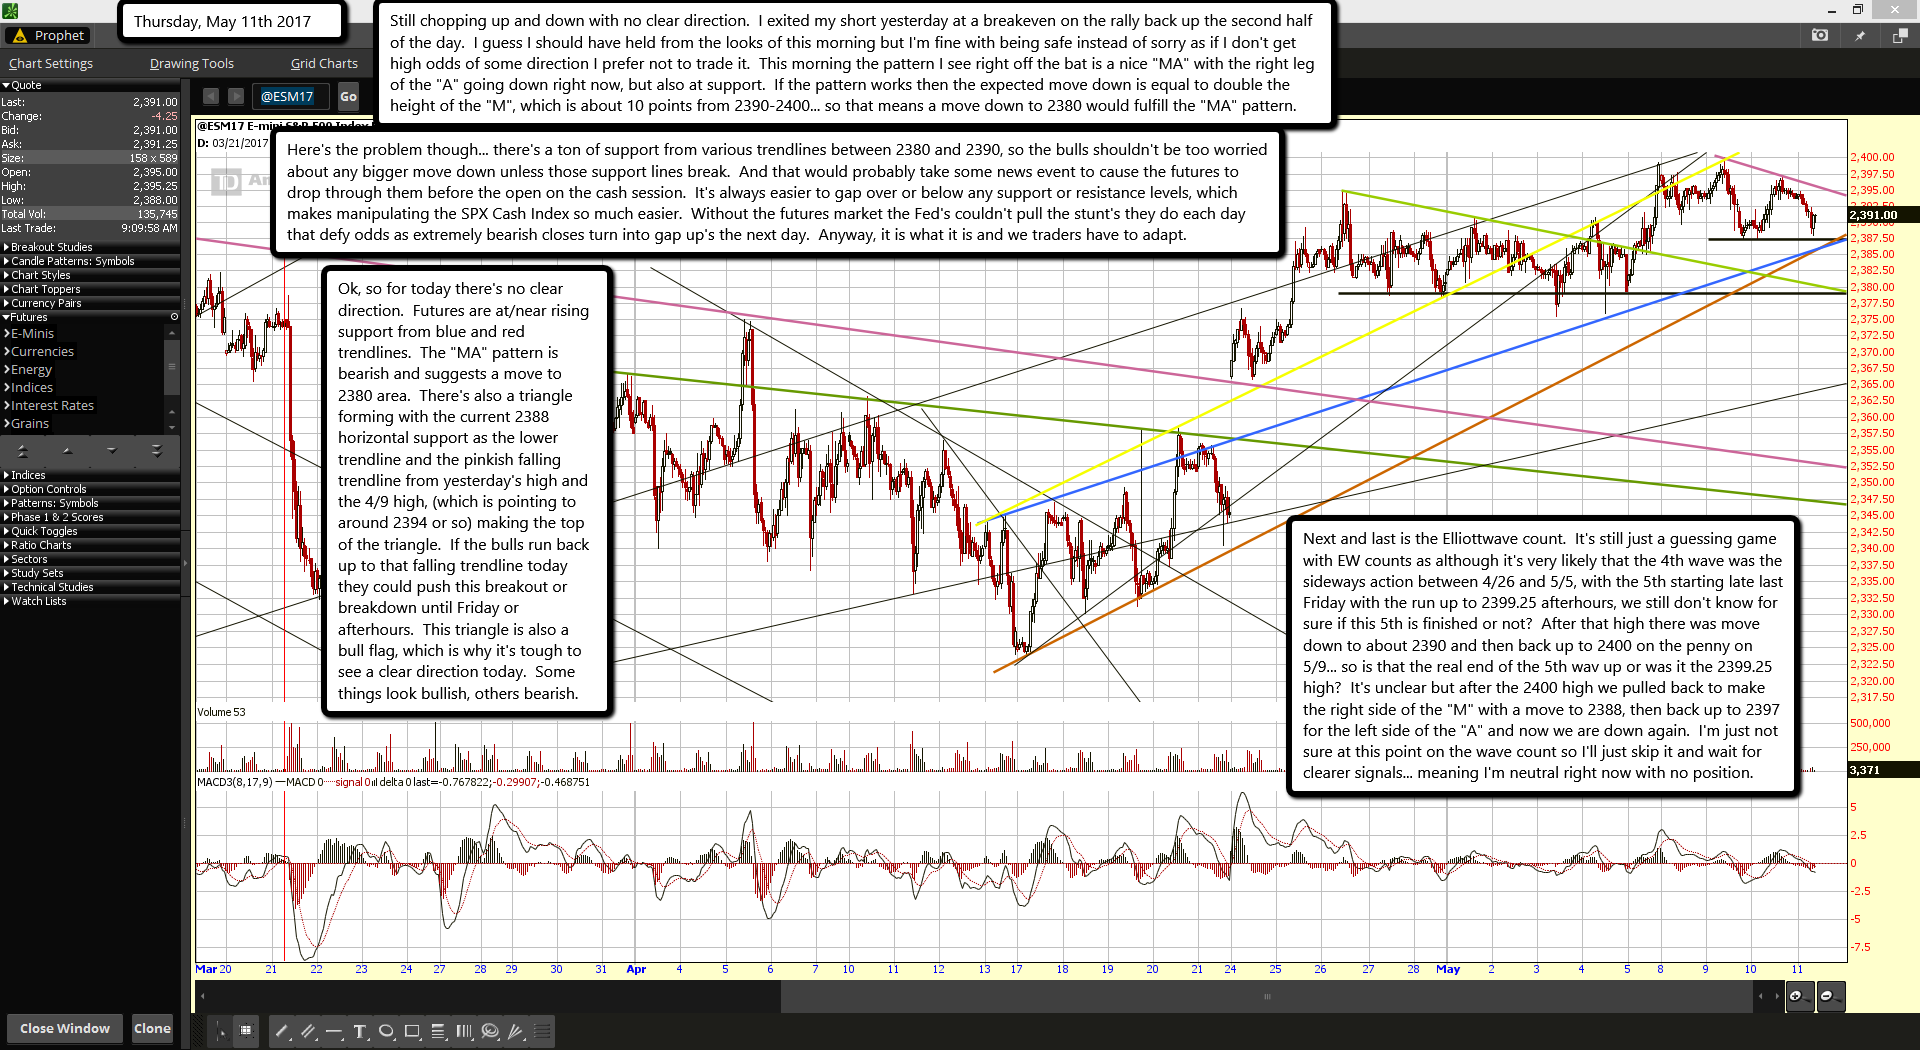
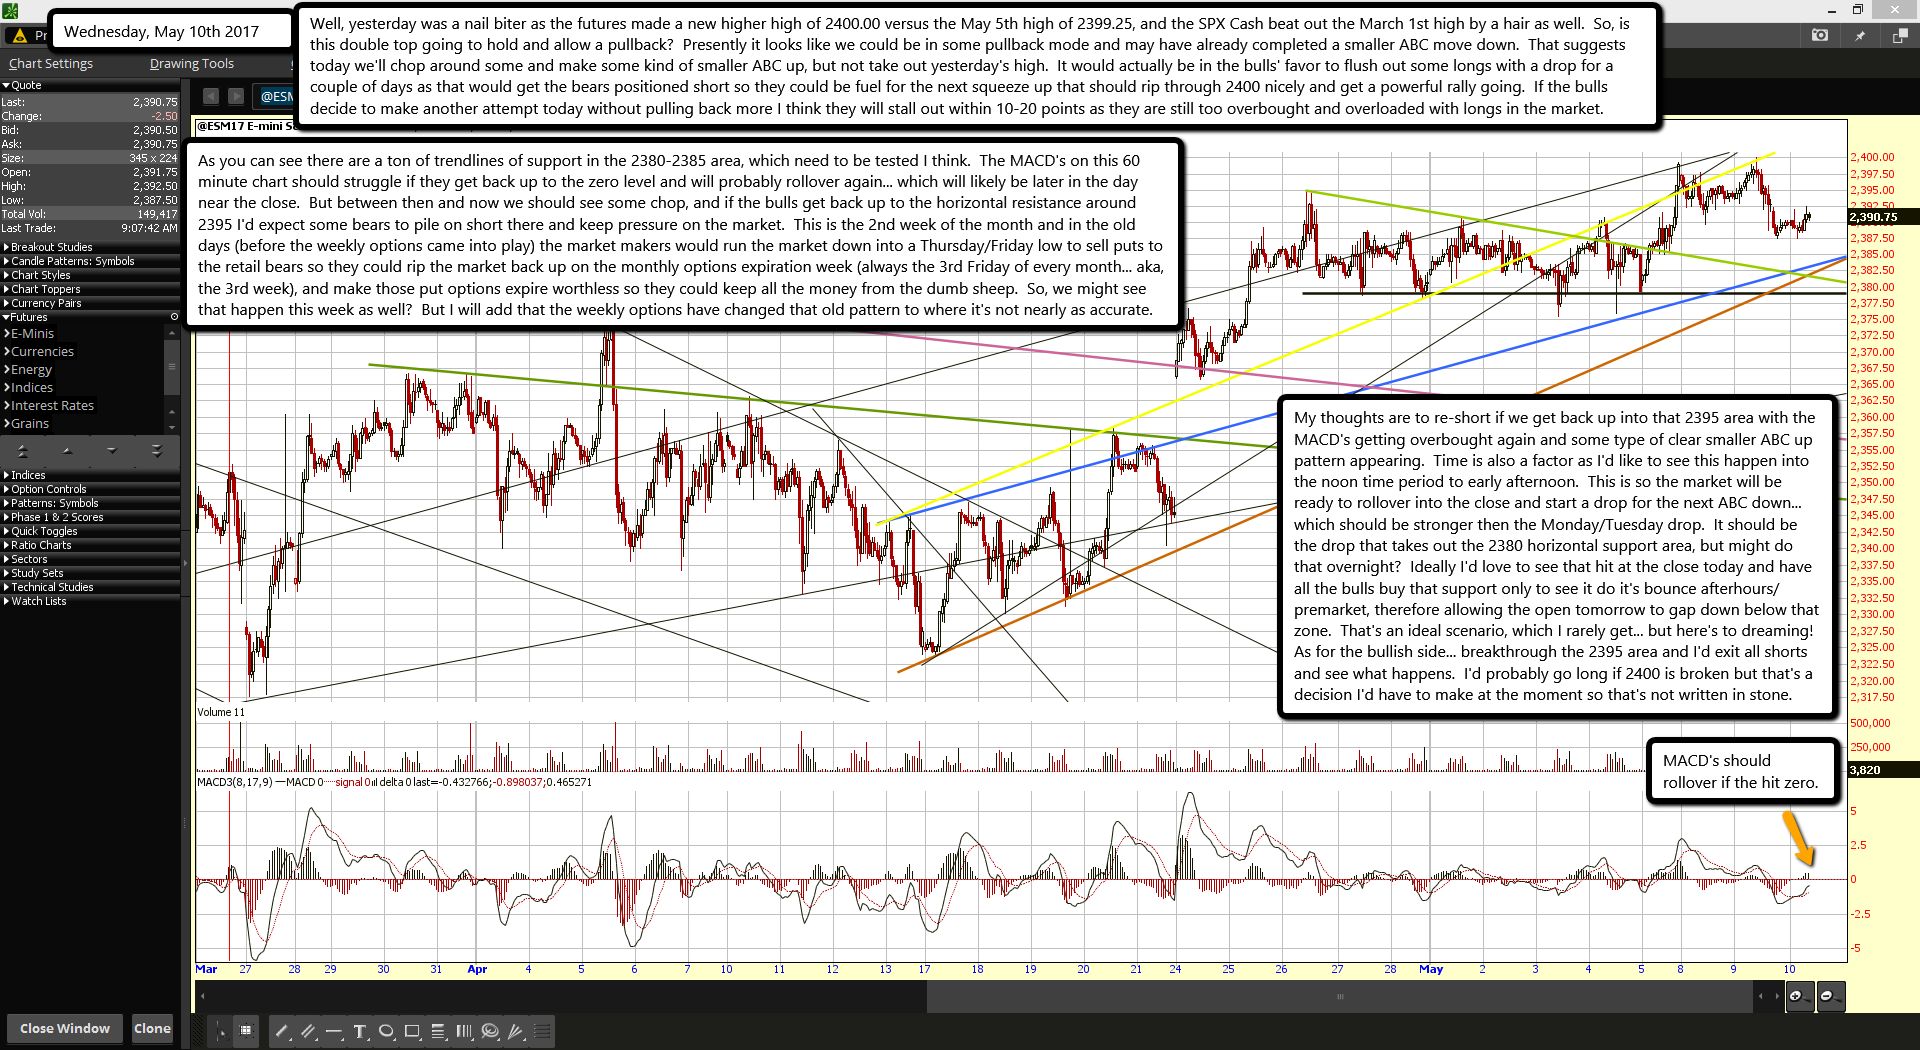
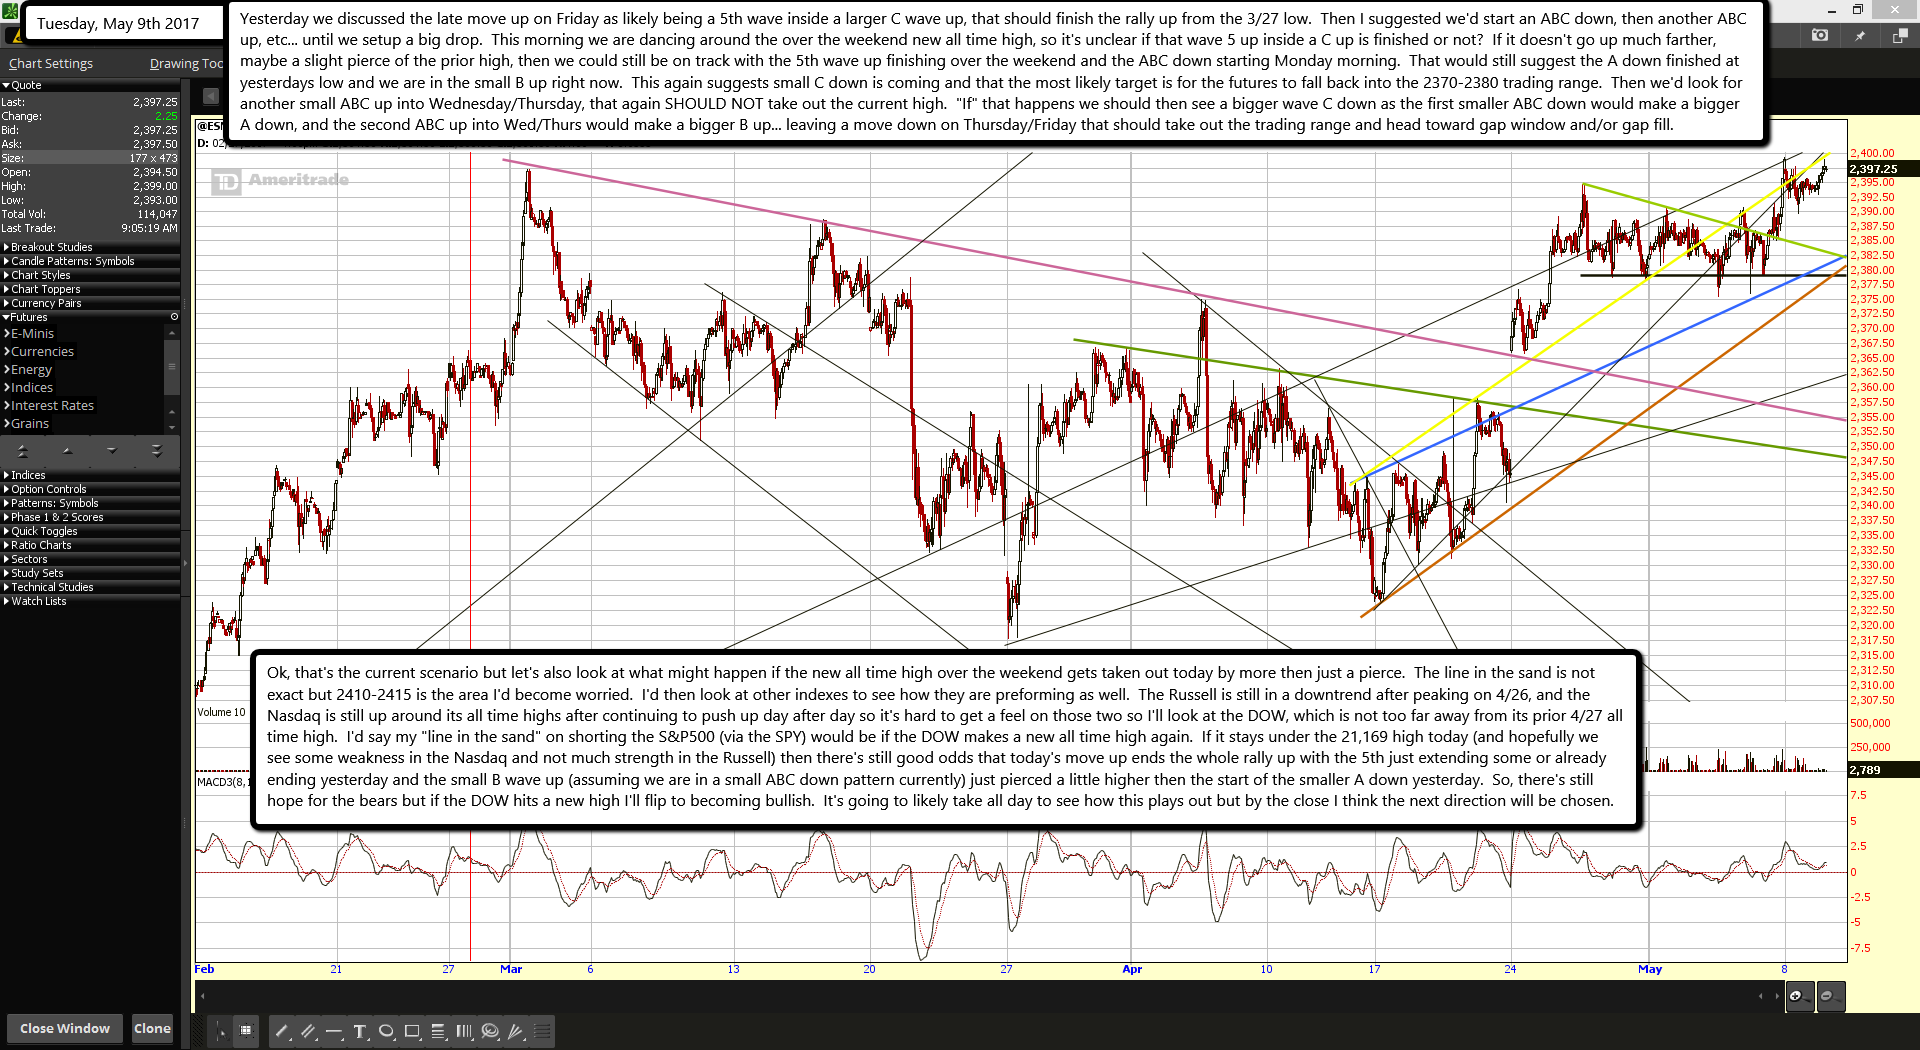
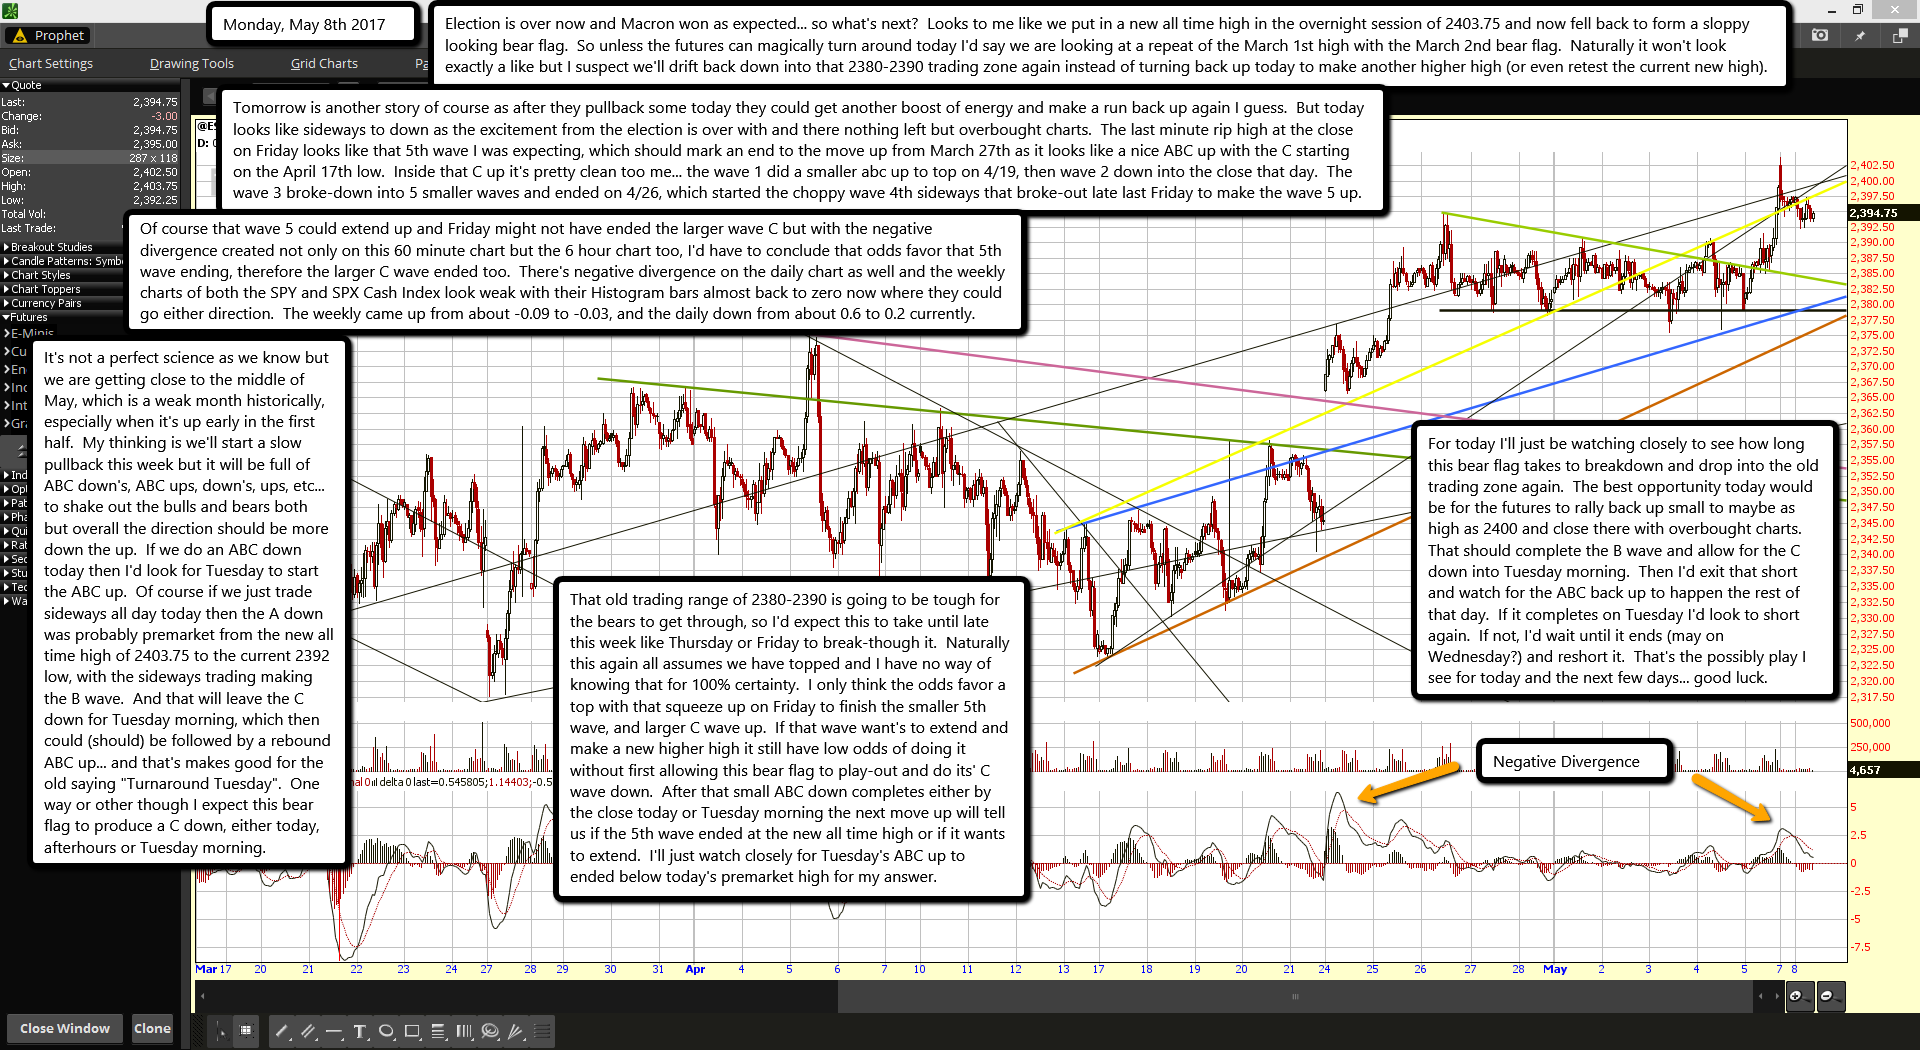
Election is over now and Macron won as expected... so what's next?  Looks to me like we put in a new all time high in the overnight session of 2403.75 and now fell back to form a sloppy looking bear flag.  So unless the futures can magically turn around today I'd say we are looking at a repeat of the March 1st high with the March 2nd bear flag.  Naturally it won't look exactly a like but I suspect we'll drift back down into that 2380-2390 trading zone again instead of turning back up today to make another higher high (or even retest the current new high).

Tomorrow is another story of course as after they pullback some today they could get another boost of energy and make a run back up again I guess.  But today looks like sideways to down as the excitement from the election is over with and there nothing left but overbought charts.  The last minute rip high at the close on Friday looks like that 5th wave I was expecting, which should mark an end to the move up from March 27th as it looks like a nice ABC up with the C starting on the April 17th low.  Inside that C up it's pretty clean too me... the wave 1 did a smaller abc up to top on 4/19, then wave 2 down into the close that day.  The wave 3 broke-down into 5 smaller waves and ended on 4/26, which started the choppy wave 4th sideways that broke-out late last Friday to make the wave 5 up.

Of course that wave 5 could extend up and Friday might not have ended the larger wave C but with the negative divergence created not only on this 60 minute chart but the 6 hour chart too, I'd have to conclude that odds favor that 5th wave ending, therefore the larger C wave ended too.  There's negative divergence on the daily chart as well and the weekly charts of both the SPY and SPX Cash Index look weak with their Histogram bars almost back to zero now where they could go either direction.  The weekly came up from about -0.09 to -0.03, and the daily down from about 0.6 to 0.2 currently.

It's not a perfect science as we know but we are getting close to the middle of May, which is a weak month historically, especially when it's up early in the first half.  My thinking is we'll start a slow pullback this week but it will be full of ABC down's, ABC ups, down's, ups, etc... to shake out the bulls and bears both but overall the direction should be more down the up.  If we do an ABC down today then I'd look for Tuesday to start the ABC up.  Of course if we just trade sideways all day today then the A down was probably premarket from the new all time high of 2403.75 to the current 2392 low, with the sideways trading making the B wave.  And that will leave the C down for Tuesday morning, which then could (should) be followed by a rebound ABC up... and that's makes good for the old saying "Turnaround Tuesday".  One way or other though I expect this bear flag to produce a C down, either today, afterhours or Tuesday morning.

That old trading range of 2380-2390 is going to be tough for the bears to get through, so I'd expect this to take until late this week like Thursday or Friday to break-though it.  Naturally this again all assumes we have topped and I have no way of knowing that for 100% certainty.  I only think the odds favor a top with that squeeze up on Friday to finish the smaller 5th wave, and larger C wave up.  If that wave want's to extend and make a new higher high it still have low odds of doing it without first allowing this bear flag to play-out and do its' C wave down.  After that small ABC down completes either by the close today or Tuesday morning the next move up will tell us if the 5th wave ended at the new all time high or if it wants to extend.  I'll just watch closely for Tuesday's ABC up to ended below today's premarket high for my answer.

For today I'll just be watching closely to see how long this bear flag takes to breakdown and drop into the old trading zone again.  The best opportunity today would be for the futures to rally back up small to maybe as high as 2400 and close there with overbought charts.  That should complete the B wave and allow for the C down into Tuesday morning.  Then I'd exit that short and watch for the ABC back up to happen the rest of that day.  If it completes on Tuesday I'd look to short again.  If not, I'd wait until it ends (may on Wednesday?) and reshort it.  That's the possibly play I see for today and the next few days... good luck.

French election results: Macron defeats Le Pen to become President

0

The French election results show Emmanuel Macron has beat Marine Le Pen to become President of France, with early predictions showing that 65 per cent of the country voted for him.

Such a comfortable Macron win was be in line with what pollsters have been saying for weeks, with most polls saying that the 39-year-old centrist would win with a lead of around 20 points.

His final lead, of 30 points, dwarved even this.

Macron swept the board geographically, with Le Pen winning just a handful of France's departments.

Even in areas that heavily backed the far-right candidate in the first round, such as the north-east of the country, voters turned to Macron when it mattered.

Over a quarter of French people were estimated to have abstained in the second round of the election.

This seems to confirm fears over the most recent polls, which had been indicating that large numbers of supporters for the conservative Francois Fillon and the far-Left Jean-Luc Mélenchon decided to stay at home on election day.

The vote is after Macron won the first round of voting on 23 April with 23.8 per cent of the vote, while Le Pen came in second place with 21.5 per cent.

Macron and Le Pen both progressed from the first round in the race for the French presidency, after securing 45.3 per cent of the vote between them.

As the top two candidates, they were then pitted against each other again in the second round.

Of the nine elections since the Fifth Republic's first direct presidential election in 1965, three have seen the winner of the first round lose out in the second. This led to the elections of Valéry Giscard d'Estaing in 1974, François Mitterrand in 1981 and Jacques Chirac in 1995.

Macron was widely tipped to win before the vote. In the Telegraph's poll tracker, the final polling average predicted that he would take 62 per cent of the vote in the second-round run-off against Le Pen.

It was expected that Macron - a centrist - would be able to attract a wider spectrum of second-round voters than Le Pen, pulling in left-leaning voters from Hamon and Mélenchon as well as those leaning to the right who voted Fillon in the first round.

The first round showcased an East-West divide in France

Marine Le Pen achieved her highest vote shares in the North East of France when she failed to make the second round in 2012.

It was no different this time around with there being a clear East-West divide in the way that the country voted on Sunday.

Le Pen attracted her highest vote share in the department of Aisne, to the North East of Paris. More than one in three votes went to the Front National leader in Aisne - double the number that went to Macron.

However, support for Le Pen within Paris was conspicuous by its absence. Fewer than one in 20 voters cast their ballots for the far-right leader. This is a lower proportion than who did so in 2012.

Three days on from a terror attack in the capital that claimed the life of a police officer, it makes Paris one of just four areas of the country where Front National support fell compared to 2012.

Macron scooped up 34.8 per cent of the vote in Paris, his strongest area of support.

Aside from in Paris, though, Macron's vote share tended to be higher in the North western areas of France; areas like Ille et Vilaine and Finistere in Brittany.

Education and employment were driving factors

Pollingprior to the election indicated that two of the biggest dividing factors between Macron and Le Pen supporters would be education and employment. And so it proved.

In much the same way that one of Donald Trump's main pledges was to provide more jobs for Americans, Le Pen's brand of nationalism also promised to boost the economic prospects of French citizens.

This cut through in 2012 and has done the trick again in 2017 with areas of low economic activity far more likely to vote for her than for Macron.

ES Morning Update May 5th 2017

0

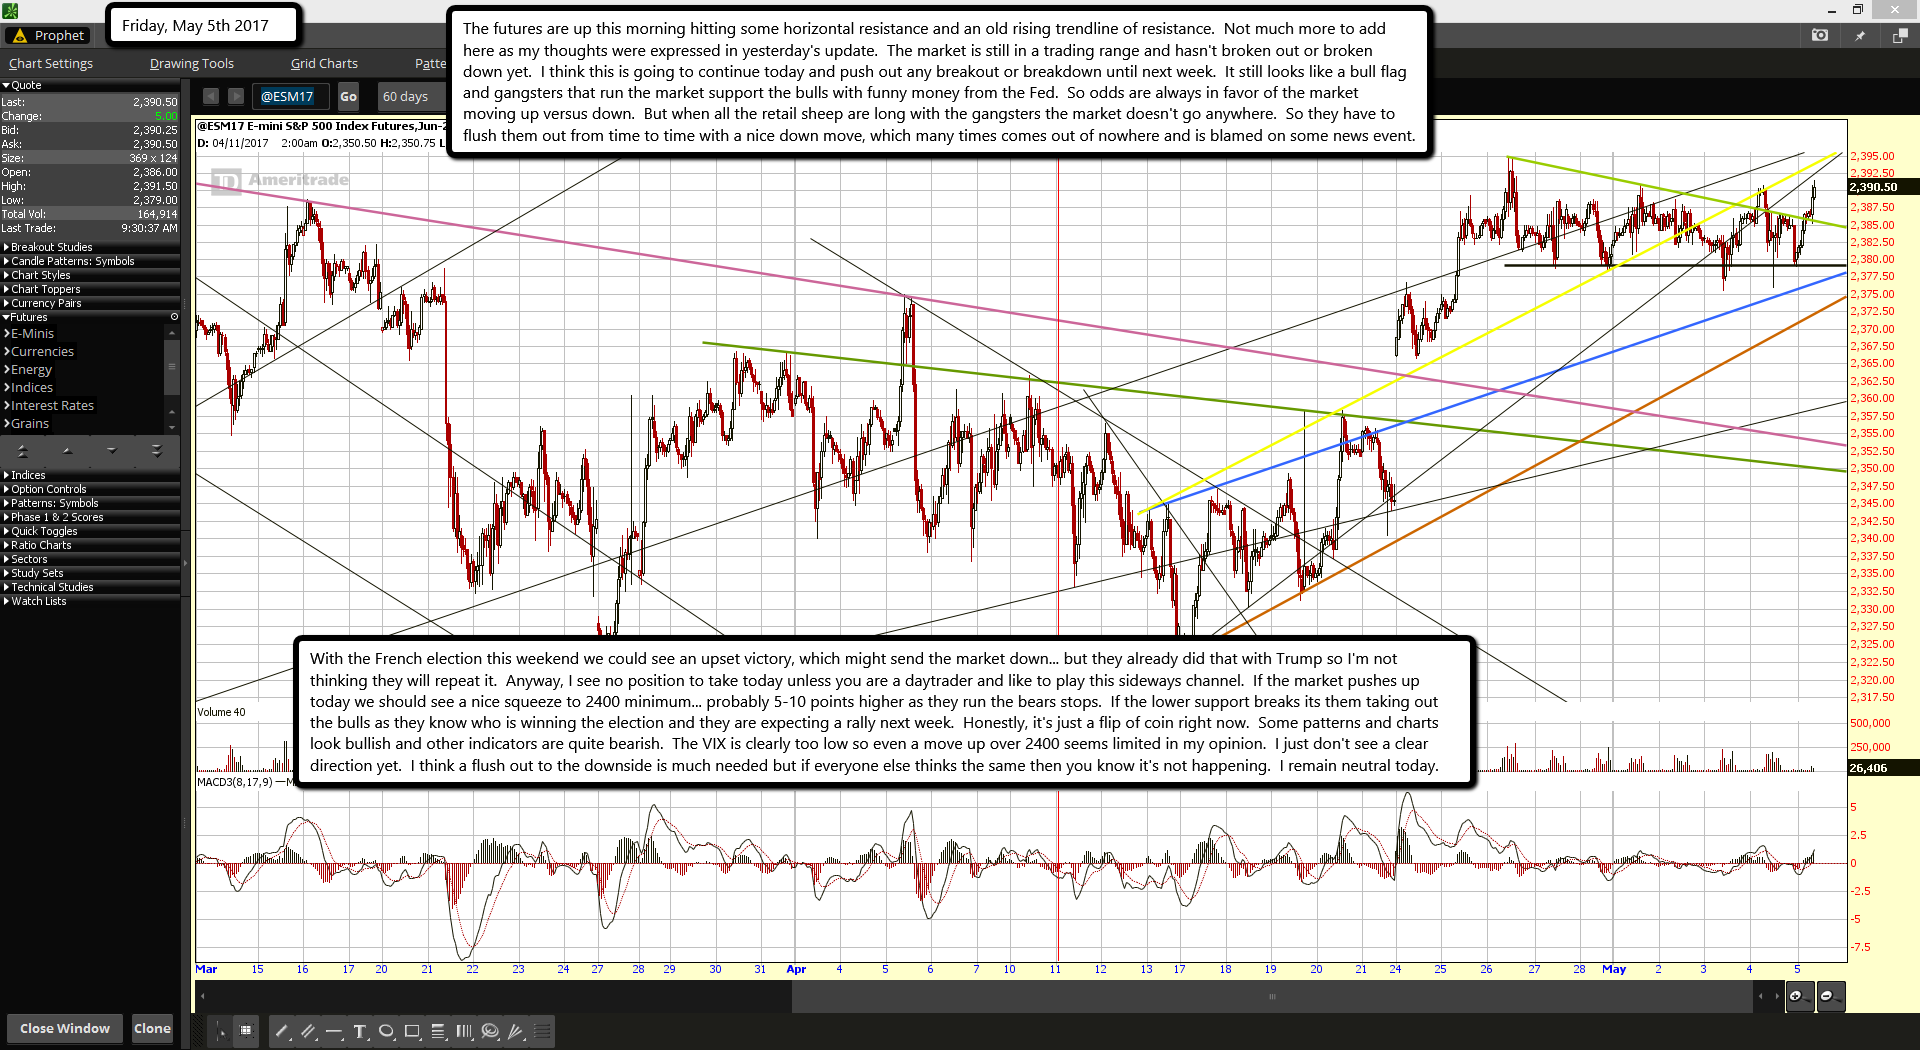
The futures are up this morning hitting some horizontal resistance and an old rising trendline of resistance.  Not much more to add here as my thoughts were expressed in yesterday's update.  The market is still in a trading range and hasn't broken out or broken down yet.  I think this is going to continue today and push out any breakout or breakdown until next week.  It still looks like a bull flag and gangsters that run the market support the bulls with funny money from the Fed.  So odds are always in favor of the market moving up versus down.  But when all the retail sheep are long with the gangsters the market doesn't go anywhere.  So they have to flush them out from time to time with a nice down move, which many times comes out of nowhere and is blamed on some news event.

With the French election this weekend we could see an upset victory, which might send the market down... but they already did that with Trump so I'm not thinking they will repeat it.  Anyway, I see no position to take today unless you are a daytrader and like to play this sideways channel.  If the market pushes up today we should see a nice squeeze to 2400 minimum... probably 5-10 points higher as they run the bears stops.  If the lower support breaks its them taking out the bulls as they know who is winning the election and they are expecting a rally next week.  Honestly, it's just a flip of coin right now.  Some patterns and charts look bullish and other indicators are quite bearish.  The VIX is clearly too low so even a move up over 2400 seems limited in my opinion.  I just don't see a clear direction yet.  I think a flush out to the downside is much needed but if everyone else thinks the same then you know it's not happening.  I remain neutral today.

EU Warns Emotions Getting Out of Hand on Brexit

0

European Council President Donald Tusk warned that unrestrained “emotions” could make Brexit talks “impossible” in a veiled swipe at British prime minister Theresa May.

The head of the European Union’s strategic body tweeted Thursday: “ #Brexit talks difficult enough. If emotions get out of hand, they'll become impossible. Discretion, moderation and mutual respect needed.”

“At stake are the daily lives and interests of millions of people on both sides of the Channel,” he added in a second tweet.

Tusk’s comments com e a day after May accused continental European politicians of meddling in the upcoming U.K. general election.

Speaking outside her office at Downing Street in London on Wednesday, May said EU politicians had made a series of interventions into the debate on upcoming Brexit negotiations “deliberately timed” to influence the result of the vote. Her comments came after supposed leaks from a dinner between May and European Commission President Jean-Claude Juncker suggested Brexit talks were not going well.

The barely masked exchange between May and Tusk highlights the bad blood growing between the two sets of negotiating partners in London and Brussels.

With the U.K. embroiled in an election campaign, the temptation for May is to ramp up the anti-European rhetoric making headlines, always a surefire vote winner for her center-right Conservative Party.

But with a return to government near certain, May cannot afford to upset the people with whom she would have to hammer out a Brexit deal.

Charles Grant, director of the Center for European Reform, said on Twitter that May had misunderstood Brussels’ politicians’ motives.

“May wrong to say EU people interfering in [the general election],” he wrote. “In fact they want her to win big, so she has the strength to compromise on Brexit.”

Brexit talks are set to begin after the U.K.’s general election on June 8, and slated to finish at the end of 2018. This is to give national parliaments enough time to approve any deal agreed before Britain leaves the bloc in early 2019.

Polls give May a lead of almost 20 percent on her nearest rival, Jeremy Corbyn of the center-left Labour Party.


Interesting timeline as I see this whole stock market topping out in 2018 and starting a huge crash in 2019!

Red

ES Morning Update May 4th 2017

0

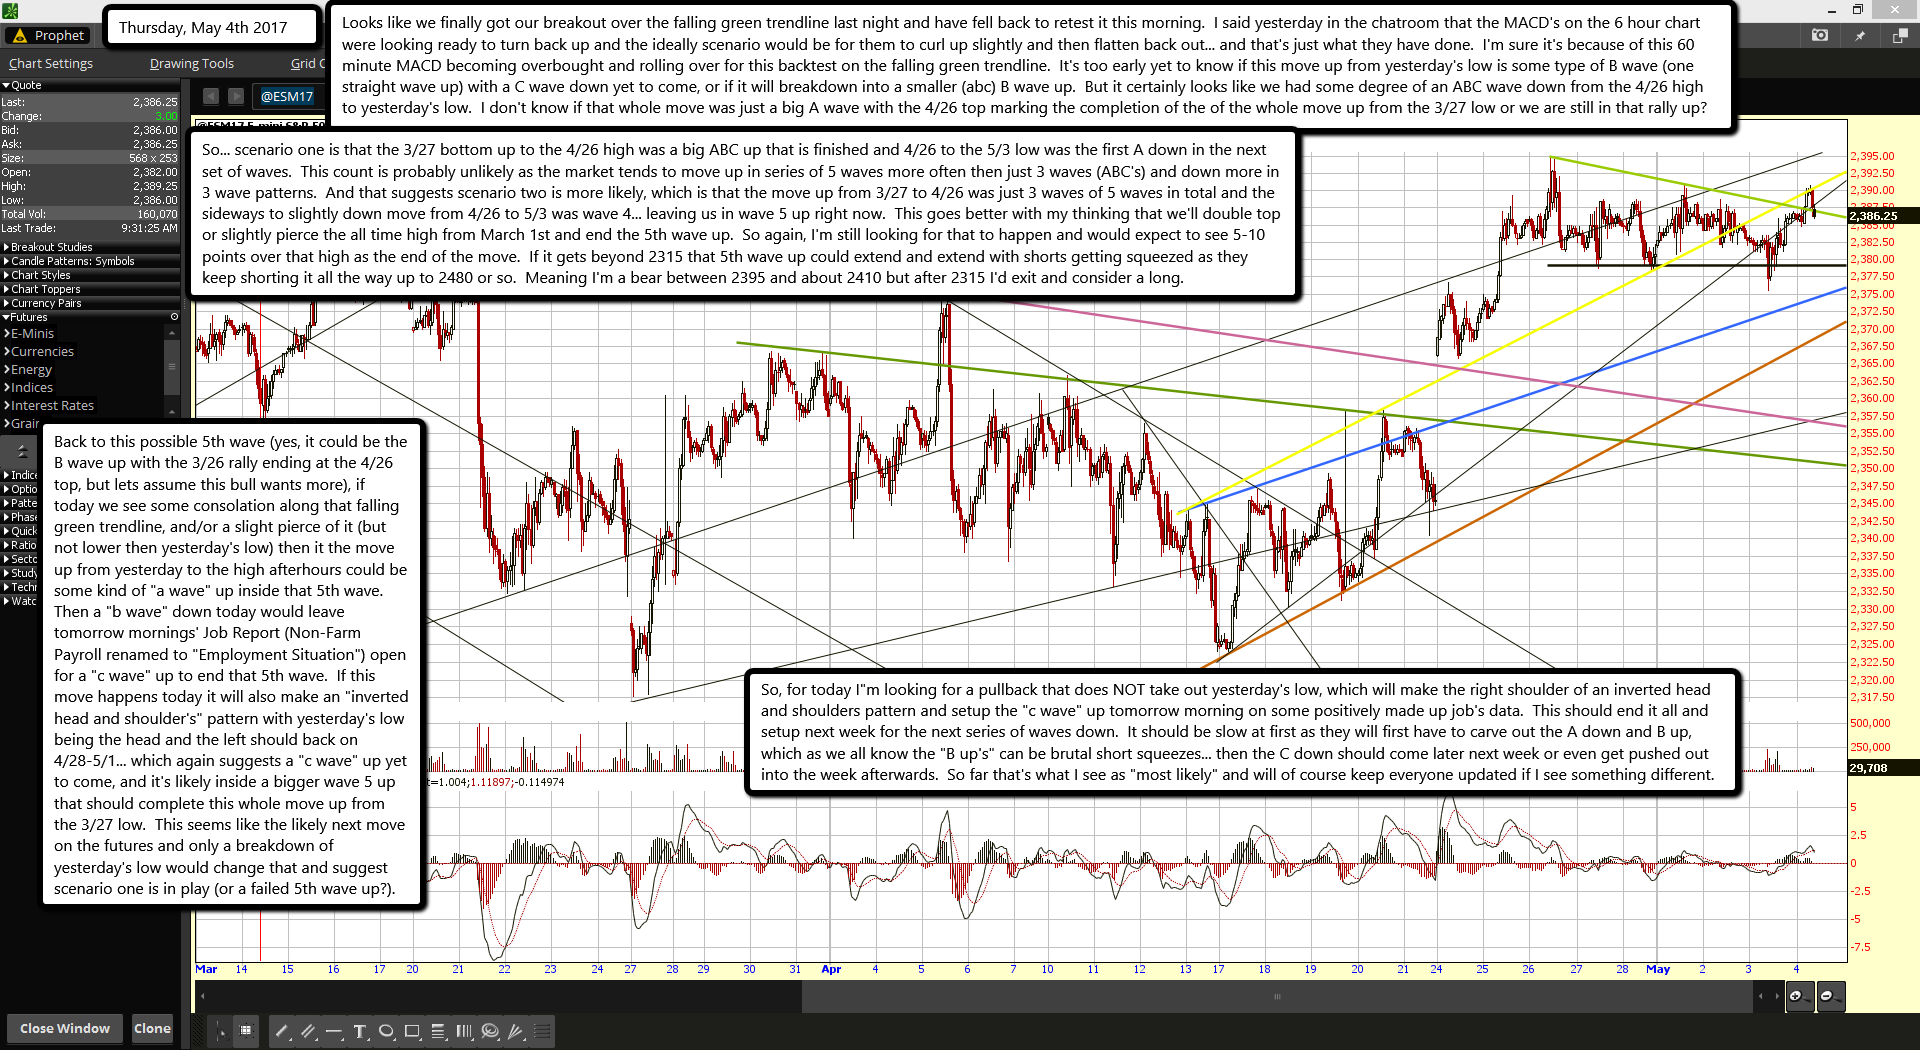
Looks like we finally got our breakout over the falling green trendline last night and have fell back to retest it this morning.  I said yesterday in the chatroom that the MACD's on the 6 hour chart were looking ready to turn back up and the ideally scenario would be for them to curl up slightly and then flatten back out... and that's just what they have done.  I'm sure it's because of this 60 minute MACD becoming overbought and rolling over for this backtest on the falling green trendline.  It's too early yet to know if this move up from yesterday's low is some type of B wave (one straight wave up) with a C wave down yet to come, or if it will breakdown into a smaller (abc) B wave up.  But it certainly looks like we had some degree of an ABC wave down from the 4/26 high to yesterday's low.  I don't know if that whole move was just a big A wave with the 4/26 top marking the completion of the of the whole move up from the 3/27 low or we are still in that rally up?

So... scenario one is that the 3/27 bottom up to the 4/26 high was a big ABC up that is finished and 4/26 to the 5/3 low was the first A down in the next set of waves.  This count is probably unlikely as the market tends to move up in series of 5 waves more often then just 3 waves (ABC's) and down more in 3 wave patterns.  And that suggests scenario two is more likely, which is that the move up from 3/27 to 4/26 was just 3 waves of 5 waves in total and the sideways to slightly down move from 4/26 to 5/3 was wave 4... leaving us in wave 5 up right now.  This goes better with my thinking that we'll double top or slightly pierce the all time high from March 1st and end the 5th wave up.  So again, I'm still looking for that to happen and would expect to see 5-10 points over that high as the end of the move.  If it gets beyond 2315 that 5th wave up could extend and extend with shorts getting squeezed as they keep shorting it all the way up to 2480 or so.  Meaning I'm a bear between 2395 and about 2410 but after 2315 I'd exit and consider a long.

Back to this possible 5th wave (yes, it could be the B wave up with the 3/26 rally ending at the 4/26 top, but lets assume this bull wants more), if today we see some consolation along that falling green trendline, and/or a slight pierce of it (but not lower then yesterday's low) then it the move up from yesterday to the high afterhours could be some kind of "a wave" up inside that 5th wave.  Then a "b wave" down today would leave tomorrow mornings' Job Report (Non-Farm Payroll renamed to "Employment Situation") open for a "c wave" up to end that 5th wave.  If this move happens today it will also make an "inverted head and shoulder's" pattern with yesterday's low being the head and the left should back on 4/28-5/1... which again suggests a "c wave" up yet to come, and it's likely inside a bigger wave 5 up that should complete this whole move up from the 3/27 low.  This seems like the likely next move on the futures and only a breakdown of yesterday's low would change that and suggest scenario one is in play (or a failed 5th wave up?).

So, for today I"m looking for a pullback that does NOT take out yesterday's low, which will make the right shoulder of an inverted head and shoulders pattern and setup the "c wave" up tomorrow morning on some positively made up job's data.  This should end it all and setup next week for the next series of waves down.  It should be slow at first as they will first have to carve out the A down and B up, which as we all know the "B up's" can be brutal short squeezes... then the C down should come later next week or even get pushed out into the week afterwards.  So far that's what I see as "most likely" and will of course keep everyone updated if I see something different.

ES Morning Update May 3rd 2017

0

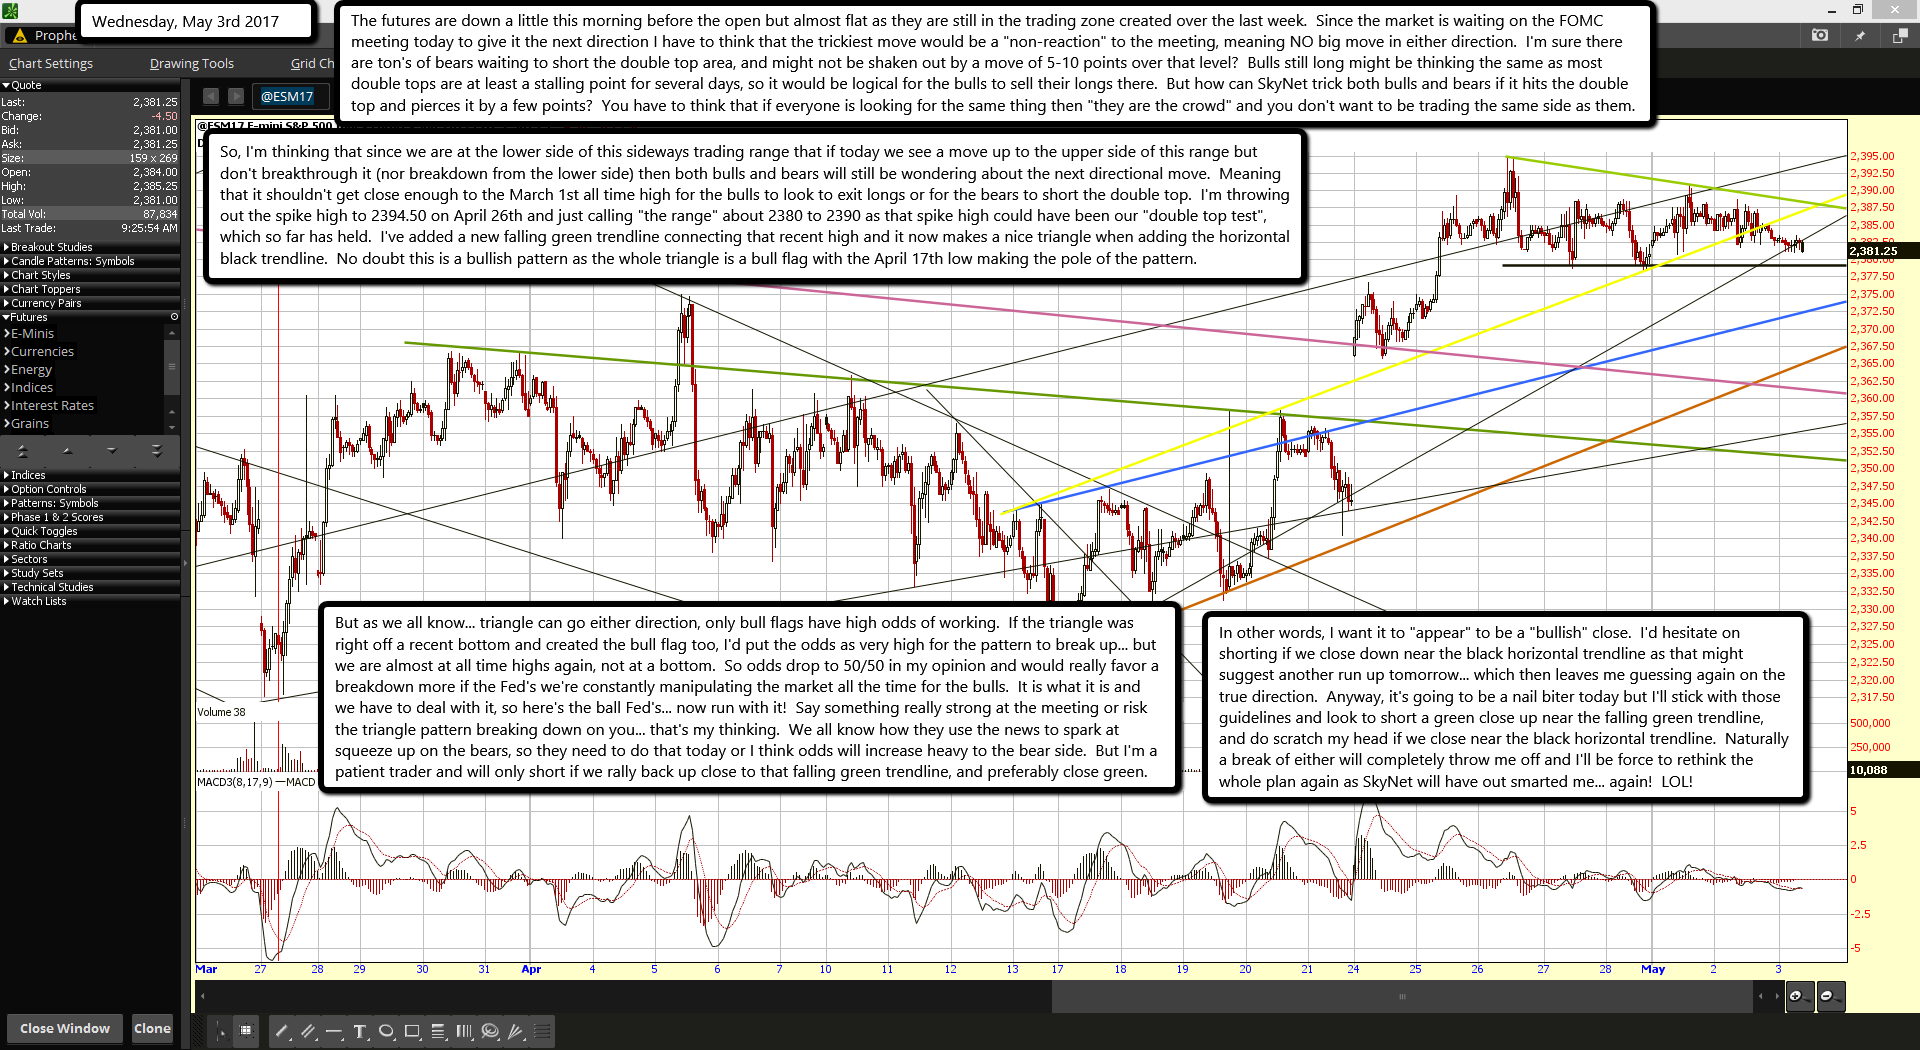
The futures are down a little this morning before the open but almost flat as they are still in the trading zone created over the last week.  Since the market is waiting on the FOMC meeting today to give it the next direction I have to think that the trickiest move would be a "non-reaction" to the meeting, meaning NO big move in either direction.  I'm sure there are ton's of bears waiting to short the double top area, and might not be shaken out by a move of 5-10 points over that level?  Bulls still long might be thinking the same as most double tops are at least a stalling point for several days, so it would be logical for the bulls to sell their longs there.  But how can SkyNet trick both bulls and bears if it hits the double top and pierces it by a few points?  You have to think that if everyone is looking for the same thing then "they are the crowd" and you don't want to be trading the same side as them.

So, I'm thinking that since we are at the lower side of this sideways trading range that if today we see a move up to the upper side of this range but don't breakthrough it (nor breakdown from the lower side) then both bulls and bears will still be wondering about the next directional move.  Meaning that it shouldn't get close enough to the March 1st all time high for the bulls to look to exit longs or for the bears to short the double top.  I'm throwing out the spike high to 2394.50 on April 26th and just calling "the range" about 2380 to 2390 as that spike high could have been our "double top test", which so far has held.  I've added a new falling green trendline connecting that recent high and it now makes a nice triangle when adding the horizontal black trendline.  No doubt this is a bullish pattern as the whole triangle is a bull flag with the April 17th low making the pole of the pattern.

But as we all know... triangle can go either direction, only bull flags have high odds of working.  If the triangle was right off a recent bottom and created the bull flag too, I'd put the odds as very high for the pattern to break up... but we are almost at all time highs again, not at a bottom.  So odds drop to 50/50 in my opinion and would really favor a breakdown more if the Fed's we're constantly manipulating the market all the time for the bulls.  It is what it is and we have to deal with it, so here's the ball Fed's... now run with it!  Say something really strong at the meeting or risk the triangle pattern breaking down on you... that's my thinking.  We all know how they use the news to spark at squeeze up on the bears, so they need to do that today or I think odds will increase heavy to the bear side.  But I'm a patient trader and will only short if we rally back up close to that falling green trendline, and preferably close green.

In other words, I want it to "appear" to be a "bullish" close.  I'd hesitate on shorting if we close down near the black horizontal trendline as that might suggest another run up tomorrow... which then leaves me guessing again on the true direction.  Anyway, it's going to be a nail biter today but I'll stick with those guidelines and look to short a green close up near the falling green trendline, and do scratch my head if we close near the black horizontal trendline.  Naturally a break of either will completely throw me off and I'll be force to rethink the whole plan again as SkyNet will have out smarted me... again!  LOL!

ES Morning Update May 2nd 2017

0

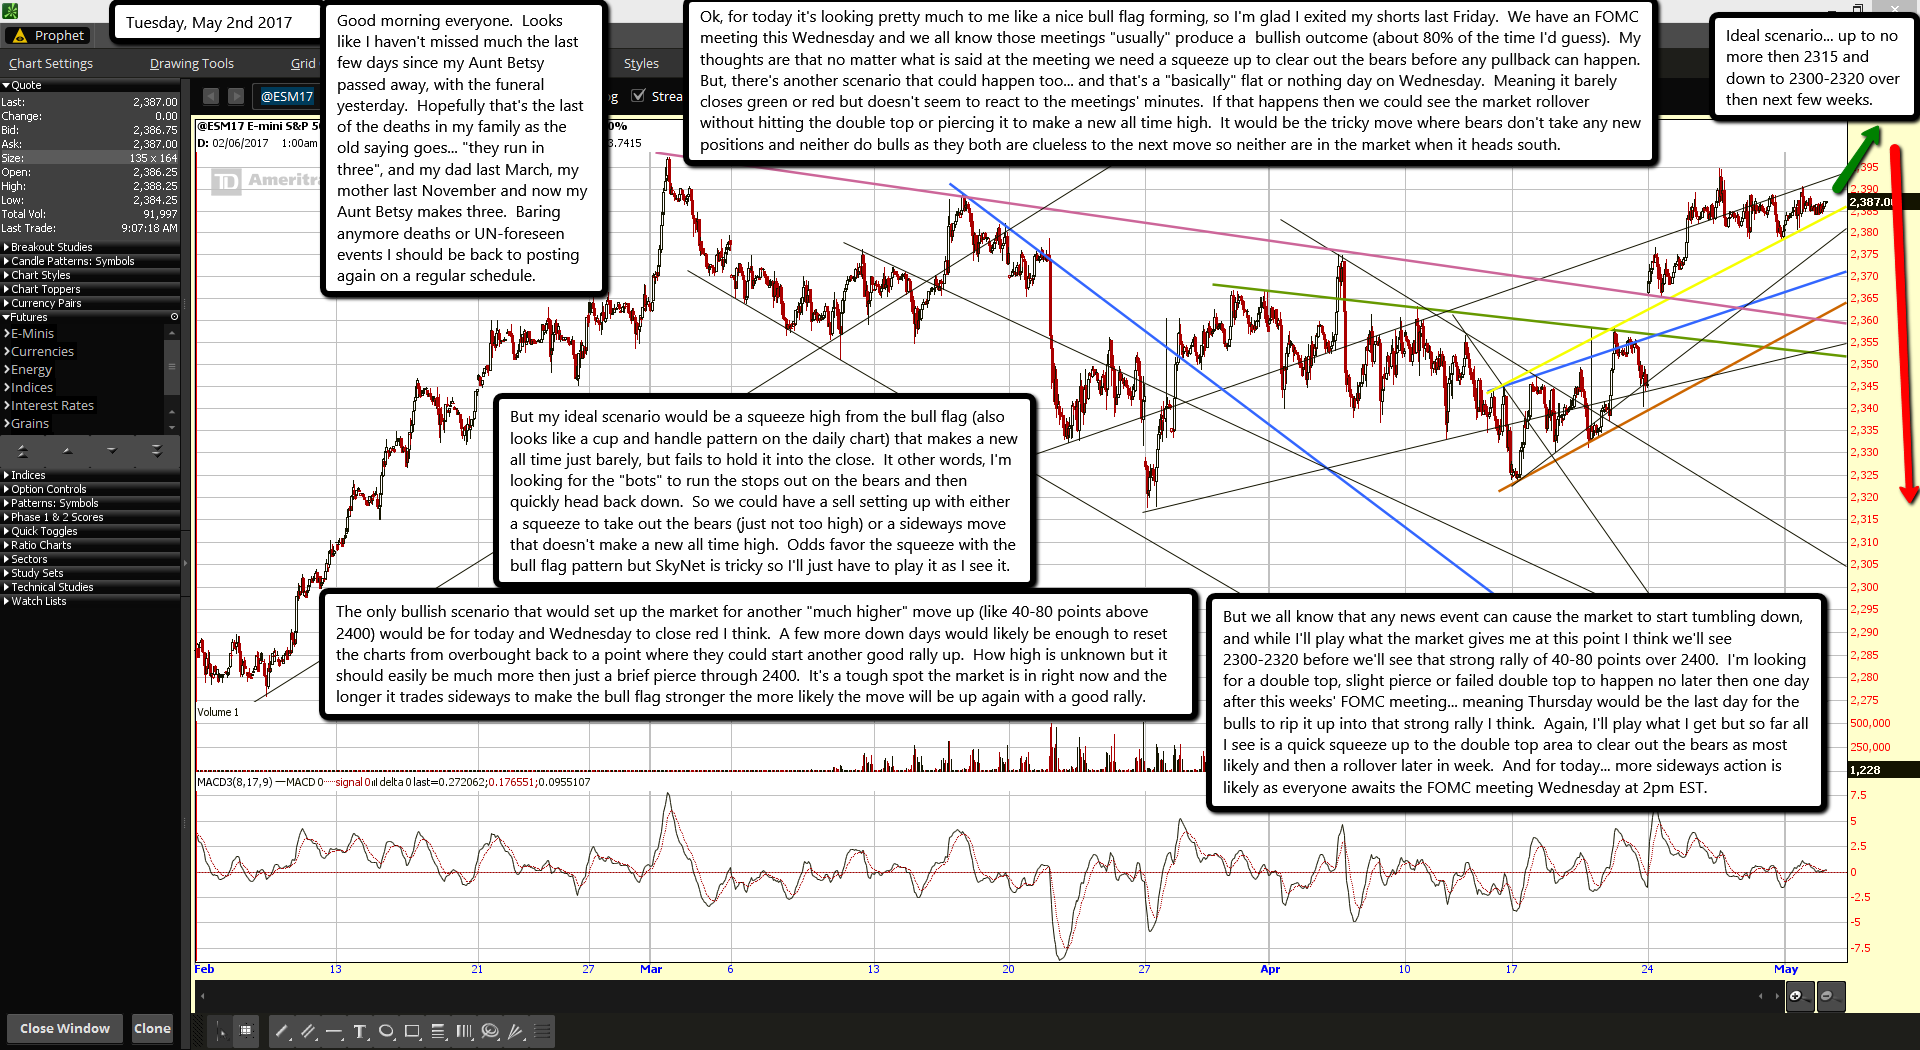
Good morning everyone.  Looks like I haven't missed much the last few days since my Aunt Betsy passed away, with the funeral yesterday.  Hopefully that's the last of the deaths in my family as the old saying goes... "they run in three", and my dad last March, my mother last November and now my Aunt Betsy makes three.  Baring anymore deaths or UN-foreseen events I should be back to posting again on a regular schedule.

Ok, for today it's looking pretty much to me like a nice bull flag forming, so I'm glad I exited my shorts last Friday.  We have an FOMC meeting this Wednesday and we all know those meetings "usually" produce a  bullish outcome (about 80% of the time I'd guess).  My thoughts are that no matter what is said at the meeting we need a squeeze up to clear out the bears before any pullback can happen.  But, there's another scenario that could happen too... and that's a "basically" flat or nothing day on Wednesday.  Meaning it barely closes green or red but doesn't seem to react to the meetings' minutes.  If that happens then we could see the market rollover without hitting the double top or piercing it to make a new all time high.  It would be the tricky move where bears don't take any new positions and neither do bulls as they both are clueless to the next move so neither are in the market when it heads south.

Ideal scenario... up to no more then 2315 and down to 2300-2320 over then next few weeks.

But my ideal scenario would be a squeeze high from the bull flag (also looks like a cup and handle pattern on the daily chart) that makes a new all time just barely, but fails to hold it into the close.  It other words, I'm looking for the "bots" to run the stops out on the bears and then quickly head back down.  So we could have a sell setting up with either a squeeze to take out the bears (just not too high) or a sideways move that doesn't make a new all time high.  Odds favor the squeeze with the bull flag pattern but SkyNet is tricky so I'll just have to play it as I see it.

The only bullish scenario that would set up the market for another "much higher" move up (like 40-80 points above 2400) would be for today and Wednesday to close red I think.  A few more down days would likely be enough to reset the charts from overbought back to a point where they could start another good rally up.  How high is unknown but it should easily be much more then just a brief pierce through 2400.  It's a tough spot the market is in right now and the longer it trades sideways to make the bull flag stronger the more likely the move will be up again with a good rally.

But we all know that any news event can cause the market to start tumbling down, and while I'll play what the market gives me at this point I think we'll see 2300-2320 before we'll see that strong rally of 40-80 points over 2400.  I'm looking for a double top, slight pierce or failed double top to happen no later then one day after this weeks' FOMC meeting... meaning Thursday would be the last day for the bulls to rip it up into that strong rally I think.  Again, I'll play what I get but so far all I see is a quick squeeze up to the double top area to clear out the bears as most likely and then a rollover later in week.  And for today... more sideways action is likely as everyone awaits the FOMC meeting Wednesday at 2pm EST.

ES Morning Update April 28th 2017

0

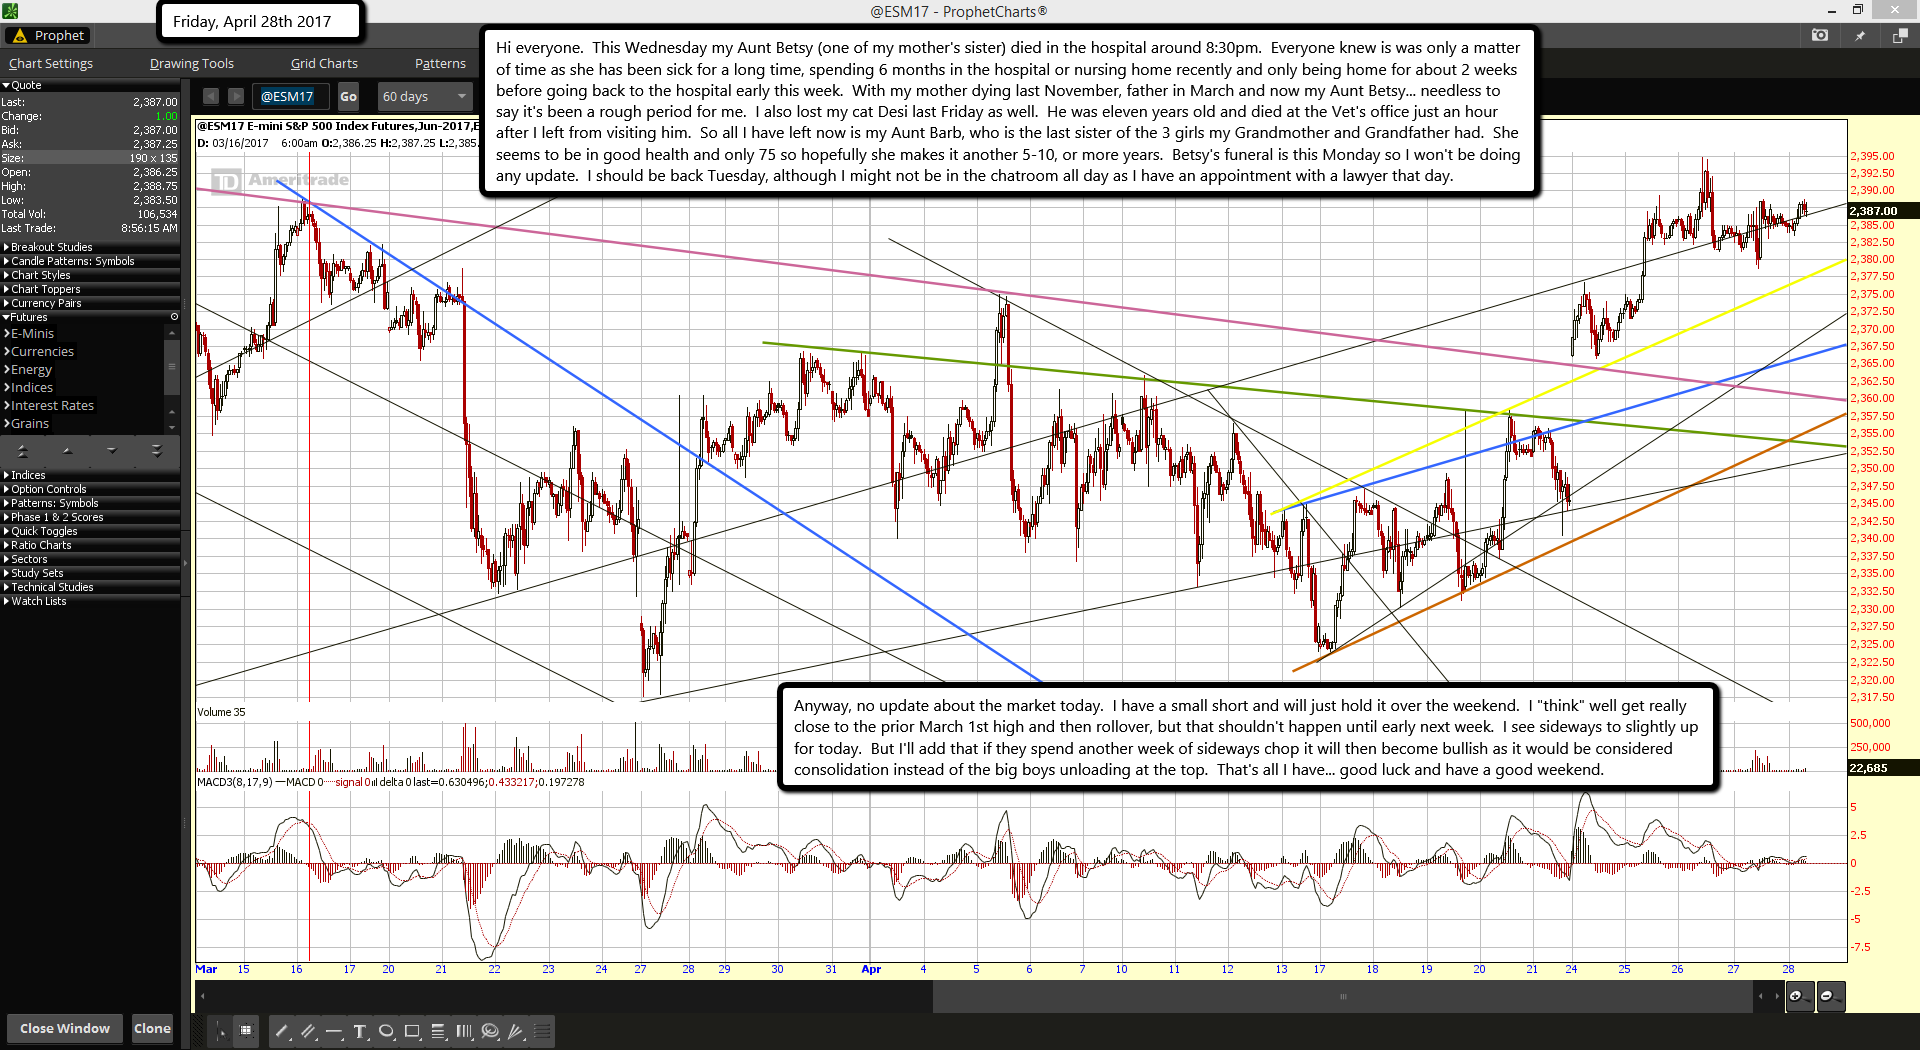
Hi everyone.  This Wednesday my Aunt Betsy (one of my mother's sister) died in the hospital around 8:30pm.  Everyone knew is was only a matter of time as she has been sick for a long time, spending 6 months in the hospital or nursing home recently and only being home for about 2 weeks before going back to the hospital early this week.  With my mother dying last November, father in March and now my Aunt Betsy... needless to say it's been a rough period for me.  I also lost my cat Desi last Friday as well.  He was eleven years old and died at the Vet's office just an hour after I left from visiting him.  So all I have left now is my Aunt Barb, who is the last sister of the 3 girls my Grandmother and Grandfather had.  She seems to be in good health and only 75 so hopefully she makes it another 5-10, or more years.  Betsy's funeral is this Monday so I won't be doing any update.  I should be back Tuesday, although I might not be in the chatroom all day as I have an appointment with a lawyer that day.

Anyway, no update about the market today.  I have a small short and will just hold it over the weekend.  I "think" well get really close to the prior March 1st high and then rollover, but that shouldn't happen until early next week.  I see sideways to slightly up for today.  But I'll add that if they spend another week of sideways chop it will then become bullish as it would be considered consolidation instead of the big boys unloading at the top.  That's all I have... good luck and have a good weekend.

ES Morning Update April 25th 2017

0

956ef176-7cdd-4cea-8f1e-3c23a306d341

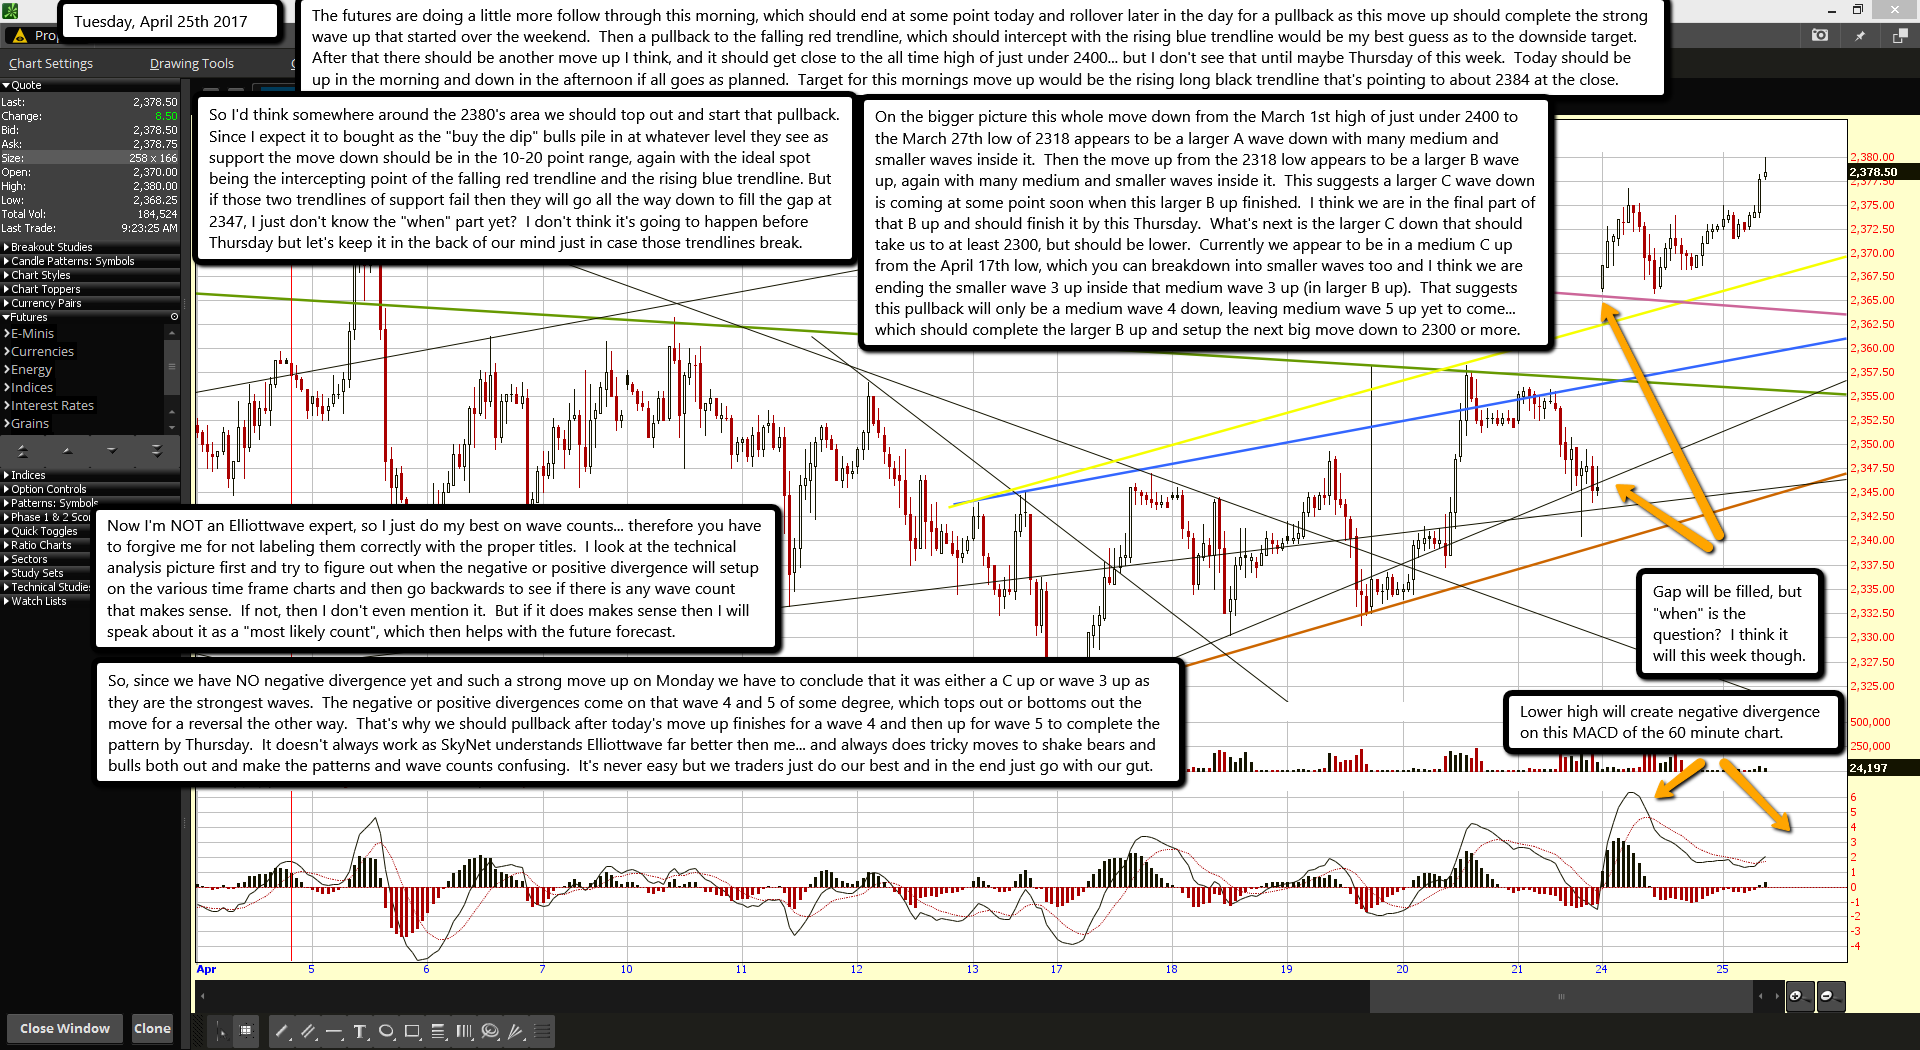
The futures are doing a little more follow through this morning, which should end at some point today and rollover later in the day for a pullback as this move up should complete the strong wave up that started over the weekend.  Then a pullback to the falling red trendline, which should intercept with the rising blue trendline would be my best guess as to the downside target.  After that there should be another move up I think, and it should get close to the all time high of just under 2400... but I don't see that until maybe Thursday of this week.  Today should be up in the morning and down in the afternoon if all goes as planned.  Target for this mornings move up would be the rising long black trendline that's pointing to about 2384 at the close.

So I'd think somewhere around the 2380's area we should top out and start that pullback.  Since I expect it to bought as the "buy the dip" bulls pile in at whatever level they see as support the move down should be in the 10-20 point range, again with the ideal spot being the intercepting point of the falling red trendline and the rising blue trendline. But if those two trendlines of support fail then they will go all the way down to fill the gap at 2347, I just don't know the "when" part yet?  I don't think it's going to happen before Thursday but let's keep it in the back of our mind just in case those trendlines break.

On the bigger picture this whole move down from the March 1st high of just under 2400 to the March 27th low of 2318 appears to be a larger A wave down with many medium and smaller waves inside it.  Then the move up from the 2318 low appears to be a larger B wave up, again with many medium and smaller waves inside it.  This suggests a larger C wave down is coming at some point soon when this larger B up finished.  I think we are in the final part of that B up and should finish it by this Thursday.  What's next is the larger C down that should take us to at least 2300, but should be lower.  Currently we appear to be in a medium C up from the April 17th low, which you can breakdown into smaller waves too and I think we are ending the smaller wave 3 up inside that medium wave 3 up (in larger B up).  That suggests this pullback will only be a medium wave 4 down, leaving medium wave 5 up yet to come... which should complete the larger B up and setup the next big move down to 2300 or more.

Now I'm NOT an Elliottwave expert, so I just do my best on wave counts... therefore you have to forgive me for not labeling them correctly with the proper titles.  I look at the technical analysis picture first and try to figure out when the negative or positive divergence will setup on the various time frame charts and then go backwards to see if there is any wave count that makes sense.  If not, then I don't even mention it.  But if it does makes sense then I will speak about it as a "most likely count", which then helps with the future forecast.

So, since we have NO negative divergence yet and such a strong move up on Monday we have to conclude that it was either a C up or wave 3 up as they are the strongest waves.  The negative or positive divergences come on that wave 4 and 5 of some degree, which tops out or bottoms out the move for a reversal the other way.  That's why we should pullback after today's move up finishes for a wave 4 and then up for wave 5 to complete the pattern by Thursday.  It doesn't always work as SkyNet understands Elliottwave far better then me... and always does tricky moves to shake bears and bulls both out and make the patterns and wave counts confusing.  It's never easy but we traders just do our best and in the end just go with our gut.

ES Morning Update April 24th 2017

0

0b6b18a5-bb63-4d52-9ddb-6b05d8d7ca59

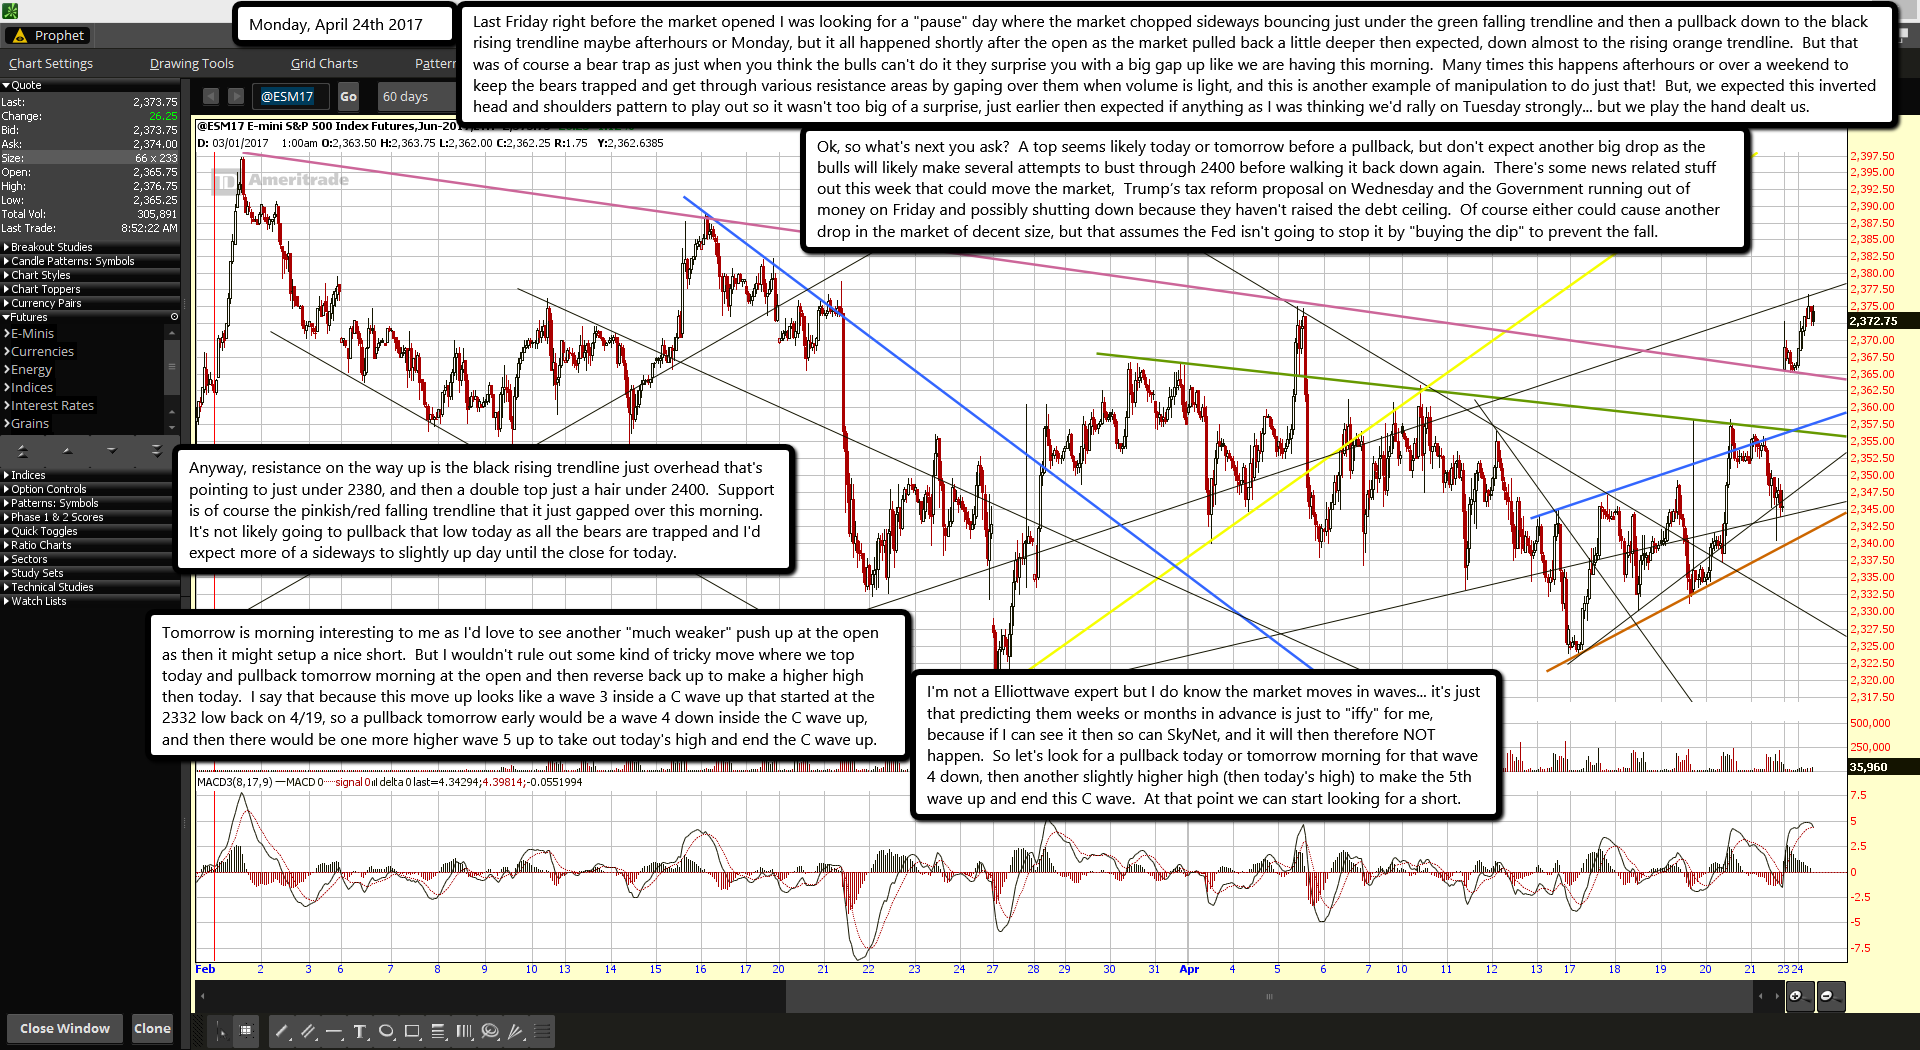
Last Friday right before the market opened I was looking for a "pause" day where the market chopped sideways bouncing just under the green falling trendline and then a pullback down to the black rising trendline maybe afterhours or Monday, but it all happened shortly after the open as the market pulled back a little deeper then expected, down almost to the rising orange trendline.  But that was of course a bear trap as just when you think the bulls can't do it they surprise you with a big gap up like we are having this morning.  Many times this happens afterhours or over a weekend to keep the bears trapped and get through various resistance areas by gaping over them when volume is light, and this is another example of manipulation to do just that!  But, we expected this inverted head and shoulders pattern to play out so it wasn't too big of a surprise, just earlier then expected if anything as I was thinking we'd rally on Tuesday strongly... but we play the hand dealt us.

Ok, so what's next you ask?  A top seems likely today or tomorrow before a pullback, but don't expect another big drop as the bulls will likely make several attempts to bust through 2400 before walking it back down again.  There's some news related stuff out this week that could move the market,  Trump’s tax reform proposal on Wednesday and the Government running out of money on Friday and possibly shutting down because they haven't raised the debt ceiling.  Of course either could cause another drop in the market of decent size, but that assumes the Fed isn't going to stop it by "buying the dip" to prevent the fall.

Anyway, resistance on the way up is the black rising trendline just overhead that's pointing to just under 2380, and then a double top just a hair under 2400.  Support is of course the pinkish/red falling trendline that it just gapped over this morning.  It's not likely going to pullback that low today as all the bears are trapped and I'd expect more of a sideways to slightly up day until the close for today.

Tomorrow is morning interesting to me as I'd love to see another "much weaker" push up at the open as then it might setup a nice short.  But I wouldn't rule out some kind of tricky move where we top today and pullback tomorrow morning at the open and then reverse back up to make a higher high then today.  I say that because this move up looks like a wave 3 inside a C wave up that started at the 2332 low back on 4/19, so a pullback tomorrow early would be a wave 4 down inside the C wave up, and then there would be one more higher wave 5 up to take out today's high and end the C wave up.

I'm not a Elliottwave expert but I do know the market moves in waves... it's just that predicting them weeks or months in advance is just to "iffy" for me, because if I can see it then so can SkyNet, and it will then therefore NOT happen.  So let's look for a pullback today or tomorrow morning for that wave 4 down, then another slightly higher high (then today's high) to make the 5th wave up and end this C wave.  At that point we can start looking for a short.

ES Morning Update April 21st 2017

0

We finally got our breakout to the upside yesterday, which I think will continue into next week as the futures make another run for that 2400 level. But today we should chop around some, call it a "pause" day. I don't see much more upside until we pullback a hair and reset the short term overbought charts. Then after that we should rally up again early next week with Monday or Tuesday being the most likely dates. It's unsure at this moment on how long it's going to take to reset the charts to allow another strong push up. This sideways "pause day" type action could extend into Monday or end today?

Ok, for today I'd expect to see the falling green trendline (pointing to about 2356) and the rising blue trendline (pointing to about 2357) to hold the bulls back. Ideally we chop all day and fall back into the lower rising trendline of the wedge (pointing to about 2349) before making another move up next week. You'll notice I expanded that wedge with the new trendline in orange (pointing to about 2341) as the original wedge broke-down on Wednesday. I don't think we'll fall back down to that new orange trendline today but if we chop all day up today, up near the blue and green trendlines then we "might" see it Monday morning.

Overall, I'm bullish for next week as I think they will make another run for 2400... not sure if they pierce it a little, fall short a little or double top it, but I think they are going to try to get it as high as possible before another good move down. Short term though, as in today, I think we'll do a lot of nothing but "holding the line" where we are currently.

The common plan that the bulls do a lot is to chop sideways long enough for a rising trendline to come up closer so the pullback is small before another run higher. That suggests they will go sideways for as long as possible until that old black rising trendline (that makes the original lower trendline on the rising wedge) comes up to a higher level. Currently it's pointing to 2348 or so but by Monday it should just about hit the falling green trendline. There's usually a breakout when the market trades sideways into a mix of crossing trendlines, so a slightly red close today might just set up another move up Monday. We'll see as time passes but I'm thinking that's what the bulls have planned. As always, I'll post new thoughts and charts in the chatroom throughout the day.

ES Morning Update April 20th 2017

0

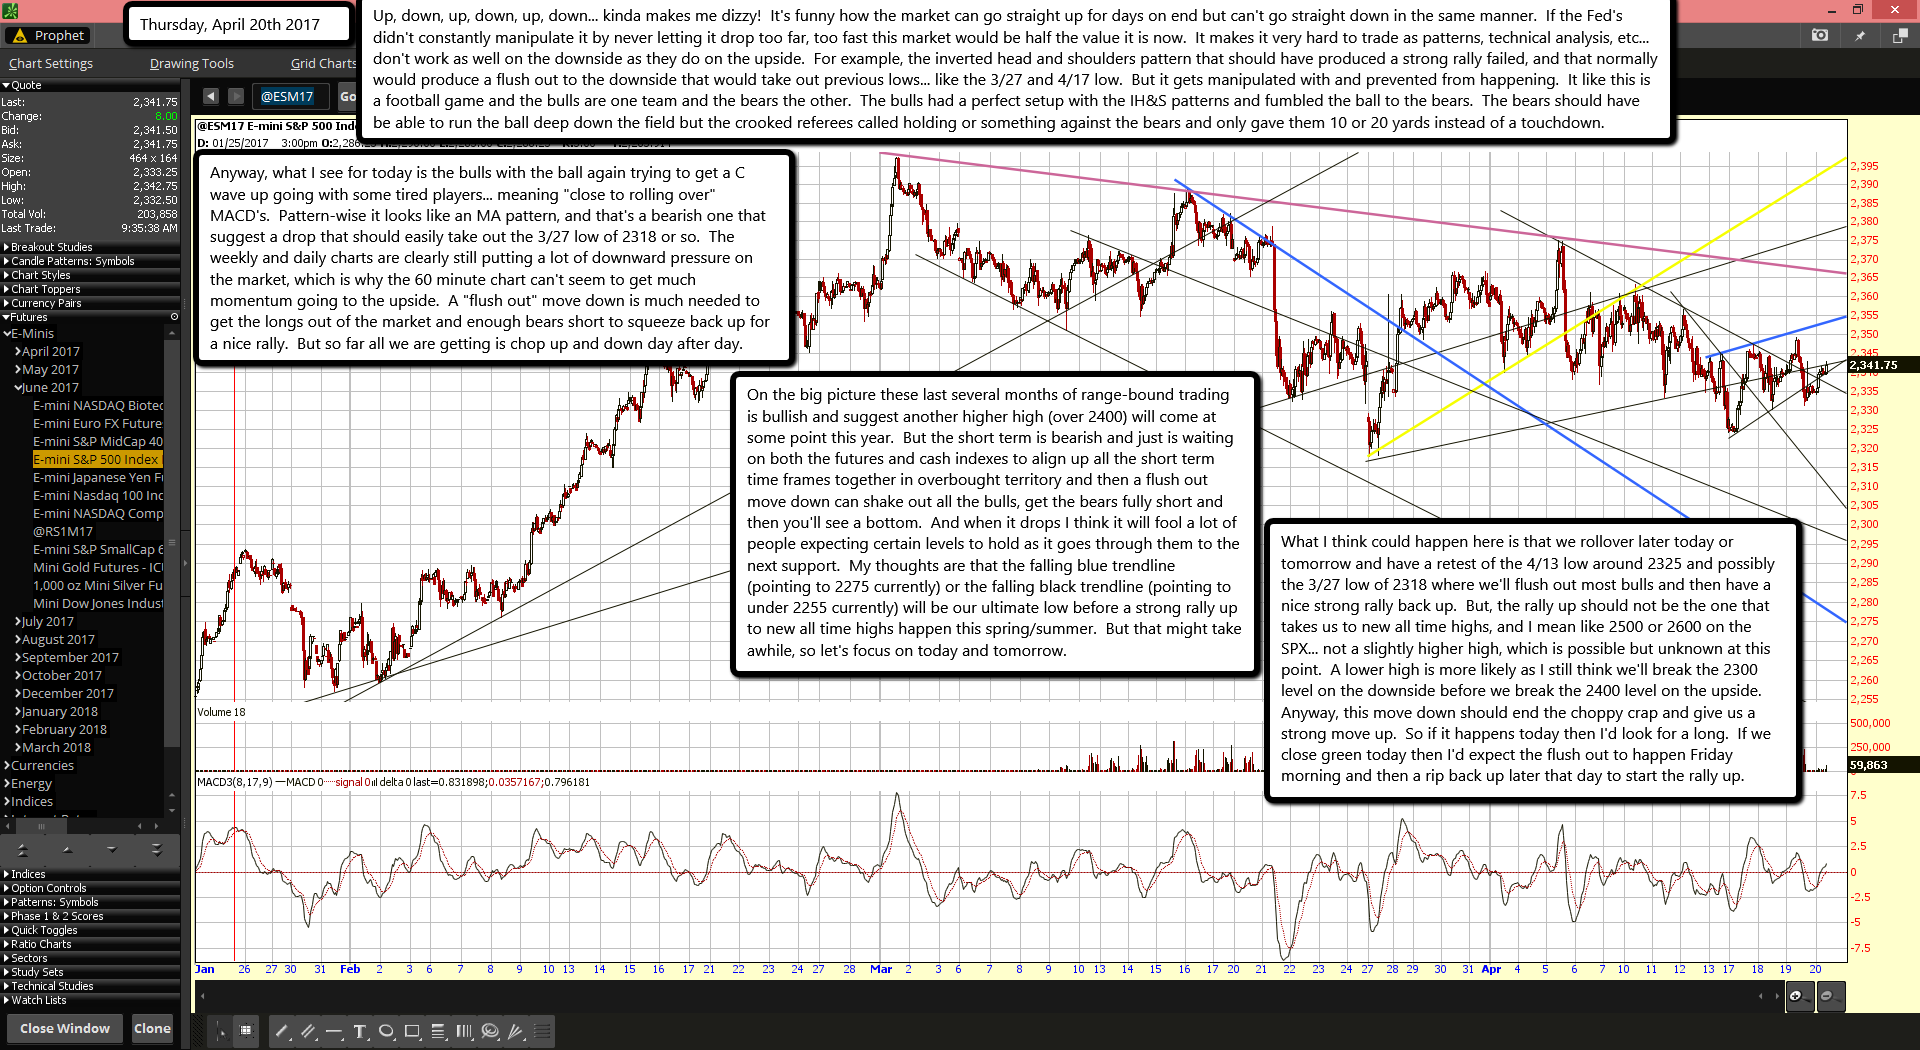
Up, down, up, down, up, down... kinda makes me dizzy!  It's funny how the market can go straight up for days on end but can't go straight down in the same manner.  If the Fed's didn't constantly manipulate it by never letting it drop too far, too fast this market would be half the value it is now.  It makes it very hard to trade as patterns, technical analysis, etc... don't work as well on the downside as they do on the upside.  For example, the inverted head and shoulders pattern that should have produced a strong rally failed, and that normally would produce a flush out to the downside that would take out previous lows... like the 3/27 and 4/17 low.  But it gets manipulated with and prevented from happening.  It like this is a football game and the bulls are one team and the bears the other.  The bulls had a perfect setup with the IH&S patterns and fumbled the ball to the bears.  The bears should have be able to run the ball deep down the field but the crooked referees called holding or something against the bears and only gave them 10 or 20 yards instead of a touchdown.

Anyway, what I see for today is the bulls with the ball again trying to get a C wave up going with some tired players... meaning "close to rolling over" MACD's.  Pattern-wise it looks like an MA pattern, and that's a bearish one that suggest a drop that should easily take out the 3/27 low of 2318 or so.  The weekly and daily charts are clearly still putting a lot of downward pressure on the market, which is why the 60 minute chart can't seem to get much momentum going to the upside.  A "flush out" move down is much needed to get the longs out of the market and enough bears short to squeeze back up for a nice rally.  But so far all we are getting is chop up and down day after day.

On the big picture these last several months of range-bound trading is bullish and suggest another higher high (over 2400) will come at some point this year.  But the short term is bearish and just is waiting on both the futures and cash indexes to align up all the short term time frames together in overbought territory and then a flush out move down can shake out all the bulls, get the bears fully short and then you'll see a bottom.  And when it drops I think it will fool a lot of people expecting certain levels to hold as it goes through them to the next support.  My thoughts are that the falling blue trendline (pointing to 2275 currently) or the falling black trendline (pointing to under 2255 currently) will be our ultimate low before a strong rally up to new all time highs happen this spring/summer.  But that might take awhile, so let's focus on today and tomorrow.

What I think could happen here is that we rollover later today or tomorrow and have a retest of the 4/13 low around 2325 and possibly the 3/27 low of 2318 where we'll flush out most bulls and then have a nice strong rally back up.  But, the rally up should not be the one that takes us to new all time highs, and I mean like 2500 or 2600 on the SPX... not a slightly higher high, which is possible but unknown at this point.  A lower high is more likely as I still think we'll break the 2300 level on the downside before we break the 2400 level on the upside.  Anyway, this move down should end the choppy crap and give us a strong move up.  So if it happens today then I'd look for a long.  If we close green today then I'd expect the flush out to happen Friday morning and then a rip back up later that day to start the rally up.

ES Morning Update April 19th 2017

0

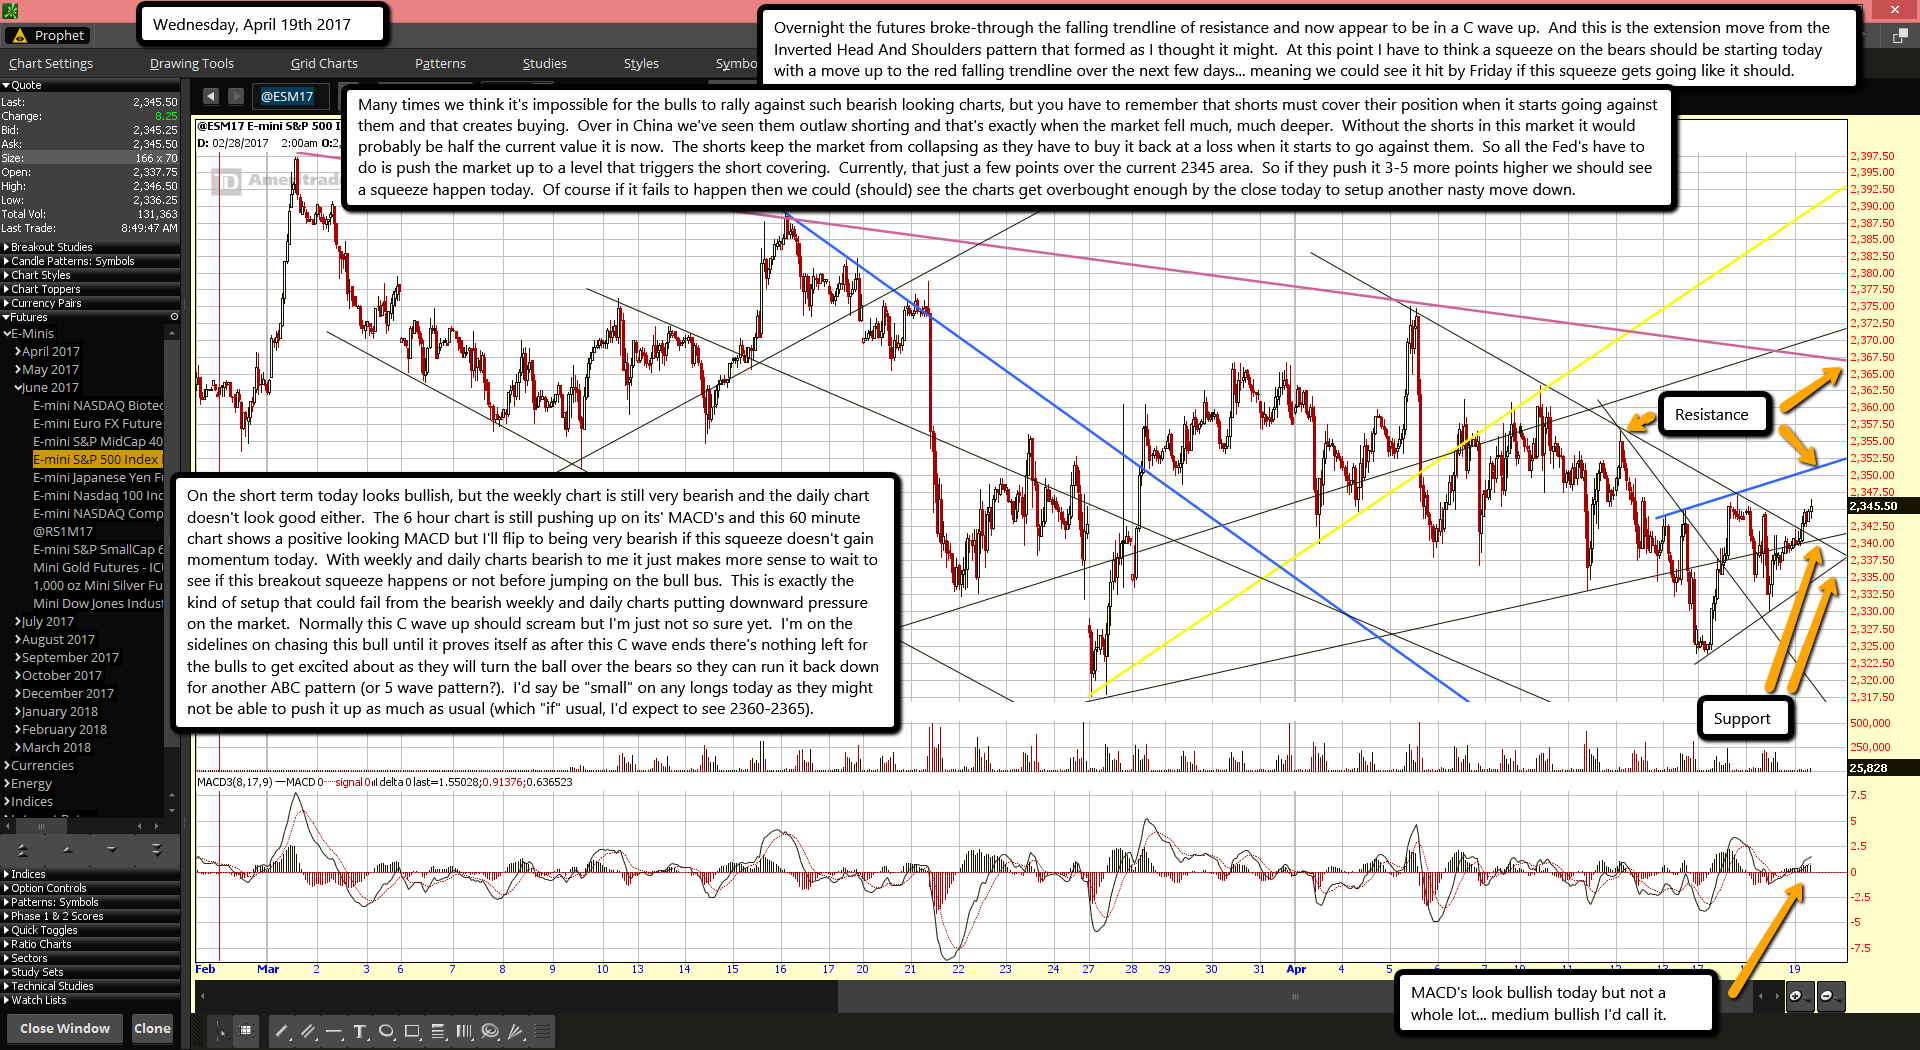
Overnight the futures broke-through the falling trendline of resistance and now appear to be in a C wave up.  And this is the extension move from the Inverted Head And Shoulders pattern that formed as I thought it might.  At this point I have to think a squeeze on the bears should be starting today with a move up to the red falling trendline over the next few days... meaning we could see it hit by Friday if this squeeze gets going like it should.

Many times we think it's impossible for the bulls to rally against such bearish looking charts, but you have to remember that shorts must cover their position when it starts going against them and that creates buying.  Over in China we've seen them outlaw shorting and that's exactly when the market fell much, much deeper.  Without the shorts in this market it would probably be half the current value it is now.  The shorts keep the market from collapsing as they have to buy it back at a loss when it starts to go against them.  So all the Fed's have to do is push the market up to a level that triggers the short covering.  Currently, that just a few points over the current 2345 area.  So if they push it 3-5 more points higher we should see a squeeze happen today.  Of course if it fails to happen then we could (should) see the charts get overbought enough by the close today to setup another nasty move down.

On the short term today looks bullish, but the weekly chart is still very bearish and the daily chart doesn't look good either.  The 6 hour chart is still pushing up on its' MACD's and this 60 minute chart shows a positive looking MACD but I'll flip to being very bearish if this squeeze doesn't gain momentum today.  With weekly and daily charts bearish to me it just makes more sense to wait to see if this breakout squeeze happens or not before jumping on the bull bus.  This is exactly the kind of setup that could fail from the bearish weekly and daily charts putting downward pressure on the market.  Normally this C wave up should scream but I'm just not so sure yet.  I'm on the sidelines on chasing this bull until it proves itself as after this C wave ends there's nothing left for the bulls to get excited about as they will turn the ball over the bears so they can run it back down for another ABC pattern (or 5 wave pattern?).  I'd say be "small" on any longs today as they might not be able to push it up as much as usual (which "if" usual, I'd expect to see 2360-2365).

What happens if China stumbles? A $140 billion doomsday scenario

0

Australia is more exposed to the economy of a single nation - China - than at any time since the 1950s, when Britain was our major trading partner.

While the gains from that economic relationship have been huge, the risk if China's economy slows are potentially just as large, new modelling warns.

The analysis, from Deloitte Access Economics' Chris Richardson, to be released at the National Press Club on Wednesday, says that if economic growth in China halved from its current rate of about 6.7 per cent to 3 per cent, Australia would be forced into recession as the nation "just doesn't have the ammo to fight it off any more".

The damage would include:

What would it mean for Australia if China's economy slowed?

  • $140 billion wiped from national earnings for families, businesses and government in the two years to 2019.
  • 500,000 people would lose their jobs.
  • house prices would fall by about 9 per cent.
  • the sharemarket would drop in value by 17 per cent.
  • the Australian dollar would drop 15¢ and inflation would rise.
  • business sales and profits would drop by 8 per cent and 19 per cent respectively.
  • $40 billion would be wiped off the federal budget bottom line in 2019-20 alone.

Mr Richardson, in his speech to the Press Club, is quick to add that Deloitte Access is not forecasting a China crisis - although he does warn that China is too reliant on debt, has built too much, has over-capacity in everything from steel to housing and its economy is still reliant on stimulus.

"In fact, China looks stronger today than at any time since 2011. So this isn't our view of what is most likely. But it is entirely plausible," he will state.

In addition, compared with the global financial crisis in 2008-09, Australia's interest rates and dollar are already low, while the federal budget is in the red and household borrowing has risen. All of these factors make it harder for Australia to resist falling into recession.

Construction workers rest near a board with an artist's impression of the Central Business District outside a ...

The so-called "China stumbles" scenario is one of three that have been modelled by Deloitte Access Economics using its new "Horizon" economic model. All three are alternatives to the Treasury's "most likely" scenario for the economy.

The other two options to be set out by Mr Richardson present far rosier possible futures for Australia.

Shoppers in Beijing, China.

The "best and brightest" future would see Australia successfully ride the wave of a rising Asian middle class, with an economy 2.5 per cent larger than it otherwise would have been, an additional $800 billion of national income over two decades and stronger wages growth.

Crucially, it would also see Canberra embrace economic reforms.

"That may be a tall order ... politicians are struggling to get the message across that reforms bring benefits," Mr Richardson will note.

The third scenario, examining the so-called "cyber smart" option, would see Australia take a leaf out of Israel's book and embrace technology to drive growth.

"Going cyber smart would have some pretty big benefits for the average Australian," Mr Richardson will note, with 60,000 extra people in jobs, higher wages and a rise in Australian living standards.

How Americans Spend Their Earnings.

0

People who want to invest in the stock market say they are very interested to start trading. Problem is they don’t have the money to invest in the stock market. Too often, after receiving their pay and settling their bills, there is hardly anything left for savings and investment. This can be addressed, but first, let’s take a look at how Americans spend their earnings.

It is interesting to note that comfort and image eat up a lot of an American’s paycheck. On the average, transportation, food, entertainment and apparel cost more than what an average person spends for everything else. Rent or mortgage is also high up in the list of expenses. For example, if the average pay is $69,000, the cash allotted for housing is almost $18,500 per year. The only reassuring thought about this is that homes are an investment. After paying the mortgage for so many number of years, the property ends up as yours and you can choose to sell it or rent it out and make it as a source of income.

The problem with paying mortgage, a car as well as clothes and shoes to look good at the office every day is that savings and health often take a back seat. If there’s nowhere else to cut, then food is also sacrificed little by little. This forces consumers to try to look for alternative means of income, or to take second and even third jobs in order to meet their target income.

We’ve prepared an infographic showing how the average U.S. consumer spends their paycheck. If you want to be in control of your finances and start investing and earning from stock trading, take a look at how you can improve on these different areas of spending.

How The Average U.S. Consumer Spends Their Paycheck

ES Morning Update April 18th 2017

0

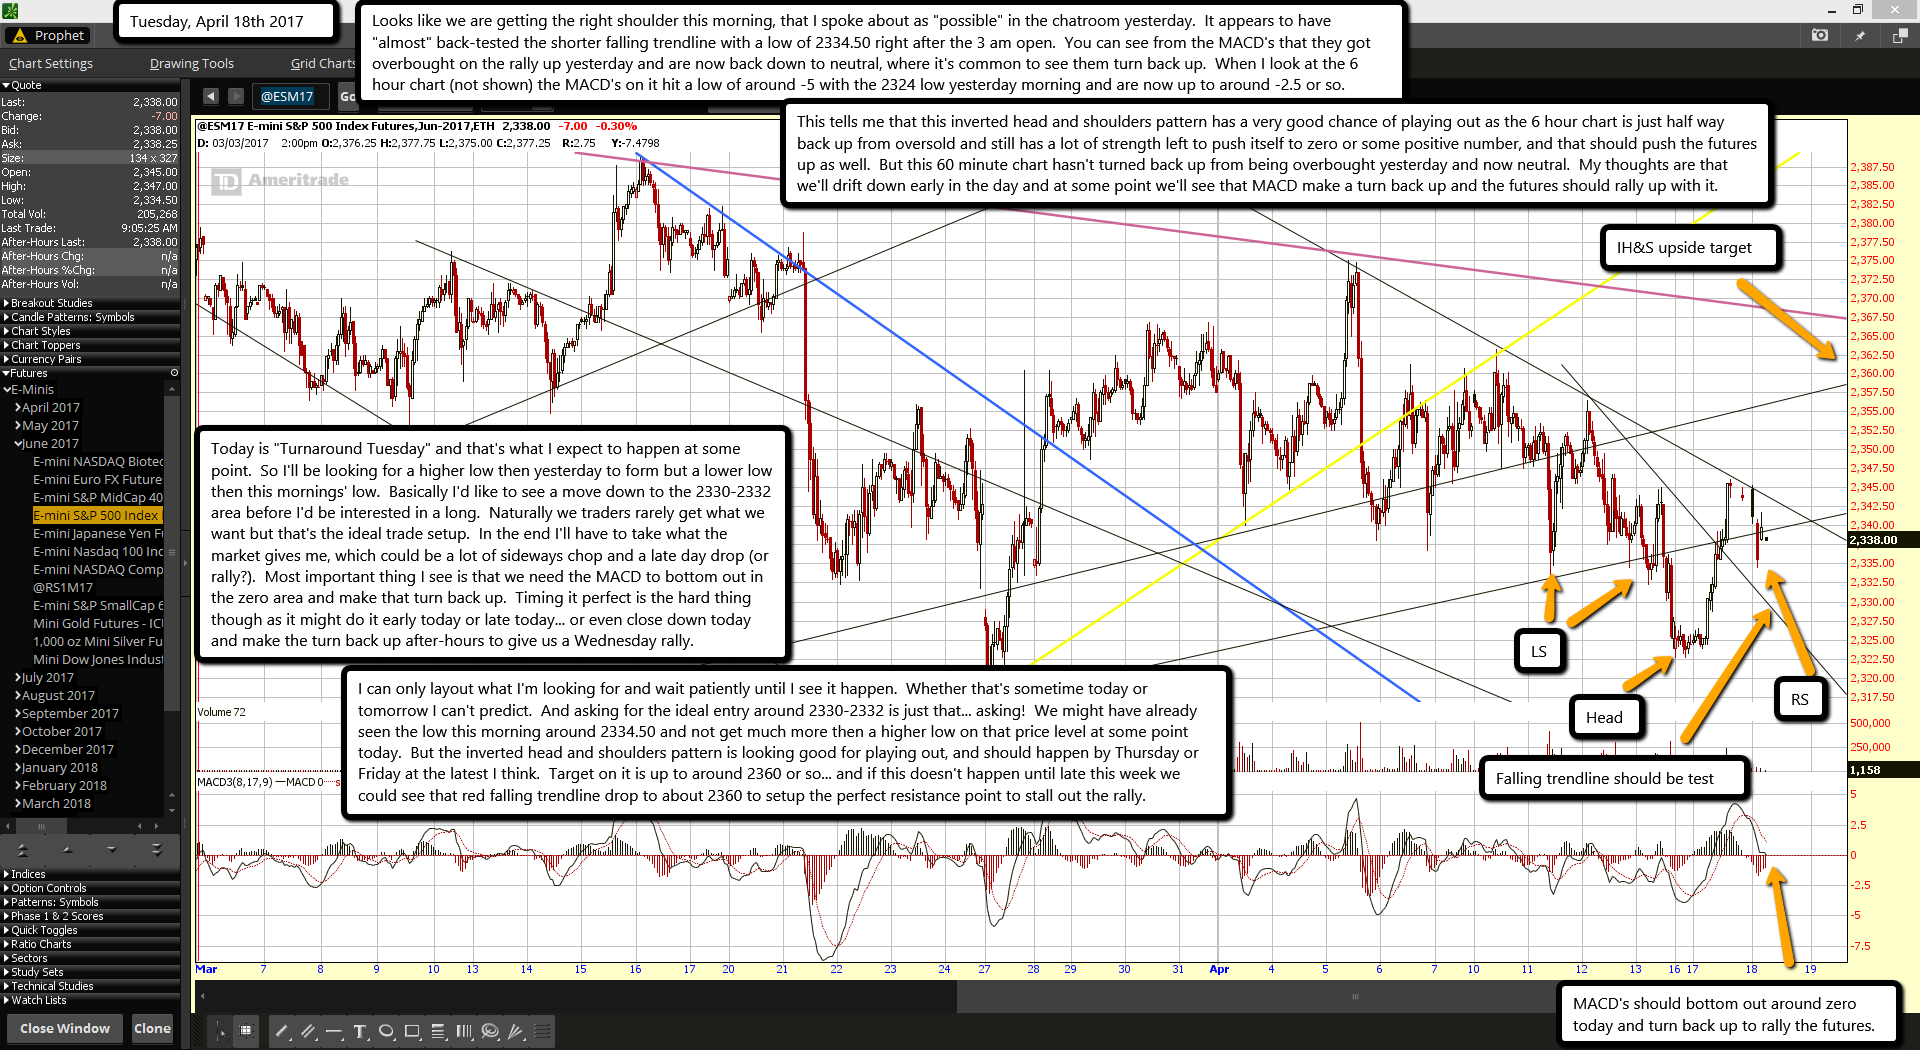
Looks like we are getting the right shoulder this morning, that I spoke about as "possible" in the chatroom yesterday.  It appears to have "almost" back-tested the shorter falling trendline with a low of 2334.50 right after the 3 am open.  You can see from the MACD's that they got overbought on the rally up yesterday and are now back down to neutral, where it's common to see them turn back up.  When I look at the 6 hour chart (not shown) the MACD's on it hit a low of around -5 with the 2324 low yesterday morning and are now up to around -2.5 or so.

This tells me that this inverted head and shoulders pattern has a very good chance of playing out as the 6 hour chart is just half way back up from oversold and still has a lot of strength left to push itself to zero or some positive number, and that should push the futures up as well.  But this 60 minute chart hasn't turned back up from being overbought yesterday and now neutral.  My thoughts are that we'll drift down early in the day and at some point we'll see that MACD make a turn back up and the futures should rally up with it.

Today is "Turnaround Tuesday" and that's what I expect to happen at some point.  So I'll be looking for a higher low then yesterday to form but a lower low then this mornings' low.  Basically I'd like to see a move down to the 2330-2332 area before I'd be interested in a long.  Naturally we traders rarely get what we want but that's the ideal trade setup.  In the end I'll have to take what the market gives me, which could be a lot of sideways chop and a late day drop (or rally?).  Most important thing I see is that we need the MACD to bottom out in the zero area and make that turn back up.  Timing it perfect is the hard thing though as it might do it early today or late today... or even close down today and make the turn back up after-hours to give us a Wednesday rally.

I can only layout what I'm looking for and wait patiently until I see it happen.  Whether that's sometime today or tomorrow I can't predict.  And asking for the ideal entry around 2330-2332 is just that... asking!  We might have already seen the low this morning around 2334.50 and not get much more then a higher low on that price level at some point today.  But the inverted head and shoulders pattern is looking good for playing out, and should happen by Thursday or Friday at the latest I think.  Target on it is up to around 2360 or so... and if this doesn't happen until late this week we could see that red falling trendline drop to about 2360 to setup the perfect resistance point to stall out the rally.

ES Morning Update April 17th 2017

0

Welcome back to everyone after a long 3 day weekend. Today I'll keep this short and to the point.  I'm expecting a kinda "pause" day today with a small rally.  Then one more move down either late in the day toward the close or Tuesday morning.  A retest of the 2322 low is likely around the bottom for this whole move down from the March 1st high of around 2400.  So, while I'm exactly sure of the date, it should be today or Tuesday for a bottom.  Then I'd expect a rally up the rest of the week to at least test the falling red trendline around 2370 right now.  But it's more likely that this rally will last for several weeks to shake out both bulls and bears.  Anyway, I said I'll keep it short so I will.  I'm looking to go long either today on a dip lower or Tuesday morning.

ES Morning Update April 13th 2017

0

Still drifting lower but not enough for me to call think they flushed out all the bulls.  It's hard too get excited about going long until I see them truly put in a high volume day where they run all the stops on the bulls.  That means we really should break support from this triangle and take out the prior low around 2318 from 3/27, and then I'd start to become bullish.  Right now we are stuck in a trading range with a bearish structure overall.  But we know the Fed hate the bears and buy every dip to keep it from collapsing.

So it's hard to get bearish too as we do expect to see a flush move down but timing it to the exact day is very hard.  Counting waves is too subjective so while one could say we are in C wave down and inside it we appear to have finished the wave 1 down, wave 2 up and should be in the wave 3 down now.  But clearly that's not the case as if we were in a wave 3 down inside a larger wave C down we should see a 30-40 point move happen.  We barely see 10 points each day this week, so the manipulation here is strong.  We just chop up and down every day and don't make any clear sense as to the wave count or the direction.

I can only speculate that because the market is closed on Friday for a holiday that today will be a very light volume day as traders leave early for the weekend.  Normally that suggests that the market will float up on that light volume.  But there's not been much "normal" in this market for the past several years as the "bot's" seem to have changed all the old patterns because too many traders learned them.  So I can tell you that we should hold the current support from the rising trendline to make up the lower part of the triangle that we are in... but today might just be the day that the "bot's" decide to take the market down and flush out the longs.  It would be a good time to do it as with the light volume expected it makes it easier to control the desent down.  Anyway, I don't have much to add other then to say the obvious... if we hold support we should rally back up later in the day from light volume.  If it breaks then we could see a nasty move down while most traders have already left for the weekend.

ES Morning Update April 12th 2017

0

As told everyone in the chatroom yesterday I missed the morning update because I had to be at the hospital for my Aunt Betsy at 6:15am and didn't make it back in time before the market opened.  They did not end up doing surgery on her as putting the stents in her right leg was too risky.  She's got no blood flow to her leg and is in danger of losing the leg completely over time if something isn't done to restore blood.  But she's only 70 pounds in weight and is just too tiny for the doctor to feel safe about surgery.  She's my mother's sister and as you all know I lost my mother to a stroke last November and my dad before that in March.  It's been a rough year or so as everyone expected Betsy to not make it as long as she has because she spent about 6 months last year between the hospital and the nursing home.  Then no one saw my mother dying with a stroke as she was in pretty good health for 75 years old.

Anyway, sorry to get off subject but all the time you've seen me "not post" over the last year has been due to various family issues.  I rarely even trade anymore as I have more then enough money to take a long time off and not worry about trading to make a living.  But I still enjoy doing the morning post and chatting we people I've got to know over time.  However, for my own trading I've been too distracted with my other more important project I'm working on with several partners.  And that is the purchase of an OTC company.  I'll be a partner in it and I'm extremely excited about it's future.  It has a copper mine with a Billion Dollars of reserve in it and with the stock market expected to be in it's final 5th wave up the crash to follow in 2018/2019 should send all metals through the roof.  So I fully expect this to be my retirement as while I have more then enough money to live for a long time right now it's not enough to completely retire on.  This company will be though... and I fully expect to see in soar many multiples of times over the opening price after all the paperwork is complete.  But of course I'll keep following the stock market and doing the posts for as long as I enjoy them.  Just expect me to take some vacation time at some point... LOL!

Ok, back to the market.  I'm still expecting another move down but right now we seem pretty rangebound in a triangle, and with Friday being a holiday and the markets closed it's doubtful if we'll see any breakdown of the triangle.  In fact I'd expect some light volume float higher tomorrow... especially if we close down today.  Overall we are building positive divergence on the MACD's here going all the way back to the 21st, but there's NOT been any real "Flush Out" to the downside yet and that makes me leery of expecting any rally to new all time highs again.  Can we get up to the 2370 area where the two trendlines of resistance are currently meeting?  Sure, but I wouldn't expect to see it busted unless we get that lower low first.  This only applies for today and tomorrow, but if they continue this sideways chop into late next week then at that point the charts could be reset enough to bust up to new all time highs.  It's all about "time" as the longer we chop in this range the less bearish it becomes and more bullish.  The bears must attack soon or risk losing the overbought charts, because as time goes by the charts will become neutral and eventually they will be oversold.  Anyway, I don't see any good setup today but if we drift down to touch the rising trendline of support on the triangle (about 2335 now) then it's likely a good long for Thursday.

ES Morning Update April 10th 2017

0

Futures look weak again this morning after a being up over 5 points Sunday night.  Good Monday morning to you as winter seems about gone now with nice warm temperatures about everywhere it appears.  This week is the week prior to the monthly options expiration week, which (before the introduction of the weekly options) used too see a low put in on Thursday or Friday.  However that old pattern seems to be as accurate as flipping a coin now.  But we are still due another move down I believe and this is the week we should see it.  Whether it happens early in the week or on Thurs/Fri is unknown.  But I'm expecting some flushout move down to lure in enough bears for a nice big squeeze back up and wipeout all the "buy the dippers" bulls.

Ok, so what's the expected targets?  On the weak bear move down we might only see the 2330 area hit, which will clean out bulls long from the recent 2336 low, but 2300 would clean out many more bulls that got long at the 2317 low.  Many people see this entire move down from the all time high of 2400 being some kind of wave 4, which when finished will produce a wave 5 up that will take us to new higher highs again.  I can't disagree as that's entirely possible.  I think it will be determined by how deep this pullback is before it starts the rally back up.  If the two targets mentioned are broken then the next big support is in the 2280 area all the way down to 2250 or so.  There's tons of support there but that might be too deep to support a fifth wave higher and instead we might only see a lower high if that deeper low is reached.

All in all... we are still early in April and next week is usually bullish.  It's the month of May that traders fear as weak historically.  So there's still plenty of time for a new higher high just as long as this move down ends this week and doesn't fall too far.  So I wouldn't get too bearish overall as we are still in a "bigger picture" uptrend.  For today I'd look for a short again if we can see the futures rise up into the trendlines of resistance around 2366 to 2373.  By Tuesday those should be all touching around 2370 I think and if we see that level hit I'm a bear for the next 40 points lower.  If we drop instead then I'll look to become a bull, but cautiously at 2330 and more aggressively at 2300.

s2Member®