The market is currently experiencing some of the light trading volume days I've seen in a very long time. It's preventing the bears from having any pullback at all. While we "should" have had a 2-4% SPX pullback recently it just hasn't happened and doesn't look like it's going to happen anytime soon. Possibly we'll get some "one day wonders" of 20-30 points down in the near future but I wouldn't count on it. The old saying is "never short a dull market" and this is the dullest market around.
I'll go over the charts in the video but any bearish case (and there's a whole lot of them) will probably NOT play out due to the light volume we are having that keeps the market up in spite of everything else. Some even say it feels like the 1999-2000 run up in the market... just a slow grind every day to put everyone to sleep as it defies gravity and just never has any decent pullback to get long at. Everyone was forced to chase it... at least until the END!
While I'm not expecting this year to crash like it did back then I am expecting a 10-15% correction later this second half of 2014. The real crash is around 3 years away I think. However, I was expecting some pullbacks of 2-4% that I would like to play on both the downside and the upside rally that would follow. It's just not looking like I'm going to get it until we see some more volume in the market. We are very far away from all the moving averages below and various support levels, which normally CANNOT be sustained for very long without a correction. But we are NOT in a "NORMAL" trading period as the volume probably the lightest we've had for the last 5 years or more.
It tells me that the Fed's have instructed the big institutions NOT to sell, which will allow this light volume float up to continue much longer then it should. It's obviously not the Fed's QE money pushing this market up as they are taking more and more of it out the market at every FOMC meeting, so it's got to be the small retail sheep buying it up here as there's no one left but them.
Lets examine this daily chart of the SPX for a minute...
Looking back to December of 2013 you'll notice how the market hit overhead resistance, pulled back for a couple of days (30-40 points), went back up and hit resistance again and then pulled back for a 2nd time for another 30-40 points.... and finally rolled over for about a 6% correction to bottom at 1737 SPX in February of 2014. Then we rallied up until March before tiring out and after several days of chopping sideways we dropped for a few days... again 30-40 points.
Then back up to peak at 1897 in late March, which was then followed by about a 4.5% correction. Each time the market dropped to hit the rising trendline of support from 2011 and bounced back up from it. That's why I was expecting only a 2-4% correction this time as the market was making smaller corrections each time as it was coming to the end of the rising wedge.
This most recent time the market chopped along that rising trendline of resistance in the 1920 area for many days and couldn't get through. Everything looked similar to the prior 3-4 times except that we were actually more overbought this time thing previously. So what changed? Why didn't the market rollover again? The only answer I have is "EXTREMELY LIGHT VOLUME!".
So what's next?
My best guess is that we continue higher with that next overhead resistance line being the next upside target. It looks to be near 2000 SPX on the chart but it's hard to tell for sure as it rises every day. But if there are a lot of bear stops still left after Friday's breakout move then the bulls could put a nasty wave 3 squeeze on the bears and run this up higher then we could believe this week.
However, the more likely scenario is that we backtest the broken trendline of resistance in the 1925 area that will now become support. This week is usually the pause or down week with the bottom being put in on Thursday or Friday, and then next week is usually the super bullish week as it's the month option expiration week.
With that said I'd look for a long position on a pullback to backtest that broken trendline as the odds are strong that we will now continue higher with 2000+ being the upside target area. Once we hit that rising trendline (which again is in the 2000 area currently) I could then see a pullback to the middle rising trendline that we just broke out of late last week. It could rise up to 1930-1935 by then... depending on how long it takes us to first hit the upper rising trendline near 2000.
Catching a bear move is during a cattle drive isn't exactly the easiest thing to do!
One might view this slow grind higher as cattle (the bulls) being driven by some ranchers (banksters) from one coast of America to the other coast with some random bear attacks at night when the cattle are sleeping and the ranchers are passed out from drinking too much Whiskey. The bears get a few of the cattle but the rancher always wakes up the next morning to protect the herd.
So until these cattle are delivered to their final destination and read for slaughter I'd be cautious on the shorting, and instead you might just want to go long once that middle rising trendline is backtest this week. My best guess is that we peak out on Tuesday in the 1960+ area and then drop back into Thursday or Friday for the low... which again should only backtest the middle rising trendline that we just broke out of last week. It should be in the 1930 area by Tuesday but with the 10 day moving average at 1923 we could see that hit to trick the bears by piercing the trendline of "now support" (former resistance) on an intra-day move.
It's common for them to briefly pierce through support and resistance levels I've noticed as it lures in the suckers just before the turn and go the other direction. I think that area just below 1930 is a good entry for a long into the 3rd week of this month as it's option expiration week and is bullish 80% of the time. You could probably get long and this Thursday or Friday (June 12th or 13th) and ride it up to that 2000 area which could come as early as by the following Friday the 20th (no guarantee on that time frame though).
Naturally everything I'm speculating on here can change (and usually does... like 100% of the time! LOL), so keep checking the comments for updates as time goes forward as I post any changes there which also get reposted on Twitter and Facebook.
Hang in there bears, you only have another month or so to go...
The Scary planetary alignment due on April 21st, 2014 which is synchronized with the upcoming huge financial asset bubble burst! Be ready!
Certain important planetary alignments can be used to project both the minor and major turning points in stock market. In other words, some important planetary aspects can be used as a great timing tool in the stock market activity.
There are two systems of measurement that define the periods of the planets; the “sidereal “and “synodic” systems. The sidereal period is the time it takes a planet to complete one orbit. For instance, the sidereal period of the earth is 365.25636 solar days or Mars whose sidereal period is 687 solar days. On the other hand, a synodic period measures the period between two successive conjunctions of two planets. For example, the time interval between two successive conjunctions of Jupiter-Uranus is 14 years.
The planetary aspects are created when the important angles of the planets are aligned. As a matter of fact, such angles have traditional names; Conjunction(360 degrees), Opposition(180 degrees), Trine(120 degrees), Square(90 degrees), Sextile(60 degrees), Semi-Square(45 degrees), Semi-Sextile (30 degrees).
One of the most important planetary aspects is due on April 21st or 22nd, 2014 which could be synchronized with a nasty financial crisis.
Actually, It will not be the end of the world though. At that time, Uranus is exactly square (the 90-degree aspect) to Pluto. It is also square to Jupiter and both Jupiter and Pluto are square to Mars. You see, all four planets are either 90 degrees (Square) or 180 degrees (Opposition) to each other. It could be a real scary planetary aspect which might impact the financial markets, especially the stock market BIG TIME.
It is really important to understand that big world events are not necessarily synchronized with the major planetary aspects, the exact date on which they occur. Sometimes a couple of days before or after or even a couple weeks before or after. You have just begun to see the turmoil in the stock market though.
A shot to the new highs but April is the month you need to watch closely!
As you know, incoming US economic data in early 2014 have been largely disappointing and the Fed blames the weaker performance mainly on the impact of unseasonably cold weather on consumer spending, industrial activity and construction. In January, retail sales data came out well below expectations, existing home sales and housing starts started trending significantly lower, US manufacturing activity also appeared to be decelerating , industrial production declined at the beginning of the year, durable goods orders continued to contract and ISM manufacturing index dropped to an eight month low.
US real GDP is expected to advance 2.8% this year and 3% in 2015, roughly a percentage point above 2013. Actually, the Fed believes the events and factors at play are short-lived and the US economic recovery remains intact. Actually, this bunch of weak economic data has not yet convinced them to let the market drop as it has all been the weather’s fault not anybody else….
As for the geopolitical tensions, Ukraine crisis cannot just be ignored. Actually, it is a global crisis and will not be a one-day news story which will fade away soon. You see, it has a real potential to be escalated real soon. All eyes are on Russia and Ukraine, watching them closely.
As you saw, after a sharp decline to open the trading session on Monday, the markets immediately recovered all over the trading day following Mr. Putin’s latest statement, relieving the buyers who were actually looking for value on the dip, and the buying has been continuing to open up the session for tomorrow so that we can see a shot back to the highs. In fact, buyers are all in control, buying the dip whenever they get a chance and we may also have new all time highs. But how much is it going to last?
In my previous post, I mentioned that the market could exceed the levels on my charts, as I somehow knew the “central planners” would be able to get the situation under control, and then put the blame on the bad weather. But how are they supposed to fight the serious events that are about to come up in April. Yes, you heard me, April! Actually, next month will be a rough month for investors and financial markets. Keep an eye out for the markets around these dates, April 15th, 24th and 29th.
I have repeated over and over again that the market will have to correct on the monthly chart as the cycle has just completed and they (central planners) are trying their hardest to hold it up as much as they can. Whether it is a serious geopolitical tension or a financial crisis which might pop up out of nowhere in April and cannot be blamed on the weather, the stock market will have to retrace a major portion of the gains which has been accumulated since the rebound of 2009. If that does not happen, I will sure need to go back to the drawing board to just find out what is wrong with my cycle analysis.
Looking at the charts on the various time frames I could argue a case for both scenario's. One will be right and one will be wrong so we simply have to play the safest bet which I think will be long around the middle to the end of this coming week... but ultimately we know that the powers that be already know which one will play out and it's our job to read their minds.
For right now I think we can all agree that the direction is currently down. But a bottom should appear sometime this week, with the 19th-21st being the idea time frame. Why? Simple really. The coming FOMC meeting on Wednesday the 19th should gives us the clues we need. Assuming that nothing changes and the Fed's decide to continue with their plans to withdraw more of the QE money then we should logically expect some negative reaction from it afterwards. But, as we all know, the market thinks and reacts ahead of the news... which means that "most" of the selling should be about over with by the time the news is released.
I'm looking for a target low of 1810-1815 SPX for the first area of support. But, I suspect that for that level to work out as being the low we really need to rally some ahead of this coming FOMC meeting. Technically, we are do for a bounce but with the meeting still in front of us I suspect that we will not bounce any and just continue drifting lower due to the fear of the "unknown" from whatever will be said at the meeting. So, we could actually drop to that zone going into the meeting instead of bouncing up to an overhead downward sloping trendline of resistance in the 1860 area.
While we know that one should never trade off the news as it's already built into the charts ahead of time we also should know that with some pending (possibly negative) news lurking just a few days away shouldn't expect any turn back up just because some short term charts are getting oversold. The market does react to news as it's put out their by the powers that be to mislead the sheep in the wrong direction by having something to blame the selling or buying on. Of course if there was no Fed meeting this week then I'd expect the market to bottom around the open on Monday and start rallying from oversold short term charts... but that's not the case here!
So, we should expect the market to chop around until the FOMC minutes are released Wednesday around 2:15 pm, with a downward bias of course. I suspect that we'll end up dropping to that 1810-1815 area prior to the meeting... which should get a lot more short term charts (and the daily too) in an oversold condition, which means the bottom will be near.
Then once the news is announced that they have decided to "stay the course" (meaning to continue withdrawing money) we should see another move down out of fear (done by the retail sheep of course), which could drop us to the rising trendline of support in the 1790 area. Bears should be all over it as it breaks down through the "even number" level of 1800 and that's about when I think we'll bottom.
I've noticed that "Skynet" (the name I've given to the super computer that manipulates the market) has routinely pierced through important levels briefly to lure in the last retail sheep just before switching and going the opposite direction. It should be the same thing for the bulls "if" we rally up to new higher highs in the coming month hit 1900... which of course should be pierced by 5-10 points to trap those bulls long. While I don't know if we are going up to new highs or not I do believe the coming low will trap the bears short... which is why I suspect 1800 will be broken briefly.
I've seen this happen many times in the past and have calculated that these moves usually last 18-20 calendar days and drop 80-100 SPX points. They also don't give use bears many chances to get short with a decent bounce. While I'd love to see a bounce to that downward sloping trendline of resistance (around 1860 now) we might not see it at all? That bounce might not show up until after we bottom in the 1790 area, and then it will of course be lower (in the 1850 probably).
I think the thing to do is to see where the market trades at on Monday and Tuesday prior to the meeting. If it doesn't fall to the 1810-1815 area and instead chops around in this 1840 zone then we could see some brief rally up to hit that trendline right around the FOMC minutes to scare out the bears that are currently short. Then a drop to that 1790 area within a couple more days following the meeting. That would suggest a low by Friday the 21st, which could be the plan Skynet has for us sheep?
The other plan would of course be a continue drop into the meeting with a low in the 1810-1815 area when the minutes are released, followed by some panic selling to the 1790 area, and then a rally back up to start from that day forward into the rest of the week or more. The only thing I see here that has high odds is that we will continue down more next week and probably bottom in the 1790 area. Then the rally that follows could put in a lower high (then the 1883 high) or make one last higher high in the low 1900 area.
Therefore the safest plays I see here are to short any decent bounces with a exit low area of 1790 and then get long for a rally to at least the downward sloping trendline of resistance, which should be in the 1840-1850 by then. After that I don't know? We'll have too see what the charts tell us at that time as well as the propaganda being pitched to us sheep on the main stream media news channels.
If they continue to preach the end of the market scenario then we should expect the resistance to be broken and another higher high is likely. If they talk about the market going to new all time highs then we should be shorting and expecting that resistance to hold and the expected right shoulder (of what should then make up a nice "head and shoulders" pattern) to become some type of "Wave B" up or "Wave 2" up... meaning a big wave down should follow.
It's really too early to know which will play out so for now I'll just be focused on this coming week and will as always give you guys updates in the comment section as things change and play out in real time. Making forecasts this far in advance are just to be used as a general road map of what to look for... not to trade off. The charts change daily and the best I can do is tell you what I see today. Always read the comments for updates.
Why will the huge stock market correction happen real soon?!
…by Ali Firoozi Yasar
I am not being paranoid here and aside from the cycle-work, there are clear reasons that a dramatic decline in the stock market is on the way. Actually, it could strike any day now. The market is just hitting pre-crash tops, we being at the beginning of a new bull market is all over the financial media and companies are still reporting positive earnings but you folks should be aware that the stock market is on the verge of another huge decline.
The annual S&P 500 consensus earnings per- share is expected to come in a lot lower than originally predicted. You see, estimates were so close to $125 in January 2012, and now have dropped 10% to only $112. In spite of the warning sign of declining earnings, the S&P keeps on going up.
The investors and traders are extremely bullish on the stock market now. As a matter of fact, the reading is getting close to a 10-year high, and most of you guys can tell from experience what happens if market sentiment is at extreme levels one way or the other. If the small traders are so bullish, you’d better be cautious. You know better than anybody else that what happens to sheep?! Sheep gets slaughtered.
Actually, I could name many other factors but now we have enough evidence and clear reasons (aside from my work) that the stock market is awaiting a drastic correction which could result in a dramatic stock market decline, 50% unemployment, and 100% annual inflation starting this year.
The charts I showed you in my last post the general trends of the market. In other words, the market may or may not exceed the levels I indicated on the charts. Actually, I only wanted to warn you guys to be prepared for the “unthinkable”.
I hope, you guys will consider this a wake-up call, especially those who are not prepared or willing to admit an ugly truth.
As most of you folks are ware, we have recently received important news about the economy: GDP, Weekly jobless claims and pending home sales data and also an additional $10-billion QE tapering through the FOMCs latest statement.
The annualized GDP rate sounded OK. Consensus was for a reading of 3.0% but in fact, the 4th Q estimate 22% in three months. The weekly jobless claims were supposed to show a reading of 327,000 but the actual data was a bit quite worse, at 348,000 new jobless claims. And eventually, the pending home sales data came out which was really terrible! You see, economics’ consensus was for a small depression of -0.5%; however, the actual release was -8.7%.
Please check out the chart No.1 below. As I had already anticipated, the market topped out and the prices kept on moving down, finding support at the 1761.00 area. You see I am not so precise on the charts as I solely intended to show you the model, not focusing on the exact price&time levels.
Now check out chart No.2, even though the markets will do what they are supposed to do, the main- stream analysts and advisers attributed the brief rebound on January 31st to the better then expected GDP figures and they would still like to see if the rebound is able to maintain the momentum to the upside, hoping the prices will go to the Moon, not knowing there are not many buyers left and it is time for a good break.
The prices will bounce real soon, back-testing 1810.00 area in order to suck in more retail traders, or we could see the market rally briefly, then a sideways chop, after that a drop to the lower levels as indicated on the chart. You see, my business cycle suggests that the U.S economy is ailing now; you may also see bad earnings reports during the coming days, adding fuel to the flame, consequently the market will have to correct and have a good break before it starts recovering again.
May you play it safely and profit handsomely,
Ali
_______________________________
When will the stock market bubble burst?
...by Ali Firoozi Yasar
Hello folks!
Hope all is well with you guys. I know it has been a long while since I last posted on Red’s blog. I have been super busy at work, so my apologies for the long absence. But now it's important to get you all this update as the time is near.
The stock market is at a critical moment! Goldman Sachs has suddenly decided to warn all of us that the stock market could decline by 10 percent or more in the coming months! But are they just honestly trying to warn their clients that the stocks have become overvalued at this time or is it just another agenda at work?!
Whether it is an agenda or not the stock market has just entered a very dangerous zone. Stocks are massively overpriced and investors have been borrowing huge amounts of money to buy stocks. Consequently, the margin debt at the New York Stock Exchange is truly at a crazy level!
These kinds of behaviors and signs actually indicate that another bubble burst is on the way. On top of that the state of overall U.S. economy is getting worse while the market is soaring to new highs. It is not a good sign folks. The U.S economy is in a very bad condition now, in fact it's in a much worst condition then it was the last time we had a major crash back in 2008.
Employment is much worse now that it was at that time and the U.S banking system is more ailing with more debts than it was back then. It owed about 10 trillion dollars but today the debt has increased to more than 17.2 trillion dollars. The market keeps on fooling the masses with this illogical bubble, but this "fooling" can't continue.
I highly suspect this massive stock market bubble will not last for much longer, and a lot of financial market experts are now advising and warning their clients to prepare for a substantial pull-back. You see the market was manipulated by the Fed in early August when a dramatic decline was due.
A lot of people had already been aware of that, which was probably the reason for the delay until now. The bottom line is... the energy of the current run has fully been drained and the Fed is not able to fight it any more.
Actually, it can be likened to a man who has been holding a big weight over his head for a little while but now his energy is getting depleted. So he takes a quick shot of Adrenaline to keep him going a little longer (aka "more printed money secretly injected into the market... [most likely]), and you know it's his 4th, 5th, 6th shot or more? With each time the effects last a shorter time compared to the one prior, and I think this is the last shot before the weight is dropped!
As mentioned above, the market was manipulated by the Fed in early August and it has been tolerating the burden since then. They are not able to hold it up anymore. This is actually what I see in the S&P500 based on the cycle work and harmonics. I am afraid I cannot give out much information here as it could be leaked and copied.
I believe the market will put in another high but the length of the rally will be relatively smaller, then a sharp decline to the 1350 area is possible. After that, a rally back up to new highs (the 2100 area is very possible) will probably follow. You see, it can be a huge opportunity to enter the market with a large short position when the time is right. As soon as the decline kicks off there will not be a major pullback to re-enter so you would want to make sure not to miss the ride at the very top.
Last Thursday and Friday we seen the start of a very nasty correction that is coming and should last all of February and into early March before bottoming. While I did not know the exact date of the top it appears now it was last Wednesday, January the 22nd. In my previous post I mentioned that it was possible that traders would start selling off a week or two ahead of the coming FOMC on the 28th and 29th, as well as the debt ceiling deadline on February 7th... and it looks exact like that's what's happened.
From here I'm now expecting a short term bottom sometime Monday and a rally into Wednesday the 29th when Bernanke speaks. This rally should take us up to the 1825 SPX area to just under the 1850 prior high. There's a downward sloping trendline there that should stop the bulls on this bounce, which will be some type of wave 2 up with the recent selloff being the wave 1 down.
The price level isn't as important as the time period as we know that around 2:15pm on Wednesday there is extremely high odds that the rally will end shortly before the FOMC minutes are released. Whatever Bernanke says I fully expect it to be negative for the market and will start the wave 3 down into Thursday and Friday of this coming week. I would expect the current low of 1790 to be taken out on this next wave down.
This will be Bernanke's last speech before the new woman takes over as Fed Chairman. I previously speculated that the big downturn move would happen either at the FOMC meeting on the 29th or the debt ceiling deadline on February 7th. Looks like it's going to be the 29th for nasty wave 3 down to happen.
Then when the 7th comes up and they are unable to reach an agreement I'd expect another dump to happen. However, if we rally early this week as I expect and then dump from Wednesday to Friday I'd expect some type of bounce the following week on "hope's and prayer's" that they will say something positive on the 7th to end the selloff.
But I doubt that will happen as I believe the elite themselves are giving those of us awake and listening the exact road map of what is coming. In this video by IMF head Christine Lagarde she (strangely) starts off her speech by discussing numerology (fast forward to the 6:30 minute mark and start playing the video), and she talks about the importance of the number "7"... which she makes reference to by saying the following quote:
"2014... drop the zero, 14... 2 times 7... that's just by way of example"
Really? Example my ass! You are clearly saying that 2-7-14 is an important date! That's February 7th, 2014 of course, which is right in the middle of the 3 day Legatus meeting held February 6th to the 8th, and also happens to be the debt ceiling deadline date. Do you believe in coincidences? I don't... not with all the other "buzz words" that she drops in her speech.
2014 will be a magic year (meaning what? will you pull a rabbit out your hat? will you steal money from the sheep without them seeing you do it?)
100th anniversary of the first world war in 1914 (strangely when I researched what happened to the DOW back then it was closed down for several months due to the first world war starting. are we expecting the same here? REFERENCE: http://www.ritholtz.com/blog/2013/02/most-long-term-charts-of-djia-are-wrong, http://measuringworth.com/DJA, https://www.globalfinancialdata.com/gfdblog/?p=1426 )
70th anniversary of the Bretton Woods Conference that gave birth to the IMF. (The delegates deliberated during 1–22 July 1944, and signed the Agreement on its final day. REFERENCE: https://www.google.com/search?q=first+bretton+woods+conference+date&ie=utf-8&oe=utf-8&aq=t&rls=org.mozilla:en-US:official&client=firefox-a&channel=fflb Not sure what the hidden message was here?)
25th anniversary of the fall of the Berlin wall (Destruction date: November 9, 1989... but what is she hinting at here? Is the "buzz word" the "25th"or the "fall"? Does the 25th mean a certain future date or does the word "fall" indicate that the market will fall hard?)
7th anniversary of the financial market jitters. (again with the focus on the number 7... meaning what? are we looking for another move down similar to 2008?)
The crisis still lingers... (clearly this means we are going down again)
It will not happen randomly... (of course not, it's always planned)
"Global growth is still stuck in low gear" (Hmmm... just a fall guy to blame I guess? We tank and it's the fault of slowing global growth)
It will not be without downside risks, and significant ones (referring to inflation... or was it really meant to refer to the stock market?)
We are seeing rising risks of deflation... (good for us sheep but bad for them)
Global growth slowing down as the economy cycle turns... (the "buzz word" that stands out to me there is "cycle turns")
Risk of capital runs... (You really mean the gangsters are moving their money out the market before the collapse)
Dry run back in May of 2013... (Ah yes, the old test where Bernanke hinted at pulling money out the market last year)
There could still be some rough waters ahead of us... (another clear warning that they plan on taking the market down)
Overall, the direction is positive (meaning after the downturn the market we'll go back up again, which should be a final Primary Wave 5 up with this coming correction next month being a nasty Primary Wave 4 down)
95% of the income growth went to the top 1% (Duh... nothing new there as that was always the plan! Steal from the sheep and give to the wolves)
Tapering will have too be very well timed... (again, she's clearly staying that we are going to withdraw money from the market)
Central banks will have to "undo" what they've done... (and again, more references to cutting back the stimulus?)
Removing the threat of the debt ceiling... (meaning what? They won't set one, or make it unlimited? I don't know what she means with this sentence?)
A stress test will be done in 2014... (Why? You already know the banks would all fail. I guess they have to blame the correction on something)
Ok, there your shortened version of what Christine Lagarde is really saying to us sheep. By now you should be about 99% confident that we are going down hard this February. They've clearly told us sheep the truth and you can't blame them if you weren't listening.
Now I really don't think we are going to have another False Flag event in the Olympics but I must say that it starting on the 7th with Legatus on the 6th-8th and the debt ceiling on the 7th is some might strange coincidences.
Lindsey Williams puts a date of "90 Days" until the elite will reset the currencies of 204 countries world wide!
While I can't say that he's going to be right... or wrong but this is first time I can recall him stated an exact time frame like this. He's previously stated dates like "by the end of 2013" or "by the end of 2012" the dollar will be basically worthless. That's not very specific as it's too speculative due to the nature of what one person calls worthless versus what someone else states is worthless.
But I will admit that the "buying power" of the US Dollar is a whole lot less today then it was in 2011 as I've personally seen prices rise on food significantly in the last 2 years. And I'll noticed the trickery of the companies selling food products by keeping the price the same but by decreasing the size of the container that it's in. I now see 59 ounce bottles of orange juice instead of 64 ounces, which is a half gallon. Other things they just rise the price on them or keep the box the same size but put less in the bag of chips as they just have mostly air in them inside a large bag.
It's crooked but it's all planned and done by the elite to keep us sheep stupid, fat and too tired to fight them.
I'm actually surprised that they let Lindsey state a time frame for the global currency reset. So either they are setting him to look like a fool when it doesn't happen or they are telling the truth and just don't care if we sheep know about it as there's nothing we can do to stop them. That's true I'm sure but while we can't stop them we can profit from it... "if" it really does happen in the next 90 days?
The 90 days starts from December 4th, 2013 so that means it's should happen by March 4th, 2014. Now if you listen closely to Lindsey's words you'll notice he states that "if Christine Lagarde gets her way" (she's the head of the IMF) then this global currency reset WILL happen. The thing that stands out to me is that he says that we'll first see them raid the pension funds of America and then shortly afterwards they will reset the dollar. So if we don't see them raid the pension funds then they won't be resetting the dollar by 30% as he states.
So how can you profit from this you ask?
Simple really... "if" we see them confiscate the pension funds and nationalize them within the next 90 days then there is a very good chance that Lindsey will be correct and that they will devalue the dollar here in America (and the other 200+ countries) "shortly thereafter" as he states. What Lindsey doesn't tell us in this video is what the new reserve currency is (but I think I heard somewhere it's going to be the Chinese Yuan?). But regardless of what the new currency will be one thing will NOT be affected negatively and "should" go up an equal percentage to the value the dollar goes down.
That "thing" is GOLD... and "if" this happens as Lindsey states we could see gold go up 30% overnight when they devalue the dollar 30% overnight. If one was to time this correctly and simply go long on gold via GLD by buying some "calls" a small fortune could be made. While I can't tell you what to do, which strike price to buy or when to buy it... you can figure this out if you just keep your ears open to see if they raid the pension funds first. As if that happens you'll know that they could do the currency devaluation shortly afterwards... and it should all happen before March 4th, 2014 if the 90 day period is correct.
You should know by now what time period I'll be looking at hard for a decision to be made (or canceled?) as I told you all many times to pay close attention to when these people meet at this organization because many times (not always) "turns" in the market happen shortly before, during, or after any of these meetings. The next meeting is February 6th-8th, 2014 so when the elite meet during this meeting they "should" make their final decision to "do" or "do not" reset the currencies and steal the pension funds.
Therefore my personal plan of action will be to look for them to steal the pension funds first and then shortly there after to devalue the dollar by 30%, and so I would be looking to buy some gold calls prior to the devaluation but after the pension fund raid. Now I might also by a small position of calls simply ahead of the February 6th-8th meeting with the expectation that "they" will be stealing the pension funds right after the meeting. They could do them both at the same time and therefore we'd miss the opportunity to get some gold longs via GLD Calls... which is why I might get some early in case they trick us and do it all together where we can't get long in advance.
I will suggest that those of you that are familiar with options to login to your account daily and look at the amount of "open interest" that shows up every day in the various strike prices of the "GLD Calls" for the month of January, February and March 2014. Why? Because insiders WILL load up on gold calls shortly before this global currency devaluation happens. If you see that please make sure you share that will everyone here on the blog by taking a screen shot and posting in the comments (or email it to me and I'll post it).
As far as the market I'd guess it won't necessary move it too much but I'm sure there will be some fear and therefore selling in it. I just see the biggest opportunity is in betting on the huge move up in gold. Right now the market is selling off some but I wouldn't be surprised if we rally this coming week and into the end of the year.
Red
P.S. Here's the link to the article I speak of in the video...
Over the last month or so I've been quietly making money in the junior stock market and enjoying some much needed rest. I've been eliminating all the stress of wondering what will the government do next to manipulate the big market by simply not playing it. It's too easy to make money in the junior and penny stock market that I just didn't want to write other post on where I think they will take the S&P500 to next. Why worry about it when you can make money in the junior market without sleepless nights.
If you read this blog in the hopes of finding that one secret golden piece of information that will allow you catch the exact top (and/or bottom) of the stock market so you can make a huge profit on the move down then you'll love profiting from all the new junior stock picks I plan on putting out in the coming months. I've been able to successfully align myself with the right connections where we spot this junior pennies just days before they explode higher!
I mean picks like PGSY that we discovered back on 8/30 at .02 cents just before it ran up to .07 for a 350% gain in only 5 days! That's HUGE! I realize that this market might be new to you but not playing it with gains of 50%-100% are common place... and most moves only take a couple of days! I'm in love this market market as it so easy to make money in it now. The connections I've aligned myself with are able to spot practically every winner in advance of them exploding upwards.
You see, there are "tale-tell" signs that show up before hand and the pro-traders I've surrounded myself with in this market know EXACTLY what to look for to find every one of these winners. Again, I'm not trying to sell on making money in the junior market instead of the big market, as if you are killing in there then congratulations. But if you read this blog because you're not making money regularly trading the nasdaq, s&p, russell, dow, etc... then YOU need to make a change!
Yes, yes, I'm going to give you an update on what I see in the big market in the coming weeks but I'm personally going to stick to trading these incredible junior picks I'm getting. Think of it like this... we bears (that's most who reads this blog) have been like small fish (maybe 1-2 feet long) swimming in the big bad ocean looking for food and trying not to get eaten from all the huge sharks around us (wall street market makers and manipulators), while I just escaped and found this nice quiet pond of water (the junior stock market) with nothing but small 1 inch minnows swimming in it just waiting to be eaten by a big fish like us!
If you align yourself with successful people and follow what they do then you'll become successful too...
I've do just that in the past month by making the connections with other successful traders in this junior stock market, which is something very few will ever be lucky enough to achieve. But you my dear reader are now one of the lucky ones as you will get access to all these HOT junior stock pick (some Nasdaq too) in my newsletter. So unless you have your own connections (like may Jim Cramer is your buddy) in the big market you'll going to still be a small fish swimming in the big bad ocean of sharks... unless you decide to join me in my quiet little pond?
This coming month and many months afterward my partner and our connections will be finding many more new winners BEFORE they explode higher and we will be giving them all to YOU in the newsletter so you can become a WINNER too! The coming bear market expected is something that is hugely positive for the junior stock market as traders flock to them in times of uncertainty... which is what I'm expecting in October and November of this year. Of course next year appears to be worst... which is GREAT for the junior stock market!
If you're not on my newsletter you'd better get on it asap as the coming turbulence in the S&P500 is going to make the junior stock market just that much better. Kinda like the farmer restocking the pond with fresh new minnows! Don't get eaten by the sharks, come take it easy in the pond. You can join here: http://reddragonleo.com/newsletter-sign-up
So everyone is wondering if the stock market is still going to crash in October? And the answer is... "define Crash?" If by crash you mean a total collapse like in 1929 and what Lindsey Williams speaks of in his messages he gets from his elite sources, I'd so NO. If you mean will it have a 2,000 or 3,000 point drop in the DOW, I'd say YES.
Based on what I'm seeing in the charts we have either already completed or will complete in the coming early days in October the very large Primary wave 3 up from the 1074.77 SPX low in late 2011, which sets up the stage for a Primary wave 4 down that only has to remain above that 1074.77 low of Primary wave 2 down to be a valid Primary wave 4... which is one hell of a drop! I'm not expecting anything remotely close to tanking that far down but instead I'm simply looking for the gap up open from January 2nd, 2013 to be the target zone bottom.
That's somewhere between 1420 and 1460 on the SPX, which is also about a 3,000 point move down on the DOW from the current high. However, I'm not sure if the high is in yet or not? Inside this large Primary wave 3 up we have 5 Major waves and we appear to have completed the 5 Major wave up at the recent 1729.86 high... but it's possible that we still have a little more to go yet.
Naturally there are smaller waves inside the Major wave 5 up as well, which started at the 1627.47 low. Since it's a 5th wave it too will likely have a 5 wave pattern inside of it. I currently can see a 5 wave pattern up from 1627.47 to 1729.86 which all makes up a the 5th Major wave up inside Primary Wave 3 up, which "if so" will complete that large wave and allow for a Primary Wave 4 down to start.
The timing of a huge wave down starting soon and the coincidental timing of the debt ceiling deadline... and the Legatus meeting is something bears need to be very aware of. The charts only say we are about to see a Primary Wave 4 down start (which can easily be 3,000 DOW points) but add in the other events that happen to be timed out to occur with the topping of the Primary Wave 3 up and I'd say we have really great odds of a big move down coming this October.
As for a date...
It depends on whether or not we have topped at the recent 1729.86 high or not? While I can count 5 waves up in this final Major Wave 5 from the start of it at 1627.47 there's also the chance that those 5 smaller waves are just some type of A wave and the recent move down to Friday's close at 1691.75 SPX wave a B wave down... all still inside that final Major Wave 5 up. This leaves us a smaller C wave up yet to come inside Major Wave 5 up... and that should then complete Primary Wave 3 up from it's start at 1074.77 in 2011.
So, if A = C then we can guess at the final high by adding the points moved up in the A wave to the coming expected low of the B wave (which I think we'll see Monday October 30th, 2013). And since that A wave started at 1627 and ended at 1729 we have about 102 points, which added to say around 1680 for a estimated low on Monday (for the B wave down still inside Major Wave 5 up) that puts our upside target for the C wave up around 1782 (102 points added to 1680).
Personally I think that's too much to expect and I'd be more likely to believe that we'd have a shortened C wave that just barely goes above the 1729 high... maybe we get to 1750? I just don't see 1782 with the current debt ceiling news hanging over the market right now. I guess if the news media comes out and says "all is well, we feel positive that we'll reach an agreement before the October 17th deadline" then the market "could" relax and rally up that high.
But time is running out as October is coming upon us very fast now. It just doesn't look like they will have enough time left to produce another big wave up before that deadline date hits. A shortened wave C up to complete Major Wave 5 up and Primary Wave 3 up seems more likely. There's a lot of "negative divergence" patterns showing up on different time frames in the various indicators (like the MACD's, the Histogram Bars, etc...) which tells me we "could" already be topped?
If we are already topped...
Then we have started the first wave 1 down inside of Primary Wave 4 down. This move looks about done with a little more downside possible on Monday before we can expect a wave 2 up to start. If this is the case then by this coming Friday October the 4th I'd expect the wave 2 up to end and allow a wave 3 down to follow the next week.
This should be a tricky period as after a 5 wave pattern down happens it will have made up a likely Major Wave 1 down inside Primary Wave 4 down. This means we could bounce up hard in an ABC Major Wave 2 up that could possibly come from a positive announcement on reaching some type of agreement about raising the debt ceiling or extending it into a future date. So if we see that happen on the 17th I'd expect a rally until the 22nd with that date being a likely top for Major Wave 2 up because it's a "double eleven" date... and you know how they like to use the power of Numerology in the market.
Think about that for a moment now. If we are in a Primary Wave 4 down (that can go 3,000 DOW points down easily) and inside that large wave we complete a Major Wave 1 down (into the 17th for the positive news outcome regarding the debt ceiling) and further completing the Major Wave 2 up by the 22nd then we are looking at a Major Wave 3 down to start inside a Primary Wave 4 down. That my friends should look like a crash wave!
This is again just speculating but it's a strong possible count if we have already topped and they announce some positive news on October 17th about the debt ceiling issue. You remember November of 2012 when the market sold off in front of the first time we experienced this debt ceiling issue and once it was raised we quickly bottomed at 1343 and rally hard into the rest of the year and into the first half of 2013.
We should expect the same to happen again once they actually announce the raising of the debt ceiling for the 2nd time. But, it seems likely that they will play around for awhile and not make that agreement until after we have sold off into the 1420-1460 SPX zone to complete this expected Primary Wave 4 down.
The question is, how do to do it?
Delay, delay and delay is the answer I believe. You tell the news that we politicians are working hard to resolve this issue and get a bill passed to raise the debt ceiling limit as soon as possible... but we don't have a deal yet. However, we are going to agree to extend it until late in November (again)... which tells the market to sell off until that period when they agree to raise the debt ceiling just like they knew they were going to do anyway.
It's all just a dance timed out perfectly to allow the market to correct hard in a Primary Wave 4 down scaring the hell out of traders and getting every bear in the world on board short... which then allows them to squeeze the bears up into early 2014 for Primary Wave 5 that finally will end the entire bull rally from the 666 low in 2009... and further allow the real stock market crash to begin!
These are the possible moves that are likely coming in October and while I'm not sure with one or which way they will play out I do feel confident that a Primary Wave 4 down will start at some point this coming month. It could already have started or we could have on more higher high still coming? Regardless, we should still bounce some next week into Friday October 4th. It will either end up being called wave C inside the final 5th wave up to complete Primary Wave 3 up, or it will be wave 2 up inside Major Wave 1 down inside Primary Wave 4 down.
Therefore, the logical thing to do is to watch and see how high the market bounces into the end of next week before shorting. If they some how spin something the law makers say next week to sound like a deal on the debt ceiling will be made soon then the pressure will then let up on the market and we could see a decent move up. I'm still NOT expecting a move to 1782 but a slightly higher high over 1729 is possible. Of course it could fail to make it and fall just under 1729 and make either what we could call a double top area or some other Fibonacci retracement level that is 10-20 below 1729.
I would welcome a squeeze up to make a new high as that makes it easier to fall when it rolls over as the bears would have been stopped out. But I can't control what they decide to do with the market between now and October 17th, instead I'll just be listening closely to their buzz words (as Lindsey Williams likes to call them) for clues.
We all know that they WILL raise the debt ceiling limit, but when is the question? There will be mixed signals from law makers as the play the dance to move the market in the direction they want. But come October 17th I'm NOT expecting them to say "we've decided to raise the limit", but instead I am expecting them to state something positive to squeeze out the bears with a rally into the 22nd (this assume we make a 5 wave move down into the 17th to create Major Wave 1 down).
However, if they have not went down into the 17th in a Major Wave 1 but complete that wave the week or so prior, thereby rallying up with Major Wave 2 (inside it should be an ABC pattern of waves) and the topping out before the deadline date, they should say something negative like "we've not reached any agreement yet and will be setting up another deadline in late November".
Naturally you can expect the markets' reaction from a statement like that to be very negative, so we'd see that Major Wave 3 down inside Primary Wave 4 down start immediately! Again, that would be your crash wave! This all assumes the plan is to continue down some more to make the Major Wave 1 and then back up into the 17th for the Major Wave 2 completion. This plan suggests the high for Primary Wave 3 up from 1074 is already in at 1729 and we have already started the first Major Wave 1 down inside Primary Wave 4 down.
The other scenario is that we still haven't topped for Primary Wave 3 up and we are head to possibly 1750 SPX or so into the end of next week or even into early the following week. Then as the days count down toward the October 17th deadline the market starts Major Wave 1 down inside Primary Wave 4 down as it waits for the announcement concerning the debt ceiling.
On that date the law makers decide to extend the limit for another month pushing the deadline into late November. The market rallies from the relief of the news to make the Major Wave 2 up inside Primary Wave 4 down. Then on October 22nd the market exhausts its' rally and realizes that the debt ceiling issue still hasn't be solved yet... and panic sets back in causing Major Wave 3 down inside Primary Wave 4 down to start.
Bata-a-bang Bata-a-Boom!
There you go...
Likely top for Major Wave 2 up inside Primary Wave 4 down should happen on either October 17th or the 22nd. Then Major Wave 3 down starts inside Primary Wave 4... and that my friends the the wave down you want to ride! It's the surfers dream wave that happens once or twice in a lifetime (found during hurricanes and tsunamis... which coincidentally is the same thing it will feel like in the stock market I believe).
Will the next market crash happen before or in mid-October?
... update from Ali
Hi folks!
I know it has been a quite while since I last posted on the blog, talking about the market plunge due in early August and such. Yes, actually my bad! You see I project most of the turning points but I really did a bad job projecting the crash. I knew for sure, the market would put in a top early August and it really did but that would not lead to a collapse or anything. You see, with a lot of people already being aware of August 2013 being a critical month, new energy was added to the market, changing the harmonics. On top of that, the Fed was also aware of the market being so close to the plunge so they did their best to hold it up through a lot of money printing. Then at that time the market was also traded by “Big Dogs” to attract as many buyers as they could.
The current situation is fooling everyone one now. You might think, no war with Syria, no war with Iran, positive GDP numbers and the stock market will go to the Moon but here are the real issues, the debt ceiling drama and budegt deficit crisis. You see, the drastic measures to avoid hitting the debt ceiling will probably be exhausted in mid-October and also the budget deficit will likely soon go all over the press. In addition to the current economic issues, we also have a monsterous “New Moon “ coming on October 4th. Generally, October is going to be a difficult month for everyone and I suppose we are in for a rough couple of months.
Now I would like to turn your attention to the S&P500 weekly chart.
As you see, I have plotted the 20-day moving average to indicate the moving support and resistance levesl. Not that I apply such method in my market analysis but I am simply doing this to indicate a very important support level at 1656 area on the weekly chart. You see, the prices will likely soon hit it, then bounce a little bit. I assume it will be a weak attemp to make a higher high. Whether the market is able to make a higher high or not, the next attemp will be so weak. DO not let it fool you! All you would want to do is to wait for a “set-up bar” to form, then short the market without hesitation.
P.S. Another reason to expect a bounce is the goverment shutdown that happens (or doesn't happen... which is what I think will happen) that is set for September the 30th at midnight. That's Monday of course and there is supposed to be a vote that occurs on it at 8pm EST tonight (Saturday the 28th) while I'm writing this post. So kind of agreement should cause the market to rally. Maybe it is announced later tonight or possibly Monday after the close? Don't know which but once it's announced (and again, assuming it's positive) we should rally from the government remaining open for some future extended time period.
These 2 articles (http://finance.yahoo.com/blogs/breakout/easy-money-policy-lead-world-greatest-credit-collapse-164806633.html) and (http://www.cnbc.com/id/100950234) are clearly put out to mislead the sheep into shorting this market heavily. This means the FED's are running out of money and don't have enough power left to get the market up past the current high. They need more money and that money has too come from the bears as there's obviously no retail traders left in the market buying at these levels.
So how do you get more money? You put out articles on the propaganda main stream media outlets that speaks of crashes coming. The sheep read this and start shorting. The way the game is likely going to play out is something similar to the big head and shoulders pattern back in 2010. Everyone seen it and waited for the top of that right shoulder to short at around 06/21/2010, at which point they tricked the bears by breaking down below the neckline of that pattern around 1050 SPX. They went down to 1010 on 07/01/2010 before reversing and going back up to make another right shoulder on 08/04/2010. Then they dropped again to lure in more shorts thinking we were going to crash really big. You have to remember how bearish the sentiment was back then as we had just had a flash crash on 05/06/2010... so traders were looking for a crash even bigger to follow.
Well, it never happened as they tricked the bears by rallying for many months afterward as they "gamed" the huge head and shoulders pattern followers. I remember back then how main stream media puppets were even talking about it on a chart on TV. Naturally they were paid to do so as it was very important to get the sheep extremely bearish and heavily short. That was the money they needed to squeeze the bears and rally it up to new highs later that year. I see something similar happening again.
Basically I see a move down next week to around prior support in the 1650 SPX area. But, this rally we are currently in could go up higher before we start to drop. I don't see it happening on Friday the 9th though as I expect it to be choppy with up's and down's inside the triangle the market is in now. Then Monday we could see some final move up to end the rally. Don't know how high but it shouldn't go above the current high. Maybe it comes a few points shy of it... don't know? It could happy Friday of course but odd's say it comes on Monday. Either way it's a good short down to the 1650 level of support. Then expect a rally and probably more selling afterwards. That's too far out to look right now but some how I think it's going to be a choppy 3 weeks before they final some bottom that they decide to launch their rally from.
The ideal spot would be the 1560-1580 area and then back up to the 1670 area to make the top of the right shoulder where the left shoulder was the May 22nd, 2013 high. The head is obviously the current high at 1709 on August 8th, 2013. The tricky part he is to watch the news closely to see if the paid actors start talking about the head and shoulders pattern that I think is going to form. If so then when you add the stories now out about a 1987 style crash (by more paid puppets) which that media exposure of this future pattern I'll give it a 99% chance of it failing and rallying to new highs into October of this year when I think we'll hit 17,000 DOW and then CRASH around Legatus again!
We all know that the gangsters totally control the stock market 100% now and when it comes to the sheep (you and me) discovering the date in advance sometimes they are forced to make changes. Remember, if the sheep get short at the same time the wolves (the gangsters) get short then there's no one to steal the money from. They must have the sheep long when they are short as they need to have someone on the opposite side of the trade or else it wouldn't work. This is why the wolves will use their propaganda media outlets on TV (and on the internet) to lead the sheep in the wrong direction while they go in the opposite direction.
So when I see an article about a stock market crash that speaks of a well known forecaster named W.D. Gann that points to this August 16-23rd as the spot where the crash will start I have to wonder if it's not "planted" information to mislead the sheep again? It's different when it's on a small website run by one person as then it's likely put out to help fellow traders. But on a big site that a company runs you have to be leery as you don't know whether or not the gangsters control that site and therefore use it to steer the sheep in the wrong direction. I won't say for sure on it as Futures Mag isn't exactly as huge as CNBC, Yahoo Finance, or CBS MarketWatch... but it's still what I consider to be a "main stream media" site. Therefore we should be cautious now and be aware that the planned date could have been changed now?
Come the week of Aug. 16 - 23, the world’s largest Index, the S&P 500, will once again plummet. In an all too familiar fashion, it will drag down all other stock markets, superfunds and savings. No government or economic spin can ward off this descent, because nothing else but time governs the fluctuations of markets. Given that economic formulas and models are only pale reflections of the real world, as a forecasting tool, they can be utterly misleading. The way to gain insight into the forces driving the S&P 500 Index, and predict the Aug. 16 turnaround, is by consulting its graph and William Delbert Gann’s Square-of-9 (for why all Internet depictions of this Square are flawed refer to paragraph 7 below).
The graph’s coordinates X and Y, where X represents price and Y time, provide an untainted depiction of market behaviour. In addition to reflecting ‘price changes over time’, the plot of X and Y’s intersection points reflects also the perceptions, and thoughts, of those driving the ups and downs of price. Given that X is a function of Y, and Y is a function of X, and given that X is the volatile of the two, focusing on the forward procession of Y is far less challenging than the fluctuations of X (Figure 1).
Figure 1
There is reason to believe that when billionaire George Soros broke the bank of England by shorting the British pound on Sept. 16, 2002 and the AUD on May 08, 2013, the Y parameter and Gann’s Square-of-9 dictated his trades.
The first on the ‘to do list’ in analysing a graph is to determine the direction of the dominant trend. Figure 2 demonstrates that bearish trends manifest long down-swings with short upward corrections. And, as the market changes direction, its upward swings become longer in comparison to retreats.
The schematic in Figure 3 captures the 496 calendar day (cd) GFC decline period (Oct. 31, 2007 — March 08, 2009), and the recovery phase (March 09, 2009 — May 28, 2013). It shows that the S&P 500 Index’s recovery, which at the peak of May 28, 2013 measured 1542cd, in addition to being in an uptrend, reached an all-time high.
On June 25, 2013, the decline from the May 28 peak measured 28cd. It was 3cd shorter than its preceding 31cd upswing (Apr. 18 – May 28, 2013). Given this Index’s bullish trend, the sketch indicates that the forthcoming advance, which cannot be shorter than 31cd, will measure 52cd on August 16, 2013 (Figure 3).
Figure 3
To validate these dates, we turn to W.D. Gann’s Square-of-9, however, before proceeding to the Square, a word about identifying markets’ major peaks and troughs.
Even though pricewise the peak of May 21, 2013 was the highest point the S&P 500 reached on the chart, it was false (Figure 4). Given that it was followed by a 3cd decline and a 4cd advance, the longer swing, irrespective of price, is the one that determines the top.
W.D. Gann (1878 -1956) was 13 when he famously declared that “the future is not unforseen.” From the age of 24, the Sqaure-of-9 — a sequence of orderly numbers spiralling outwards in an anti-clockwise manner from the number 1 at the centre (Figure 5) — generated him $50 million from trading stock and commodity markets.
“I soon began to note the periodical reoccurrence of the rise and fall of stocks and commodities. This led me to conclude that natural law was the basis of market movements. I then decided to devote 10 years of my life to the study of natural law as applicable to the speculative markets and to devote my best energies toward making speculation a profitable profession.”
The numerals 1-9 forming the Square’s first ring inspired him to coin the device ‘The Square-of-9’, and its geometrical divisions, cardinals and diagonals.
The Australian mathematician, physicist and meteorologist, Trevor Casey — the first known man to unravel the Square’s mathematical structure since Gann — points out that all the Square’s Internet versions are mathematically wrong. In The Square Spiral— the Mathematics of Markets (BookPal 2010) heexplains that this Square is a spiral mimicking the Milky Way. As such, it unfolds from left to right, in the same direction as the galaxy, and each of its rings expands twice during one 3600 revolution. The first expansion takes place upon the Square’s north-western diagonal and second upon its south-eastern arm. Therefore, in contrast to the Internet versions, the north-western diagonal runs along the numerals 1, 2, 10, 26, 50…∞, and the south-eastern along 1, 5, 17, 37, 65….…∞. (Figure 5)
The other point he emphasises is that the Square is a calculator designed to measure time and should not be used in forecasting price levels. The 0.618 and 0.382 Golden mean proportions, known as Fibonacci ratios, are best for determining the support and resistance levels of price.
Figure 5 – The Square-of-9 constitutes a spiral of consecutive numbers unfolding outwards from the number 1 at the centre. Its numerals follow the anti-clockwise (left to right) direction of the Milky Way’s spiral.
Gann’s breakthrough came about when he observed that time-intervals typically adhere to the Square’s axes in that they commence and terminate upon them. A mature interval bounces off and culminates upon the Square’s same axis by completing a 3600 rotation from and back to the point at which the preceding interval ended. In cases when a swing terminates upon the Square’s opposite axis, at 1800 angle, it remains unfinished until such time it completes a 3600 rotation to the axis it had bounced off. Given that the present recovery wave took off the Square’s eastern cardinal, and must terminate upon it, the Square-of-9 makes is possible to forecast its maturity date.
Click to enlarge.
Figure 6
Sep. 01, 2000 — Apr. 12, 2003 = 922cd
[The nearest value is 916,easterncardinal - Figure 7]
Apr. 12, 2003 — Oct. 31, 2007 = 1694cd
[The nearest value is 1702,western cardinal – Figure 8]
Allowing that the March 09, 2009 trough terminated upon the Square’s eastern cardinal, on day 496 of the run, the subsequent 2009 – 2013 recovery wave must also terminate there. On August 16, 2013, when it measures 1621cd, it and the 496cd downswing will form a 3600 angle upon the Square’s eastern cardinal (Figure 9).
Figure 9 – Eastern Cardinal
Harking back to Figure 3, we see that the recovery wave’s top, on May 28, took place on day 1542 of the run and culminated upon the Square’s western cardinal (Figure 8). However, given that it bounced off the eastern cardinal (on March 09, 2009), its rotation has so far achieved 1800 — an indication of an incomplete move. Note that the peak of May 28, followed by a 28cd decline, touched upon the western cardinal on June 25 at a 3600 (1542 and 28, Figure 8). The final 52cd advance of the recovery wave will reach the Square’s western arm on August 16, 2013, where it will once again form a 3600 angle. However, its total span of 1621cd will fall upon the eastern cardinal at a 3600 angle with the preceding 496cd of the GFC crash.
For three millennia the pharaohs of Egypt relied upon large rocks carved with horizontal lines to record the height the Nile’s waters had reached during each day of the seasonal inundation. Indeed, Nileometer records collected from rocks scattered along the Nile are the longest data series we have. And although large chunks from the BCE data are missing, the records we have go back to 624AD, to the day Cairo’s Rhoda Island Nileometer became functional. The sheer length of this collection speaks volumes to their importance to the then pharaohs and scientists today. Ravaging floods and droughts turned the Nile settlers into brilliant problem solvers obsessed with patterns, symmetry and time sequences. Their effort yielded the Square-of-9 — Egypt’s most guarded secret, which tracked the changes in the Nile’s ups and downs over three thousand years.Subsequently, the pharaohs enshrined it in the Great Pyramid’s tiers where the block arrangement of each mimics the spiral of the Milky Way. When pulled from the number 1 at the centre, this Square morphs into a pyramid (Figure 10). With no data-processing technology, the Square and graphs sustained the pharaohs until Egypt‘s fall to the Romans in 48 BCE. One can only speculate how much richer the pharaohs would have been had they also invented the stock market.
Figure 10 – The Square-of-9 constitutes an image of one pyramidal tier.
When asked “What is the cause behind the time factor?” Gann smiled and said: “It has taken me years of exhaustive study to learn the cause that produces the effects according to time. That is my secret and too valuable to be spread broadcast…” He died of heart failure in June 1956 and was laid to rest in New York’s Brooklyn Cemetery in a grave facing his beloved Wall Street. Just as the pharaohs departed leaving no clue to the secret they buried in the Great Pyramid’s tiers, Gann left us an image of one of its tiers, yet, withheld its layout and instructions of use.
So what do you get out of that post? Is Futures Mag planting a seed to the sheep to go short during that period so they can make money, or is it to mislead the sheep so the gangsters can make money as those short get squeeze and the market goes up to even higher levels then we think possible? If you got a lot of sheep short from them reading that post and the wolves are short too... then will the crash still happen? I just don't know to tell you the truth? Maybe the article wasn't put up on purpose to distract the sheep and just done by some honest writer trying to help? I will say that "if" it shows up again on some other "even more well known" website here soon then we will know for sure that there won't be any crash!
If I were a gangster and knew about this time period, which a whole lot of sheep also know about it, I'd change the plan up a little and start the move down either before that time zone or after that time zone. That way the sheep won't be able to make any money. If it starts early then the sheep will chase the move down looking for the bounce that never comes (until the bottom of course), and if you go past that date then we'll see a huge squeeze during that time zone to put the SPX up near 1780 area... and all the sheep short will lose their money and miss the crash move that will follow. Sucks either way in my opinion... but the gangsters aren't called that just for no reason! Their sole purpose in this matrix is to steal, lie, cheat, rape, murder, and smile while doing it (kinda like politicians do on TV).
Now I've probably talked too much about the number "eleven" and it's possible they change the plan due to the sheep figuring that out. Meaning that the market tends to have important turns (tops or bottoms) on "eleven" dates. The next 11 date is this coming Thursday, August the 8th as it adds up to 22, which is an eleven. After that we have the 17th but that's a Saturday so it's out. Then there's the 26th which is after Gann's time zone of August 16th-23rd. So you have to wonder at this point whether or not "they" will changed up the date and start early (like this week... possibly the 8th?) or start later (possibly the 26th?)?
There are 2 important levels of resistance overhead for the SPX, with the first one being the 1717-1720 area. Then there is the 1770-1780 zone, which should be the target should they go out past the Gann window. If they start early then I'd expect the first zone to be hit this week and then start the sell off before Gann's target dates. So for now I'm just going to be looking for the first zone to be hit and keep my ear to the ground for possible news that could scare the market. Like some planned false flag event or surprise whisper by Ben Bernanake about raising interest rates and/or stopping the QE. Anything that can shock the market like that probably won't be something we'll see ahead of time.
But we all have to do our part to watch as clues could come out before they actually pull the trigger and let her crash. Keep your eye's open on all the major sites for new FP's... especially huge ones! Remember that back when they had the flash crash they put out a FP the night before (around midnight) showing the downside target of 1065 (nice huh? 10[5+6=11] or 111... LOL). Clues are usually given but I'm only one person and can't catch it all. I depend on YOU to help me out so I can help all the other readers out too. Look for FP's and look for possible news events that could be the trigger. I think we are really close now so let's all keep our fingers on the trigger (meaning get ready and prepared to get short).
In my prevoius posts, I spent a good deal of time talking about certain turning points due in late May and the one coming up soon in August. Actually I described how the Venus cycle and Mayan calender work, explaining how the market was going to be weaker and weaker. I suggested that you folks not expect a big decline at first but give it some time and space until it gets weaker and weaker and now the real time of weakness has just begun! All you folks need to do is not to let those short-lived bounces and rallies fool you.
The truth of the matter is that this is exactly what the “movers and shakers” want from you. Actually, they all want you on the bull side now as it would not be so profitable if we (retail traders) knew exactly when to jump on board. As you all remember I also touched on Armstrong’s cycle work. You see, most financial markets analysts out there are already aware of the dates given by Armstrong’s pi-cycle work. Now with this being said do you really think that the market will turn based on his dates? Of course not!
With too many traders and analyst already being aware of such dates the stock market would never care to turn then. In fact, the pi-cycles exist... in the other words they have always existed, but the secret is that the harmonics change. It will not have to be the same thing for good. As time goes forward the things change... meaning more and more traders and investors get informed, therefore the harmonics become more complex.
But August is the month you need to watch closely...
Now the current move-down on the S&P is actually a correction to the sharp decline from June 19th to June 24th 2013. Meaning more short-lived rallies or sideways chops are in the cards. As soon as the prices resume rallying back up you folks need to realize that the market will not go to the moon. I suppose the next up-move will be relatively smaller or probably a failure, then it is going to be a time when a major top is put in. All you might want to do keep an eye out for set-up bars on weekly charts around August 16th And the full moon on August 20th.
Few days ago, I was talking with Red on Skype... talking about a potential short-term decline around August 7th and the market went down on 6th. Anyway, the top of the current long-term rally is going to be the beginning of a 3-year depression. And you folks would want to jump in as soon as you see the set-up bar.
From the looks of things I think we are going to create a nice "head and shoulders" pattern in the coming few weeks... of which the May 22nd high of 1687 is going to be the left shoulder while the coming new high will be the head. This new high I'm expecting should be around 1705-1710 spx and could hit this coming week. We have option expiration on Friday and usually by Wednesday most traders have exited their positions which means that not much happens on Thursday and Friday. Will it be the same this go around? I don't know? But I will say that any weakness we have early in the week will likely be bought up later in the week.
Since the move up last week from Bernanke saving the world was probably some smaller scale wave 3 it would stand to reason (not that "reason" ever works with the gangsters) that we could see a small pullback Monday or Tuesday for a possible wave 4... which then leaves only the wave 5 up to complete this larger move from the 1560 low. My target is around 1705-1710 and if I had to pick a day for it to hit I'd go with this Thursday because it's another "eleven" day. Do remember that this code can change anytime as the more people notice it the more likely they will be forced to change it. After all, if everyone knew the date of the high the gangsters couldn't steal your money. They need you to take other side of the trade that they are on, and if the sheep go short with the wolves it won't work.
Therefore they have to make this market look like it's going to 1800 or more so you'll be long when they are trying to get short. We should look for all kinds of bullish propaganda on the main stream media as you all know those people are paid to mislead you. The more they talk up the economy the more sheep they suck into the long side. Naturally they will be getting short while you are long, and of course they can (and will) do everything possible to make you believe that "this time is different" and the world economy is saved. Bullshit, but it is what it is...
Put simply I'm looking for that new high this week after a small pullback (or sideways movement) early in the week. If we don't see it Thursday then I'd look to the following Monday but a new high is surely coming... and very soon! Once the target is hit I'm expecting a drop of 50-80 points for the first wave 1 down, and then a strong wave 2 up that should end in the first week of August. I'd have to guess that August the 8th would be the high but that's simply based on numerology, as that's another "eleven" day. It works out nicely for the time needed to make the wave 1 down and the wave 2 up but the date is just a guess and nothing more.
So assuming we do top for the wave 2 up into the first week of August I'd expect the move up to come up shy of the 1687 high, (which is the left shoulder in the making), as if this is to make a right shoulder I believe it will be lower then the left shoulder and certainly lower then the head that should hit this week. This is forward looking and hasn't happened yet of course but if I were to think like a gangster I'd certainly make that wave 2 up a strong one. You want as many bears out of the market as possible before the start the nasty wave 3 (or C wave?) down to the target low area of 1440 spx. This area is based on the opening level for 2013 on January 2nd as I believe strongly that it will be revisited.
That day had the spx at 1420-1460... a strong 40 point rally to start the new year off. So I picked the middle of that range but obviously it could only go to 1460 or lower to 1420, which means we will have to be flexible in exiting our shorts when this happens. We also have further conformation that this area is the coming crash low as someone (thanks Rose for the update) on another site seen a FP on the SPY of 147... which is about 1465-1470 spx. We know from past history that FP's are commonly pierced by momentum before they reverse so it's entirely possible that we go deeper into the 1420-1460 zone before bottoming.
This move down should be ugly for the bulls and look like 2008 if it falls like I expect it to0!
Consider the possible high of the right shoulder around 1680 spx (again, just guessing here), which comes in the first week of August. Now look at the 2008 weekly chart and you'll see it only took 3 weeks to fall from 1255 spx (the week of 9/22) to 839 spx (the week of 10/6), so it's entirely possible that this move down could be completed by the end of August. However, unlike 2008 (which looks like a 5 wave pattern to me) I believe this whole move down from the coming new high will be a 3 wave pattern, or an ABC move. The key will be to figure out the top of the right shoulder in the first week of August... which will likely end up being a B wave up and not a wave 2 up.
Look at the January to August "head and shoulders" pattern that formed in 2011 as that's what I'm expecting again. In that case they put in the top of the left shoulder at 1344 the week of 2/14, then the head at 1370 the week of 5/2... followed by a slightly higher high (then the left shoulder) the week of 7/5 at 1356 spx. If this pattern happens again then the high we see for the coming right shoulder (in the projected first week of August, 2013) could be higher then the 1687 left shoulder high on May 22nd (which would certainly trick the bears again). Again, trying to figure out the top of this right shoulder that I think will hit in early August is tough as we don't yet know the top of the head... but it should be coming soon.
Until then let's just not take any short positions for more then a day trade as I suspect they will make the first wave down and the wave back up (into early August) filled with tricky moves. As far as the first wave down is concerned I'm guessing that it will backtest the falling trendline that connects the May 22nd high of 1687 to the June 18th high of 1653... which is around 1625 currently, but obviously it will continue to fall lower as each day passes. If it drops to 1600 by the last week of July then it will make a right shoulder on an "inverted head and shoulders" pattern with the 1560 low being the head and the 1598 low on 6/6 making the left shoulder.
This should be a nice tricky pattern to fool the sheep who see it and assume that the rally up from the right shoulder low will take out the coming high of 1705-1710... but we all know that's likely a distraction by the gangsters to lure in the longs before they tank it hard starting early August. The market is full of misdirection as in order for the gangsters to steal your money they have to have you on the other side of their trade. So I'm fully expecting this "inverted head and shoulders" pattern to make all the bears scared to get short and the bulls licking their chops anticipating another breakout move to the upside.
Ok, that's all for now... just focus on the first week of August (if you are a bear?) as the whole month is setting up to be a "Bear Feast"!
One More Big Move Down Before A Short Term Bottom...
Last week was one hell of a ride for the bears that got short by 2:30 pm Wednesday as Bernanke said nothing about giving the bulls more crack when the FOMC minutes were released. In fact he spoke more about taking some of their crack back from them, which needless to say... didn't make them very happy! I personally missed the whole move down as I was too busy with some other projects I'm currently working on right now. But hopefully some of you were short and benefited from Bernanke's gift to the bears. It was one of those moves that if you didn't get short ahead of time you would have missed the whole thing as they didn't give the bears any decent bounces to get short at.
It's funny how worthless elliottwave is when a big move like this happens. The whole move down looked like one large wave 3 instead of a 5 wave pattern. You can go back now and see some very small bounces in it and count out the entire wave pattern but when it was happening you would have likely missed them. So now it appears that we have bottomed for the short term and will likely be given one shot to get a short position from the expected early morning bounce this Monday.
So those of us that missed the first big move will get one more chance for the next big move down... which I think will happen all on Monday! If the first move from the 1654 high to the 1577 low wave a large wave A then Friday and Monday mornings bounce should be the larger B wave up. This should end by midday Monday and start rolling over in the afternoon session, which should scare every last bull to death when it takes out the 1577 low on the accelerated larger wave C down, which I believe will go hit 1536 pretty quickly. In fact with the momentum it's likely to gather I think it will take that prior low out and head toward the 200 day moving average around 1506 SPX.
Now I don't think it will get that low but I'm expecting a pierce of 10-20 points below the 1536 prior low just like the 1577 recent low went 21 points lower then the 1598 low back on June 6th, which was a day just like this coming Monday is going to be. What I mean is that June 6th, 2013 was Satan's 666 day and so will be Monday June 24th, 2013. How? Because June is the 6th month and 2013 equals a 6 for the year, which is 2 six's just right there. Then the 6th day of the month is an obvious six and then the 24th is too as 2+4=6. So this Monday is a 666 day and I fully expect them to use it to produce this massive larger wave C down, which will look like a mini-crash if we first rally to above 1600 somewhere first and then tank to above that 200 day moving average and below that 1536 prior low.
If there is ever a perfect day for them to do a mini-crash it would be Monday June 24th, 2013...
Will it happen like that? Hard too say obviously but the charts would certain support an ABC pattern playing out here. The question is simply how high will the larger wave B go up to and how long will it take for the larger wave C down take before it ends? The larger A wave down from the 1654 high to the 1577 low really happened in only 2 days and the larger B wave up started on Friday and could easily end sometime on Monday... making it only 2 days in duration. So can a larger C wave down happen in just one day? It certainly could I believe but naturally I can't guarantee you that we are going to have this mini-crash all on Monday and then end the larger C wave down. I'm only pointing out the possibility for this to happen all in one day is real.
Just be that this is not me calling for a crash on Monday but presenting some interesting facts that say it "could" happen. I'll simply be looking for that larger B wave up to end at some point in the first half of the day on Monday to get short at. If the market then rolls over for the start of the larger C wave down then it could take 2 days, 3 days or longer to end since the A wave and B wave took 2 days. But considering that any C wave is generally a "capitulation" wave where traders panic while getting hit with margin calls the possibility is real that it could all happen in just one day... and the best day would be Monday due to it's Satanic nature. We all know the people that control the market love their rituals and this is a perfect time to make a mini-crash happen in my opinion.
Regardless if this happens all in one day or not we should all just be focusing on finding the top of this larger B wave up so we can short it in front of the larger C wave down that will follow. If it takes 1 day or 1 week to end the C wave it shouldn't really matter as the goal is to just be on board for the ride. Looking at the charts we all see that big gap at 1628.93 to 1622.54 SPX that stands out like an obvious target. While it's common to fill gaps it's not common to expect it to happen this soon. Maybe they only go to gap window at 1622.54 and don't make gap fill at 1628.93 until weeks from now after we first bottom below 1536 and rally back up in the first few weeks in July.
Looking at the charts I can draw a trendline from the 5/30 high of 1661.90, connect it to the 6/10 high at 1647.72 and it will point toward about 1625 area (and falling of course) on Monday. This means that it could fall to the 1622 gap window level by early Monday, and should stop the bulls on the first hit. This implies that gap fill won't likely happen and the best the bulls can hope for is gap window. From a Fibonacci level we have a 50% retracement at 1616 and a 38.2% at 1606 SPX. The 1606 level seems a little bit too shallow if they want to really trick the bulls and get the largest percentage of them trapped before a nasty C crash wave down. Plus you need to get the bears out of their short positions for the C wave down to really gain momentum. Therefore I'd think the 1616-1622 area will be the best spot to get the most bulls long and the most bears out.
The only major concern here is that I could be focusing on the wrong idea... meaning that there is probably more bulls trapped long then bears to squeeze. That means the lower target of 1606 for the 38.2% Fibonacci level might be all we get? The overnight futures Sunday night and Monday morning should give us a clue I think. I'd like to see a strong gap up open to get the rally going strong so we can hit the higher target range of 1616 (the 50% Fib. level) to 1622 the gap window and trendline of resistance level. I'd love to short from that zone as opposed to only 1606 but the market will give us whatever we are allowed I guess.
We should also watch the VXX closely for clues and when it gets close to it's gap window of 20.91 we should be topping on the SPX at the same time. Maybe it even goes and fills it's gap at 20.12 and the SPX only hits gap window but we should watch it closely for clues. Then the ES also has an important trendline to watch, which comes in around 1620 (and falling of course) that would probably match up with the 1622 gap window on the SPX. This is the ideal place to short the market on Monday should it rally up that high? We may only get the 38.2% level around 1606 but I'm leaning toward the 1622 zone.
Regardless of if this happens all on Monday or not the odds of getting through the 1620 area "downward sloping resistance" line on the ES on the first hit is very low. That's about 1622 on the SPX which is around gap window and also the lower rising trendline from the broken channel the market fell out of last week. When you have 2 trendlines meeting around the same spot along with a gap window level you have triple resistance there. You also have the 50 day moving average around 1618 and the 50% Fibonacci level at 1616 to deal with too. All of those factors tell me that the zone of 1616 to 1622 is going to be very, very hard to breakthrough on the first hit.
After the market finishes this C wave down I expect 2-3 weeks of choppy up and down action into late July before topping for a final "lower high" then the 1687 top on May 22nd, 2013. From that area I'll be looking for the next crash wave down that should make August one very ugly month for the bulls and a feast for the bears. I'm expecting the 1420-1440 area to be the downside target for that huge sell off. Then we should rally the rest of the year if all goes as planned.
I know it has been long time since I last posted on the blog since nothing much And serious had happened. I recommended everyone not go short until late May Or early June. Red and I both agreed on a possible top on May 22nd-23rd. Now I am now going to explain whether it will be a major reversal or not.
In my previous posts I talked about the “law of vibration” and cycles and if you believe we humans are not exempt from the “natural law” you will absolutely believe that there is no randomness and imbalance in the behavior and emotions of the mass. Every living thing in the universe vibrates, thus moving in a cyclic motion. As a matter of fact cycles are progressional series where everything in nature combines in certain ratios (not only fibonacci numbers and golden ratios) to form a progressional series.
Actually, the ancients were truly aware of that as well. You see, the Mayans conceived of time and human history as moving in cycles small and large (It actually reflects the wheels within wheels). In the modern world there is only a single calendar to keep track of our annual solar circuit, while in ancient times the Mayans used variety of calendars. One of the most significant calendars is called the “Long Count”... and was so peculiar as it had no start date! The Mayan based their Long Count on what they referred to as “Birth of Venus”. It was based on 104 -year “Venus-Round Cycle” ( two calendars of 52 years), which was really an important ceremonial event for them. It was referred to as the point in time when all of their sacred calendars were realigned with the Cycle of Venus.
Now before I go on to explain more about the Mayan sacred calendars and such I would Like to touch on the brilliant work of Nikola Tesla who is the greatest genius of 20th century... not Einstein but Tesla! He studied Electromagnetic's and Electrophysics. Using Egyptian secrets and numerology he created free energy ( it was suppressed by the Illuminati), and also invented a flying saucer which could fly around based on its own energy. Actually many of his ground-breaking inventions were never released to the public and later he was called a “mad scientist”.
Anyway, historically he is known to have repeatedly said: If only the world knew the magnificence 3,6 and 9. He was truly obsessed with the groups of 3s, 6s being second and 9s being third. Only a few people can understand that he was actually referring to the “secrets of Egyptians” and I have somehow learned and found out that Tesla’s 3s, 6s and 9s nearly include everything in the nature. He also said that... and I quote: “Electricity came to me in a vision whilst I was looking at the sun. I saw four winding's wrapped around spaced at 90 degrees to each other”.
Now applying Tesla’s approach we have four quadrants in a circle which is representative of a cycle, unity or completeness, all spaced at 90 degrees to each other. And at each 90 degree, we have the number 13 or 4*13=52 (the number thirteen was a root number for the Mayans). If I link it all to the cycles of Stock market we will find out that it has been responsible for many of the biggest panics and bottoms since 1915... such as 1962, 1974, 1987, 2000 and 2013.
If you examine the cycles in charts you will discover that the length of the cycle varies a little, which is due to some natural phenomenon. The one in 2013 peaked in late May and we are about to see the consequences of it soon. But you should not expect a very large decline at first. First, the current uptrend is going to become weaker and weaker... then in late July or early August we must crash! Therefore in August and September you should totally be short.
Now if you we use 13 as the root of the Mayan calendar system we find the following number sequence: 13, 26, 39, 52, 65, 78, 91, 104 . If you notice, this number sequence is an octave consisting of eight tones and seven intervals. The truth of the matter is that we have seven “overtones” which have arisen from the “fundamental tone”. With that said, each number in the sequence can also be an octave. I have already explained that if you consider a circle as a unity of 52-year round cycle each of it's 90 degree-quadrants now belongs to the 13-year cycle. The 2/3rd's of the cycle which is perfectly “the major sixth” (in diatonic scale) is located at 60 degrees... 13*2/3 (0.667)=8.6 years.
Every cycle has their own building blocks and the 8.6-year cycle is one of the building blocks of the 13-year cycle in the stock market, (as rediscovered by Martin H. Armstrong). He is someone who could read the cycles better than Illuminati He made money when they lost money in the market, and soon they were mad at him and had him put in prison for seven years for manipulating the financial markets. He uses the pi (3.14) cycles.
To his amazement he discovered that there are 3141 days within the 8.6-year cycle. Google his economic confidence model, but you will find out that the amount of information on his work is really limited. If you break the 8.6-year cycle into smaller cycles you will then have four 2.15-year cycles. You might want to examine these cycles back in time... particularly from the year 2000 on. Again, the length of the cycles varies a little.
To sum up... due to Venus 13-year cycle the market is going to be weaker and weaker until the energy of the current uptrend is completely drained. Then we will see a series of panic declines. So the period between now and early August should raise caution.
Please feel free to get in touch with me with your comments.
May you profit handsomely, Ali
afiroozi (at) rocketmail (dot) com
P.S. Finanial markets grow both in time and price, and I have only talked about the timing aspect of the market in the article.
Last week I was expecting some type of wave up (a wave 5) to break the triangle but the market was too weak and it never happen. Hopefully most of you were already short and held through the rally's up and down. I would have loved to have seen that wave up to get short again at but missed it. Such is life I guess? So now we have a falling channel going on and from the looks of things I'm going to speculate that the next big move down day will be this coming Thursday, June 6th. Looking at the charts I see prior support in the current 1630 spx area from back on the 8th, 9th, 10th, and 13th of May. And since we are quite oversold on the short term I'm thinking that we'll dip down lower Monday morning and then chop back up a little throughout the rest of the day... basically going nowhere.
In fact, Monday should close down slightly or up slightly but nothing big either way. Then Tuesday and Wednesday I'm expecting more of the same to happen, but by the close on Wednesday I think we'll hit the top trendline on the falling channel. It should be around 1640 spx area by then I believe and by the time it hits it I think the short term charts will become overbought again and allow for another big down day to happen on Thursday with the target being the break of 1600 to fill the gap at 1597 spx. So an intraday low as deep as 1580 is possible (don't expect it though) but they should recapture the 1600 level by the end of the day I suspect.
Then we should bounce back up nicely on Friday I think and probably into Monday the 10th, with Tuesday the 11th likely ending the bounce. Remember, I think we are going down to retest that 1536 prior low and I think we'll hit it by Friday the 14th at the latest. The old rule of thumb is that "they" (the market makers... aka gangsters) usually put in the low the Thursday or Friday the week prior to the monthly option expiration, which is June 21st... meaning either Thursday the 13th or Friday the 14th should be the low for this whole move down from the May 22nd high. I can count the wave better now and I think this is what we have coming...
The Largest Wave ONE down should be from 1687 spx to around 1536 spx. Inside that wave are 5 medium waves with the wave 1 down being from 1687 to 1636, and then back up to 1674 for the ABC medium wave 2 up. When that ended we started the smaller wave 1 down inside the medium wave 3 down. I suspect this medium wave 3 down is going from 1674 to just under 1600 to fill the gap. It has 5 smaller waves inside it and the first wave 1 down was from 1674 to 1640, and then a smaller wave 2 up to 1661 spx. So what we seen Friday was a smaller wave 3 down inside the medium wave 3 down. There is still more room to go down yet on that smaller wave 3, and looking at the chart it could go as low as 1620 on Monday.
Then we should have a smaller wave 4 up (inside the medium wave 3 down) on Tuesday and Wednesday which I think will hit the top trendline of the channel in the 1640-1650 area. Hard to say right now as the trendline will go lower every day, but 1640-1650 is the estimated zone that the smaller wave 4 up should hit that trendline and stop. This leaves the smaller wave 5 down inside the medium wave 3 down still left to go, and that's the wave I think will hit the 1600 area and end at. Then we should start the medium wave 4 up into Friday the 7th and Monday the 10th. It's likely going to be an ABC wave up so it could rally on Friday for the A wave up and down on Monday for the B wave down, with a final C wave up to happen on Tuesday the 11th... which would end the medium wave 4 up.
Next would be the medium wave 5 down that should last the rest of the week and take us to the 1536 area by Friday the 14th to put in the low for the larger wave 1 down from the May 22nd high at 1687 spx. After that we'll probably have a lot of chop the rest of June and into July for the larger wave 2 up. This means that late July and early August we could be seeing a larger wave 3 down start like Ali is talking about in his update post above. Catching the smaller wave 3 down, inside the medium wave 3 down, inside the larger wave 3 down will be a bears dream! I'll do my best to try to figure it out but do keep in mind that I get the counts wrong sometimes (like last week with that wave 5 up not happening), so always use your own judgement.
Ok, that's about all I can think of now so I'll see you all on the blog in the comment section...
Red
P.S. Here's a nice read from another blog that covers some of Martin Armstrong's predictions...
Martin Armstrong is undoubtedly one of the greatest cycle theorists of our day. His predictions include the 1989 peak in the Nikkei market to the day, as well as the 1987 crash and 2007 top in the U.S. markets. Armstrong's most famous cycle is 8.6 years, or pi*1000 days (3141 days). In Armstrong's article The Business Cycle and the Future (1999), he states:
I began with the very basic naive approach of simply adding up all the financial panics between 1683 and 1907 and dividing 224 years by the number of panics being 26 yielding 8.6 years. Well, this didn’t seem to be very valid at first, but it did allow for a greater amount of data to be tested compared to merely 3 waves described by Kondratieff.
...The issue of intensity seemed to revolve around periods of 51.6 years, which was in reality a group of 6 individual business cycles of 8.6 years in length.
...The total number of days within an 8.6-year business cycle was 3141. In reality, the 8.6-year cycle was equal to p (Pi) * 1000
In Armstrong's article, he further subdivides the 8.6 year cycle into four 2.15 year intervals, and lists several dates going into the future. Let's find out what is going on with the planets on these dates.
The Economic Confidence Model in 2.15-year intervals
To me this update tells me that a stock market crash is coming this year and next year just like the 1929 crash happened first and then in 1932 (when it bottomed) President Roosevelt devalued the dollar overnight by telling everyone to turn in their $20 dollar gold coins, followed by a revaluation of $35 dollars for the same gold coin after the bank holiday ended. This means they are going to crash the stock market first and probably bottom in the 400-600 SPX area within the next 2 years and then they will close the banks for a week or so to revalue the dollar with a 40% haircut. Then once they reopen the banks every dollar will worth that much less, which also means that gold will soar by just as much on a percentage basis.
This means that YOU and I have only the next 24 months or so to make as much money as possible from this coming stock market crash. Then we are going to see massive inflation from this dollar devaluation and we'll also see a HUGE Bull market start that will take the Dow up to crazy highs like 30,000 or more! On the short term I see gold continuing down to "possibly" hit the FP of 939 (or the 935 FP) for a bottom followed by a rally to over $3,000 per ounce by the end of 2014.
(Side Note: Lindsey Williams stated the the cure for colon cancer is carnivora, and it's can be bought here 866-836-8735. I found this site on the internet selling it... http://www.carnivora.com)
Going back to a much shorting term I still see a very important high coming this May 22nd as the preferred date with possibly May 29th being the high. After that I'm expecting a 200 point drop in the SPX to start the first shock in the stock market. This will only be a small crack compared to what I see for 2014 as after a final high in February I see about a 1,000 point drop in the SPX by the end of that year! You will have the opportunity of a lifetime to make a huge chunk of money on this coming drop late this May and early June and then turn that into a million dollars or more in 2014 when the real crash happens!
There are many, many pieces to the puzzle coming together now and I'm more certain then ever that we are going drop hard starting this late May and into early June.
A new article out about the latest Bilderberg meeting shows us some interesting timing and dates. While those meetings are being exposed heavily now by people like Alex Jones and the now deceased insider reporter Jim Tucker the Legatus meetings aren't yet known to most of the "red pill taker" crowd. Only Reinhardt and myself are really talking about the connection they have to the stock market and with the next meeting set for this May 23rd-25th, 2013... followed by a Bilderberg meeting June 6th-9th (re-updating a prior date of June 9-11), one has to wonder what these Satanist Reptilian's have planned for us sheep? Here is that report...
American Free Press received e-mail from Grove Hotel staffer, apparently confirming that Bilderberg 2013 will be going down near Watford in the United Kingdom from June 6-9.
AFP’s Mark Anderson reports that he received an e-mail from a Grove Hotel employee, apparently confirming a UK-based Bilderberg meeting this coming June. Anderson writes:
“An email reply to AFP from a Grove staffer and a check of the hotel website’s calendar confirmed the hotel is booked solid June 5-9. The Bilderberg meeting itself, by all the latest indications, is to take place June 6-9. This updates a recent AFP report that stated England was likely the general meeting location but that the meeting would be held June 9-11. At the time, the hotel where the meeting was to be held was not yet known.”
Indeed. In recent weeks there have been several indications pointing to a probable UK Bilderberg meeting. As I recently reported, a call handler at the Hertfordshire constabulary confirmed that the Grove Hotel, both the surroundings and the Hotel itself will be cordoned off by the local Hertfordshire constabulary in a “security exercise”. The exercise, by the way, is planned exactly at the time that the Hotel, according to its employees, will accommodate a “high profile” international group- booking all 220 rooms. As Anderson notes in his article:
“The hotel’s location, some 18 miles outside of London, provides easy access to and from Heathrow Airport. Its rural setting is well suited for Bilderberg’s usual ring of armed security to keep pesky reporters and activists at bay.”
Thanks to many citizen-journalists probing the Hotel and local Hertfordshire constabulary it is also becoming obvious that an elite club will indeed descend on the area at the beginning of June. According to a recent vigilant posting on the Planet X website, an employee of the Grove Hotel has revealed that the hotel’s golf course is booked out by an “American Group” from June 6-9. The commenter, pretending to be interested to reserve the golf court, no booking is possible on those dates:
“No that is not possible during those dates because the private American Group Organizers have requested that they have full exclusive use themselves”.
The “American group”- comment is interesting in more than one respect. Not only does this slip-up by a Grove employee confirm the grounds (Hotel, all its facilities and the surrounding lands) are off-limit to the general public (meaning anyone not holding key power positions), it also suggests that the organizers are predominantly American. When we take a look at Bilderberg’s current steering committee we find no less than 11 Americans among the 34 members (including David Rockefeller). Because the event itself is “international” in nature, concerning “high profile” individuals – we now have further indications the UK will host this year’s Bilderberg conference. Adding this little information-droplet to the others, spilled by employees of the Grove Hotel and the local constabulary, the Hertfordshire venue is increasingly likely to be the spot where the annual Bilderberg conference is set to take place.
What I find interesting is this old clock from the Simpson's episode showing various combinations that could be pointing to a date of some nuclear explosion. We could have 11-6 (November 6th) or 6-11 (June 11th). Other interpretation have been done of course and no one has yet to figure out what (or if?) this really is a signal from the gangsters of what's coming in the future. I just find it interesting that the original date for the Bilderberg meeting was June 9-11... which looks like 911 to me. Now it's set for June 6-9, which is just before a possible reading of June 11th from the Simpson clock. That, along with a Legatus meeting just prior between May 23rd to 25th, has got to mean something.
I'm not saying that anything will happen (like a false flag nuke going off in some part of the world) but it's certainly worth noting and keeping in the back of your mind. All move the stock market are planned by these Satanist months and years in advance so trying to forecast it isn't that easy to do. But they give us sheep signals to help us (not really, more like "because it's some sick code of ethics they must obey"), and it's up to us to figure them out.
I'm kinda jumping around here as I'm writing this post on Sunday with multiple breaks throughout the day... meaning when I come back to write more I my decide to talk about a different subject. Right now I want to talk about next week and what I'm expecting to happen. I'm thinking that we had some kind of wave 3 up happen last Friday and into the close we started a wave 4 down. I'm not sure if it ended by the close Friday or if it will take all day Monday to complete, but once it ends I'm expecting one more move up to the 1630-1650 SPX area to end this very long rally and allow the first wave 1 down to start. So if we hit this zone by Tuesday then I'll be looking to go short. If it drags out a little longer then I'll just wait as I know it's very nearly done.
Then the first move down should find support around 1600 as that was prior resistance. It should end the first wave 1 down if it stops there and allow for a choppy move back up into May 22nd for the wave 2 up to complete. Then the wave 3 down should start and drop 150-200 SPX point in a period of about 18-20 calendar days (based on prior history of similar moves). If the wave 1 down breaks 1600 and goes to the next level of support around 1550-1570 SPX then the move back up for the wave 2 should be pushed out to the secondary date of May 29th before it ends and allows the wave 3 down to start. This is really a tough call here as I don't know when we are going to hit the top zone of 1630-1650, or how low the first wave 1 down will go.
Each move should take a certain amount of time based on similar moves in the past but telling you the exact date right now is hard too do. I'm estimating that we'll hit the top zone sometime this week and then start the first wave 1 down. That wave could last as little as 3-4 days if it's only 40-50 points down or 5-7 (trading) days if it's 80-100 points. From there we can calculate the move up to last 4-7 days as well, which should tell us if the high is going to be early on May 22nd or later on May 29th. We know from past history that many of the turns are centered around Legatus meetings and this coming meeting is dead set in the middle of those two "double ritual eleven" days happening on May 23rd to 25th.
Looking back at last year we see that they had a Legatus meeting on April 30th to May 2nd and the "eleven" date back then was May the 1st (05/01/2012 equals 0+5+0+1+2+0+1+2=11). This year we have an "eleven" date just before and after the meeting and both dates this time are "double elevens". You see, when you add up all the digits you get what I call a "yearly" eleven date. But there's also what I call a "daily" eleven date where just the day of the month equals eleven. So every month has 3 of those dates as you obviously have the 11th, but you also have the 22nd as it's a master number (just like 11) because it's a multiple of 11... meaning that all 11's, 22's, 33's, 44's, 55's, etc... are all master numbers and not to be added together like all other numbers are. That means that 11 isn't 1+1 to equal 2, but simply remains as "eleven". The same thing for 22, as it's not 2+2 to equal 4 but remains as twenty-two.
The only other day of every month that equals "eleven" is the 29th as 2+9=11. So every month has the 11th, 22nd, and 29th as "daily" elevens, and then there are the "yearly" eleven days where all the digits add up to eleven. So this coming May the 11th is of course a "daily" eleven but it's also a "yearly" eleven, whereas all the digits add up to 22, which is a master number and equal to 11 (0+5+[11]+2+0+1+3=22). The same thing is true for the 22nd as it adds up to 33 and then the 29th adds up to 22. All 3 dates are both "yearly" and "daily" elevens... or double elevens.
Since many (not all... maybe 30%?) of the important tops occur on ritual eleven dates it's very important to monitor them and look for a high on them. This means that either the 22nd or the 29th should be the high for the wave 2 back up as the wave 3 down is a very important date and will likely be on a ritual eleven day. Nothing is written in stone of course but I'd pay close attention to those 2 dates. Between now and then it could be choppy as they make a wave 1 down and wave 2 up. My plan is to take a small short when we hit the 1630-1650 area to ride down that wave 1 to where ever they take it to. Maybe 50 points or maybe 80 points? I don't know which but both are worth shorting I believe.
That's about it I guess as we are all just waiting patiently for the right time to attack...
Hitting the old 2007 high seems certain now, and after it's hit a several week pullback should follow...
The spoken (but of course not guaranteed) rule is that the longer the period between one prior top and it's double top in the making the stronger the resistance. Therefore the odds are much higher for a pullback before making a third attempt to pierce through that double top and make a new all time. As for how far and how long the pullback will be is usually based on how overbought the market is on the various time frames. Looking at the daily, weekly, and monthly charts one could argue for a several week pullback versus just a few days... and I personally concur with that logic as well.
I'm going to present two different scenarios here but both have the market pulling back next week. Each scenario is just the longer term wave count but in reality the only difference in the price level of the market and not the expected periods of the highs and lows. Since I'm not an Elliottwave expert I'm going to study the charts of someone that is, and input possible future wave counts with likely date periods for the highs and lows. One of the counts puts a new all time high next year and the other puts it this year. But both counts still give us the important turning periods.
Scenario One...
First, lets go over what I said in the last post. I proposed that we would top in the first week of April and then sell off for several weeks toward the end of the month. I was thinking that wave down was going to be a wave 1 down with the move back up starting in late April and likely ending in late May (with the 22nd being my target date) being called wave 2 up. Then a wave 3 would follow which would be one very nasty panic wave of selling. This was also based on the high being hit in the first week of April to be nicely above the prior all time high of 1576.09 SPX in 2007. My thoughts were that we'd do some type of ritual number like 1666, just like they bottomed at 666 in March of 2009... and had an intraday low of 333.33 on the day that the high was put in for the year of 1987 before the crash that followed later that year (that date was 08/25/1987).
While hitting 1666 would probably be very obvious to any "red pill taker" today (and even some "blue pill takers" would figure it out too) the odds of that happening on Monday, (the ritual "eleven" date) seem very slim with the SPX closing at 1569.19 on Friday. This leaves the next ritual "eleven" date of April the 10th for that possible high happening. But I just don't think that's the way it's going to play out now. I've been doing more studying of what happened in the past and I now am going to give that scenario low odds and go with the second scenario that I'm going to go over now.
Scenario Two...
I was reading Tony Caldaro's blog last week (which I haven't done in a very long time) as I wanted to get his Elliottwave count on all the various waves and see if I'm missing something. Sure enough I did indeed overlook something (assuming history repeats itself?), which I didn't go looking for until I seen Tony's wave count was different then mine. Since I'm not an expert at EW theory and Tony is I decided to go back in the past to see if it was possible that his wave count could play out (and to see if it had happened in the past as well).
So what is his wave count and how is it different from mine? Of course I'll go over that in the video but let me see if I can explain it here for you as well. Tony proposes that we are in an "intermediate wave 3" up right now inside a larger "major wave 3" up... inside an even larger "primary wave 3" up. His count would suggest that we still could drop for an "intermediate wave 4" down anytime now, which I suspect will be on Monday when (and "if"?) we hit the double top zone of 1576.09 spx (hopefully pierce it by a few points), which could last 2-4 weeks toward the end of April. This then leaves the wave up into the late May Legatus meeting to be a final "intermediate wave 5" up and not a wave 2 as I previously thought.
This also means that the current coming double top zone must be broken for that to be a valid "intermediate wave 5" up. I'm thinking we'll hit 1610-1630 spx around that May 22nd ritual date now, which obviously won't be the wave 2 up like I previously thought but the final 5th wave up (intermediate) inside a larger "major wave 3" up. This would setup the first wave down from that May peak to be an "intermediate wave 1" (or wave A I guess?) inside a larger "major wave 4" down. The start of major wave 3 up was 1266.74 spx on 06/04/2012, which leaves a lot of room for big 5 wave (intermediate) panic sell off to happen.
But, here's where I disagree with Tony...
Tony states on his weekend post that he see's the top for the bull market in February or April of 2014... which of course there just happens to be a Legatus meeting then too! Coincidental? He also see's a high of 1650-1700 spx, which I see a ritual number like 1666 spx, so we agree on those two points. But I don't understand his wave count that he has laid out because it would project the market way higher then this 1650-1700 top area. Let me explain... if we follow the plan with his wave count into May and put in a high of 1610-1630 that will complete the intermediate wave 5 up and the major wave 3 up then the first of a suspected 5 wave (or 3 wave) intermediate wave series down should start. This also starts major wave 4 down, which again needs to stay above 1266.74 to be valid... but that leave major wave 5 up that needs to take out the late May high of major wave 3 (thinking 1610-1630).
So if that happens to be his 1650-1700 target just how do that end the bull market? That only would complete major wave 5 up inside primary wave 3 up. Where does primary wave 4 down and primary wave 5 up come into play? My speculation is that primary waves one, two, and three are really A, B, and C and there won't be a 4th wave down and 5th wave up, as if there were the high would be closer to 2000 spx... and I just can't see that happening. The other alternate is that the major wave count is wrong and the move down in May starts primary wave 4 down and that top completed all the major waves up. Then we could go down as deep as 1074.77 to make a primary wave 4 down and back up to 1666 for primary wave 5 up.
This lines up with Tony's call for a final high in early 2014 but ironically doesn't match is wave count? I'm not sure if I'm missing something here but I've went over this many times now and I can't make the waves match up with his target for the end of the bull market... not unless you change the label's of the current waves. But I guess the wave patterns aren't really that important as the most important thing here is to catch the turning points correctly so we can all make money from the moves.
Therefore, I still calling for an important top this week with April 1st being the most likely date...
Then a 18-20 calendar day sell off seems likely... if history repeats itself. Followed by a rally into the next Legatus meeting May 23rd-25th, 2013 with the most likely topping date being on May 22d (which is a double "eleven" date). Whether that date is accurate or not remains to be seen... and some how I wouldn't doubt that it won't be accurate just because I've been talking about it so much lately. If the gangsters read this blog (and I"m sure they do) then they will most likely change the date just so I'm wrong. So just take that date as potential date and not something written in stone. Many, but not all, important tops are on "eleven" days... which I'd guess at 30-40% of them are. That's actually pretty high considering that they could land on a one, two, three, four, five, six, seven, eight, nine, or ten day just as easily... which when adding in the 11th day you have odd's of only around 9% for each number. Therefore hitting "11" 30-40% of the time isn't normal... unless of course it's planned. 😉
Backing up a little, I mentioned that I looked back in the past to see if Tony's wave count every happened or something similar... and something sparked my eye. When the high was put in on 03/24/2000 of 1552.87 spx it was truly and "all time new high" that there wasn't anything even close to it in the past to compare it with. That was the intraday high and the closing high was 1527.57 which was revisited on 09/01/2000 when an intraday high of 1530.09 was reached but failed to hold and closed at 1520.77 spx. That was the last time the market would see that level until 2007 came along.
Seven years after that 2000 top the market hit 1555.90 spx on 07/16/2007 with it's intraday high. It couldn't hold that high, (which was just 3.23 points over the intraday prior high), and closed at 1549.52 that day. The market then dropped Tuesday and continued into Wednesday the 18th for the first wave 1 down. It put in a nice bottoming tail on Wednesday and rallied hard on Thursday the 19th to hit 1555.20 as an intraday high. That move completed the wave 2 up which was followed by the start of the wave 3 down on Friday the 20th. That move lasted for 18 calendar days until wave 3 down bottomed on Monday 08/06/2007 with and intraday low of 1427.39, or 133.51 points in total from the top.
Then you had a wave 4 up that lasted 3 days topping that Wednesday the 8th, and then a wave 5 down that lasted until an intraday low of 1370.60 was hit on Thursday August 16th, 2007. The total 5 wave move down was 185.30 points in total and 28 calendar days. What's important to see here is that a double top that happens after 7 long years did indeed produce a very nice sell off. That's why I'm also expecting a similar type of sell to start this week when we hit (and slightly breakthrough the 1576.09 double top from 10/11/2007.
This all leads me up to May 22nd for another all time high and sell off to follow...
I'm not going to go count all the waves made prior to 07/16/2007 high (from 2000) as you can study Tony's charts for that... or a dozen other EW chartists. The thing that caught my eye the most about this period was the fact that after the 2000 high was broken the market did sell off, but more importantly it recovered to make again another new "all time" high on October 11th, 2007, which was 1576.09... a 20.19 point move higher then just a few months back. This supports Tony's theory that we are in intermediate wave 3, which if tops on April the 1st and drops for 2-4 weeks to make intermediate wave 4, then intermediate wave 5 up should be around 20 points (or so) higher then this early April high. And if that high is say 1580 then 1600 or more seem reasonable for late May. My thoughts are for a little higher move (1610-1630) as rarely do patterns repeat exactly.
Besides that, if you are going to have a 1929 style crash this time around (and I believe we are) then you should certainly go a little higher then everyone expects. If you get up to 1610, 1620, or even 1630 spx in late May then I'm pretty sure every bear will go back into his cave and give up for the year... only to miss the really nasty bear feast that should follow. Remember that this major wave 4 down can be as low as 1266.74 (the start of 3 up and the end of 2 down), which is over 400 points from where we are now. That could very well end up being primary wave 4 down (which is my thoughts) if Tony's count on the market being in a major wave 3 up is wrong.
I personally thing we will complete not only the intermediate wave 5 up in late May but also the major wave 5 up. I can't figure out how the wave count really could line up but it makes more sense to be starting Primary wave 4 down in May (to end in Sept/Oct 2013) followed by Primary wave 5 up into spring of 2014. I say that because I believe the sell off to start in late May will likely be faster then many will expect, much like the 2011 summer sell off was. I really see it as being a primary wave 4 down with primary 5 up into spring of 2014 ending the whole rally from the 2009 low. Tony's the expert here on EW counts and then only thing I can't figure out is those major wave's. For this to work out as I expect both the 3rd primary wave up and the 5th major wave up must end in late May.
Brief update from Ali...
Ali hasn't any new updates per-say as nothing has changed. But he did email a few days ago with more supporting evidence that this move down in May will be a very, very nasty wave... which is why I think it will be a primary wave 4 down (which can go as low as 1074.77 to still be valid), and now just a major wave 4 down inside a primary wave 3 up.
Uranus 17-Year Cycle... you may examine the cycle in detail back to 1897. We are currently in a 17-year sideways-to-down cycle that began in the year 2000. Each sideways-to-down cycle contains a mid-cycle panic as Uranus crosses the 36° harmonic, as it did in October, 2007.
October 2007 Uranus 36° Harmonic... This resulted in the corresponding top in the markets, leading to the 2008 crash. As a matter of fact, this cycle is interwoven with Venus-Earth 13-year cycle which is going to peak in late May. I assume that the bearish market could continue into early 2017, of course with some bumps on the road, for example we are going to have a major turning point in October of 2015 which could be a bottom.
Ali Firoozi Yasar
Let's also not forget that 2013 is the year of the snake and May is the month of the snake, which 2001 was (911 happened), 1941 was (pearl harbor), and of course 1929. Good things don't happen too much during snake years I guess? Throw in the all the stuff we have covered in this post and prior posts, and I think we have some really good odds here for a bear feast to occur. So I'll be looking to short the market Monday, April the 1st (will it be April fools day for the bulls?) if they hit the prior all time high of 1576.09 (and hopefully pierce it a little).
Obviously I'm not going to pass up a chance to profit from another 133.51 point drop like what happened from 07/16/2007 to 08/06/2007... not to imply that it's going to be that exact amount again, as that's highly unlikely. But never the less, a very nice move down should be coming over the next several weeks and I think it's worth shorting. History shows it to be accurate and the gangsters were manipulating the stock market back then too, just like they are today. The part that most bears won't see will be the rally back up from the late April low. I think they will all be expecting a wave 2 up (like I was in the last post) so they can catch the wave 3 down.
Unfortunately I think they will all be sadly taken for their money once again as the market will very likely repeat something similar to 2007 where the rally back up didn't put in a lower high but instead rallied up 20 more points higher and put in a new all time high. This will squeeze every last bear out of the market for sure as very few people will be expecting such a powerful rally to start in late April, early May. In fact everyone will be chanting "sell in May and go away"... only to see a rip roaring rally the first 3 weeks of May that will blow the tires off the bear bus! Those bears will be stranded once again just when they thought they were ready to go over the mountain and down into the bull abyss!
On top of that I also expect the bulls to miss a lot of that rally too as they will have some really big scars from the early April bear attacks. Most will be hesitant to go long and will miss the rally. Can't blame them really as after a new high is reached on April 1st who would believe that there would be another higher "new high" to come in late May? I'd go so far as to say that the bull will also think the rally up is just a wave 2 and become bears at some point trying to short it at some Fibonacci level all the way up... only to get squeeze themselves and propel the rally that much more. After that 1610-1630 level is hit I think there won't be any bears let on the planet... except for me (and those of you reading this post). 🙂
We truly live in a world of manipulation and deception.
The “ Illuminated” deliberately spread misinformation on numbers and symbols all over the internet, trying to mislead as many people as possible... especially conspiracy theorists! There are actually tons of false info and material on so-called “Masonic numbers” and “Symbolism” and one has to ask, what do these numbers and symbols really mean? What is their true purpose? Are they occult or scientific? Unfortunately, there is no clear and perfect reply to these sort of questions as no one knows the right answer and is not able to offer the true explanation.
As odd and mind-boggling as it may sound the Masonic numerology and symbolism are quite scientific... absolutely no occult! You see, they are truly aware of the secrets of science and being able to understand (and massively benefit from) the “Law of Equilibrium” and the "Harmony of Opposites". The truth is... their numbers and most of their symbols directly have to do with the big cycles of nature and of the heavens. The fact that matters is that it's a “forbidden knowledge” which is translated into wealth and power then used for manipulation and control of the masses.
Which is why they never ever reveal the secrets of the order and anyone studying and researching so is heavily suppressed. James Clerk Maxwell, the great 19th century researcher and pioneer who analyzed the behavior of Electromagnetic Waves, was heavily suppressed after he claimed and proved that the internal structures of the EM waves are 3-dimensional. Afterwards he came under a lot of pressure to simplify his equations (called quaternions). Consequently, Maxwell was rewriting and greatly narrowing his own treatise. Actually the second and third edition being studied at universities are not his original theory which was called “metaphysical mumbo jumbo” by Oliver Heaviside and others.
You see, secret societies have a lot of control over and power in various Scientific Institutions deflecting certain types of research related to hyperdimensional physics, free energy and anti-gravity. Nikola Telsa, a scientist (July 10th 1856, January 7th 1943), was an inventor and mechanical and electrical engineer. It is said that he was the scientist who had really discovered the secrets of numbers, which is why he made numerous groundbreaking discoveries and inventions in physics... many of which have never been released to the public.
For instance, he claimed to have invented a way to harness free energy which was truly free electricity and later he was suppressed by Rockefeller family as he was considered a threat to world energy and the wealth of Illuminati family. Generally there is ample evidence that any scientific effort which moves towards a discovery of the significance of numbers, harmony, and sacred 3-d geometries is being actively suppressed. Mainstream scientists like Albert Einstein and Steven Hawking were not allowed to reveal the true laws of physics and such ancient knowledge has been treated as an occult non-sense. More on this in my later posts.
Now the Stock Market...
There is not much new that I would like to talk about now as I did point to certain major and minor turning points in my previous post. The minor one is due on March 4th or 5th which could be a top (or bottom?). I also want to mention that it might be delayed for a couple of days as we are currently experiencing heavily manipulation in the market right now. Regardless, it's just a possibility and please remember that it is supposed to be a little pull-back (assuming the "turn" is to the downside and not to the upside?) and then the run-up might continue into late May when the great crash and a series of panic declines are due.
Well, it is generally true when we say “everything is consciousness” but actually this is the consciousness of smart money which dominates the financial markets. The patterns in the charts are the result of the energy being vibrated harmonically and the smart money is already aware of that for sure. In fact, they know exactly when to buy and to sell. It's a buy while the dumb money sells, it's a sell while the dumb money buys. You may assume now what they are doing currently is trying to suck in as many retail traders as they can.
The smart money is buying more and more in the market trying to attract as many buyers as they can as they want this market going up higher so badly... and then at the right point and at the right time they will sell short wiping out all of the buyers as the smart money has already leaned how to read the cycles accurately. As the old saying goes, if you can’t beat them... join’em! Meaning, with the current manipulation in the market right now this "minor turn" might not produce very much selling... so it could be wiser to just stay in cash until May (if you are a bear) or use any pullback to go long into the May top (following the smart money that is currently pushing the market higher).
It's funny how many blog writers out there claim to have such high accuracy ratings when they are a major Bull at heart. Try getting the Bearish calls right and then come talk smack! People who always make calls for the bulls have Bernanke's printing press to support them while those calling bearish patterns have to fight the PPT. Seems unfair doesn't it? Well it is unfair, totally manipulated and always in favor of the bulls... so get used too it. If I were a bull I could have forecast the last 3-4 years correct with a 80%+ accuracy rating as the market has been up 80% or more of all the days since late 2009 when I started writing about it.
Calling for bullish moves is as easy as shooting apples in a barrel with a shotgun standing 2 feet away... whereas making successful (and consistent) bearish calls are rare to say the least.So with that say, any bearish calls I make can easily be manipulated to "not happen" if the "operators" don't allow them. But I'm still about ready to make a bearish call based on the technical analysis of the charts, some common patterns, and little elliottwave. What I see on the TA side is bull flag on the weekly chart, a bullish cross on the MACD's for the daily chart, as well as the first positive close on the Histogram bars (again, for the daily chart). On the 4hour, 2hour, and 60minute charts I see "lower highs" coming on the Histogram bars which usually means a higher high on the actual price level... but also indicates a final exhaustion move too.
From looking for patterns there is an obvious "inverted head and shoulders" on those same time frames. The measured move up from this pattern is generally the distance from the left shoulder high to the low of the head, which is then added to the breakout point that happened today around 1522 SPX. So from about 1531 minus 1485 is 46 points which added to 1522 equals a move to 1571 spx... assuming the inverted H&S patterns plays out like the typical text book version of it does. And since TA's support the bulls right now I would expect this pattern to play out too... especially since you have heavy manipulate biased to the bullish side as well.
On the EW side of things it does look like we are in a 5th wave up with wave 1 starting at the 1343.45 low on 11/16/2012, then starting the wave 2 down after 12/18/2012 at the 1448.00 high. That wave ended at 1398.11 on 12/31/2012, which also started the wave 3 up that ended on 02/19/2013 at 1530.94, followed by the wave 4 down to end at 1485.01 on 02/26/2013... and that brings us up to the current 5th wave that we appear to be in now. Again, I don't trade EW but it is now supported by the TA's and the inverted H&S pattern... so I have to expect it to play out this time.
So what I expect is a move up to the recent double top of 1530.94 Tuesday morning and then a backtest to the downward sloping trendline that connects that high and slopes down to around the breakout point of 1522, which should be a little lower then that tomorrow as it is sloping down. I could see 1520 being tested before turning back up and then breaking through the 1530.94 double top by Wednesday. Since the measured move is only to 1571 spx, which is just short of the all time high of 1574, this supports the theory that we'll sell off there and after bottoming we'll rally back up into late May to not only retest that level but to breakthrough it and put in a new all time high before collapsing into the first crash wave.
My call for the final top is for May 22nd, 2013...
Why that date you ask? First off it lines up with what Ali see's with his calls for "late May" as being the final high that he see's in his cycle work. Secondly, it's a double "eleven" day. You see it's obviously an "eleven" because the actual date is the 22nd, and all master numbers that are dividable by 11 are simply considered to be 11's. That means 11, 22, 33, 44, 55, etc... are all 11's. But it's also a "yearly" 11 when you add up all the digits in the date, which equal 33, and that is not only the Free Mason "33rd degree" number but it's also considered to be an 11 as it's another "master number" and all master numbers are keep whole and not broken down. This means that 05/22/2013 equals 0+5+(22)+2+0+1+3 or 33!
The next possible date is the 24th as it's a yearly eleven as well because all the digits add up to equal 22 (05/24/2013 equals 0+5+2+4+2+0+1+3=22). But my thoughts lean toward the 22nd because it's also "daily" eleven and possibly having 2 eleven's makes it more important the Illuminati satanist? Then there is this juice little "event" they are having called a "Legatus Retreat" on May 23rd-25th, 2013... which I had to dig hard to find.
Now I don't know if this is considered a meeting like all the past meetings that they usually put up on their main page but it looks like one to me? Possibly all the exposure I've done concerning the connection between them and stock market turns has forced them to "not be so public" with their meetings and only publish them in their newsletter (http://bit.ly/insider-02-26)... which is still up on their site as of the date of me writing this post (03/04/2013).
Of course we'll need further evidence once we get to this point (like a new "all time high") but so far everything is pointing to this time frame. If this doesn't show up on their home page under their "conferences" link soon then we might be on our own without their help... or this constant exposure could have made them choose to leave it off the main page and they just slipped up by putting it on their newsletter link? We won't know until we get closer to that date of course, so for now let's just focus on next week... which should allow us to see our 1571 area I believe. Possible it takes all week to get up to there and then maybe they "pop it and drop it" on Monday the 11th?
I don't know the date or the exact level that they will hit but that's my target price and the date is anyone's guess? Since I think Tuesday (tomorrow) we'll pop up and drop back for the backtest around 1520-1522 spx then that leaves Wednesday for the breakout over the 1530.94 prior high. Then it's just a race to 1571 in a wave 3 (inside this final 5th wave) which should stop around 1560-1565, then drop back for a wave 4 and then one more move up to just shy of the all time high of 1574 by Monday. Sounds like a good plan... but odd's of me calling this exactly right are slim, so just focus on looking for some short around that double top area seems like the best play too me.
Red
P.S. Keep your eyes open for FP's as I haven't seen any in quite awhile now.
P.S.S.S. New update will be out in a few days on the Penny Stock, but HUGE things are coming and those that own it will be very, very happy in the near future.
The universe and every phenomenon in it is truly based on “The Law of Equilibrium”. All opposite forces are balanced, positive and negative, male and female, electricity and Magnetism, etc... In order to reproduce, all these forces interchange to stimulate a “balanced unity”, seemingly, they appear and disappear again in countless cycles to express their eternity. All forces are dual, as a matter of fact, “duality” is a mirror. All forces in the universe are mirrors of each other. Actually for every single action there is a reaction. Energy is interchanged between “pairs of opposites” in this dual universe.
I have already stated that all forces in the universe are diatonic. Music comprises sounds and these sounds are truly the result of “vibration” which is translated into cycles. The fact that matters is that the “seed sound” of the universe vibrates itself into Do,Re,Mi,Fa,So,La,Ti.
In my previous post, I stated that an octave has a duality as we are truly surrounded by a “dualistic world”. For instance, if we take the nucleus of an atom as an octave, the proton and neutron are the duality of the nucleus and it is also true for “Electromagnetic waves” as electricity and magnetism are found as a duality. This is actually the state of the universe! The ascending octave plus the descending one represent the “law of equilibrium” in which all the opposite diatonic forces are balanced, lets take the vibration of Do-48 as an example:
Do(descending) 48*2=96
TI 48*1.875= 90
La 48*1.666=80
So 48*1.5=72
Fa 48*1.333=64
Mi 48*1.25=60
Re 48*1.125=54
Do(descending) 48
Ti 48*.9375= 45
La 48*.8333=40
S0 48*.75= 36
Fa 48*.666=32
Mi 48*.625=30
Re 48*.5625=27
Understanding the “Law of Vibration” and musical scales are important to the timing of financial markets. In fact, all the harmony ratios of the diatonic musical scale define the “growth spiral” of the financial markets. Note: The information I have provided here is so limited and by no means should you base your investment decisions merely on the information presented here as cycles are progressional series just as everything else in nature. And you are somehow wrong if you suppose that it has to do with the over-rated Fibonacci numbers And ratios. Actually, the internet is filled with tons of misinformation!
Using the diatonic musical scale and the harmony ratios, I have projected certain major turning points, including the upcoming great crash due in may or June!
Below is what my time projections look like in the Dow monthly chart, I have nearly projected every single major turning point!
And, I would like to walk you through the major turning points in the weekly chart, as you can see on the monthly chart that I have already measured both from the high of April 2010 to the high of May 2011 and from the low of July 2010 to the low of October 2011. As you know we have 52 weeks between the highs. Now it is time to do the math using the harmony ratios... so 52 * 1.5=78 weeks, (as I explained in my previous post), “the”musical fifth” is the ratio of 3/2 or the factor 1.5. it nearly defines the high of September 2012.
Now from the low of July 2010 to the low of October 2011, we have 64 weeks and as I explained in my previous post, if you multiply 64 weeks to 1.5 you will get 96 weeks which defines a major turning point in late August or September. I suppose the fall of 2013 will be really ugly. According to the "Underlying Geometry of Harmonics" sometimes the harmonics in the patterns can be kind of proportional. For instance, we have 52 weeks from the High of April 2010 to high of May 2011.
And now, it just gets really interesting as I would like to apply the “Law of Equilibrium” in my calculations
In which all the opposites are somehow balanced. You have alreay noticed that the ratio of "SO" in the descending octave is 0.75. Actually if you multiply 52 to .75 you will get 39 weeks, which will somehow define the low of June 2012. Now if you measure from both the high of March 2012 and to high of September 2012, and the low of June 2012 and to the low of November 2012, you will find that we have 24 weeks between the tops and nearly 24 weeks between the bottoms. Once again, the harmonics are proportional in the patterns.
But it gets really interesting if you multiply 24 weeks to the musical fifth, 24*1.5=36 weeks! We may expect a major a turning point (probably a top) in late May or early June. Now we should realize that these harmonics are not powerful enough to cause a really a major turning point like a major panic decline. (As you know we have been rallying since March 2009 and now it is time to consider the bigger picture ,so please pay a particular attention to the following monthly chart.)
Also. I see another truning point in late February or possibly early March. If it is due in early March, it could happen On March the 4th. The rally we are in now, is quite unhealthy due to the heavy money printing by Fed. The Stock Market is being flooded by the newly printed currency,which is why we are not in a standard cycle-pattern. We can not be in this silly run-up now but rather in a sideways chop or a decline into late February or early March. Of course, it is well-known fact that the market is often manipulated before the major turning points in order to suck in as many sheep (retail traders) as they can.
As you see, we already have 24 weeks between the low of June 2012 and the low of November 2012. Now if you count 24 weeks from the high of September 2012 you will reach a turning point in late February or early March. To the best of my knowledge it will not be a major turning point as we have bigger cycles and forces at work.
If the Stock Market were to return to its normal pattern late February or early March would put in a major bottom. Then we could get back on board on the bullish side, but now all we have to do is wait and watch! No matter what the direction is you may play it both directions. The key is to wait for a set-up bar on the weekly chart. As soon as you have the confirmation jump in!
Moving on...
As you can see we have 77 months between the low of October 2002 and the low of March 2009. And now based on the “Law of Equilibrium” if you multiply 77 to .666 (the inverse of Fa) you will get 51.282 months. What does it all mean? It actually mean we are going to crash, then collapse big time late May or early June. The down move will continue into early 2017, wiping out all of the long-term bullish investors, earning the bearish one millions of dollars in profit. But beware of the market manipulators though! (More on this by Red).
First off I'd like to say that I'm not the one who put the pieces together concerning turns in the stock market being connected to meeting dates at Legatus events. That credit goes to Reinhardt over at Enterprise Correction. He correctly called the 2008 crash months in advance and told everyone the exact date it would start. He was early by one day! I'd call that close enough in my book wouldn't you? Since then he's not posted another "100% sure" comment on his blog relating to anymore Legatus meeting that have followed that September 15th meeting.
However, I've seen him give odd's of "60/40 chance" once and even once a "70% chance"... which if I recall were "NOT" calls for another crash but simply a correction. If I remember correctly the 60/40 call was based on some event happening (or not happening) which would then either raise the odds to 100% or to "slim or none". The end result was that the much needed "reason to crash/correct" never happened and therefore not much happened with the market either. This was obviously why the calls weren't for 100% chance as the "catalyst" was still missing.
Sadly I believe the same is true for this coming Legatus meeting starting on February 7th and ending February 9th, 2013...
I was very excited a month ago when I seen that they moved the "debt ceiling" date from February 30th back to February 15th, which was looking to me like it was going to be the reason to have a much needed 10% correction. But then they went and passed some bill in Congress to extend it until May of this year. It still has to pass the Senate too, but it's looking like there's little resistance at the moment and that leaves me wondering what other catalyst could they make happen so we can see this big move down in the market? I don't see one in site right now and it's not like them to keep it a big secret and then throw it out there all at once. They usually tell us sheep everything in advance, but of course in a manor that we seem to note figure out.
The only other "reason to sell" would be some false flag event that comes out of nowhere and panics the market to force that 10% correction.
But that also doesn't seem likely to happen right now as they seem to want the market to stay up really badly right now. You can clearly see the extreme manipulation going on every day in the market now as they flood it with massive amounts of money to keep it from tanking. Then there's this other little thing that's been bugging me, which is the "need" to see a new "all-time" high before a crash will be allowed to happen. Right now they are only close to making a new high but not there yet. So while we should see some type of nice pullback from hitting a double top I can't see them allowing a big move down (like 10%, which would be 150 spx points) as that might make it too hard to climb back up into May and put in a "blow off" new high.
From a technical point of view (not that they really work to well) any double top should put up huge resistance on the first hit of it and cause a pullback before going back up and making a second attempt. So the question will be... how much of a pullback? My gut tells me that we'll be lucky to see 5%, let alone 10%! I just don't see them allowing it to drop to far if they plan to go back up and take out the current high and put in an extreme ridiculous crazy blow off top! If you are a big bear like me you want them to put in some crazy new high as it's a huge signal that a crash will follow. The higher they go, the harder they fall.
So what does that mean for this coming Legatus meeting you ask?
It means the odds go way down of a 10% correction now because of those very reasons above. I'd now only give it a 50% chance we'll see a 10% sell off after Legatus, which by the way "NEED's" to line up with a "Double Top" at the same time so you'll have both the technical reason for the sell off and the ritual "rigged" reason from the gangster insiders closing their longs during the meeting and getting short before it starts heading south. I'd give a 75% chance of a 5% correction, and 95% chance of at least a 1-2% correction from hitting the double top.
I know this is not what we bears was hoping for but you know how they change the game as we play it and start to figure it out. They haven't put up the date for the next Legatus meeting but if they do it in May where all the "octave cycles" start coming together as Ali posted above then we'll know the date for the final top before the start of the first wave one down (a huge one) and the likely wave three down in August or so. This mean we shouldn't go "all-in" on this February meeting as it could be a "dud" for us bears and only give us one small bite of a nice trout. I'm personally looking for the whole lake full of trout to eat... which is the coming crash of course!
Remember not every one of the Legatus meeting produced a turn in the market. Many did but some didn't. The one's that did also had some "event" that was blamed for it. If it rallied after the meeting then it was probably from some huge QE program injected into the market... whether it was made public or not, the results were the same. If it sold off then it was from negative event. But without any "event" the meetings weren't turning points but just continuation points from what I've noticed.
Let's look back in time at what happen in some of these prior meetings...
I'm not going to cover the 2008 crash in detail but I'll just remind you all that Lehman Brothers and the "possible banking collapse" was the reason for the crash (the public reason of course, as the untold reason was just to steal money from the sheep). So let's start with the October 10th-19th, 2009 meeting (note: I don't have records of all the meetings and have missed some of them) in which we the market was about in the middle of a long rally up from the March, 2009 low. There was a brief turn down for 2 weeks at the time of the meeting but then the rally continued for many more weeks to follow. I'd call that meeting "non-important" as it didn't result in a really nice turn.
Next we have the meeting where I first learned about the group of gangsters and the time period where I seen my first fake print (FP) on January 11th, 2010 (which showed a 97 point drop that never happened that day). That meeting date was February 4th-6th, 2010, and it produced a bottom right in the middle of it on the 5th that also matched up with my FP low target. I'd call that meeting 100% accurate as you could have went long from it as it rallied for the next 2 months or more.
They usually have 2 meetings per year so there was probably one in late 2010 that I missed and one in early 2011, but I can't find those dates so I'll have to skip them and move on to the next one... which is October 13th-23rd, 2011 which produced a nice correction from 1292 SPX to 1158 in 4 weeks. Certainly something worth playing as 134 SPX points is nothing to sneeze at! I'd give that meeting a 100% accuracy rating, as that's about a 10% correction.
Then we have the February 2nd-4th, 2012 meeting which turned out to be a dud as it was right about in the middle of another rally from the late 2011 low to the later high in May of 2012. I guess you could also look at that meeting as a "decision" point where they decided to continue the rally versus selling off? You can see it in the charts that the daily was ready to rollover but the weekly still had room to go on the upside. I don't recall what news happened during that period but I'd venture to guess that another stimulus package was put into the market.
Moving on we have the April 30th to May 2nd, 2012 meeting, which was 100% accurate as a turn. The market peaked on May 1st at 1415 spx and dropped to 1291 by May the 18th, a 124 point move! Very nice on that one I'd say. From the looks of the move I'd say it was a "wave 3" in elliottwave terms. Prior moves seem to have be a full 5 wave move but this one happened as a one complete wave 3, whereas the start of that move was on April 2nd, with the end of it on June 4th, 2012.
And after that meeting we had our most recent one on October 10th-21st, 2012 which actually saw it's peak on the 18th just a few days before the actually meeting ended. This high was 1464 SPX and continued down until it bottomed at 1343 on November 11th... which was a 121 point drop in 23 days. And from that low the market has been rallying up ever since (with a brief 7 day sell off from the fiscal cliff news).
Finally we arrive at the present date with the next Legatus meeting...
This week I believe we'll see them push the market up to a double top on all the major indexes (some have already hit), and if all goes as planned it will line up with this coming meeting on the 7th-9th... which implies that "if" the double top is hit this Thursday or Friday then that would be the best time to short the market. If it doesn't quite make it by Friday the the following Monday the 11th could be the double top high and the date to go short. But do note that I'm not give high odds of another 10% correction as I just don't see any catalyst to cause it to happen at the present time. Add to that fact that "they" want to make "not only a double top" but a new all-time high... so high that it will kill ever last bear, and you have even more reasons to be cautious on the short side.
So unless I see some new FP that shows up as about a 5% (maybe 10%) move down (from the double top of 1574) then I'm not going "all-in" short here and will likely only take a small position. I don't trust these gangsters as they are too good at tricking the bears with their heavy manipulation strategies. A 10% correction would be 157 points and a 5% correction would be half of that or about 80 points (give or take a few). That means we could hit that double top of 1574 and drop to around 1500 in the typical 3 week time frame to put in a low around the end of February just like Ali see's with his cycle work.
You can look back at many of these sell off's and you'll commonly see a pattern of about 10% in 3-4 weeks. So it's nice to see this all lining up together with past history, a Legatus meeting, technical's (massively overbought), double top, and cycle work from Ali. Also there is a full moon on February 10th as well as a very high reading of 5.5 here on the Spiral Dates chart (http://spiraldates.com/). No one thing by itself seems to work to produce a turn but combining them all together does give us greater odds of a turn happening. The question reminds... how much of a turn?
While I fully expect the gangsters manipulating this market to fool as many people as possible I just can't wrap my head around the thought that they will push straight through the double top without first pulling back some. I think they are going to need some bears to squeeze in order to get through it which can only happen if you sell off some to get the bears trapped in some shorts. So, I'll just stick to the odd's I mentioned earlier as all this evidence tells me we'll see something on the downside around this Legatus meeting period and the coming double top period.
In closing though I think you all should have figured out that the best time to go all-in short won't start until May, so I'm saving my nickel's and dime's for that time period and again... won't go in short too heavy at this double top and Legatus meeting. Past history tells me you need a "catalyst" added into the fire with all the other stuff mentioned and I just don't see one yet. The fact that they pushed the debt ceiling out until May is a sign to me and all I need now is a Legatus meeting in that month as well to confirm my analysis.
Red.
P.S. That penny stock I've been telling you about is... well, I can't say. But you'll see next week and the week after. 🙂
In my previous post, I mentioned that everything in nature is based on “The Law of Harmonics” or “Vibration”. All things are universal, actually there is nothing which is not universal. Man and mind, emotions and all creating things are universal, as we are all made of “Aether “ which is the fluid-like energy of life and the force behind the “space and time”. Time is life is energy is motion and according to the law of vibration and harmonics, every motion is cyclic and periodic, of course in a non-linear system.
As a matter of fact, there is no straight line in the universe and all directions are curved and non-proportional. All the forces in the universe are “diatonic” and the universe is a “tonal one” which is pulsating round the clock. Man is sure part of the nature and all nature is a series of orderly tonal periodicities of the “One Force” vibrating into the "Octave of Dimensions”. Every form of energy is spiraling, thus, it is progressive and evolutionary and divided into “opposites” (positive and negative), clockwise and counterclockwise, revolving around a nuclear center.
Humans consciousness, thoughts and emotions are truly based on “etheric energy”, as we are made of the same stuff. Therefore, thinking is a process, an orderly, evolutionary and periodic process which is truly constituted in form of “seven tones” and multiple octaves. When these octaves complete, a new cycle will be born and the process will go on to infinity. The fact that matters is that these octaves along with their tones constitute a cycle of evolving states of motion.
All motion is oscillatory and in form of “Electromagnetic Waves” which swing in sequence between two opposing forces, namely “gravitation and repulsion” and are respectively electric and magnetic. This progressive and evolutionary motion is a pulsating and vibratory in-breathing and out-breathing. These two opposite forces are only two forces of mind which are added together, constituting the “One Force”.
Now we may infer that mind is the universe and that's all there is to it. Indeed, all the forces in the universe are diatonic. “Musical scales” or “Harmony ratios” were first documented by Pythagoras a philosopher and mathematician in the 6th century B.C.
In my prevoius post, I mentioned that the "seed sound” of the universe vibrates itself into an octave in order to create a life from itself: Do, Re, Mi, Fa, So, La, Ti.
Do-has the value 1. (The other vibrations are simply increasing ratios of this vibration - [Ascending]).
Re- Do by 1/8, or the factor 1.125
Mi- Do by 1/4 or the factor 1.25
Fa- Do by 1/3 or the factor 1.333
So- Do by ½ or the factor 1.5
La- Do by 2/3 or the factor 1.666
Ti- Do by 7/8 or the factor 1.875
Do- which is refered to the “descending octave” and completes the octave.
Below, a descending octave (1 to 1/2) is measured by multiplying the descending Do (1) times ½ diatonic ratios.
Do- 1 (descending Do)
Ti- 0.9375 or 15/16
La- 0.8333 or 5/6
So- 0.75 or 3/4
Fa- 0.6666 or 2/3
Mi- 0.625 or 5/8
Re- 0.5625 or 9/16
Do- or 0.5 or 1/2
When it comes to the consciousness, there are actually three positive major “tonal forces” and three negative tonal forces and the last one is the combination of both positive and negative forces. Actually, this process completes an octave (Master Tone). I also touched on movement of the stock market and how to link it all to the “Law of Vibration” or Harmonics in the last post. Indeed, the financial markets can be the best example, reflecting and charting out the humans emotions (greed and fear).
The weekly gold chart below is an example of “diatonic forces” but remember that it is not always the same case with all the patterns in the charts, as most of you folks know that patterns are quite interwoven and the bigger cycles can easily overpower the smaller ones. (the info I present here is so limited as this study is very deep).
Weekly Gold chart...
As you see,if you measure from the high of September 2011 to the high of November 2011, the “fundamental tone” is 10 weeks, when you multiply it by the “musical fifth” (Ratio of 3:2) or the factor 1.5, you will get 15 weeks... the high of February 2012. Now if you multiply that by the next octave or 2, you will get 30 weeks. This is the beginning of the spiral with combination of both positive and negative energy. The process will go on until it completes the octave and the “mid-tones” describe the fractals!
Below is another example of the Dow Jones monthly chart...
As you see, we have 16 months between the low of march of 2009 and the low of July of 2010. Now lets take it as a "fundamental vibration", or 11*1.5 (musical fifth)=16.5. As I stated earlier, every movement of energy generates opposing movement of energy or "polar opposite", so now the reverse of 11*1.5=16.5 is 11 months (the move between the low of July 2010 and the high of May 2011). It's a "counterclockwise" move!
You see... 11*1.5=16.5, or the move between the high of May 2011 and the beginning of the down move in October 2012. Therefore the octave will have to complete... so you multiply the 16months by 2 (octave), and you'll get 32 months. Now count the months from the low of July 2010 and you'll reach the low in February 2013. I suppose the closest date of the bottom is 25th of February. You see, there are 15 months between the low of July 2010 and the low of October 2011. The cycle will shift into a high October 2012, and a higher high or a chop sideways move into the August of 2013.
How? You simply do the math... 15*1.5=22.5, which makes the closest date the 19th of August 2013.
To sum up, mind is indeed based on the "universal law" and energy reproduces itself transferring its expression throughout the universe from wave to wave. Therefore, all energy is expressed in waves and all waves are divided into positive and negative. We live in non-linear system, all directions are curved and this curve means spiral... a diatonic spiral with combination of opposing forces.
One of the last comments I made on the previous post was that I see another push higher starting likely on Wednesday the 9th of January and concluding by Friday the 11th... which I still think has the highest odds of happening. The bulls are clearly running out of steam up here at this overbought levels and with hardly any bears short and no more buying from bulls the high is sure close now. My best guess is that they will fall just slightly short of hitting 1500 on the spx by this Friday. The charts are way to extended on the daily chart to give much help for the bulls but it looks like they have reset the 2 hour and 60 minute charts enough to turn them back up and make another run at piercing through the 1470-1474 resistance zone.
While I don't study Elliottwave and I'm certainly not a big believer in it being accurate anymore (it used too be back 20 years ago before us sheep had access to computers to chart stuff), I do still see wave patterns in the market. With that being said I'll speculate on what I think is going to happen over the coming weeks and months. This final move up to around the 1500 area (give or take "falling short" or piercing over it by 10-20 points in some exhaustion move) should be the final high for 2013.
The first wave down should start as early as this Friday or Monday of next week. This really depends on whether or not we fall short of 1500 (which I then think we'll peak by this Friday), or by some unknown "pull another dead rabbit out of Bernanke's hat trick" we manage to go up to 1510-1520 (which pushes the high out until early next week). I give it 60/40 odds that we'll hit the 1490 zone and top versus 1510-1520 area. And with those odd's I think Friday will end the move up and allow this first wave 1 down to start... which should drop 60-70 points if it follows prior "wave 1" moves down in the past. Then we should see the wave 2 up into the week of February 11th... just after the Legatus meeting ends.
At that point I do believe we'll see our wave 3 down similar to the May 2nd, 2012 (a prior Legatus meeting date) that lasted until May 18th and dropped a nice 123 points off the SPX. That move lasted 16 calendar days and ironically Ali's "estimated" low date of February 25th is 14 calendar days from the likely starting date on the 11th... pretty close if you ask me! Now do note that Monday the 11th isn't a "yearly" eleven date where all the digit's add to up equal eleven, but the12th is! So, you have the "daily" eleven date on the 11th (obviously... duh!) and the "yearly" one the date afterwards on the 12th. One of those 2 dates is very likely to be the top of the coming wave 2 up rally and the start of the wave 3 down.
So what will they blame this future sell off on you ask?
If I had to guess I'd say the next big scare in the news will be the "Debt Ceiling" issue. Possibly they will time some future vote on this issue will be centered around the sell off? I don't have any knowledge of any future date but "something" will be blamed for this coming sell off I'm sure. I guess they could bring back the "Fiscal Cliff" crap and spin some kind of panic into that issue as we all know it's not really fixed but just the usual "kick the can" down the road move.
But for now let's just focus on this week and trying to find the right spot to get short at. It's not going to be easy picking the top as although I think it will happen around 1490 spx (by this Friday) these gangsters have a evil knack for fooling the most sheep and going up higher then anyone can really believe. But, I think we are already in that "disbelief" mode right now... especially after the insane rally up from the 1400 area low at the end of last year. For you though... make sure you continue to watch the daily comments as "if" and "when" we get close to either one of these probable highs I should be able to make a better guess on which one is like the real high.
Again, I'm going with a 60% that we'll fall just short of the 1500 target by this Friday and top out there... which leaves a 40% chance that we'll pierce through it and go 10-20 over 1500 by early next week. I wish I could figure it out exactly but that huge 2 day up move really screws up any elliottwave count I can figure out (not that I trust it anyway though), so I'll just stick with trendlines of resistance, prior average point moves, and prior time frame cycle periods (along with technical analysis too of course) to pick a point to go short at. If it happens on some final gap up exhaustion move Friday morning then I'll be looking for 1480 on the low side to 1490 on the high side for that topping tail to happen.
Red
P.S. I'll be put out the news for "The Big One" on the HOT Penny Stock in the newsletter this coming Thursday evening.
Subject Matter Rarely Spoken Of With Concerns Related To The Stock Market
Written by Ali Firoozi Yasar
I have written this article mainly on “The Law of Vibration”, Sacred Geometry and other stuff in many different fields. I have also touched on the patterns in the charts of the financial markets as they all can be linked to “consciousness”. (Please pardon my lack of specific knowledge with all the stock market instruments). This will simply be an introduction to the study of both.
NOTE:If you would like to share your ideas and feedback with me, I will be more than happy to recieve your them. You may E-mail me at: afiroozi (at) rocketmail (dot) com.
The patterns on the charts of finacial markets are all prefectly ordered by “the” Natural law of the Universe”. You might just doubt it now and think that the moves on the charts are all random and everything, but you will see that these complicated zig zag patterns repeat themeseves over and over as the time goes by. It is the same case in all the time frames. Some of you folks out there may suppose that this is the economic state that moves the charts, creating such complex zig-zag patterns but this is actually the human emotions doing so. When humans feel joy and prosperity we buy, raising the price index but when we start to feel fear and panic then we sell, lowering the price index.
The fact that matters is that this is the structure of human’s behavior graphed out on the charts, just as spyder which is not aware of the beautiful web it builds. Therefore what traders construct in time and price charts are absolutely phenomenal and they should be able to study and research the humans behavior and consciousness instead of focusing on the markets and economic state. You might sound puzzeled now and ask how? Well, you know that human beings are indisputably all part of the nature, so are their consciousness. What they create on the price-time charts is arguably "microcosm” of “macrocosm” in the universe. So their emotions and consciousness are in line with the “natural law” or the “universal order”.
It may sound a little mind-boggling but it is true.
There is overwhelming evidence out there that a “secret society of free masons” are the ones that possesses and preserves the true knowledge of this “Atlantean code system”. As a matter of fact, this is not the info you can easily find in text books in libraries. Such secrets are heavily guarded as it is a pretty complicated system of Atlantean Principles handed to them by the ancient Egyptians who were inheritors of the legacy Of Atlantis.
This Masonic scholar by the name of W.D Gann who was a stock trader and lived before the year 1955, tried to reveal the hidden structure of the markets both in price and time. Actually to him time was more important than price and he tried to link it all to “The Law of Vibration”. Most of you folks have probably heard his name and familiar with his methods. The fact that matters is that there was a lot of secrecy in his work and he always kept things mysterious due to his “Masonic oath”. Actually, he died with only $50,000 to his name but he had already made nearly $50,000,000 in his trading career. It is said that he deviated from his main analysis, trying to depend on “financial astrology” which was the cause of his failure. However, most of his courses have been modified and you may barely find his original courses out there, and on top of that there is ton of secrecy in his work.
In the Atlantean tradition, time is life is energy is motion and all motion in existence is cyclic. Well, before I directly start discussing the time, I would like to talk about energy and it's behavior. Hindus called it “Prana”. The movie stars war calls it “The Force”. The ancient Greeks call it “Aether”. It is supposed to a powerful fluid like life energy suffusing the universe and structuring the cosmos. It's signature is all around in nature. You have probably seen the shapes of whirlpools, hurricanes, the solar system, the DNA Structure and so forth.
The moving waves in this energy medium get around in spirals of different sizes, from Very small to very large. Actually, it is the energy that makes the planets revolve around the Sun and the sun around the galaxy, thus generating time, space, life and consciousness.
The vibration of this life energy forms seven major densities or levels in entire the universe.
You have probably heard the “seven heavens” by ancient traditions. These densities and levels Are formed by the amount of vibration that is accuring within the aether. It is interesting to learn that within these seven main energy levels, there are seven sub-levels and seven sub- sub levels within each sub level and this process will continue to infinity. The same basic rules of vibration Are also responsible for the seven colors in rainbow and the 7-tone octave of “diatonic scale”.
The entire universe is one and everything begins with one. You may relate it to the “sheer white light” and the sheer sound of the universe. In order for the life to be created, the light and sound vibrated themselves into “the octave”, and actually into seven colors... the same as in rainbow. And seven tones: do,re,mi,fa,sol,la,ti. Now one can infer that how the structure of time and time cycles has a lot to do with the octave.
The third key aspect I need to discuss now after light and sound is geometry which is another aspect of the behavior of the aether and the net result of vibration. You have seen the shapes of mountains, hills, mounds, crystals etc... You are probably familiar with the term “Sacred Geometry” (or not?). Well, it involves the geometric structure of the universe, life and consciousness. The dimensions of the great pyramid of Giza and other ancient monuments represent “The Universal Order” in the universe, (more on this in later articles). In fact, all consciousness including human beings, are only based on this Sacred Geometry. (You'll remember at the beginning of the article I mentioned that these are emotions and thoughts forming such complicated zig-zag patterns on the price-time charts of the financial markets).
Plato, the Greek philosopher first wrote about five most important three-dimensional geometries called “Platonic solids” which include Tetrahedron,Octahedron, Cube, Dodecahedron and Icosahedron. These geometries are formed in different densities or levels by the amount of vibration applied to the aether. So actually this is the “law of vibration” which is the basis of cyclic motion of the energy. Now you may infer that the conscoiusness is 3-dimensional, and when you add the element of time, it will be 4-dimensional.
Yes... our thoughts and emotions are 4-dimensional in nature!
Vibration can be described as a perodic or cyclic motion between two extremes or wings around a mid-point. Lets take a guitar string as an example. When you pluck it... it will generate a cyclic move betwen the two extremes around the mid ponit, causing a sound wave to be created at a specific note or frequency (please google sound wave mechanics for more info). If you view the process by an oscilloscope, you will be able to see that there is an extreme vertical movement at the top or bottom of the wave. At the mid-point of the cycle, there are parts where there is no vertical movement. Actually this is where the “Nodes” or nodal points will be created. The number of the nodes all depend on the amount of the vibration, the higher the vibration the more nodal points.
In a two-dimensional view, when these nodal points are grouped together by lines, geometric shapes such as triangle, square, pentagon, hexagon etc... will be created. These shapes are inscribed within a circle which represents a cycle. Now, in a 3-dimensional view this has three-dimensional shapes. What I mean is, the same five platonic solids I mentioned earlier, (actually, 4 nodes at the mid-points of cycles when grouped together), will form a tetrahedron, 6 nodes create an octahedron, 8 nodes form a cube, 12 nodes create an icosahedron and 20 nodes a dodecahedron.
Now you can infer that our thoughts and emotions move in line with the faces of these Platonic polyhedrons. It is amazing to learn that these structures are formed in a sphere like the two dimensional shapes are formed in a circle. Ancient traditions see the sphere as the highest geometry in the universe. The universe is finally spherical. You can tell this by the spherical energy around the Solar System and if you study the structure of an atom, you will find out that the energy surrounding the Nucleus is spherical, as a matter of fact the structure of atom is the “microcosm” of the energy structuring the cosmos and the universe.
You might just wonder why bad energy exists?
Well, good and bad, rich and poor, etc are actually harmony of the universe. Every movement of energy creates an opposing movement of energy or polar opposite. This is also true for the Platonic solids which also have a “dual” status. Therefore for every Platonic shape, there exists another Platonic shape that is the opposite, and is of course inscribed in each other. You see there are actually two forms you are dealing with. One form is “ out breathing” (outward spiraling energy forming the Platonic solids), and there is another form which is “ in breathing” (inward spiraling energy) forming the dual of the Platonic Solids.
There is a great deal of evidence out there that any research and study toward the discovery of the significance of these structures in the universe is heavily and actively suppressed. True or untrue, the fact that matters is that free masons heavily guard the “secrets of the order”. To sum up, you can infer that that the universe and everything in it is made of moving energy. We Human beings are made of the same stuff as well as their emotions. Consciousness moves in line with the faces of the Platonic solids so that it completes the octave, then creat a new life or cycle. Financial Markets was just an example of how the consciousness is in line with the”universal order”.
I hope this information has been useful and will to try to get into more detail in my later posts.
God bless you all,
Ali Firoozi Yasar
____________________________________________________________________________
Nice post by Ali gang, as I have too say that this stuff is new to me as well.
I look forward to learning more about Sacred Geometry in the future, and specially how it relates to the movement of the stock market. I'm sure Ali will give us more information as time goes forward. For next week though gang I'm expecting light volume and nothing but the usually bullish option expiration week. Generally you see traders run it up Monday through Wednesday and then take Thursday and Friday off as they will have closed out all their positions by the middle of the week. This means that the last 2 days could chop around going basically nowhere.
But, since we have triple witching this Friday (it's where you have 3 different securities all expiring at the same time) we could see some wild swings up and down as market makers manipulate the various markets up and down to steal the most money from the sheep. Don't get sucked into thinking we are going to tank hard during this period as the odds are low of that happening. And after option expiration is over with the rest of the year is usually very bullish. I might even put on my bull suit and go long right after this coming Friday.
But, I do believe we are going to peak out within the first week or so in January 2013 and have a step sell off into the next Legatus meeting (February 7th-9th, 2013) where I thing we'll bottom. Then we could have QE5 put into the market and see some huge crazy rally into late summer before we finally peak... and then CRASH! Look at January to February of 2010 as that's about what I think is going to happen. That bottom was right in the middle of a previous Legatus meeting that happened on February 4th-6th of 2010. And I seen my very first FP (fake print) on January 11th, 2010 (note that the 11th is a "daily" ritual date for these Illuminati pigs).
Now that was awhile back and I was just learning about FP's and Legatus... so I don't have a screenshot of the Legatus meeting, but rest assured it was the date period that the market bottomed. I later did this chart to show what happened afterwards, and I think we could see something similar happen next year again. While it shouldn't be exactly the same it might have similar patterns in it. Don't forget about the FP I have on the cell phone showing the 1419 high and the more important 1068 low! What if they use this fear of the Fiscal Cliff non-sense to scare the politicians and the president into coming to an agreement to save the stock market? I'm sure it's all planned of course but a move down to 1068 in one month is a "mini-crash" and should force these jackasses to agree on something.
So thinking ahead here I'm forecasting (guessing... LOL) that we will peak up above 1500 in early January and then move down hard into Legatus for a bottom. If this happens it will scare the living hell out of the bulls and make a bunch of bears go crazy shorting every bounce that follows after the meeting ends. Keep in mind that not all Legatus meetings are "turn dates" but since the thugs seem intent on dragging this Fiscal Cliff crap out as long as possible it would make sense to drop the market hard first into the meeting and then at the meeting decide on QE5, QE6, QE7, etc...
Of course in reality all these decisions were already made well before we every heard the term "Fiscal Cliff" anyway... but the meeting is just a way for the satanists to confirm that the plans are still on track as they previously decided months and possibly years ago. Plus these reptilians are probably hungry too and need to sacrifice some innocent "missing children" as they eat them for dinner. Sick yeah... but truth is sometimes harder to believe then fiction. By the way I just found some old picture that I have a screenshot of showing the date for the previous Legatus meeting in 2010 (for any "newbie's" that want more proof).
Lastly I want to add that I'm told by my connection that there are going to be 2 more penny stock promotions happen before the end of this year. January 2013 will be full of them I suspect, as the holiday's are usually slow. Each pick is "planned" (not a guarantee of course) to double, triple or maybe quadruple when they run. So if you aren't signed up for my penny stock newsletter you might want to sign up asap, as I'll probably sent out an "Alert" Monday night or Tuesday.
(sidenote: I removed the previous video as I may have said too much. You will still be emailed before a big move happens though, which should be later now and not on Tuesday)
What I'm talking about isn't shorting the S&P500 or going long it, but instead getting shares in a penny stock company that is going to start it's rise next week. Today it's probably at the lowest point it will ever be at, and from here on out I expect to see it rise in share price to levels that are going to make you feel like you bought shares of Microsoft back in the early 80's! Yes, it's that BIG!
While I stated in a previous post that I'll be giving you some penny stocks to make money on by getting shares in them before a marketing campaign starts to promote them (which should cause most of them to double your money on), the time isn't right yet for that to start. I'm still working with my source on this and plan to have some steady (and accurate) picks early next year after the holiday's are over with. So while this company I'm talking about now is currently a penny stock, (and one that I expect will double here very soon) it's not the same kind of company that I'll be giving you picks on in the near future.
This company is one that you can retire on by just buying all you can and stuffing it under your mattress for a few years. In fact I expect a huge move up on them once one of the 3 projects they start working on in April/May of 2013 produces the expected results... which should happen well before the end of that year. Once that "event" happens it will get a lot of news coverage and the share price should look something like a hockey stick move up!
But on the short term my source just told me late Sunday night (12/02/2012) that he expects a move up to start this coming Tuesday. So basically, you only have one day to get some shares in this company at this low price. That date is Monday, December the 3rd. After that we could easily see a run up to double the share price within a few days from the good news I've just been told. Now I know this isn't my usual type of post but I'm trying to help everyone out by giving them something that actually will make them a bunch of money for once, instead of the usual doom and gloom story.
You could cash out in a few days when it rockets up from the news, or hold it for a longer period for more huge gains. Of course it will have it's up's and down's over the coming years but I kid you not... this company has the ability to have a share price like Microsoft, Apple or Google over the coming years. And yes, this stock will still rise even when and if the stock market crashes in 2013. In fact, this type of company usually does better when the overall market is selling off. You might say that's it's recession proof, and soars when the rest of the market tanks.
I'm only going to give you the complete details and the name of the company (with the stock symbol of course) through email as I want to help out those loyal followers of my site first. You will have one day only to buy shares at the current level. Then Tuesday I'm expecting the news to be leaked out (can't tell you the news) which will cause a bunch of new buyers to flock in and cause the price to go up. If you miss this run up don't worry as I fully expect this company to continue rising all of next year too.
I will put out an email Monday with all the details on the stock with the symbol as well. If you are not on my email list you will miss out on an easy profit. Just join the list on the right sidebar here on my site and you will get the message.
______________________
Moving on to the stock market...
I see a few more days of up movement before this pig rolls over. As crazy as this sounds they could actually take it up to the 1435 area on the ES and the 1440 area on the SPX. I'm looking at the best case scenario here for the bulls as my gut thinks it will fall a little short and only hit around 1430 on the ES, or around 1434 on the SPX. Since Monday's are typically slow days as traders drag themselves back to work I'm thinking that it will be a small up day with Tuesday being the large up day. (could have that backwards too, but the result is the same... up).
By Wednesday I think the market will top out with a "topping tail" candle that touches that 1430-1435 range on the ES and/or SPX. Always remember that "they" are masters at tricking us sheep and will do what we least expect them to do. So, while the downward sloping trendline on the SPX is coming in around 1443-1444 and 1436 on the ES, they might not go up that high? We all know that there will of course be lots of bears waiting there to get short. You will also notice that there is a nice triple top area around 1430 on the ES and 1435 on the SPX, which is another logical place for the bears to be waiting to get short.
So, you'll have 2 levels of bears waiting to get short at. One from the triple top and the other from the slightly higher "downward sloping" trendline. Which one will they stop at? Tough question there really. With that in mind I'd come just a hair under both of those levels if I were SkyNet and not allow those bears to get filled on those shorts. I'd make them chase it down as I panicked the bulls out of their longs. This would imply a move that is kept under 1425 ES and about 1427 SPX.
Too me that levels seems to close and could easily be hit Monday morning at the open. If that is all she has then we could rollover after that and continue down all week long. Monday is another ritual "eleven" day and they do tend to put in important tops on those days (not always of course). This is going to be more about where the charts are on Monday to see if they can push it up further or not. I'd like to see one more push up to that 1435 area on the ES to tag that downward sloping trendline but I'm not sure if we are going to get it or not? It won't come on Monday of course, but could easily be hit by Wednesday morning. (well, I don't think it will be hit on Monday... but crazier things have happened?).
Looking at the Fed Schedule for money being injected into the dying bull (http://www.newyorkfed.org/markets/tot_operation_schedule.html) I see that Tuesday has a nice shot at $4.25-$5.25 Billion, which could give the market a nice solid white candle day up that should then allow a topping tail candle on Wednesday to end the move up and allow the sell off to start. Then one more nice pump on Thursday the 6th followed by nothing big again until the next Thursday the 13th. Now if you remember it's common to see a bottom in the market on the Thursday or Friday the week prior to option expiration. That Thursday the 13th and Friday the 14th are those days should be a bottom before a rally into the December 21st option expiration date.
So, my line of thinking is to short on Wednesday if there is a pop to either a triple top or the falling trendline. Then exit on Thursday morning for the fakeout rally back up from the money injection from the Fed's, followed by shorting by the close again into Friday. Then continue to short all of the following week into Thursday the 13th or Friday the 14th for the bottom of the move. Sounds like a great plan right? Of course it's never really that simple but it sure looks good on paper... LOL!
Well, I'll keep this post short this time as there is money here to be made... so I"m going to focus on just that this time around.
Good luck as always and be sure to continue reading the comments for updates.
Red
P.S. The form to get on my email list is at the bottom right...
You might be thinking "WHY" at this point, and the answer is simple really. You see Satan was gaining more attention and electoral votes then Lucifer recently (err... Romney was gaining over Obama) and Lucifer needed to distract the media (and the slaves... aka, "YOU") from listening to and believing the lies that Satan was saying. The slaves were actually believing the lies and Lucifer couldn't have that happen if he wanted to get re-elected. So Lucifer devised his own evil plan to make him look like a hero and be seen on TV all day long dimming the spot light on Satan.
The plan was to setup to happen on a ritual "Eleven" day of course (the 29th, as 2+9=11) and that's when Hurricane Obama started attacking in the East Coast. Now Lucifer is great at killing 2 birds with one stone and this time is no exception. He won this battle by successfully getting all the attention away from the election (which he was losing ground in as Satan was becoming more popular with the slaves), which means that he could actually get enough votes now to win the re-election as the slaves forget about the lies Satan said recently and go back to believing the lies from Lucifer.
The second way Lucifer won was the new ability to create jobs now the attack is over with and the freshly destroyed buildings, homes and businesses must be rebuilt. Of course just creating money out of thin air like Bernanke did on September the 13th with QE3 isn't something he can get away with as the slaves might get upset at Lucifer for digging a deeper debt hole. But, if he offers the same money for "aid" to rebuild the east coast after he attacked it with Hurricane Obama then the slaves will see it differently and accept the toilet paper needed to get them back on their feet again. It's as old a game as mother earth is... just take something away from an ungrateful slave and them give it back to them when they become grateful again.
But, the whole plan may have not worked... as so far the elections aren't delayed and Obama isn't yet guaranteed to win again (or is he?)
Even though in this obvious "New World Order Illuminati" video slip up, where they tell us in advance that Obama has already won the election with 40 million votes to Romney's 38 million, there's no guarantee that it's accurate? You see there are apparently two factions of the Illuminati Cabal fighting right now over which demon they want as the next presidential puppet. We have old world Illuminati in Europe known as the Rothschilds, the Queen, the royal trash family, and the Pope. Then we have here in America the Cabal that simply call themselves the New World Order who want a different puppet in office. They want Satan as the new president while the other cabal want Lucifer to be re-elected.
So the point is... who put out that "slip up" on that video episode of "The Peoples Court"? Was it the Cabal here in America who want Satan, or the Cabal in Europe that want Lucifer? Does it really matter? Of course not... as there is NO winner here for us slaves. Both Satan and Lucifer will continue to enslave us so voting is absolutely worthless. Back several years ago I actually thought it matter (when I was a "Blue Pill" taker that only felt that something was wrong but hadn't seen the "Red Pill", or had the opportunity to take it) I did vote at every presidential election... even though I commonly switched back and forth from one party to the other (not that it matters as both are controlled by the Illuminati Cabal, but I thought I could make a difference back then).
Now that I know what I know now I won't be wasting my time voting as the election is rigged and my vote won't matter anyway. Besides that, I'd be voting for Ron Paul who doesn't have a chance until enough slaves wake up and get rid of the 2 party system. We live in the matrix where the satanists that control it have created these "Duality" world where everything is divided by 2 sides and they control both of them. You have the obvious like the Republicans and the Democrats, but you also have North Koreans and South Koreans, Muslims and Christians, Blacks and Whites, Gay's and Straights, Wealthy and Poor, Celebrity and Fans, Smart and Dumb, Fat and Healthy, etc, etc, etc....
You see, we are the same inside... just "immortal spirits" living in different cars. Some are white, some are black... some are fancy fast cars and some are beat up old rags. But regardless of the car you live in (your human body) we are the same inside, and that's the biggest secret that these Illuminati Satanist Pigs don't want you to know. If we all wake up together and discover that "they" are the real enemies, not some poor innocent middle eastern man in Iran (that "they" want to call a terrorist) then we slaves could then unity and rage against the machine and it's controllers. There are 6-7 Billion of us slaves and very few of them... only 13 head families, and then 300 high ranking minions below them. Followed by several thousand lower ranking minions that turned from slave to guard in the prison planet we live on called Earth. In this example, the warden of the prison is one of the 300 and the governors are the 13 families (a side thought here... the country of America that ended in 1861 and is now a corporation was founded with only 13 colonies... just food for thought).
As for the prison we live in, it really started around 1933. You see, we are born into slavery with something called a birth certificate that has a pre-determined value setup based on our future slave labor over the next 60-70 years of our life. Today that value is about 1 million dollars at birth, which is then sent through the fractional reserve banking system to become 9 million by the first week of your new life in the matrix. This is done with the trust account number on your birth certificate that is also created on stock certificate paper (so it can be later traded on the stock market as a commodity).
Living in this matrix and seeing all the evil done to us slaves makes me want to do something to help out those who can't help themselves, but the reality is that I can only continue to post everything I can about these satanists and hope that it with help someone over time to wake up. The biggest thing these pigs fear is for us slaves to unity and stop fighting between ourselves. They stage all reasons for us to fight so we won't unity against them. It's the old "divide and conquer" method that the Bankster Rothschilds did in the mid-1800's to take control back of America when they staged the civil war to financially bankrupt the country and force the corporation of America to be created. The Satanists then loaned money to the new corporation to enslave the people though debt... which still keeps us as slaves today.
You see, the British Elite (not the innocent British people as they are slaves too... just like the American slaves) didn't like it when America created the constitution in 1776 (even though it was created by Free Masons that also worshiped Satan) and basically flipped the bird (the middle finger) to the Rothschilds, the Queen, the Pope, and the Royal Trash Family and said that "WE" are now free from your taxes because we are now a "Sovereign Nation". Once you become sovereign you don't have to obey any laws, codes, or statues that are created by other sovereign nations like the United Kingdom or The United States. There is only one document that all nations use as a reference to do business with each other. It's called the UCC or Universal Commercial Code, which was created for fair trade among countries but doesn't make laws per se for the purpose of you obeying. Any sovereign nation can create it's own laws, codes and statues, but "IF" it want's to trade with the other nations of the world it must agree to the UCC.
Basically, there are NO laws here in the corporation of America as corporations can't create "LAWS", they can only create Charters, Codes, and Statues. And the country of America hasn't existed since 1861, where president Lincoln was last president because congress walked out of session which dissolved the government (a Latin word called "Sine die"). Unless a new congress is created (remember, this happened in 1861 and those congressmen are long since dead... unless they are vampires, which is another story [and we wouldn't want them back in anyway]) the country doesn't have a government anymore. So, you are now born as a dual citizen... one as a citizen of "government-less" country of America and the other as a citizen of The United States of America Corporation (based in a 10 square mile radius called "The District of Columbia", located in Washington D.C.).
This corporation tricks you with this Dual Citizenship at birth as have 2 names... one is your "flesh and blood" name where you use a capital letter for the first letter in your first name, middle name and last name, with lower case letters for the rest of the letters in your name. Then you have your corporate trust name (also called your straw-man name) that is spelled with all capital letters in it. This all happened in 1933 right after the stock market bottomed from the 1929 crash (that was created by the J.P. Morgan family, Rockefeller family and many other satanist Illuminati members). They pumped the stock market to extremes before they let it collapse and of course they sold out at the top and bought gold... just like they are doing today.
About every 70 years the fiat money system peaks and collapses on itself as it reaches a point that can't be sustained. When this happens the country has an "un-declared" bankruptcy along with the stock market crash. It's always planned years in advance and will continue to happen over and over again until we no longer need money to survive. That would be the point where we have free energy and can grow our own food and the need for money is gone. It would then only be used to get other things that we just want to have but not need to live. This will be like the age of "Star Trek"... which is currently a reality, but not for the slaves. Only the elite Illuminati have the ability to travel in space ships, clone themselves for body parts, repair any damage to the human body, etc... basically live like kings.
But, I believe over the coming decades that free energy and health products that really work and re-generate the body will finally come out and the slaves will get their freedom. Between now and then though, we slaves are going to be in for some very hard times... unless we learn how to profit from this of course. I've been working on just that very item as I know that trying to predict the movement of the larger ETF's in this rigged market is very hard. In fact, it's almost impossible to predict with an 80% accuracy track record. So while I still thinking that this market is going to rally up to around the 1450 SPX level and then sell off again in a wave 3 down (to continue the Legatus sell off) I just can't big consistence enough to profit hugely from these calls as sometimes I'm completely wrong.
The most accurate calls though have been centered around the Legatus meetings... particularly when they are held in Rome.
But eventually that method will stop working as it gets too much exposure. In fact I think we'll only have one more Legatus call next year before they change it... and then we'll have NO signal's left to know when to short the market. Of course this next sell off in the summer/fall of 2013 will likely be the largest one since the Great Depression One, and make a lot of people very poor while a few get extremely wealthy, I can't count on the gangsters using it as a signal much longer. I feel that the original finder of this (Reinhardt) and myself have exposed it too much and they (the Illuminati Cabal... or "Operators") that control the stock market will change the game in the near future. You have probably noticed that we don't get that many FP's anymore in the market... which "could" (not really sure about it, but it's possible) have been because of my consistent exposure of them every time I seen one.
I'm not the first person to catch them but maybe I was the one that exposed them to the point where the gangsters had to change the way the game was played? Not to take credit away from ZeroHedge or other sites that now post these FP's but I've been posting them since January of 2010 when I seen my first one. Lot's of people now have caught on and post them all over the internet. I'm sure this game has been going on for decades so it's nothing new... but maybe (just maybe) my constant hammering down everyone's throats that the gangsters use them to signal the insiders where they plan to take the market got them noticed by too many people and forced a change in the way they rob the sheep (slaves... aka, "YOU").
I've had people tell me that the many reason they keep reading my posts and comments are for the FP's... which again, now seem to be much less frequent. The FP on Gold though is one I believe will come true... but not until around 2017. I think the gangsters don't really care to let that one out as it's so far out in the future that everyone will forget about it been foretold by the time it's actually hit. I can safely say that I'm sure I'll forget about it by then and "if" I'm still around writing this blog (remember, they have a kill switch for the internet and will likely use it before then to stop free speech) then hopefully you readers will remind me of it.
However, don't forget about the old FP of 949 on Gold which could be the panic sell off level (from margin calls) before the bull run up to 17,000 plus over the following 4 years. It makes sense to tank gold first before you run it up to extremes as you want everyone bearish on it so you can steal it from them at dirt cheap prices (thinking like a gangster here... where Robin Hood steals from the poor and gives to the rich! Kinda like the world we live in today, Huh?).
Sometimes I go off in different directions I guess, but let's get back to making money in the stock market... especially during the time period between now and the final days before it collapses in the summer/fall of 2013 (which we'll all be going short then). I've been chatting with someone about another way to make some money in this market recently, but before I mention any recommendations I want to check out their track record to see if the calls have been accurate. I don't want to post someone's predictions unless I to believe them to be pretty accurate. So, after hours on the phone and time on Skype the last week or so I see enough evidence to share this information with you all. So, I'm going to post the next move that is recommended before it happens.
What am I'm talking about you ask?
I'm talking about getting involved with penny stocks before they make their run from insiders pumping them and then dumping them. I've always known about penny stocks and even bought some back in the 1980's (worthless now) but never had any good source of information about them before they ran... now I do! And I'm going to share that with everyone that is interested in doubling, tripling, or quadrupling their money in just a few days to weeks.
While my main focus has been on the big indexes I also know that this game is so well rigged that me trying to figure it out is like David beating Godzilla (much bigger then Goliath). Understanding the next move in the SPX... "in a manor that I can make a profit from" is very hard, especially with options! So, I've decided to expand out into other ways to make money and I believe this "Penny Stock" area is worth looking into seriously. The last penny stock tip given to me went from about 20 cent to 40 cent by the close on Friday (11/02/2012), and that was only because of the insiders buying it up before they promote it and run it much higher. Now I don't think now is the time to purchase it, even though it could run up another 40-50 cents, but with my new connection it is possible to get in it (or similar future penny stocks) while down at the 20 cent range before the insiders run it up.
So, while that deal is already over with there is a new one coming in 1-2 weeks that should be just a promising. The symbol for the one that just ran from 20 cents to 40 cents is BFGC and while it should still go higher the time to buy it has past. The tips I'll be giving you from this source will be timed so you can get in at the 20 cent price before the move up starts. Again, this isn't for everyone and I'll still continue to try and guess the next move in the SPX, but I'll be adding this new opportunity into the mix.
However, giving this information out on the blog for everyone to see "could" skew the results and affect the stock price... so I'll only give it out in an email. Anyone interested can simply optin and I'll inform you as soon as I'm informed.
We are likely to chop around until the election is over with and then we "should" rally up to hit the downward sloping trendline that starts at the 1470.96 spx high on 10/05 and connects to the 10/18 high of 1464.02... and should be around 1450-1453 later this week. This should be the point where the bears make a stand and turn the bulls back down. This rally (assuming it happens?) should start after the election is over with I believe. Then "if" the bears hold the line, we'll see a nasty wave 3 down to follow.
If the line doesn't stop the bulls then we could rally up to a new high I guess. Sad how controlled and manipulated this market is, as the charts are all very bearish on the larger time frames. But the gangsters will do what they want to do, and if that means a new high then the likely date for the peak would the the 15th of this month. Obviously if we start a rally after this election is over with, it should pierce though that trendline with 7 days of trading. To go from about 1410 spx to 1450 or so should be a 2-3 day move, not 7 days. That's why I think we'll put in a new high if that trendline is broken through. Picking the date of the 15th is based on the fact that it's another "eleven" day (again, not all highs happen on "11" days, but many do) and that the day after that is option expiration.
The old saying is that the market usually puts in the low on the Thursday or Friday the week prior to option expiration. This means that's it also possible that we don't get a rally from the election (remember, we don't know yet which demon they will put in?). If Romney wins he will likely continue the Bush tax cuts and the selling before the end of the year will be minimum as there won't be any reason for traders to close out large positions for fear of higher capital gains taxes next year (The Bush tax cuts puts it at 15% if I'm not mistaken... far less then 40% or more that would resume if those cuts expire). If Obama wins he will likely let those tax cuts expire (unless the cabal got to him and steered him back in line), which means that the selling later this year should be greater as traders close out those large positions to avoid paying higher taxes next year.
So I don't know how traders are going to react after this election ends but "if" they just keep up the old saying then we should continue down and put in a bottom on Thursday or Friday and then rally into next week for option expiration. I know a lot of people are expecting a rally after this election ends but it could be delayed a few days and new low put in first... then a rally. Which means that "if" this scenario plays out (it's my favorite one) then we shouldn't see a new high as dropping first into Thursday/Friday and then rallying back up into the 15th would only give the bulls 4-5 days to climb up to that trendline of resistance.
And since they'll be starting from a lower level (then the current 1410 spx area) the climb and time given sounds about right to hit the trendline on the 15th. Of course the line would be lower by then and might only be in the 1445-1450 area. Then I'd be looking to go short there... especially if we have strong "all up" solid white candle on the daily chart on Wednesday the 14th. That would give the 15th the best chance of a pop higher to hit the trendline and then turn back down putting in a "topping tail" candle.
Well, that's about the best guess I can give you...
Good Luck as away.
Red
P.S. If you really don't think HAARP exists check out this video by Jesse Ventura
This new update seems to imply that Obama has switched sides and now is working with the good guys to stop World War 3 from happening. This is great news if it's true? I don't know what to think about it at this point but I do still remember Doloris Cannon stating that Obama has a "light around him"... meaning that he's one of the good guys. So maybe he's been playing the part of the bad guys to deceive the Bush Nazis Illuminati gangsters up until now. I certainly think Romney would have kissed Bush's ass and done everything they would tell him to do... including start WW3!.
So maybe we are better off with Obama then Romney? I correct that... we are better off with Obama, as at least he seems to be fighting against these gangsters somewhat as Romney certainly wouldn't have. While I still would have liked to have seen Ron Paul win I'll go on record and support Obama if he does go against the Cabal. I've always stated that I wasn't sure about Obama and that until he proved himself I didn't trust him or support him. My support has been for Ron Paul only, but if this story is real then Obama might just have been a "sheep in wolves' clothing", that just succeeded in tricking the wolves at their own game.
The Dragon family and governments of the non-Western world acted decisively to get Barak Obama re-elected as president because a Romney victory would have meant World War 3, according to multiple sources.
Obama was cut off of his election finances by the Pope and the Queen three weeks before the election and would have lost if the Dragon family and others did not step in and finance him, according to CIA and Asian government sources. Obama returned the favor by complying to a request to purge Bush/Nazi operatives from the government and the military, the sources say.
That is why Timothy Geithner, Hillary Clinton, Eric Holder and other bush operatives were fired. The purge at the pentagon and agencies included CIA Chief David Petraeus, Rear Admiral Charles M.
Gaouette, US Army General Carter Ham, Brigadier General Jeffery A. Sinclair, and US Navy Commander Joseph E. Darlak, according to CIA and other agency sources.
Obama now has a totally different set of handlers and teleprompter script writers than he did in his first term. The agenda he is expected to follow is
to set the stage for a swords to plowshares transition of the military industrial complex.
He is also expected to oversee the dismantling of the Federal Reserve Board.
The voting patterns for Obama reflected the fact that he was elected thanks to non-Europeans. He got over 70% of Hispanic, Asian and Jewish votes, close to 100% of African American votes and only 39% of European American votes. There was also massive support from the 180 nations of the world that are sick and tired of never ending American and European war-mongering.
Obama is now a high priority assassination target of the Nazi/Bush faction, according various sources.
The situation may actually lead to civil war against the Bush Texas stronghold. Since Obama got only a bit more than 30% of the European American male vote you can be sure there are lot of upset white men, many of whom belong to militias, who might fight with the Nazis, creating a potentially volatile situation.
The White Dragon Society was not involved in the decision to back Obama but agrees with it, with some reservation, because the alternative was WW3.
The overwhelming Jewish support for Obama, despite Israeli Prime Minister Netanyahu’s support for Romney, makes it pretty clear the Jews are sick and tired of being manipulated into fear and war by neo-Nazi Zionist thugs. The Israeli military and intelligence establishment has also finally figured out that they have been fooled into working as proxies for Nazi American and European tycoons and are no longer following the program. Netanyahu, who had his psychiatrist murdered, and was part of the 311 nuclear terror attack on Japan, will probably end up in jail when this is all over.
The Bush faction CIA agent “ambassador Stevens” was definitely behind the nuclear and tsunami mass terror attack against Japan on 311, according to MI6 and gnostic illuminati sources. He was tortured for 8 hours after his capture in Libya and spilled the beans on the plot to start WW3 with a false flag attack against US forces in the Persian Gulf. While he was hung out like a worm on a hook he reached out to various places asking for help which also helped reveal the network he was working for, they say.
Admiral Gaoutte, who wanted to help Stevens, was taken away in handcuffs and has not appeared in public since his arrest, meaning he is probably undergoing intense interrogation, pentagon sources say. Gaouette was planning to attack his own fleet and blame it on Iran in order to start a war, according to these sources.
The White Dragon Society also received a direct call from a senior pentagon general warning that Hurricane Sandy was just a foretaste of what would happen in Romney was not elected. Now we shall see what retaliation the Bush Nazi faction carries out now that their people are being purged following Obama’s victory.
There are also mass clouds of disinformation being put out now and it will take some time for it to clear up and reveal more about what is really going on.
For example many sources say George Bush Senior is senile and in a wheel chair and that Jeb Bush now runs the clan. However, Neil Keenan says Bush recently got a $5 million rejuvenation treatment in Hong Kong and is still fully in control.
This sounds far-fetched but Japanese military intelligence sources say former Japanese Prime Minister Nakasone recently appeared at a funeral looking far younger than his 94 years making many speculate he had been “replaced.” Other well-known gerontocrats like David Rockefeller also occasionally appear rejuvenated as if they had undergone some sort of treatment.
The other disinformation surrounds what CIA Chief Petraeus was up to. Some pentagon sources say he was planning to install himself as a Roman style emperor after killing Obama and staging a coup.
Others say he was a patriot who was fired to prevent him from testifying about what really happened to Stevens.
What is clear though is that the mass firings announced by Obama mark a major change in the US power structure.
A lot of Japanese power-brokers have been deeply upset by the Romney defeat, notably Junichiro Koizumi’s and Yasuhiro Nakasone’s people. That means that well-financed attempts to set up a new Nazi puppet regime in Japan are now doomed.
This is already becoming visible. Tokyo Governor and well-known China baiter Shintaro Ishihara resigned to start a new national political party after his son was defeated in his effort to take over the resurgent Liberal Democratic Party. However, Ishihara is not finding any followers and has committed political suicide. The moves to place charismatic Osaka major Toru Hashimoto, an Ishihara friend, as a new leader of Japan are also now being put to an end.
Instead it is now looking likely that the Liberal Democratic Party and ruling Democratic parties will merge and choose a new leader through an open and fair election.
The Chinese leadership transition is also still underway but the emerging consensus is that democratic and other reforms that the new generation carry out will resemble the Singapore model more than they resemble the US or European models.
The Europeans, for their part, still do not have access to printing presses for new money and the result is a slow implosion of government function and society in many of their countries. Money will flow again when the wars and terror are stopped.
We truly could be moving into a new timeline where there isn't going to be another world war to kill off 2/3 of the population. I certainly hope that Obama is really is one of the good guys as I'm sick of all this killing, lying, stealing, and corruption. This article was also just published which I hope comes true. By allowing these states (and others yet to file) to secede from the United States Corporation (that is run by and controlled by the Nazi Bush Illuminati Cabal members) it will force the bankruptcy for the private corporation called the Federal Reverse Bank, and free us sheep from the debt they created.
Citizens from 15 states have filed petitions to secede from the United States
As of Saturday November 10, 2012, citizens from 15 States have petitioned the Obama Administration for withdrawal from the United States of America in order to create its own government.
States following this action include: Louisiana, Texas, Montana, North Dakota, Indiana, Mississippi, Kentucky, North Carolina, Alabama, Florida, Georgia, New Jersey, Colorado, Oregon and New York. These States have requested that the Obama Administration grant a peaceful withdrawal from the United States.
Louisiana was the first State to file a petition a day after the election by a Michael E. from Slidell, Louisiana. Texas was the next State to follow by a Micah H. from Arlington, Texas.
The government allows one month from the day the petition is submitted to obtain 25,000 signatures in order for the Obama administration to consider the request.
The Texas petition reads as follows:
The US continues to suffer economic difficulties stemming from the federal government’s neglect to reform domestic and foreign spending. The citizens of the US suffer from blatant abuses of their rights such as the NDAA, the TSA, etc. Given that the state of Texas maintains a balanced budget and is the 15th largest economy in the world, it is practically feasible for Texas to withdraw from the union, and to do so would protect it’s citizens’ standard of living and re-secure their rights and liberties in accordance with the original ideas and beliefs of our founding fathers which are no longer being reflected by the federal government.
As of 12:46 am, Sunday, signatures obtained by Louisiana, 7,358; Texas, 3,771; Florida, 636; Georgia, 475; Alabama, 834; North Carolina, 792; Kentucky, 467; Mississippi, 475; Indiana, 449; North Dakota, 162; Montana, 440; Colorado, 324; Oregon, 328; New Jersey, 301 and New York, 169. Many more States are expected to follow.
A petition is not searchable at whitehouse.gov until 150 signatures have been obtained. It is the originator's responsibility to obtain these signatures.
The Texas petition can be reviewed and/or signed by clicking here
So, at this point in time I think we should now give Obama a chance to prove himself. The title of this post is most likely wrong as it was probably Romney's gangster buddies that created Hurricane Sandy, which I'll have to rename Hurricane Romney I guess... or maybe just Hurricane Bush? Either way it's becoming clearing that Cabal is losing control as they told Lindsey Williams that they wanted Romney in and not Obama. As the old saying goes "an enemy of my enemy is my friend"... meaning that if Obama is the enemy of the Nazi Cabal then he's not my enemy but my friend.
Why? Because it really doesn't make sense to devalue the dollar when the market is up so high. It would be more logical (and get more "bang for the buck") if they sell off the market some first and then at the bottom they could do the devaluation to spark a "blow off" top rally into the summer of 2013. Kind of like doing "reverse stock splits"... you don't do them when the stock is high, you do them when it's really low. That way it goes back up to a "trade-able level", where as it's hard to trade it when it drops below $5.00... which is the reason why they do them as a 10-1 reverse split would put a $5.00 stock back at $50.00 and be more attractive to trade.
Therefore, if they sell of the market a couple of thousand Dow points and then do the dollar devaluation it would make the market (and gold) go up huge... maybe even to WBS's 30k+ target? Of course it will be with devalued dollars and therefore wouldn't be a real "level" like today, but it would fool the sheep until next summer when they really do let it all collapse for real. So, what am I thinking will happen? This coming October 23rd and 24th they will have another FOMC meeting (http://federalreserve.gov/whatsnext.htm) and I think that something they say will trigger a sell off in the market. Like I said, I think the top will be put in on Tuesday the 23rd as it's a ritual "eleven" day... just like the most recent top of October 5th was also an "eleven" day.
But what will they say? They now have QE3 going forever with no ending date set, so what's left for them to say to spark a rally? I can't think of anything... can you? If fact, in this latest 3 hour video Lindsey Williams says some very interesting things starting at 2 hours and 56 minutes into it.
I'm thinking that they "may" actually raise the interest rates at this meeting which would of course tank the market hard. Not a crash but a very large move down... possibly to this FP of 1068 on the SPX. Notice the date in the left hand top corner (not the date the screenshot was taken, which was 7/20/12 9:13am) that shows 7/19... which is 0+7+1+9+2+0+1+2=22, or "11"! These FP's that are put out on "eleven" days seem to be "real" ones, whereas others "may" be just a distraction? So, "if" they actually do sell off the market down to 1068 and then do the dollar devaluation... there going to be a new "all time" high for sure next year! Gold would go up 40% instantly just like they want to happen. Then from whatever level it starts at I would fully expect it to continue up all of next year while the market is on a crazy insane "devalued dollar" Bull Market Rally!
This would qualify for what Lindsey Williams said about there NOT being any crash in the next 3 months (his "crash" is something like from 1929, not a minor 3,000 point drop) and the rise in prices for Gold and Silver... as well as Oil. These things could all come true "if" they sell off first (to scare out all the bulls in Gold right now, as it should dip too) and then devalue the dollar to get the prices of everything up where they want them to be.
But what if I'm totally wrong and the "turn" after Legatus is UP?
This chart of the open interest in Gold has me worried. So one (or several big buyers) purchased 20,000 calls today on Gold for the 190 strike price for the month of November. Gold is selling off today as I'm writing this post and is around 168 currently. A move up to 190 or more would only happen if the "October Surprise" was the 40% dollar devaluation... which means the market won't tank hard as I current think it will. Everything tells me that we are going to sell off hard, but too many others see the same thing... and that has me really worried!
That facts are that the gangsters all met together in these Legatus Pilgrimages and decide the fate for us sheep. Right after almost all (not everyone of them though) a big turn in the market happens. I have just been "assuming" (making an ASS out of U and ME) that because we are so overbought that the "turn" will be down hard. But the reality is that we have been chop it up sideways in a narrow trading range for the last 2 months or more now. Therefore a "turn" could go either way, as trading basically sideways is just "Flat" with no direction really chosen.
I'm also worried about what Lindsey Williams said too. You see I'm sure they use him to spread "timely" information that benefits them when they want us sheep to take the other side of the trade. When they are long they spread fear in the market and all the bears get short. When they are short they everything is fine and it's just a health correction, and that we sheep should be buying the dips while it goes longer. Once the bottom is in they start spreading fear that it' going to collapse and that we sheep should panic, sell out our longs and go short. Then they rip it higher and squeeze us all out.
That's how the game is rigged folks. So right now they seem to be spreading fear of an "October Surprise Stock Market Crash". Now I've repeatedly said I see a big move down, but not a crash. However, if I'm wrong on this and the real "October Surprise" is the dollar devaluation (meaning that Lindsey either lied, was lied to by his elite source, or the elite source was lied to) and they will do it this year... not next year as he was told. Lindsey said that his source stated that they'll be NO collapse of the dollar before January 1st, 2013. I take that to mean that they won't do the 40% dollar devaluation this year... but what if he's wrong?
These gangsters are masters at lying, mis-leading and deceiving us sheep, so the biggest surprise could very well be a rip roaring rally from a dollar devaluation... and not a big correction as I (and many others) have been calling for. The facts are simple, as they refer to what has happened in the past. I'm not referring to the charts as they are too heavily manipulated to work anymore. I'm referring to the ritual numbers like "eleven" that many (not all) significant highs are put in on.
I'm also referring to the past times that there was a turn after an FOMC meeting (which is this coming October 23rd/24th). They will usually run the market up into the meeting and then sell off afterwards when no new "good news" is released from Bernanke. If they rally into the meeting slowly (because they don't know what will come out of it) then sometimes they rally hard after it... especially if Bernanke promises more crack. This past FOMC was a perfect example where they started a small rally into the September 13th, 2012 meeting and then sold off afterwards. It's always a tough call on what will happen after these meetings but they usually produce a turn in the market.
The other indicator that I watch is the Legatus meetings where all the gangsters meet to decide on how to screw the sheep again. The past Legatus meetings have been turns at least 80% of the time going back to 2008 (I never checked back further then that). So I fully expect something big to happen after this one ends this coming Sunday the 21st. Note that they are in Rome during this time period where it's easy for them to funnel their stolen money through the Vatican banks, as they don't answer to anyone or keep records of your name... only a "number" and "key" is used to access your account (great for thieves that need to launder money).
With everything lining up together now a "Big Turn" in the market is nearly certain!
The question is... which way? These gangsters are masters at stealing your money. Remember, they don't work for their money... they steal from you! The "work" that they do (if you can call it that?) is based on how to manipulate the sheep into taking the opposite side of any trade they are in... and then buying off, bullying, or threatening the right people to make the trade go in their favor. They front-men companies like JP Morgan to illegally manipulate silver and thugs like Goldman Sachs to move the stock market up and down where they want it to go. Make NO mistake about it... these people are criminals! They do "insider" trading as often as they eat, and murder the competition... physically!
You didn't really think Japan was hit by accident did you? Of course it wasn't... they had to murder the competition. For what you ask? Cars that run on water of course. That would have killed the oil cartel and destroyed their evil plans to chip us all and mold us into their "New World Order". You see, they will do whatever it takes to control you. While Lindsey Williams may have compassion for his elite friend, I don't! They are all murdering satanists that need to be exposed, arrested and tried for crimes against humanity.
Believe me, they don't care one red cent about you... in fact they call you a "useless eater"! I call them Satanist Pigs! They may be trying to save themselves as they get older and face death (that's what Lindsey says), but "karma" is "karma" and they will have too pay for all the evil they have done throughout their lives. So will you and so will I... so I try my best to keep good karma and not do bad or evil things to anyone else. I just use this blog to wake up the sheep to the evil around them, but not to fall prey to them. Just smile everyday and don't let the gangsters bother you, as they will meet their maker when their time is up. Do good to others and when you meet your maker he (or she for you ladies... LOL) will be happy to see you, and reward you for your good deeds! (assuming you believe in the afterlife?).
Anyway, I rambling now. Let's get back to "thinking like a pig" but not becoming one. What are these gangsters deciding on doing after this latest Legatus meeting? I wish I knew the answer to that question but I don't. So, I'll have to play both sides of this game but lean heavy to the short side. I plan on taking a long position on gold as a hedge in case they surprise us sheep over the weekend and devalue the dollar 40% (closing the banks on Monday of course). This will be a "wildcard" position that I expect to expire worthless if the market tanks as I expect it too (gold should follow the market down... or up). I will take this position before the close on Friday the 19th and hope that I'm totally wrong on the surprise being a bank holiday.
If nothing happens then I'll be looking to get short the market on Monday the 22nd and see if I'm right on this call. A big sell off in the market will mean the long gold position will expire worthless as gold should go down with the market. However, "if" they panic the traders with a big, fast sell off (mini-crash) move down then gold could go up huge from the panic (as traders would flock to safety) and I would win on both positions. I don't see this happening though as it makes more sense to just take it down in a similar fashion to the May 2nd, 2012 sell off. That one dropped about 124 spx points over 13 trading days.
But, if Bernanke instead announces and interest rate hike then the dollar will soar hard (meaning gold should tank, but again... it's a wildcard as "fear" can also cause it to soar higher), and the market will tank hard and fast. Logic (and the evidence) tells me that a "BIG MOVE" is coming this October 23rd, 2012 but which direction is still unknown? Therefore the safest trade is to play both sides. One would be to go long metals in case of the dollar devaluation and the other would be to short the market in case of an interest rate hike. Either way the money made from whichever one plays out should more then make up for the loss on the other one that will expire worthless.
While I'm not giving out trading advice here as you all have too make your own decisions based on what you see in the market I'll personally be looking hard at some wildcard gold calls like "some big player" purchased today at the 190 strike price for the month of November. Now we all know that there is a buyer and a seller for all trades for both "calls" and "puts", so there had to be a seller for those 20,000 calls too, right? Some of you might think that someone is just "hedging" their positions by selling those calls to collect the premium as they expect gold to go down making those calls sold expire worthless in November.... which is a natural thought.
But, what trader in his right mind would sell so many "calls" so far away from the current level to collect only 4-5 cents? If you thought (or knew because you were an "insider") that gold was going down into November expiration wouldn't you want to collect as high a premium as possible? You be more likely to sell "calls" that are much closer to the money like the 170's that are worth $2.08-$2.10 per call. Remember that someone that buys or sells 20,000 calls usually has "inside information"... meaning that you (or that trader) knows that gold is going down and that he will get to keep all the premium he collects for the sale of those calls. So ask yourself this question... would you rather sell 20,000 calls for 3 cents each and keep the premium when gold sells off as expected or sell 20,000 calls for $2.08 each and keep that premium?
Logic should tell you that one (or several large traders) did not sell 20,000 calls at the 190 strike price today to collect the premium for them when they expire worthless, but instead bought them because he was expecting a big move up and they were dirt cheap to purchase. A dollar devaluation would cause them to go up 10-20 fold or more... overnight! To me it makes more sense that one (or several) large buyers purchased these calls today from many smaller sellers (that don't think gold is going up). While there has to be an equal amount of buyers and sellers for every call and put at every strike price that doesn't mean that there can't be one big buyer that purchased from many smaller sellers... which is what I think happened today.
Of course this is all just speculation on my part, but I wan't to be covered for the big move coming, so playing both sides just makes the most sense too me right now. Therefore I'll be looking to pick a crazy "out of the money" strike price on some gold calls tomorrow (Friday, October 19th, 2012) to go long on. Again, I fully expect them to expire worthless as I'm only getting them as a hedge against a surprise dollar devaluation over this coming weekend. Then I'll go short the market with some SPY puts on Monday the 22nd (again, this assumes nothing happens over the weekend). From there I'll just wait and see what happens during the FOMC meeting on the 23rd (the most likely "turn date" because it's an "eleven" date). My ratio will be 1/3rd long gold and 2/3rd's short via the SPY.
Please make your own trading decisions here and don't put up more money then you can afford to lose. While I'm doing my best to help everyone make a bunch of money from this big move coming I'm not always right as I'm a sheep like you are and don't have any insider information. This is pure speculation on my part and I'll be putting it to the test with my own money, but you should do your own research and make your own decisions.
With the Presidential Election on November 2nd only a little over a month away and Obama is losing in the polls will there be another False Flag to get him re-elected?
Past history shows that whenever war happens during the last year of any president's term he was always re-elected for the 2nd term. So, if the Illuminati want to keep Obama for another 4 years then a "October Surprise" would certainly do the trick for them. And, it would help them meet their other evil goals... like taking the price of oil up to $150.00 per barrel or more.
(More on Obama and the possible "False Flag" later...)
Their goal of pushing gold up to $3,000 or more is already underway since this past September 13th when Ben Bernanke started Quantitative Easing part 3 (QE3). Food prices rose 40% with QE1 in 2008, and a similar amount again with QE2... but the damage this new QE3 will do is going to be even worst.
Why you ask?
Because there isn't a cap on the amount of spending whereas QE1 and QE2 were set amounts. This new QE3 is a program to buy $40 Billion Dollars worth of mortgages from the banks every month... forever! Or at least until they buy up all the mortgages the banks own, which at that rate it shouldn't take too long! Let's do the math and try to figure out about how long "too long" really is...
First we need to know just what the total value of all the mortgages in the united states really is. For that question I searched google and found this from Wiki Answers
The total stock of mortgages outstanding in the US is about $10 trillion. However, the market value of these mortgages (whether still on banks' balance sheets or securitised and embedded in RMBS (Residential Mortgage Backed Securities)) is in reality lower by $1-1.2 trillion, due to the fact that U.S. homeowners can walk away from their mortgage leaving the lender with "no recourse". In other words, book mortgage value = about $10 trillion, while actual value is more likely $8.8 trillion to $9 trillion, due to losses on foreclosures
Ok... now we have about $10 Trillion worth of mortgages, which at a rate of $40 Billion per month it would take 250 months (or 20.83 years) to buy all of them. But, we all know that's not going to happen. Why? Because the banks are taking that $40 Billion and turning it into $360 Billion immediately through the "Fractual Reserve Bank System" where it's multiplied 9 times instantly.
Then the banks are going to make bets (called derivatives) on the exact mortgages that they sold to the Federal Reserve Banks. Of course they are also going to purchase Treasuries from the government with some of the money received per their secret deal with the Fed gangsters.
This money will simply be used by the government to pay the interest on the national debt (until such time that the government actually defaults on the debt severe years into the future I'd say). So as you can see this is just a giant "99 year long" ponzi scheme the government has going on now. Here's how it works...
First, you have to create interest on money and then make sure that only the principal loan amount is printed and put out into circulation, leaving the interest out completely. Logic then tells you that if you loan $1,000 dollars out but tell the person borrowing it that they have to pay back $1,100 (because of the 10% interest 0r $100) that since the $100 dollars wasn't ever printed or loan that it can't be paid back. Therefore, another loan must be taken out to pay the interest on the first loan... and the ponzi game is started.
Now prior to the Federal Reserve Bank being created in 1913 there wasn't any standard currency as almost anyone could create money. In fact, this article states that there was over 30,000 different currencies floating around..
Sometimes, in order to understand why you need something, it helps to find out what it was like before that "something" was created. Before the Federal Reserve was created in 1913, there were over 30,000 different currencies floating around in the United States. Currency could be issued by almost anyone -- even drug stores issued their own notes. There were many problems that stemmed from this, including the fact that some currencies were worth more than others. Some currencies were backed by silver or gold, and others by government bonds. There were even times when banks didn't have enough money to honor withdrawals by customers. Imagine going to the bank to withdraw money from your savings account and being told you couldn't because they didn't have your money! Before the Fed was created, banks were collapsing and the economy swung wildly from one extreme to the next. The faith Americans had in the banking system was not very strong. This is why the Fed was created.
The Fed's original job was to organize, standardize and stabilize the monetary system in the United States. It had to set up a method that could create "liquidity" in the money supply -- in other words, make sure banks could honor withdrawals for customers. It also needed to come up with a way to create an "elastic currency," meaning it had to control inflation by making sure prices didn't climb too quickly, and it needed a way of increasing or decreasing the country's supply of currency in order to prevent inflation and recession. In the next two sections, we'll discuss these inflation and recession.
Of course this isn't a good thing to have, but neither was creating the Federal Reserve. The Central Bank should have been the United States Treasury Department (per the Constitution) as it could have created the money itself without the need to pay interest to some third party bankster and would have then avoided the ponzi scheme that's with us today.
Regardless, it's here today so let's move on...
Second, you need to be able to loan out more money then you have actually "on hand"... which is why the banks are only required to keep 10% of their loaned money in reserves. This works out great for them as they can loan out the same $1,000 dollars 9 times turning it into $9,000 dollars worth of loans that borrowers owe interest on.
Ok, so we got all the necessary parts needed for the start of a big ponzi scheme. Now we just need to create a huge bubble to get the borrowers... which they did with the first World War I. Industry was booming because of the war that started in 1914 and lasted until 1918. This was just one year after the creation of the Federal Reserve Bank in 1913.
After the first World War I ended they moved on to another bubble to further keep the ponzi scheme going. You see, as long as people continue to borrow money for the planned purpose of making more money from some business or investment they make the ponzi scheme continues. Only when no one is able to borrow anymore is when the game ends.
This of course happened when the planned stock market crash of 1929 occurred.
Pretty much after the "war bubble" ended (which was all the job's created from the machines and weapons needed to fuel the war) they needed another bubble... which was of course the investment bubble, where people moved their attention from borrowing money to create businesses that provided products for the now ended war, to borrowing money to invest in future companies run by someone else.
Either way, whether someone was borrowing money to start their own business, or borrowing money to invest in someone else's business (by purchasing stock in that company) the ponzi scheme continued. However, it only continued until the last person was "in"... which basically means that the last amount of money available was borrowed.
Back then only a small percent of the public had their money in the stock market, so there were plenty of smaller "privately owned" mom and pop companies to keep everyone from going hungry. That depression greatly affected the men and women in the bigger cities where their livelihood was tied directly to the larger companies in that city, which those companies further tied their livelihood to being able to borrow money from the banks and use the value of their publicly traded stock to provide cash flow.
This all dried up when the stock market crashed!
These big companies started to feel the pinch several years before the crash as the money started to become harder to get from the banks. This is exactly what has been happening since around 2007-2008. As all the "QE" programs have been put into the banks for the "supposed" purpose of stimulating the economy through the banks loan out that money to the "borrowers" to prevent another Great Depression, the banks have refused to loan out that money because they would rather gamble it in the "Derivatives" market.
Now the banksters back in the 20's still didn't have the complete freedom to f@#k over the people because the money was still backed by gold and silver... therefore their printing press did have it's limits. Today there are NO limits to the depth of stealing these pigs will do. (Ask me if I support "rounding up the banksters" and hanging them! Nevermind, you already know my answer).
So after the 1929 - 1933 Stock Market Crash was over the banksters had successfully purchased a whole lot more of America's assets at 10 cents on the dollar and were ready to start the next bubble to steal some more. After all once a criminal always a criminal right? But what will it be this time around? There are many people still unemployed and in order to steal their money the banksters needed to first get them to work.
Simple solution really, let's create another World War, part II...
It didn't take the banksters long before they got America into World War II, which started another bubble and put the slaves back to work again (yes you and I are all slaves and owed by these evil banksters). It really wasn't that hard this time around as the first war they needed some crazy psychopath in some other county to start it... but it wasn't required for part 2.
Back when they "created" the first World War, they simply went into that country and offer to fund the crazy psychopath named Hitler with all the weapons and money he needs to start a big war. Boeing aircraft provide him with the planes he needed and Ford Motor company built him a tank factory (which was later bombed by American bombers, and of course Ford stepped up and rebuilt the factory... how patriotic at of them!).
Anyway, the 2nd World War was easier to start and easier to get America into. So, another war and another bubble created... success (from a banksters point of view). The slaves are back to work again and we banksters can now come up with more creative ways to steal their money again.
After World War II the wars continued but the banksters got it down to more of an "exact science" and didn't need (or want... because is wasn't profitable I'd assume) global wars anymore, so they are all now very well contained regional wars. There was the Korean War, Vietnam War, the many "conflicts" in various countries during the "Cold War" with Russia, then Desert Storm and Operation Freedom... and the current "undeclared" wars in the Middle East that are currently going on right now.
As you can see, War is Money!
So while the slaves are waking up (thanks to the internet) to their enslavement that the banksters have done to them they still aren't fully able to stop these evil scumbag banksters yet. This is why I write about them so much here on this blog... because I'm sick of being a f@#king slave!
Now I don't usually go off on a tangent and use such bad language but some times I need to get your attention... so forgive me and just "wake up", as we all need too before World War III is started. If you simply compare the time period we are in now and that of the 1920's period you can see that the stock market is getting overinflated now to the period similar to 1928... with 2012 being the closest date.
This also lines up with the creation of the Federal Reserve Bank in 1913 to the end of it in 2013... a hundred year agreement. I can't remember where I heard it or read it (or can find it again by searching the internet) but I recall someone stating that the bank only has a 100 lease or term and then must be abolished or renewed (some how I don't see the public renewing it). I could be wrong on that as it could just be inaccurate information, but I do still think the days are numbered for them and extinction is near.
Now let's continue with the possible "False Flag" around the 3rd week of October, 2012...
Obama seems unlikely to win the presidential election so staging another "false flag" to start another war would really be a smart move on his part. But will the Illuminati banksters let me? After all, they control the world... not Obama. And from what Lindsey Williams has been told the "elite" (he calls them that, I call them the "Evil Reptilian Illuminati Satanist Banksters Pigs) they don't trust Obama and are favoring replacing him with Romney. But make no mistake... they control them both!
So it's possible that Obama has decided to be nice again and do as they say, if they let him get re-elected again. The banksters want to get oil up to $150 per barrel and gold to $3,000 per ounce, so why not create another "event" to spike oil up over night? Clearly they are slowly taking gold up with QE3, but they still need that "shock and awe" to happen (but not to some made up enemy, but instead to the wallets of the American sheep!).
Now I don't have any evidence or forwarning of a "false flag" event, but instead I'm just going on my gut feeling here that "something" will happen around the 3rd week of October so that oil can spike higher and the stock market can take the first very large wave down before the really big one happens in late summer of 2013. Not that elliottwave works anymore as the super computer SkyNet runs the market, but on a larger time frame I still think we'll see a 5 wave pattern down for this collapse.
If the largest move is to happen next summer, and that move is called a "Wave 3", then we still need the first "Wave 1" to happen before the end of this year. That's why I think we'll sell off nicely starting around October 23rd, 2012. I point to that date for many reasons.
First, it's right after the "eleven" day long Legatus meeting, where all these banksters meet to decide on how to steal more money from us sheep. If they decide to tank the stock market then they'll usually run up the market for several months into that date, then peak the market on a "ritual eleven date", and then drop it hard for awhile. It's not always a "crash" but it's usually still a big move.
If they decide to steal the money directly by printing it and injecting it into the market (rather then robbing the sheep's stocks at massively oversold levels following a stock market debasement) then the market will rally from the decisions made at one of these Legatus meetings. I've seen both rallies and selloffs happen right after (sometimes during) one of these meetings.
The second reason for picking the date of October 23rd, 2012 is because it's a "ritual eleven date" that is just too close to the end of a Legatus meeting, and I've noticed many (not all of course) times in the past where the market put in an important top on an "11" day. Numerology is important to these banksters as you can clearly see from the 9/11 false flag, the attack on Japan on 3/11 and the false flag London bombing on 7/7.
Thirdly there is the proximity to the elections on November 2nd, and Obama looks desperate right now. You have the banksters also desperate to get an "undeclared war" started in the middle east that causes the "Straits of Homuz" to be closed so the price of oil will skyrocket to $150.00 plus... just like they planned. Then you have all the rumors from the last couple of years of an "October Surprise" that never happened in 2009, 2010, or 2011. People seems to have forgotten about it now... so maybe it happens this year?
You have too look at all of these things together to get the big picture...
That picture is that over the last 4 years I've seen big turns in the stock market about 80% of the time right around the time of an Legatus meeting. I've also learned the importance of the number "eleven" to the banksters and how many (again, not all) important tops (haven't seen too many bottoms) have happen on an "11" date. Well, we have an "eleven" date meeting at this coming Legatus Pilgrimage (October 10th-21st), which is followed by another "eleven" date on the 23rd when the stock market is open.
You just add up all the digits in 10/23/2012 and you get 11 (1+0+2+3+2+0+1+2=11). I call this a "yearly" eleven, and it seems to be the most important. A "daily" eleven (again, a term I made up) is simply when the numbers in the date only are an "eleven"... which means that every month of the year you will have an "eleven" day on the 11th, 22nd, and 29th (2+9=11). The 20th is also considered an "eleven" as there are two "ones" added together to make the "2" in the 20.
Also, master numbers are not added up by their digits but instead kept whole and added up that way. For example, the number "11" isn't added as 1+1=2 but is keep whole to be 11. The same is true for other master numbers like 22, 33, 44, 55, etc... So, the date of 10/22/2012 is added as follows: 1+0+(22)+2+0+1+2=28, and then you add the result together (again, unless it's a master number)... so 28 equal's 2+8 or 10. Therefore that date isn't a "yearly" eleven date, but it is still a "daily" eleven as it contains the master number "22" in the day of the month.
Obviously you can see that there are many "daily" elevens every month of the year, but fewer "yearly" elevens. That's why I think the yearly elevens seems to be more important to the banksters... at least it seems that way too me, especially when related to the stock market. By no means have I figured it all out as the study of numerology is very deep subject and can take years to master. I've only learned a small amount of it... that amount is related to the stock market.
I can only add up all the pieces to the puzzle and then just guess...
This "guess" of mine is that "something" will happen around the 23rd (give or take a few days). I don't know if it will be a "false flag" event or just something big on the financial scene... maybe the default of some county? I don't know what will cause it, but I do still firmly see a big move down coming the week of the 22nd of October.
So, will it be a false flag that starts a war or just something big exploding on the financial scene? I don't know which but the result should be the same... a big move down in the market. Between now and then I don't expect much but more of the same boring day to day moves. I'll be on the lookout for new FP's that might give us our clues for the next move.

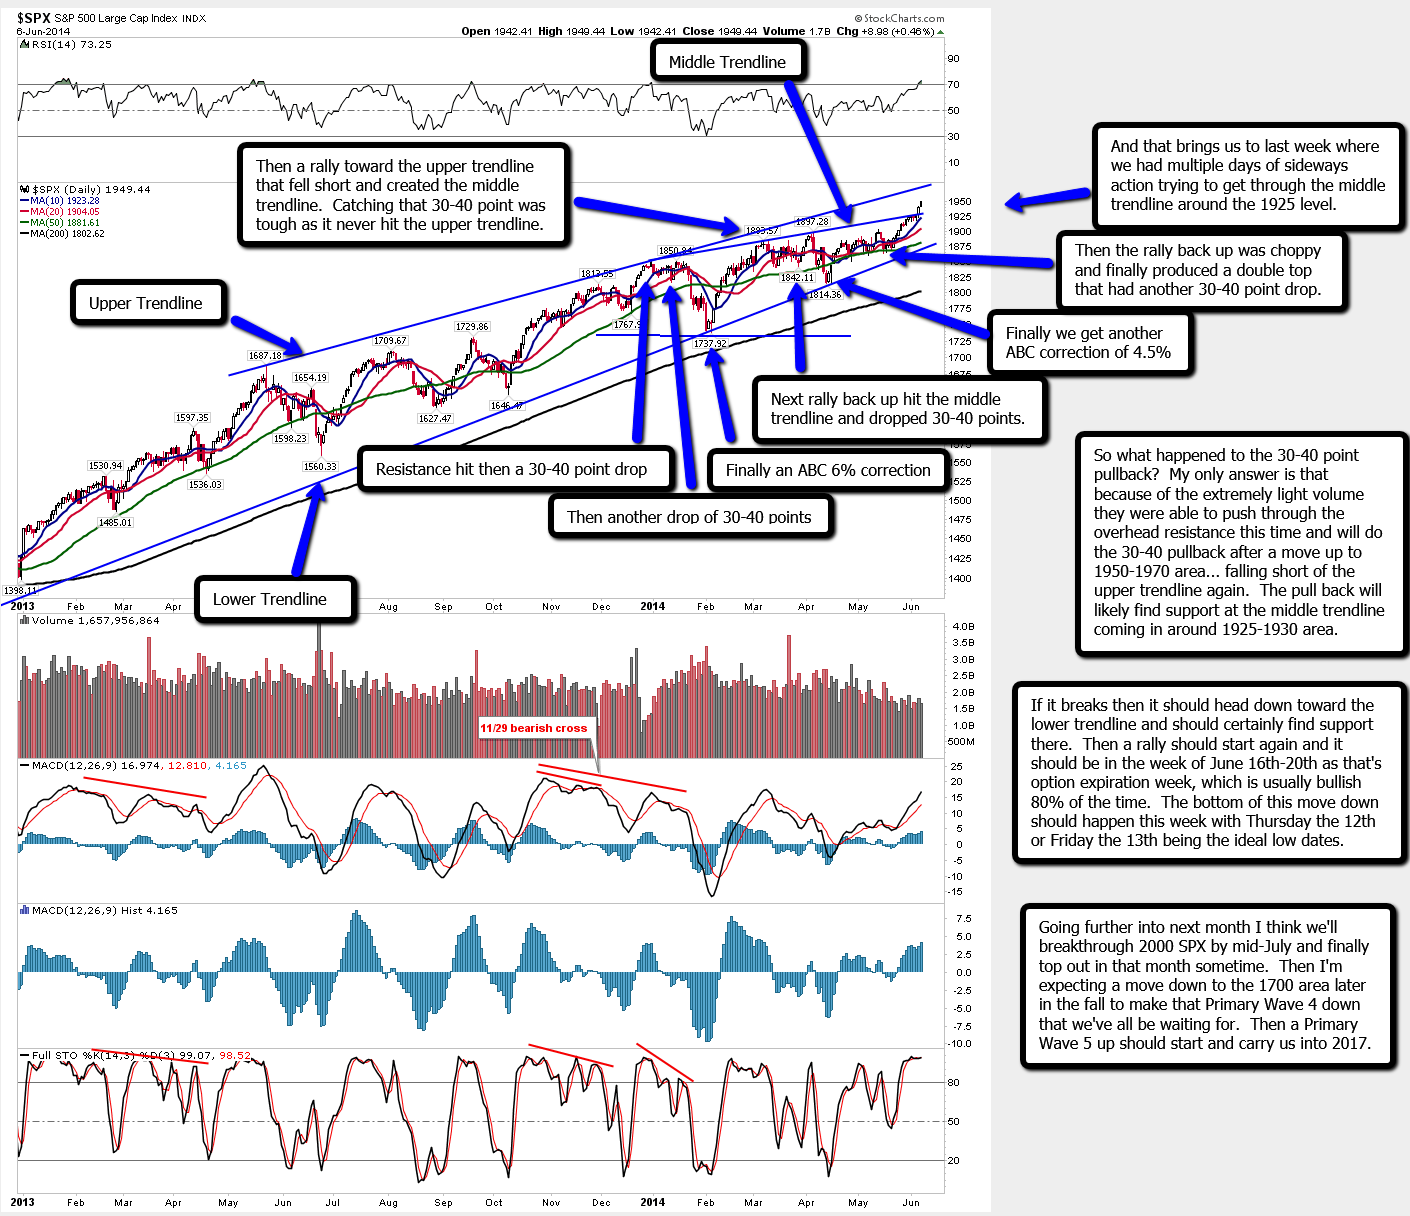

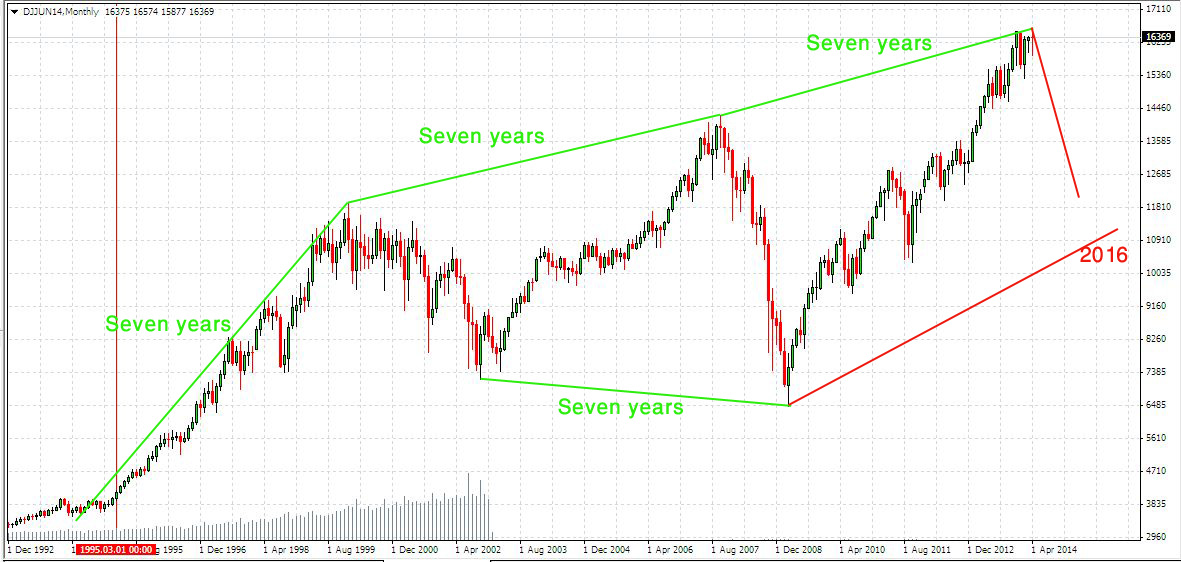
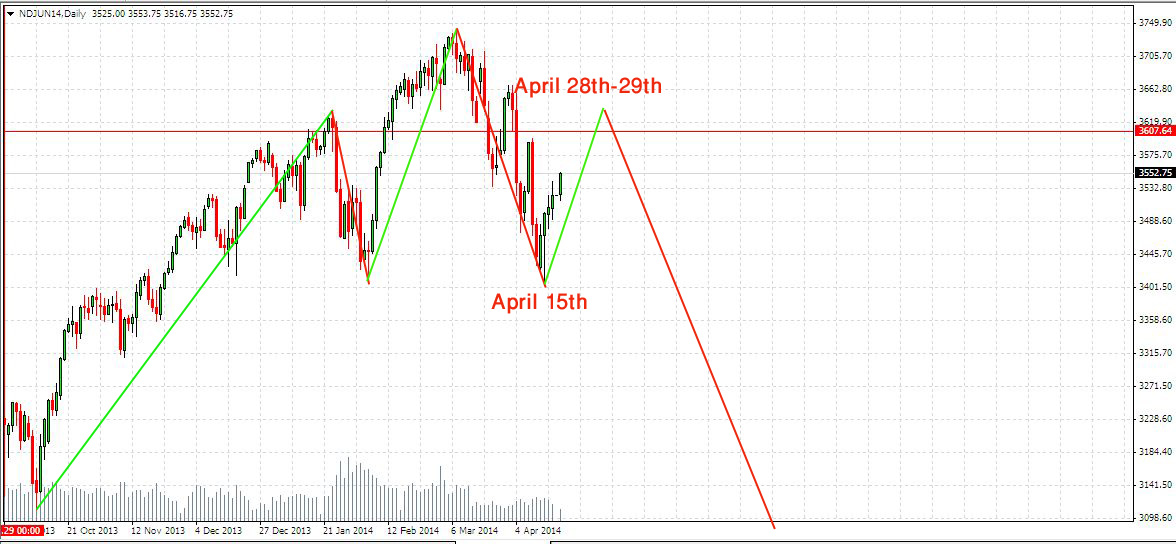
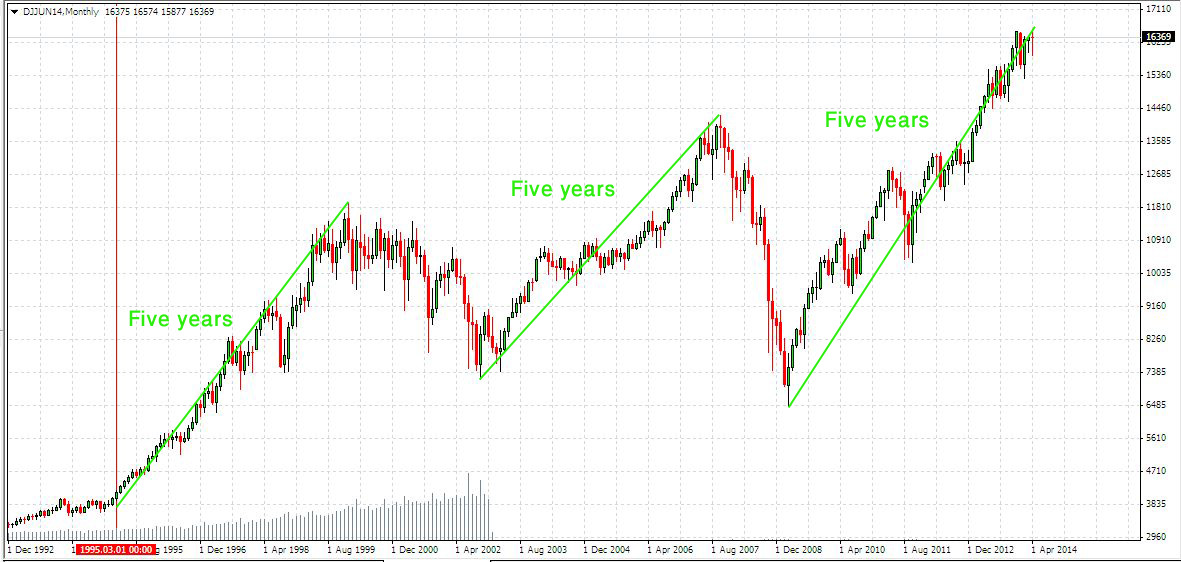

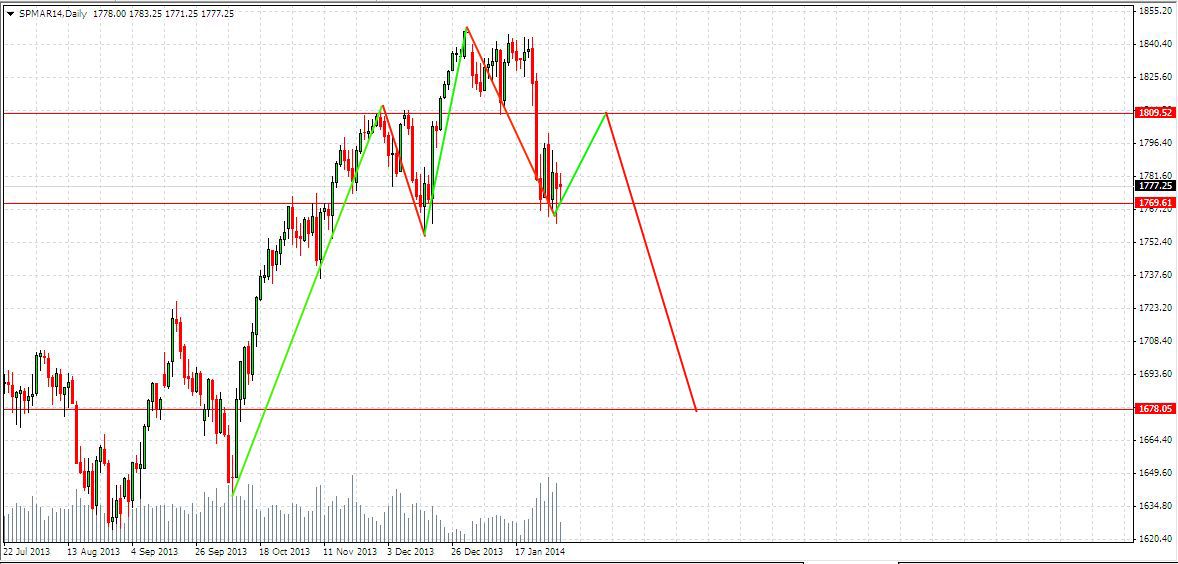
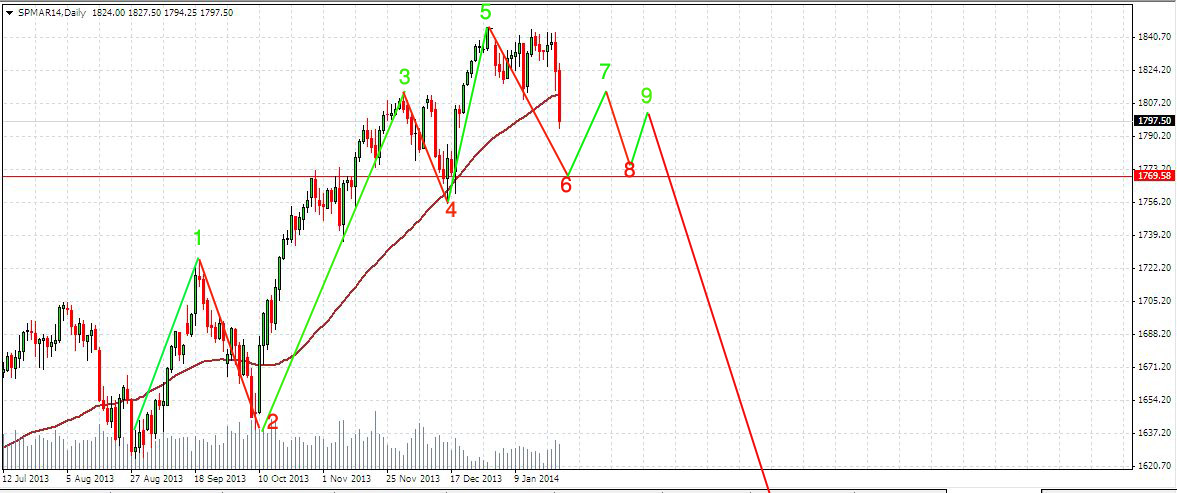
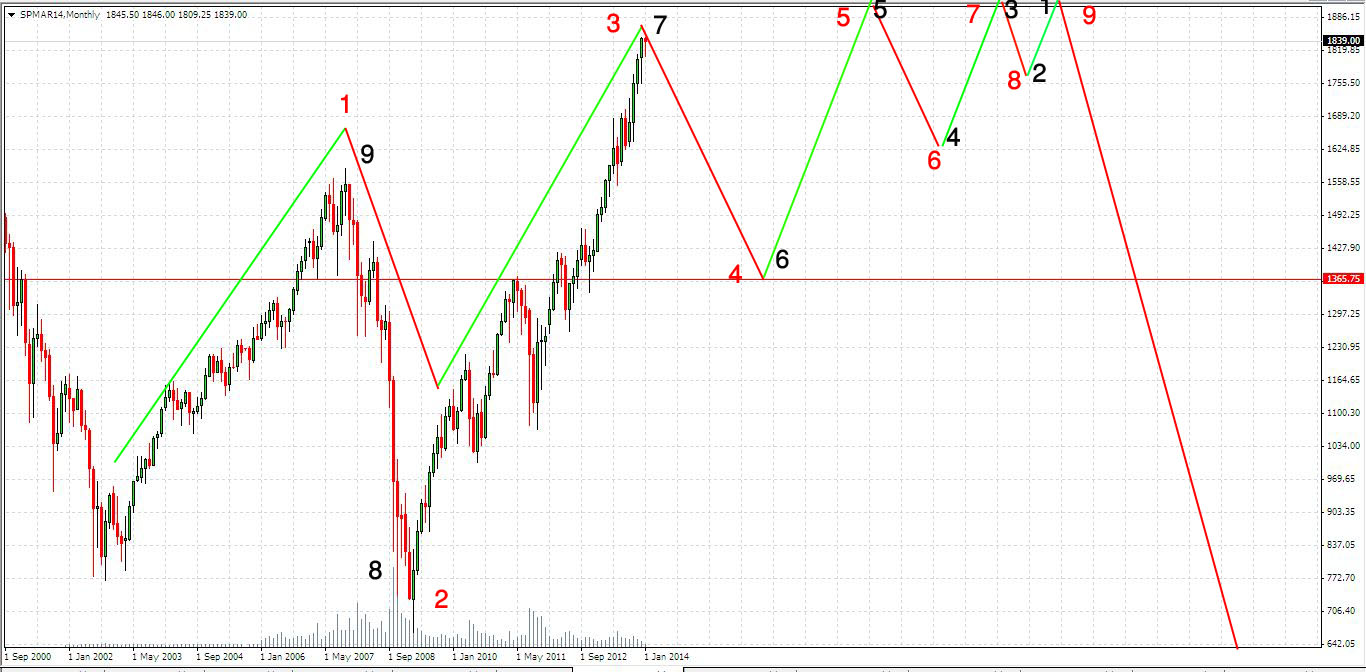
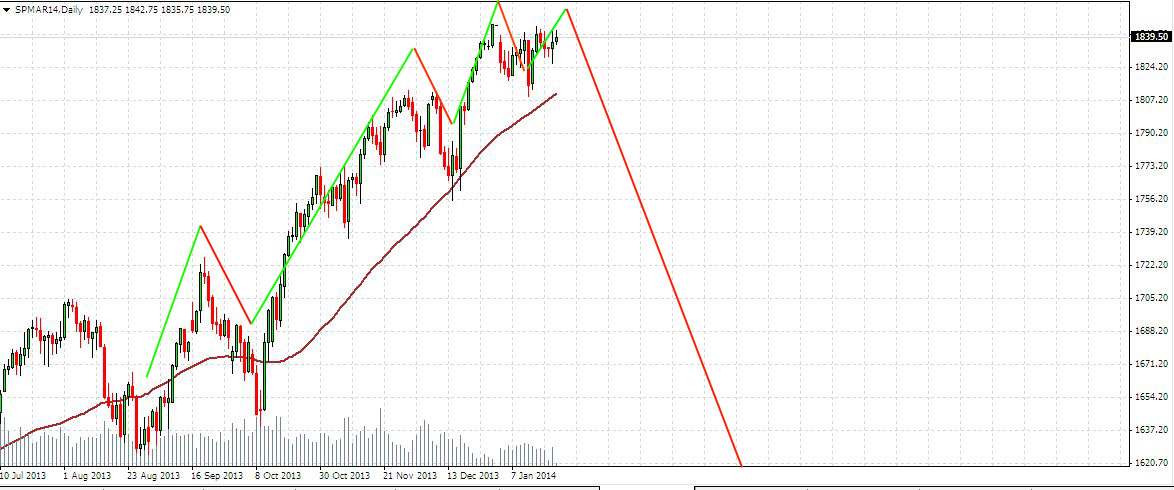
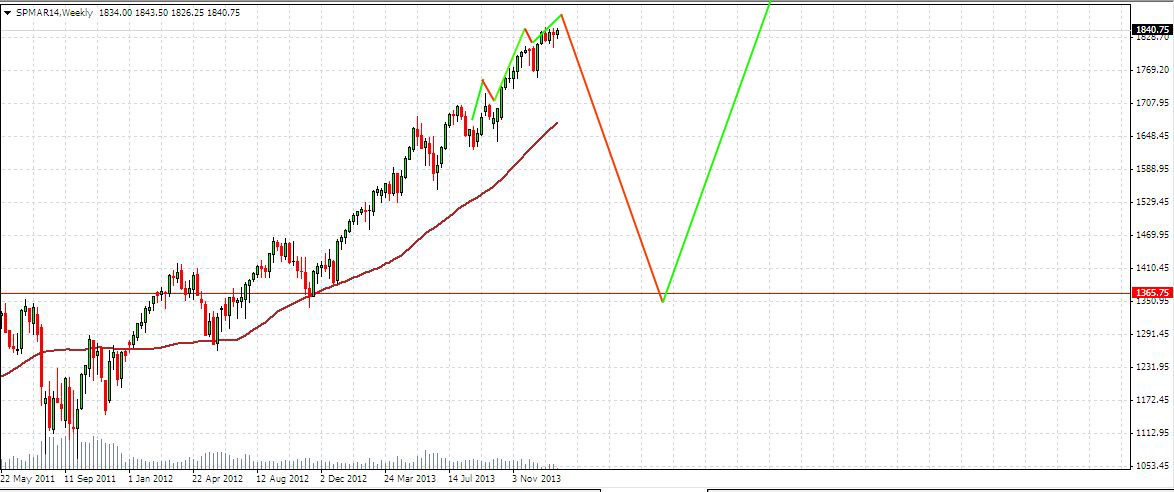
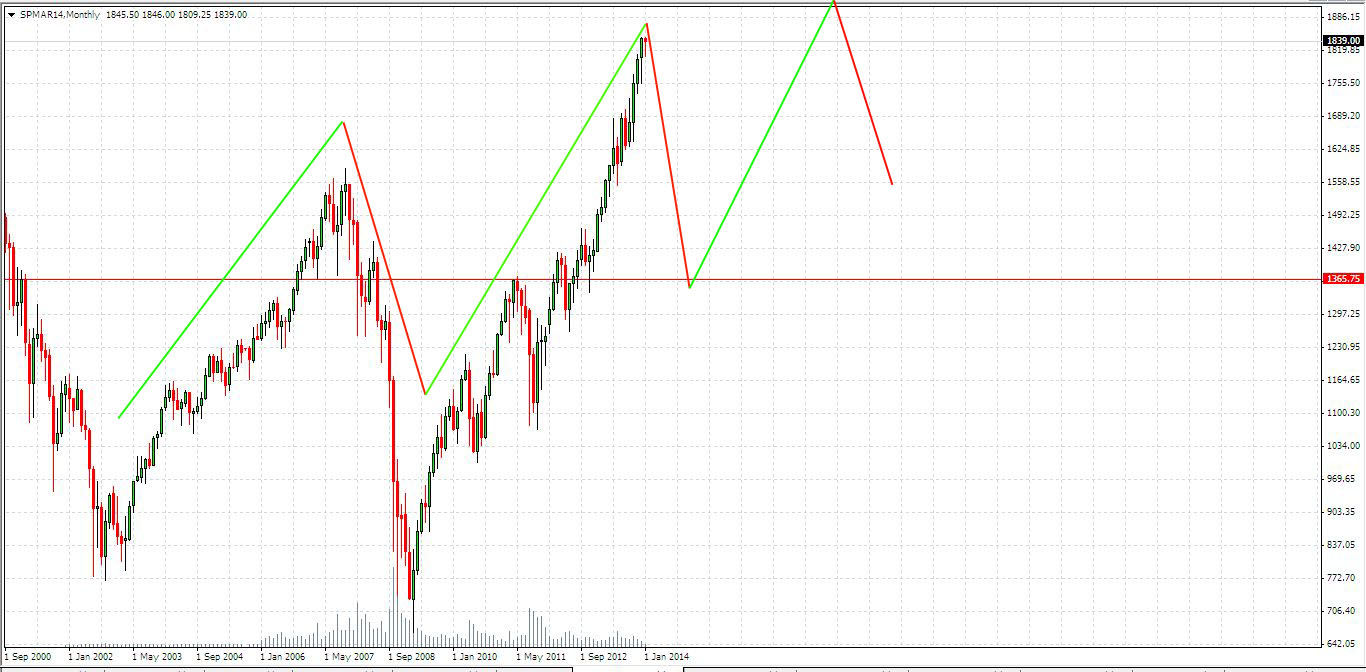
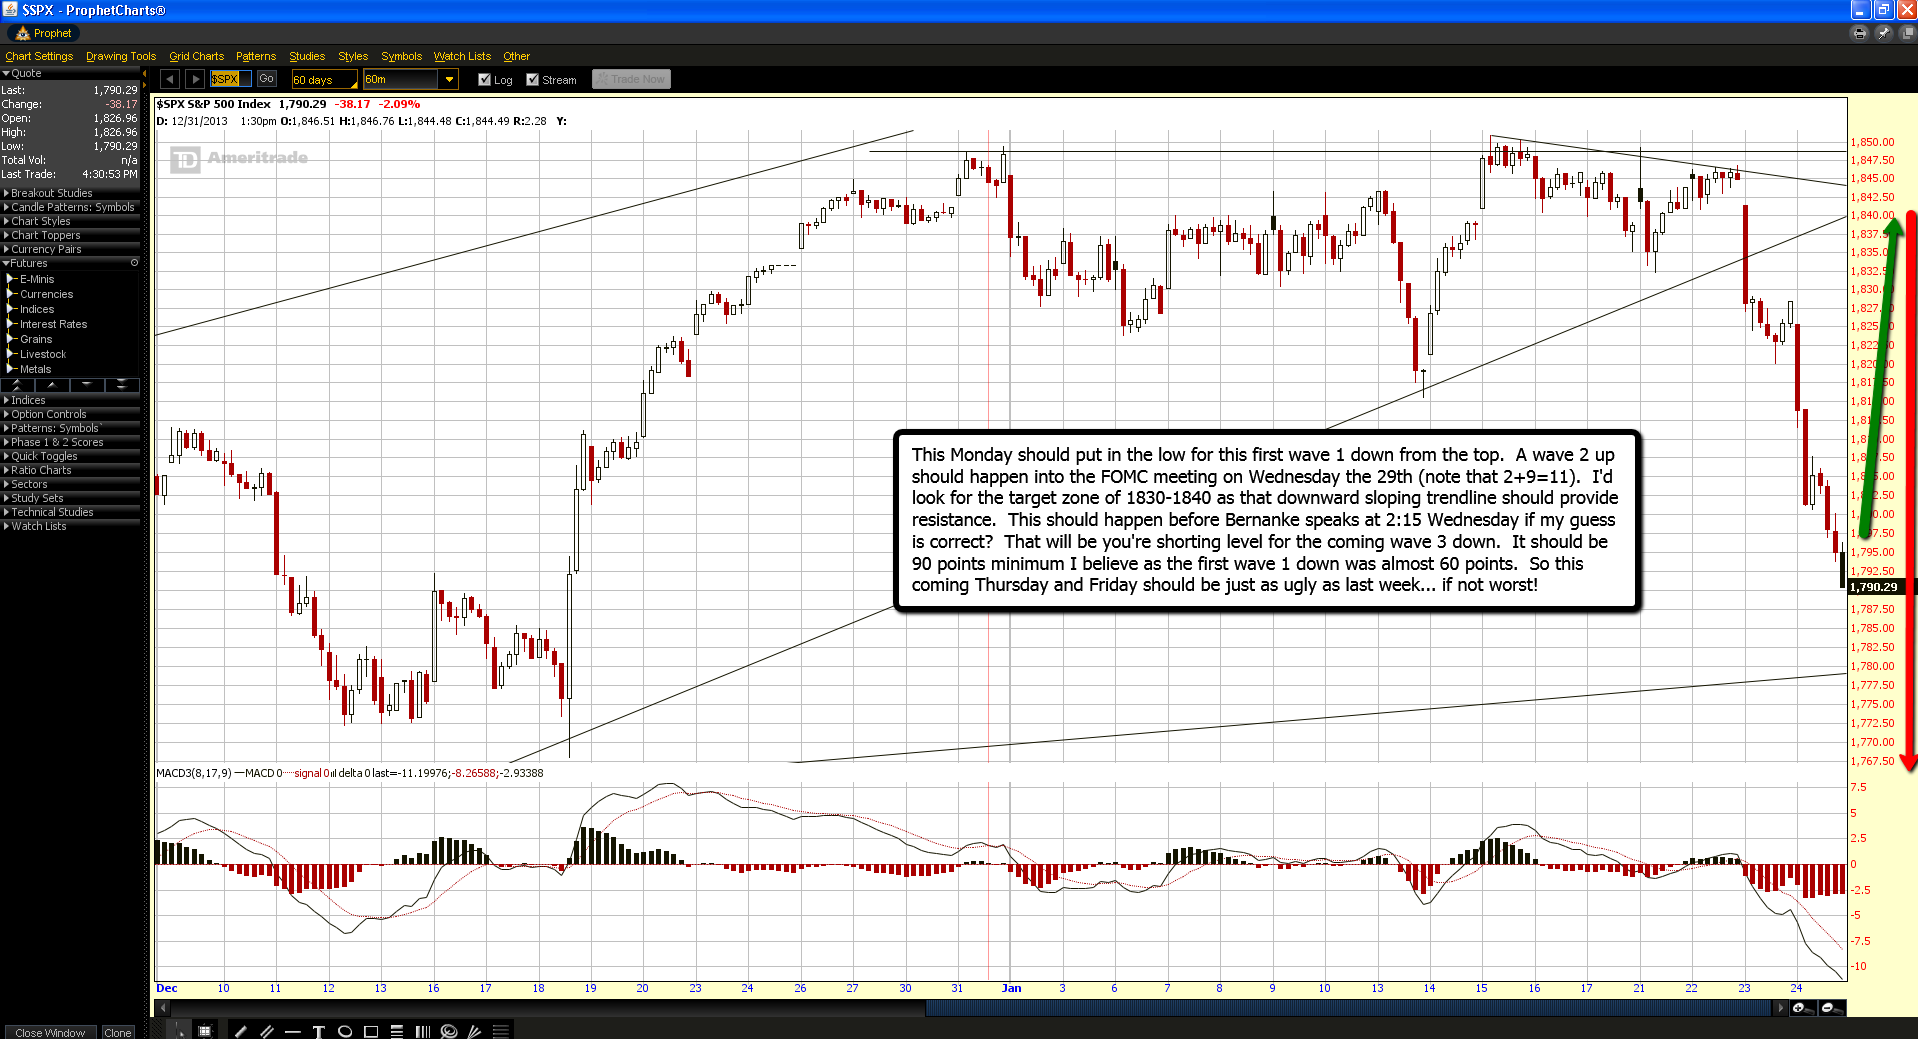


")
")


 Created With HAARP To Get Him Re-elected And Maybe Delay The Election")

