Saturday, October 24, 2026
Home Blog Page 55

ES Morning Update November 24th 2017

0

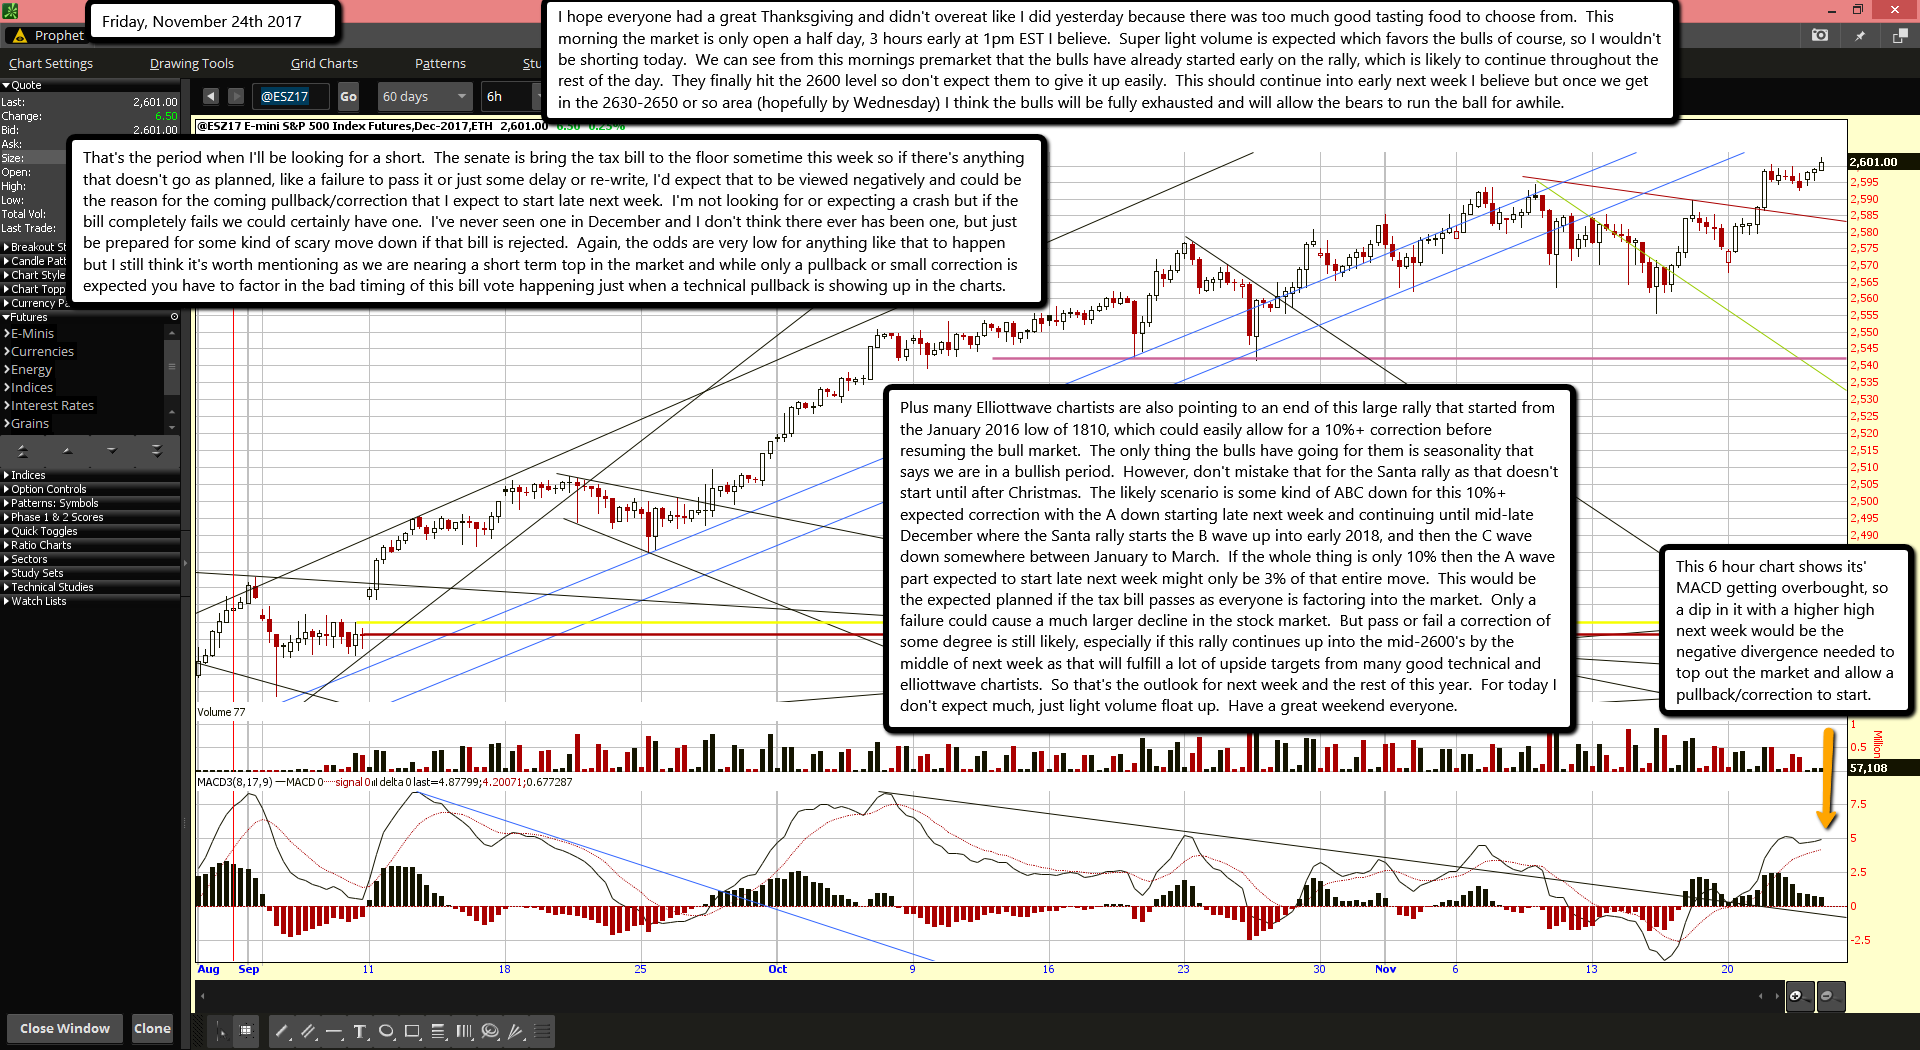
I hope everyone had a great Thanksgiving and didn't overeat like I did yesterday because there was too much good tasting food to choose from.  This morning the market is only open a half day, 3 hours early at 1pm EST I believe.  Super light volume is expected which favors the bulls of course, so I wouldn't be shorting today.  We can see from this mornings premarket that the bulls have already started early on the rally, which is likely to continue throughout the rest of the day.  They finally hit the 2600 level so don't expect them to give it up easily.  This should continue into early next week I believe but once we get in the 2630-2650 or so area (hopefully by Wednesday) I think the bulls will be fully exhausted and will allow the bears to run the ball for awhile.

That's the period when I'll be looking for a short.  The senate is bring the tax bill to the floor sometime this week so if there's anything that doesn't go as planned, like a failure to pass it or just some delay or re-write, I'd expect that to be viewed negatively and could be the reason for the coming pullback/correction that I expect to start late next week.  I'm not looking for or expecting a crash but if the bill completely fails we could certainly have one.  I've never seen one in December and I don't think there ever has been one, but just be prepared for some kind of scary move down if that bill is rejected.  Again, the odds are very low for anything like that to happen but I still think it's worth mentioning as we are nearing a short term top in the market and while only a pullback or small correction is expected you have to factor in the bad timing of this bill vote happening just when a technical pullback is showing up in the charts.

Plus many Elliottwave chartists are also pointing to an end of this large rally that started from the January 2016 low of 1810, which could easily allow for a 10%+ correction before resuming the bull market.  The only thing the bulls have going for them is seasonality that says we are in a bullish period.  However, don't mistake that for the Santa rally as that doesn't start until after Christmas.  The likely scenario is some kind of ABC down for this 10%+ expected correction with the A down starting late next week and continuing until mid-late December where the Santa rally starts the B wave up into early 2018, and then the C wave down somewhere between January to March.  If the whole thing is only 10% then the A wave part expected to start late next week might only be 3% of that entire move.  This would be the expected planned if the tax bill passes as everyone is factoring into the market.  Only a failure could cause a much larger decline in the stock market.  But pass or fail a correction of some degree is still likely, especially if this rally continues up into the mid-2600's by the middle of next week as that will fulfill a lot of upside targets from many good technical and elliottwave chartists.  So that's the outlook for next week and the rest of this year.  For today I don't expect much, just light volume float up.  Have a great weekend everyone.

ES Morning Update November 22nd 2017

0

Nothing much to say today gang.  Futures got very overbought yesterday and today they will likely trade sideways to work it off.  It's the day before Thanksgiving on top of that, so I really don't expect anything to happen.  I'd say take the day off and spend it with family.  I expect more of the same on Friday but the chart should be reset enough by then to continue this rally up.  Where it stops I don't know?  We'll have to take it day by day.  But next week I do think we'll see that top, and I'm estimating it to happen on Tuesday the 28th or Wednesday the 29th.  After that I see a move down starting and it should last into mid-December.  Anyway, for today I don't see anything but chop.  Have a great Thanksgiving tomorrow.

ES Morning Update November 21st 2017

0

Looks like the inverted head and shoulders is playing out this morning in the futures as the ES has pushed through the falling red trendline of resistance.  Next up will be a new all time high if the bulls can keep this momentum going, and of course the all important 2600 level.  The MACD made a lower high yesterday and appeared like it was going to rollover but the light volume of this holiday week must have taken over and turned it back up as it doesn't seem ready to quit yet.  It should still make a lower high then the previous +4.0 high, but I'm not sure where it will stop.

Time wise I don't think it can go more then one more day, if not later this day?  So, we could see a pullback start tomorrow but considering this is Thanksgiving week I seriously doubt if it would amount to much.  More likely it would be a sideways to slightly down day.  For today though I don't see much to do.  The move I was expecting yesterday has now happened but with the overbought 60 minute MACD the futures might not be able to push through overhead resistance today, so it's not something I want risk a long trade on.  I'm just in watch mode for today and will see how the close sets up.  There might be a short later today but again, I really don't see much of a move down tomorrow even if this short works.  Maybe Wednesday we'll get a good setup?

ES Morning Update November 20th 2017

0

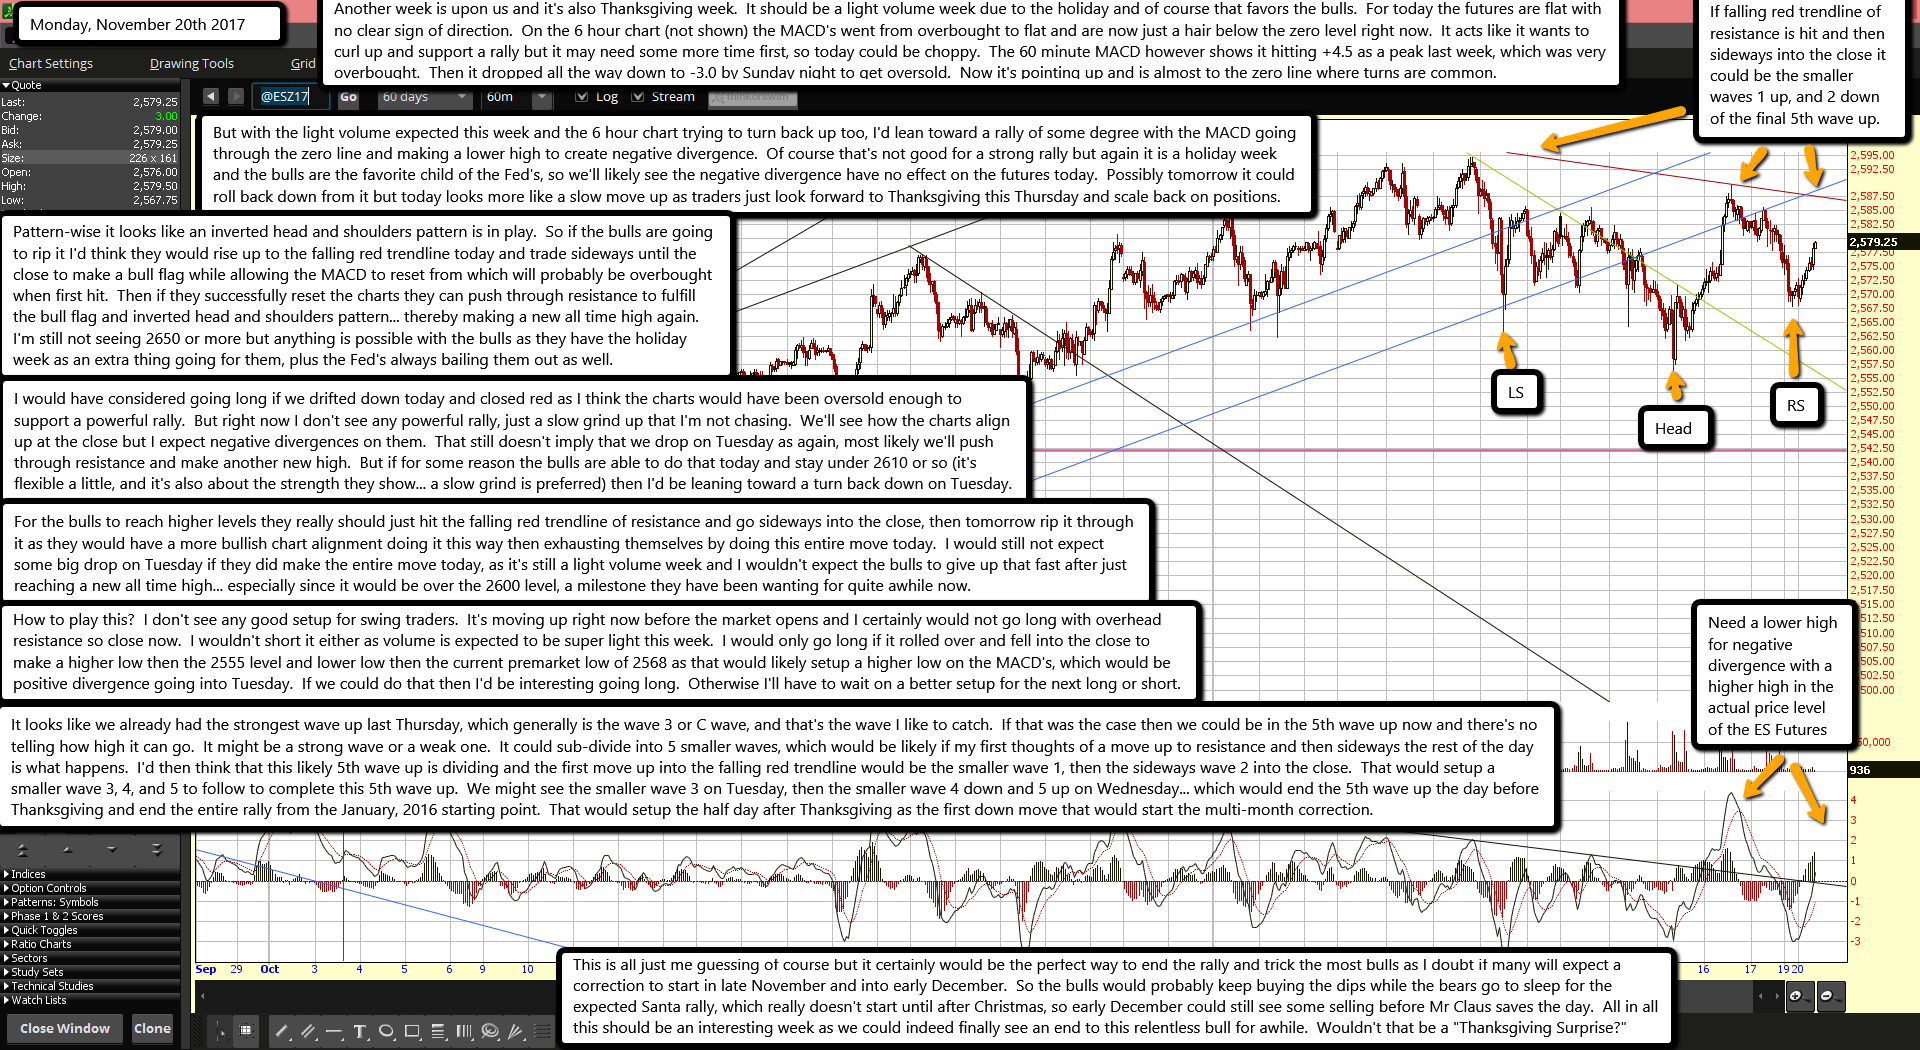
Another week is upon us and it's also Thanksgiving week.  It should be a light volume week due to the holiday and of course that favors the bulls.  For today the futures are flat with no clear sign of direction.  On the 6 hour chart (not shown) the MACD's went from overbought to flat and are now just a hair below the zero level right now.  It acts like it wants to curl up and support a rally but it may need some more time first, so today could be choppy.  The 60 minute MACD however shows it hitting +4.5 as a peak last week, which was very overbought.  Then it dropped all the way down to -3.0 by Sunday night to get oversold.  Now it's pointing up and is almost to the zero line where turns are common.

But with the light volume expected this week and the 6 hour chart trying to turn back up too, I'd lean toward a rally of some degree with the MACD going through the zero line and making a lower high to create negative divergence.  Of course that's not good for a strong rally but again it is a holiday week and the bulls are the favorite child of the Fed's, so we'll likely see the negative divergence have no effect on the futures today.  Possibly tomorrow it could roll back down from it but today looks more like a slow move up as traders just look forward to Thanksgiving this Thursday and scale back on positions.

Pattern-wise it looks like an inverted head and shoulders pattern is in play.  So if the bulls are going to rip it I'd think they would rise up to the falling red trendline today and trade sideways until the close to make a bull flag while allowing the MACD to reset from which will probably be overbought when first hit.  Then if they successfully reset the charts they can push through resistance to fulfill the bull flag and inverted head and shoulders pattern... thereby making a new all time high again.  I'm still not seeing 2650 or more but anything is possible with the bulls as they have the holiday week as an extra thing going for them, plus the Fed's always bailing them out as well.

I would have considered going long if we drifted down today and closed red as I think the charts would have been oversold enough to support a powerful rally.  But right now I don't see any powerful rally, just a slow grind up that I'm not chasing.  We'll see how the charts align up at the close but I expect negative divergences on them.  That still doesn't imply that we drop on Tuesday as again, most likely we'll push through resistance and make another new high.  But if for some reason the bulls are able to do that today and stay under 2610 or so (it's flexible a little, and it's also about the strength they show... a slow grind is preferred) then I'd be leaning toward a turn back down on Tuesday.

For the bulls to reach higher levels they really should just hit the falling red trendline of resistance and go sideways into the close, then tomorrow rip it through it as they would have a more bullish chart alignment doing it this way then exhausting themselves by doing this entire move today.  I would still not expect some big drop on Tuesday if they did make the entire move today, as it's still a light volume week and I wouldn't expect the bulls to give up that fast after just reaching a new all time high... especially since it would be over the 2600 level, a milestone they have been wanting for quite awhile now.

How to play this?  I don't see any good setup for swing traders.  It's moving up right now before the market opens and I certainly would not go long with overhead resistance so close now.  I wouldn't short it either as volume is expected to be super light this week.  I would only go long if it rolled over and fell into the close to make a higher low then the 2555 level and lower low then the current premarket low of 2568 as that would likely setup a higher low on the MACD's, which would be positive divergence going into Tuesday.  If we could do that then I'd be interesting going long.  Otherwise I'll have to wait on a better setup for the next long or short.

It looks like we already had the strongest wave up last Thursday, which generally is the wave 3 or C wave, and that's the wave I like to catch.  If that was the case then we could be in the 5th wave up now and there's no telling how high it can go.  It might be a strong wave or a weak one.  It could sub-divide into 5 smaller waves, which would be likely if my first thoughts of a move up to resistance and then sideways the rest of the day is what happens.  I'd then think that this likely 5th wave up is dividing and the first move up into the falling red trendline would be the smaller wave 1, then the sideways wave 2 into the close.  That would setup a smaller wave 3, 4, and 5 to follow to complete this 5th wave up.  We might see the smaller wave 3 on Tuesday, then the smaller wave 4 down and 5 up on Wednesday... which would end the 5th wave up the day before Thanksgiving and end the entire rally from the January, 2016 starting point.  That would setup the half day after Thanksgiving as the first down move that would start the multi-month correction.

This is all just me guessing of course but it certainly would be the perfect way to end the rally and trick the most bulls as I doubt if many will expect a correction to start in late November and into early December.  So the bulls would probably keep buying the dips while the bears go to sleep for the expected Santa rally, which really doesn't start until after Christmas, so early December could still see some selling before Mr Claus saves the day.  All in all this should be an interesting week as we could indeed finally see an end to this relentless bull for awhile.  Wouldn't that be a "Thanksgiving Surprise?"

ES Morning Update November 17th 2017

0

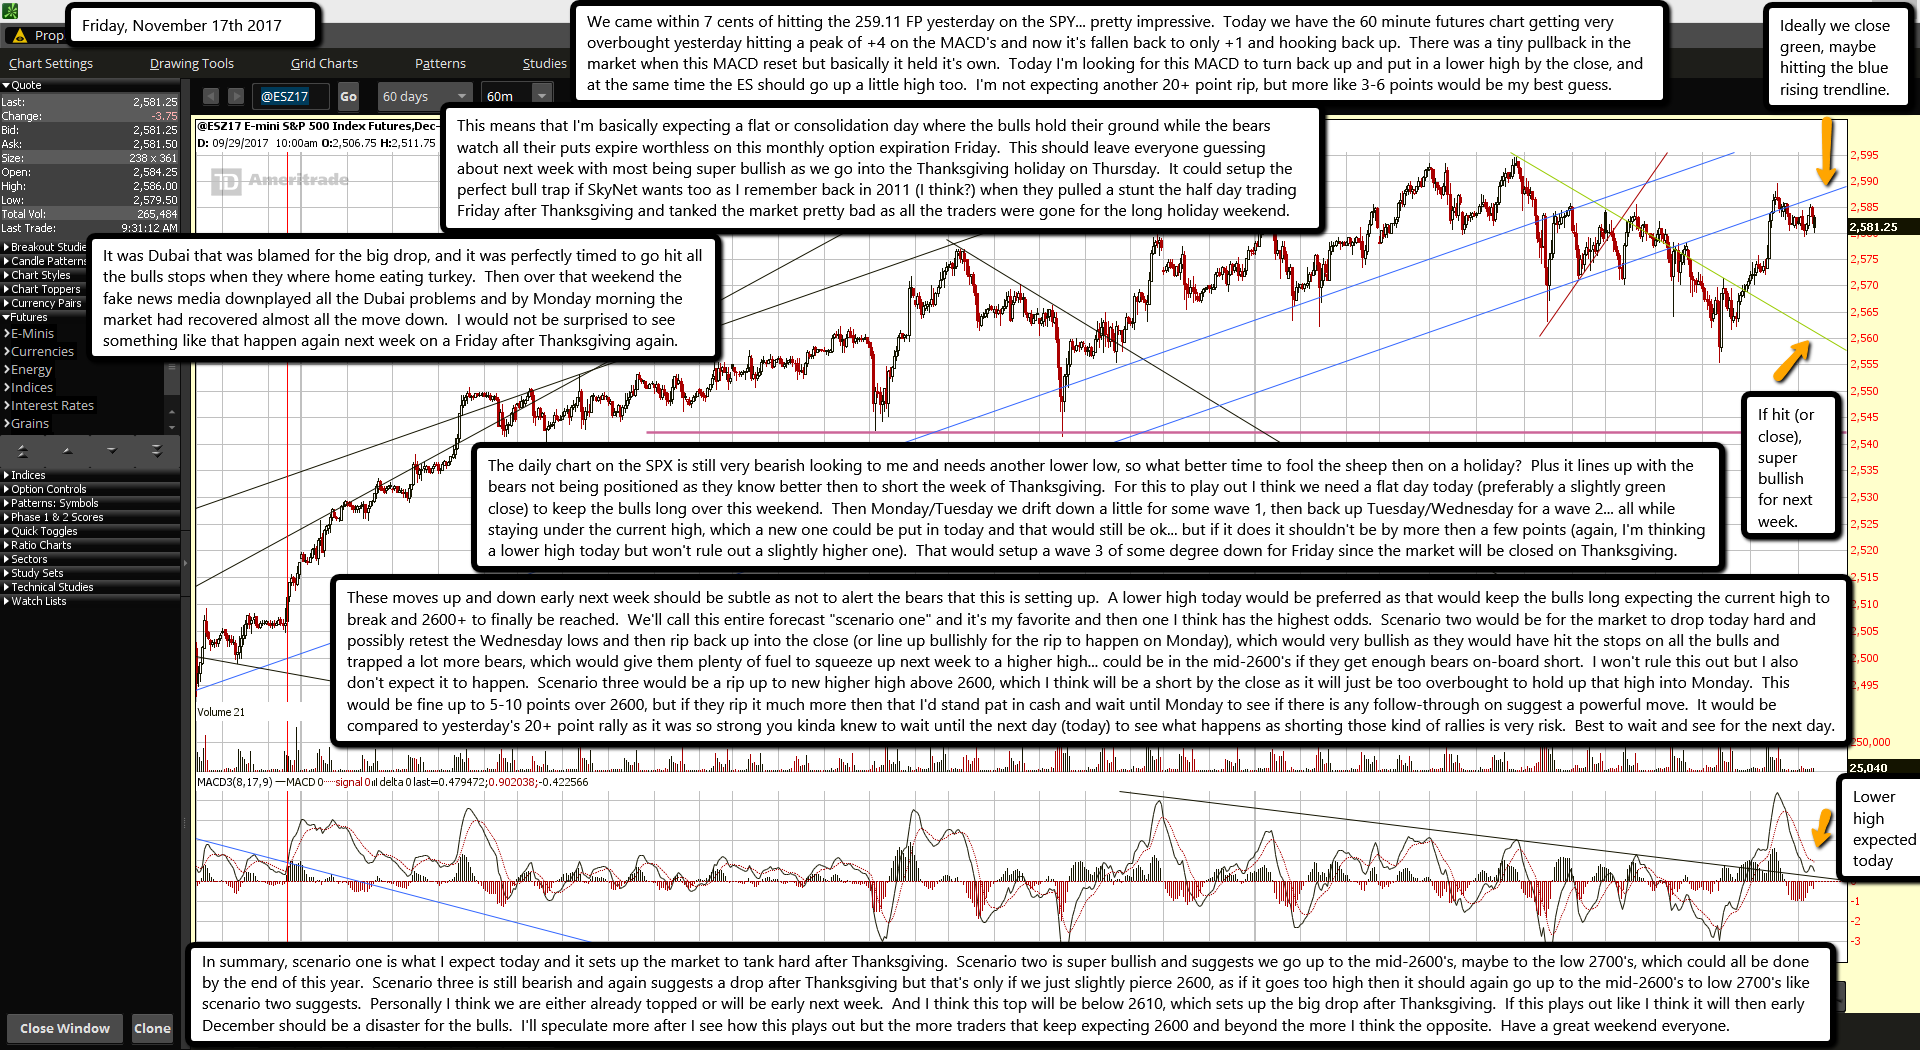
We came within 7 cents of hitting the 259.11 FP yesterday on the SPY... pretty impressive.  Today we have the 60 minute futures chart getting very overbought yesterday hitting a peak of +4 on the MACD's and now it's fallen back to only +1 and hooking back up.  There was a tiny pullback in the market when this MACD reset but basically it held it's own.  Today I'm looking for this MACD to turn back up and put in a lower high by the close, and at the same time the ES should go up a little high too.  I'm not expecting another 20+ point rip, but more like 3-6 points would be my best guess.

This means that I'm basically expecting a flat or consolidation day where the bulls hold their ground while the bears watch all their puts expire worthless on this monthly option expiration Friday.  This should leave everyone guessing about next week with most being super bullish as we go into the Thanksgiving holiday on Thursday.  It could setup the perfect bull trap if SkyNet wants too as I remember back in 2011 (I think?) when they pulled a stunt the half day trading Friday after Thanksgiving and tanked the market pretty bad as all the traders were gone for the long holiday weekend.

It was Dubai that was blamed for the big drop, and it was perfectly timed to go hit all the bulls stops when they where home eating turkey.  Then over that weekend the fake news media downplayed all the Dubai problems and by Monday morning the market had recovered almost all the move down.  I would not be surprised to see something like that happen again next week on a Friday after Thanksgiving again.

The daily chart on the SPX is still very bearish looking to me and needs another lower low, so what better time to fool the sheep then on a holiday?  Plus it lines up with the bears not being positioned as they know better then to short the week of Thanksgiving.  For this to play out I think we need a flat day today (preferably a slightly green close) to keep the bulls long over this weekend.  Then Monday/Tuesday we drift down a little for some wave 1, then back up Tuesday/Wednesday for a wave 2... all while staying under the current high, which a new one could be put in today and that would still be ok... but if it does it shouldn't be by more then a few points (again, I'm thinking a lower high today but won't rule out a slightly higher one).  That would setup a wave 3 of some degree down for Friday since the market will be closed on Thanksgiving.

These moves up and down early next week should be subtle as not to alert the bears that this is setting up.  A lower high today would be preferred as that would keep the bulls long expecting the current high to break and 2600+ to finally be reached.  We'll call this entire forecast "scenario one" and it's my favorite and then one I think has the highest odds.  Scenario two would be for the market to drop today hard and possibly retest the Wednesday lows and then rip back up into the close (or line up bullishly for the rip to happen on Monday), which would very bullish as they would have hit the stops on all the bulls and trapped a lot more bears, which would give them plenty of fuel to squeeze up next week to a higher high... could be in the mid-2600's if they get enough bears on-board short.  I won't rule this out but I also don't expect it to happen.  Scenario three would be a rip up to new higher high above 2600, which I think will be a short by the close as it will just be too overbought to hold up that high into Monday.  This would be fine up to 5-10 points over 2600, but if they rip it much more then that I'd stand pat in cash and wait until Monday to see if there is any follow-through on suggest a powerful move.  It would be compared to yesterday's 20+ point rally as it was so strong you kinda knew to wait until the next day (today) to see what happens as shorting those kind of rallies is very risk.  Best to wait and see for the next day.

In summary, scenario one is what I expect today and it sets up the market to tank hard after Thanksgiving.  Scenario two is super bullish and suggests we go up to the mid-2600's, maybe to the low 2700's, which could all be done by the end of this year.  Scenario three is still bearish and again suggests a drop after Thanksgiving but that's only if we just slightly pierce 2600, as if it goes too high then it should again go up to the mid-2600's to low 2700's like scenario two suggests.  Personally I think we are either already topped or will be early next week.  And I think this top will be below 2610, which sets up the big drop after Thanksgiving.  If this plays out like I think it will then early December should be a disaster for the bulls.  I'll speculate more after I see how this plays out but the more traders that keep expecting 2600 and beyond the more I think the opposite.  Have a great weekend everyone.

ES Morning Update November 16th 2017

0

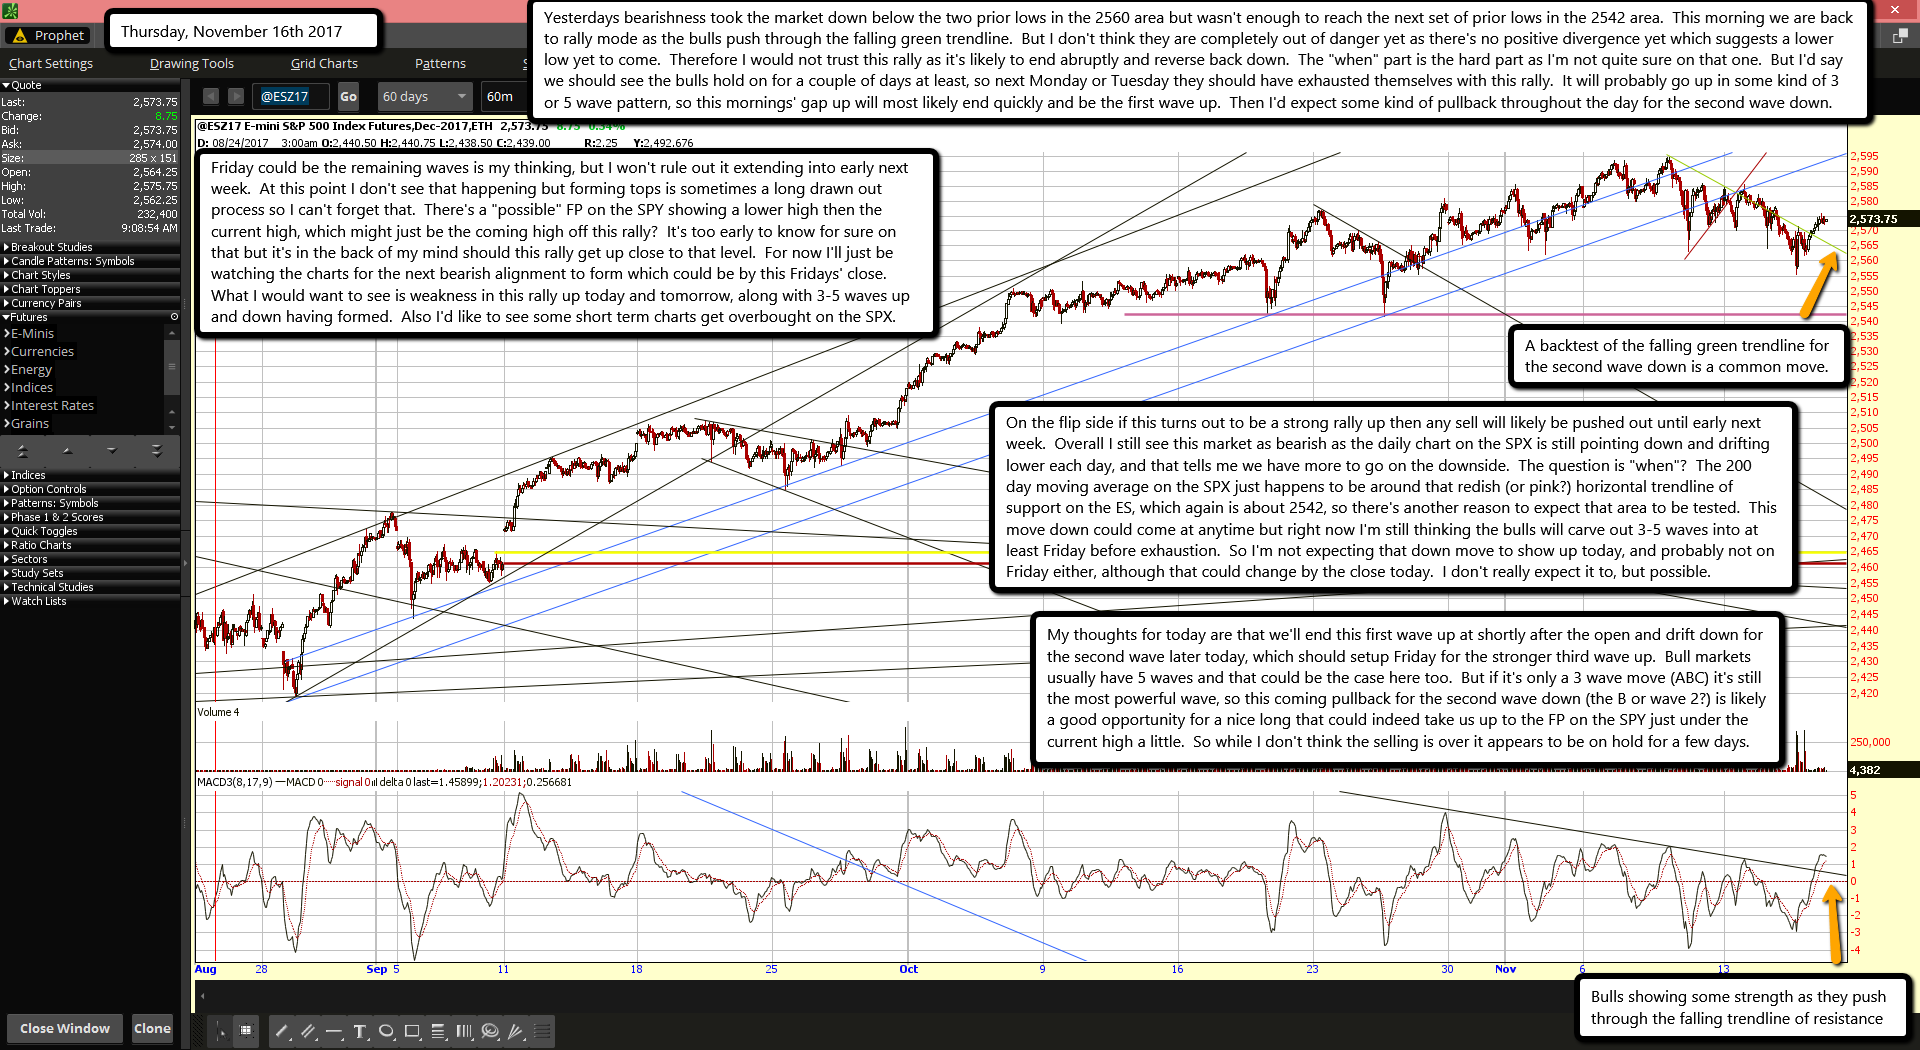
Yesterdays bearishness took the market down below the two prior lows in the 2560 area but wasn't enough to reach the next set of prior lows in the 2542 area.  This morning we are back to rally mode as the bulls push through the falling green trendline.  But I don't think they are completely out of danger yet as there's no positive divergence yet which suggests a lower low yet to come.  Therefore I would not trust this rally as it's likely to end abruptly and reverse back down.  The "when" part is the hard part as I'm not quite sure on that one.  But I'd say we should see the bulls hold on for a couple of days at least, so next Monday or Tuesday they should have exhausted themselves with this rally.  It will probably go up in some kind of 3 or 5 wave pattern, so this mornings' gap up will most likely end quickly and be the first wave up.  Then I'd expect some kind of pullback throughout the day for the second wave down.

Friday could be the remaining waves is my thinking, but I won't rule out it extending into early next week.  At this point I don't see that happening but forming tops is sometimes a long drawn out process so I can't forget that.  There's a "possible" FP on the SPY showing a lower high then the current high, which might just be the coming high off this rally?  It's too early to know for sure on that but it's in the back of my mind should this rally get up close to that level.  For now I'll just be watching the charts for the next bearish alignment to form which could be by this Fridays' close.  What I would want to see is weakness in this rally up today and tomorrow, along with 3-5 waves up and down having formed.  Also I'd like to see some short term charts get overbought on the SPX.

On the flip side if this turns out to be a strong rally up then any sell will likely be pushed out until early next week.  Overall I still see this market as bearish as the daily chart on the SPX is still pointing down and drifting lower each day, and that tells me we have more to go on the downside.  The question is "when"?  The 200 day moving average on the SPX just happens to be around that redish (or pink?) horizontal trendline of support on the ES, which again is about 2542, so there's another reason to expect that area to be tested.  This move down could come at anytime but right now I'm still thinking the bulls will carve out 3-5 waves into at least Friday before exhaustion.  So I'm not expecting that down move to show up today, and probably not on Friday either, although that could change by the close today.  I don't really expect it to, but possible.

My thoughts for today are that we'll end this first wave up at shortly after the open and drift down for the second wave later today, which should setup Friday for the stronger third wave up.  Bull markets usually have 5 waves and that could be the case here too.  But if it's only a 3 wave move (ABC) it's still the most powerful wave, so this coming pullback for the second wave down (the B or wave 2?) is likely a good opportunity for a nice long that could indeed take us up to the FP on the SPY just under the current high a little.  So while I don't think the selling is over it appears to be on hold for a few days.

ES Morning Update November 15th 2017

0

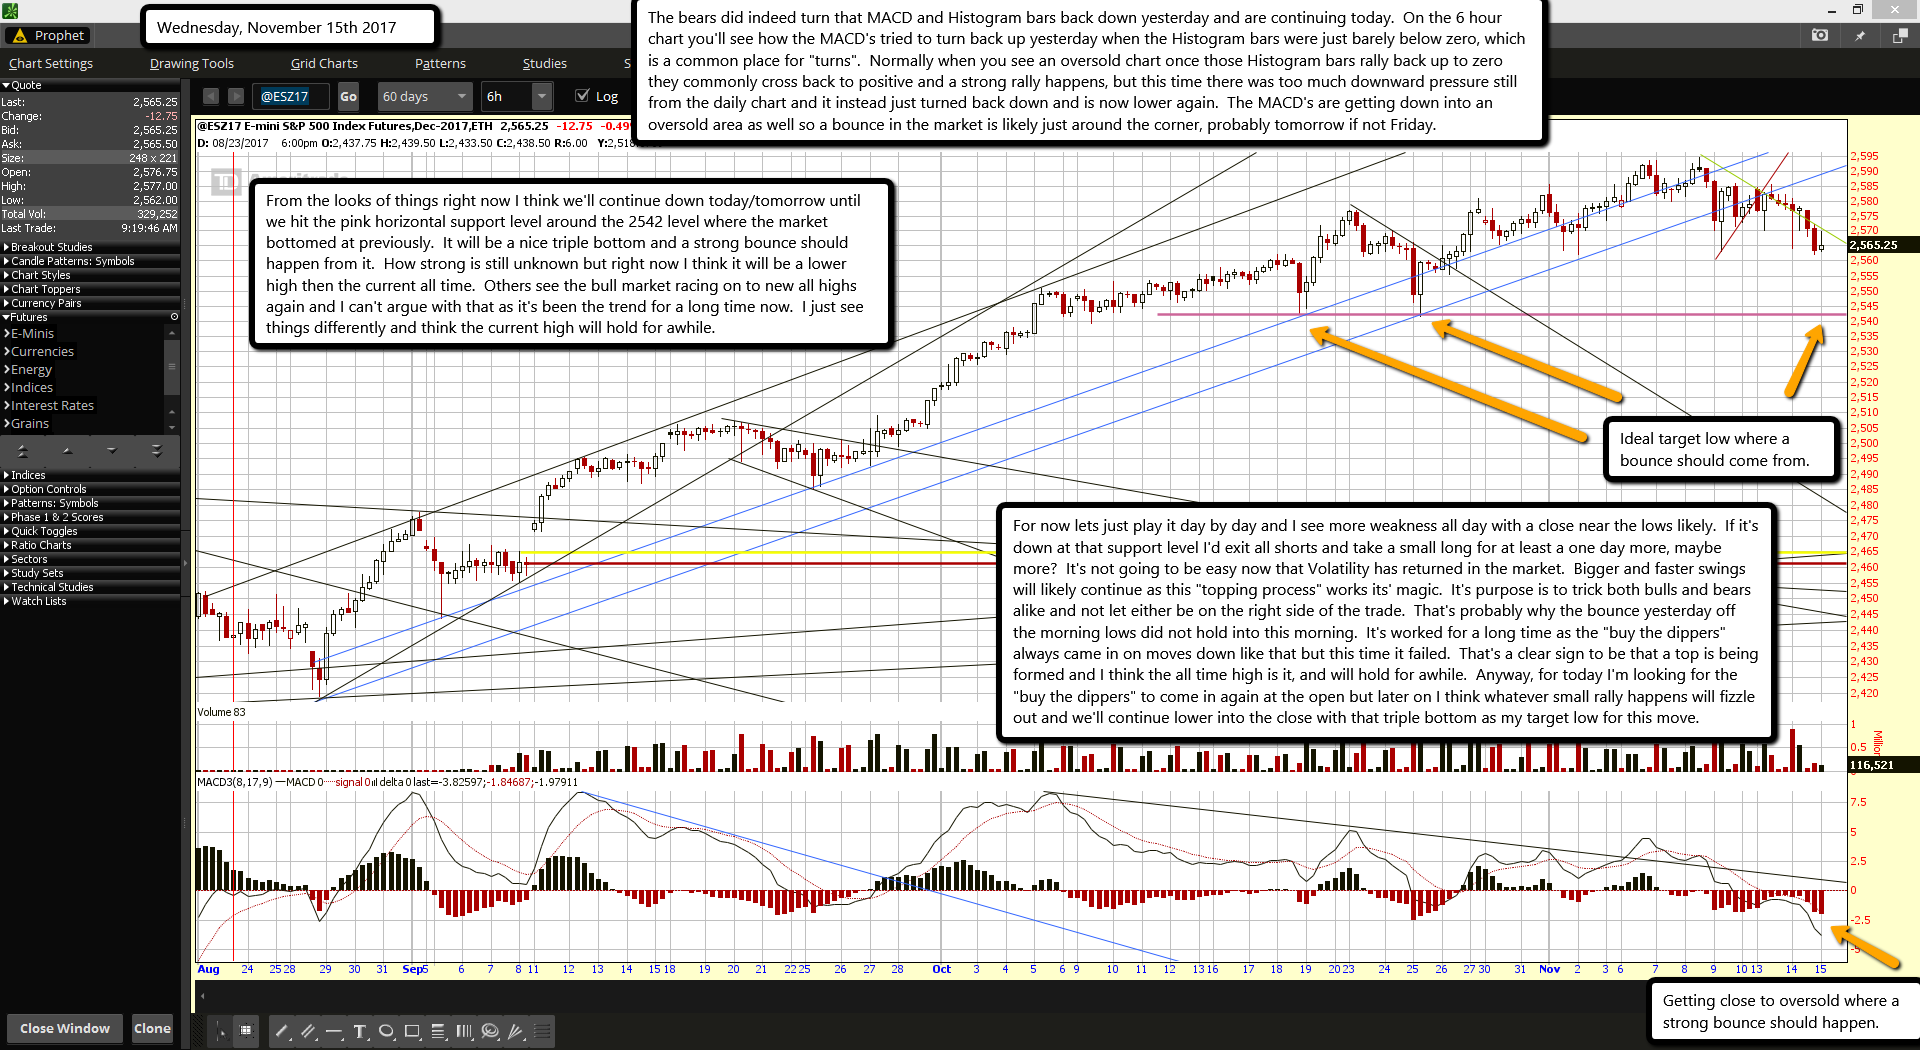
The bears did indeed turn that MACD and Histogram bars back down yesterday and are continuing today.  On the 6 hour chart you'll see how the MACD's tried to turn back up yesterday when the Histogram bars were just barely below zero, which is a common place for "turns".  Normally when you see an oversold chart once those Histogram bars rally back up to zero they commonly cross back to positive and a strong rally happens, but this time there was too much downward pressure still from the daily chart and it instead just turned back down and is now lower again.  The MACD's are getting down into an oversold area as well so a bounce in the market is likely just around the corner, probably tomorrow if not Friday.

From the looks of things right now I think we'll continue down today/tomorrow until we hit the pink horizontal support level around the 2542 level where the market bottomed at previously.  It will be a nice triple bottom and a strong bounce should happen from it.  How strong is still unknown but right now I think it will be a lower high then the current all time.  Others see the bull market racing on to new all highs again and I can't argue with that as it's been the trend for a long time now.  I just see things differently and think the current high will hold for awhile.

For now lets just play it day by day and I see more weakness all day with a close near the lows likely.  If it's down at that support level I'd exit all shorts and take a small long for at least a one day more, maybe more?  It's not going to be easy now that Volatility has returned in the market.  Bigger and faster swings will likely continue as this "topping process" works its' magic.  It's purpose is to trick both bulls and bears alike and not let either be on the right side of the trade.  That's probably why the bounce yesterday off the morning lows did not hold into this morning.  It's worked for a long time as the "buy the dippers" always came in on moves down like that but this time it failed.  That's a clear sign to be that a top is being formed and I think the all time high is it, and will hold for awhile.  Anyway, for today I'm looking for the "buy the dippers" to come in again at the open but later on I think whatever small rally happens will fizzle out and we'll continue lower into the close with that triple bottom as my target low for this move.

ES Morning Update November 14th 2017

0

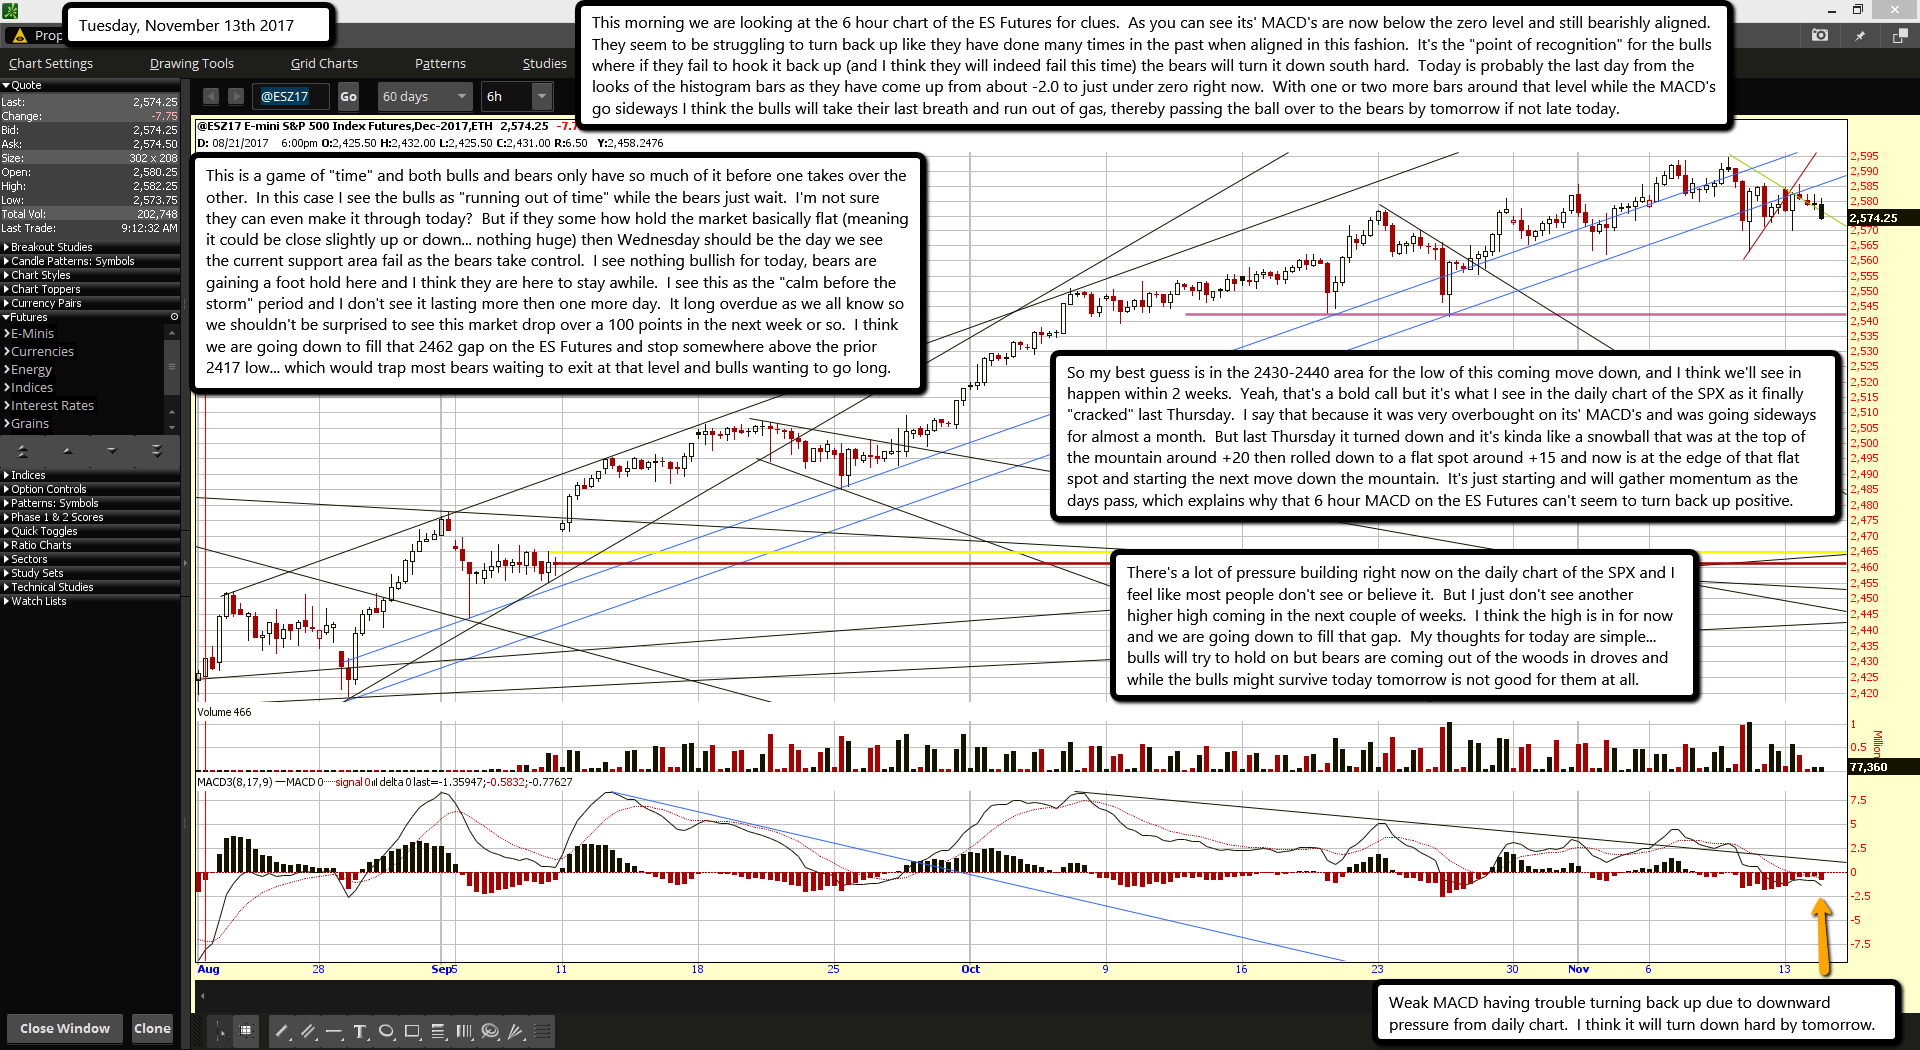
This morning we are looking at the 6 hour chart of the ES Futures for clues.  As you can see its' MACD's are now below the zero level and still bearishly aligned.  They seem to be struggling to turn back up like they have done many times in the past when aligned in this fashion.  It's the "point of recognition" for the bulls where if they fail to hook it back up (and I think they will indeed fail this time) the bears will turn it down south hard.  Today is probably the last day from the looks of the histogram bars as they have come up from about -2.0 to just under zero right now.  With one or two more bars around that level while the MACD's go sideways I think the bulls will take their last breath and run out of gas, thereby passing the ball over to the bears by tomorrow if not late today.

This is a game of "time" and both bulls and bears only have so much of it before one takes over the other.  In this case I see the bulls as "running out of time" while the bears just wait.  I'm not sure they can even make it through today?  But if they some how hold the market basically flat (meaning it could be close slightly up or down... nothing huge) then Wednesday should be the day we see the current support area fail as the bears take control.  I see nothing bullish for today, bears are gaining a foot hold here and I think they are here to stay awhile.  I see this as the "calm before the storm" period and I don't see it lasting more then one more day.  It long overdue as we all know so we shouldn't be surprised to see this market drop over a 100 points in the next week or so.  I think we are going down to fill that 2462 gap on the ES Futures and stop somewhere above the prior 2417 low... which would trap most bears waiting to exit at that level and bulls wanting to go long.

So my best guess is in the 2430-2440 area for the low of this coming move down, and I think we'll see in happen within 2 weeks.  Yeah, that's a bold call but it's what I see in the daily chart of the SPX as it finally "cracked" last Thursday.  I say that because it was very overbought on its' MACD's and was going sideways for almost a month.  But last Thursday it turned down and it's kinda like a snowball that was at the top of the mountain around +20 then rolled down to a flat spot around +15 and now is at the edge of that flat spot and starting the next move down the mountain.  It's just starting and will gather momentum as the days pass, which explains why that 6 hour MACD on the ES Futures can't seem to turn back up positive.

There's a lot of pressure building right now on the daily chart of the SPX and I feel like most people don't see or believe it.  But I just don't see another higher high coming in the next couple of weeks.  I think the high is in for now and we are going down to fill that gap.  My thoughts for today are simple... bulls will try to hold on but bears are coming out of the woods in droves and while the bulls might survive today tomorrow is not good for them at all.

ES Morning Update November 13th 2017

0

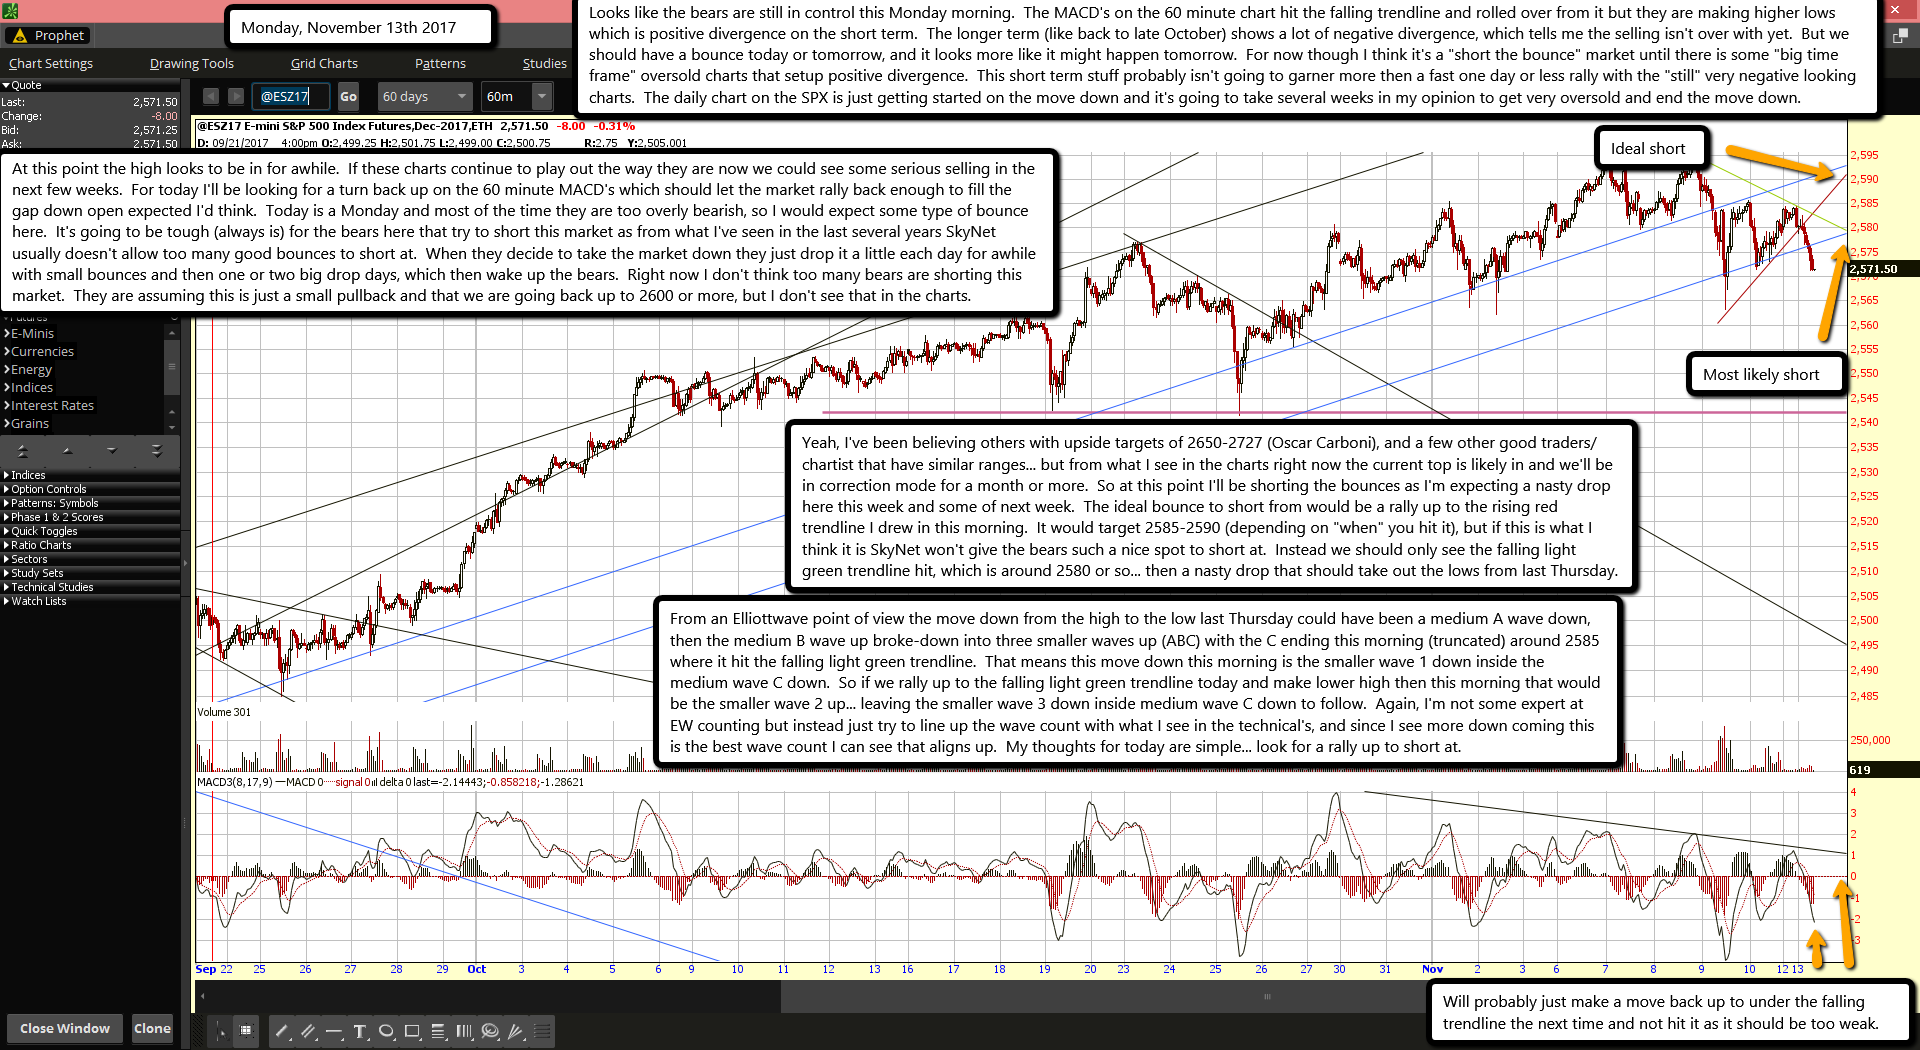
Looks like the bears are still in control this Monday morning.  The MACD's on the 60 minute chart hit the falling trendline and rolled over from it but they are making higher lows which is positive divergence on the short term.  The longer term (like back to late October) shows a lot of negative divergence, which tells me the selling isn't over with yet.  But we should have a bounce today or tomorrow, and it looks more like it might happen tomorrow.  For now though I think it's a "short the bounce" market until there is some "big time frame" oversold charts that setup positive divergence.  This short term stuff probably isn't going to garner more then a fast one day or less rally with the "still" very negative looking charts.  The daily chart on the SPX is just getting started on the move down and it's going to take several weeks in my opinion to get very oversold and end the move down.

At this point the high looks to be in for awhile.  If these charts continue to play out the way they are now we could see some serious selling in the next few weeks.  For today I'll be looking for a turn back up on the 60 minute MACD's which should let the market rally back enough to fill the gap down open expected I'd think.  Today is a Monday and most of the time they are too overly bearish, so I would expect some type of bounce here.  It's going to be tough (always is) for the bears here that try to short this market as from what I've seen in the last several years SkyNet usually doesn't allow too many good bounces to short at.  When they decide to take the market down they just drop it a little each day for awhile with small bounces and then one or two big drop days, which then wake up the bears.  Right now I don't think too many bears are shorting this market.  They are assuming this is just a small pullback and that we are going back up to 2600 or more, but I don't see that in the charts.

Yeah, I've been believing others with upside targets of 2650-2727 (Oscar Carboni), and a few other good traders/chartist that have similar ranges... but from what I see in the charts right now the current top is likely in and we'll be in correction mode for a month or more.  So at this point I'll be shorting the bounces as I'm expecting a nasty drop here this week and some of next week.  The ideal bounce to short from would be a rally up to the rising red trendline I drew in this morning.  It would target 2585-2590 (depending on "when" you hit it), but if this is what I think it is SkyNet won't give the bears such a nice spot to short at.  Instead we should only see the falling light green trendline hit, which is around 2580 or so... then a nasty drop that should take out the lows from last Thursday.

From an Elliottwave point of view the move down from the high to the low last Thursday could have been a medium A wave down, then the medium B wave up broke-down into three smaller waves up (ABC) with the C ending this morning (truncated) around 2585 where it hit the falling light green trendline.  That means this move down this morning is the smaller wave 1 down inside the medium wave C down.  So if we rally up to the falling light green trendline today and make lower high then this morning that would be the smaller wave 2 up... leaving the smaller wave 3 down inside medium wave C down to follow.  Again, I'm not some expert at EW counting but instead just try to line up the wave count with what I see in the technical's, and since I see more down coming this is the best wave count I can see that aligns up.  My thoughts for today are simple... look for a rally up to short at.

ES Morning Update November 10th 2017

0

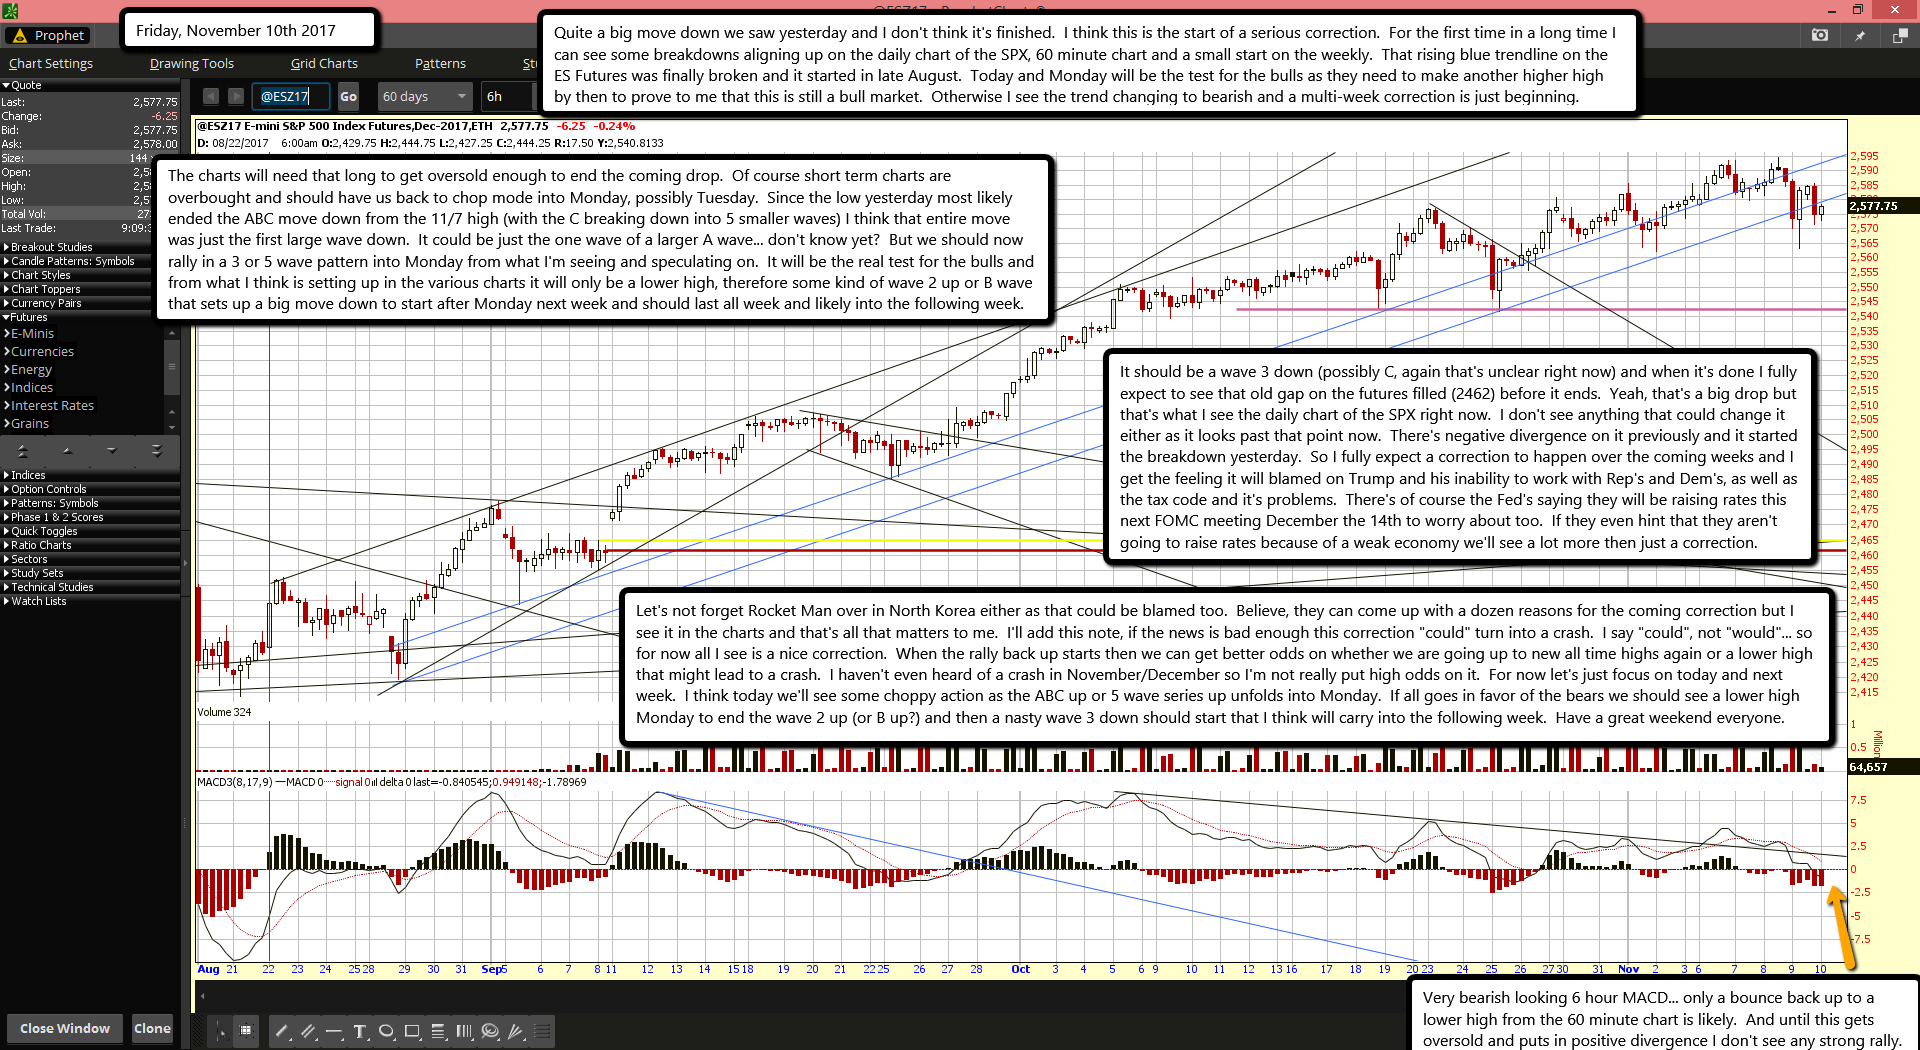
Quite a big move down we saw yesterday and I don't think it's finished.  I think this is the start of a serious correction.  For the first time in a long time I can see some breakdowns aligning up on the daily chart of the SPX, 60 minute chart and a small start on the weekly.  That rising blue trendline on the ES Futures was finally broken and it started in late August.  Today and Monday will be the test for the bulls as they need to make another higher high by then to prove to me that this is still a bull market.  Otherwise I see the trend changing to bearish and a multi-week correction is just beginning.

The charts will need that long to get oversold enough to end the coming drop.  Of course short term charts are overbought and should have us back to chop mode into Monday, possibly Tuesday.  Since the low yesterday most likely ended the ABC move down from the 11/7 high (with the C breaking down into 5 smaller waves) I think that entire move was just the first large wave down.  It could be just the one wave of a larger A wave... don't know yet?  But we should now rally in a 3 or 5 wave pattern into Monday from what I'm seeing and speculating on.  It will be the real test for the bulls and from what I think is setting up in the various charts it will only be a lower high, therefore some kind of wave 2 up or B wave that sets up a big move down to start after Monday next week and should last all week and likely into the following week.

It should be a wave 3 down (possibly C, again that's unclear right now) and when it's done I fully expect to see that old gap on the futures filled (2462) before it ends.  Yeah, that's a big drop but that's what I see the daily chart of the SPX right now.  I don't see anything that could change it either as it looks past that point now.  There's negative divergence on it previously and it started the breakdown yesterday.  So I fully expect a correction to happen over the coming weeks and I get the feeling it will blamed on Trump and his inability to work with Rep's and Dem's, as well as the tax code and it's problems.  There's of course the Fed's saying they will be raising rates this next FOMC meeting December the 14th to worry about too.  If they even hint that they aren't going to raise rates because of a weak economy we'll see a lot more then just a correction.

Let's not forget Rocket Man over in North Korea either as that could be blamed too.  Believe, they can come up with a dozen reasons for the coming correction but I see it in the charts and that's all that matters to me.  I'll add this note, if the news is bad enough this correction "could" turn into a crash.  I say "could", not "would"... so for now all I see is a nice correction.  When the rally back up starts then we can get better odds on whether we are going up to new all time highs again or a lower high that might lead to a crash.  I haven't even heard of a crash in November/December so I'm not really put high odds on it.  For now let's just focus on today and next week.  I think today we'll see some choppy action as the ABC up or 5 wave series up unfolds into Monday.  If all goes in favor of the bears we should see a lower high Monday to end the wave 2 up (or B up?) and then a nasty wave 3 down should start that I think will carry into the following week.  Have a great weekend everyone.

ES Morning Update November 9th 2017

0

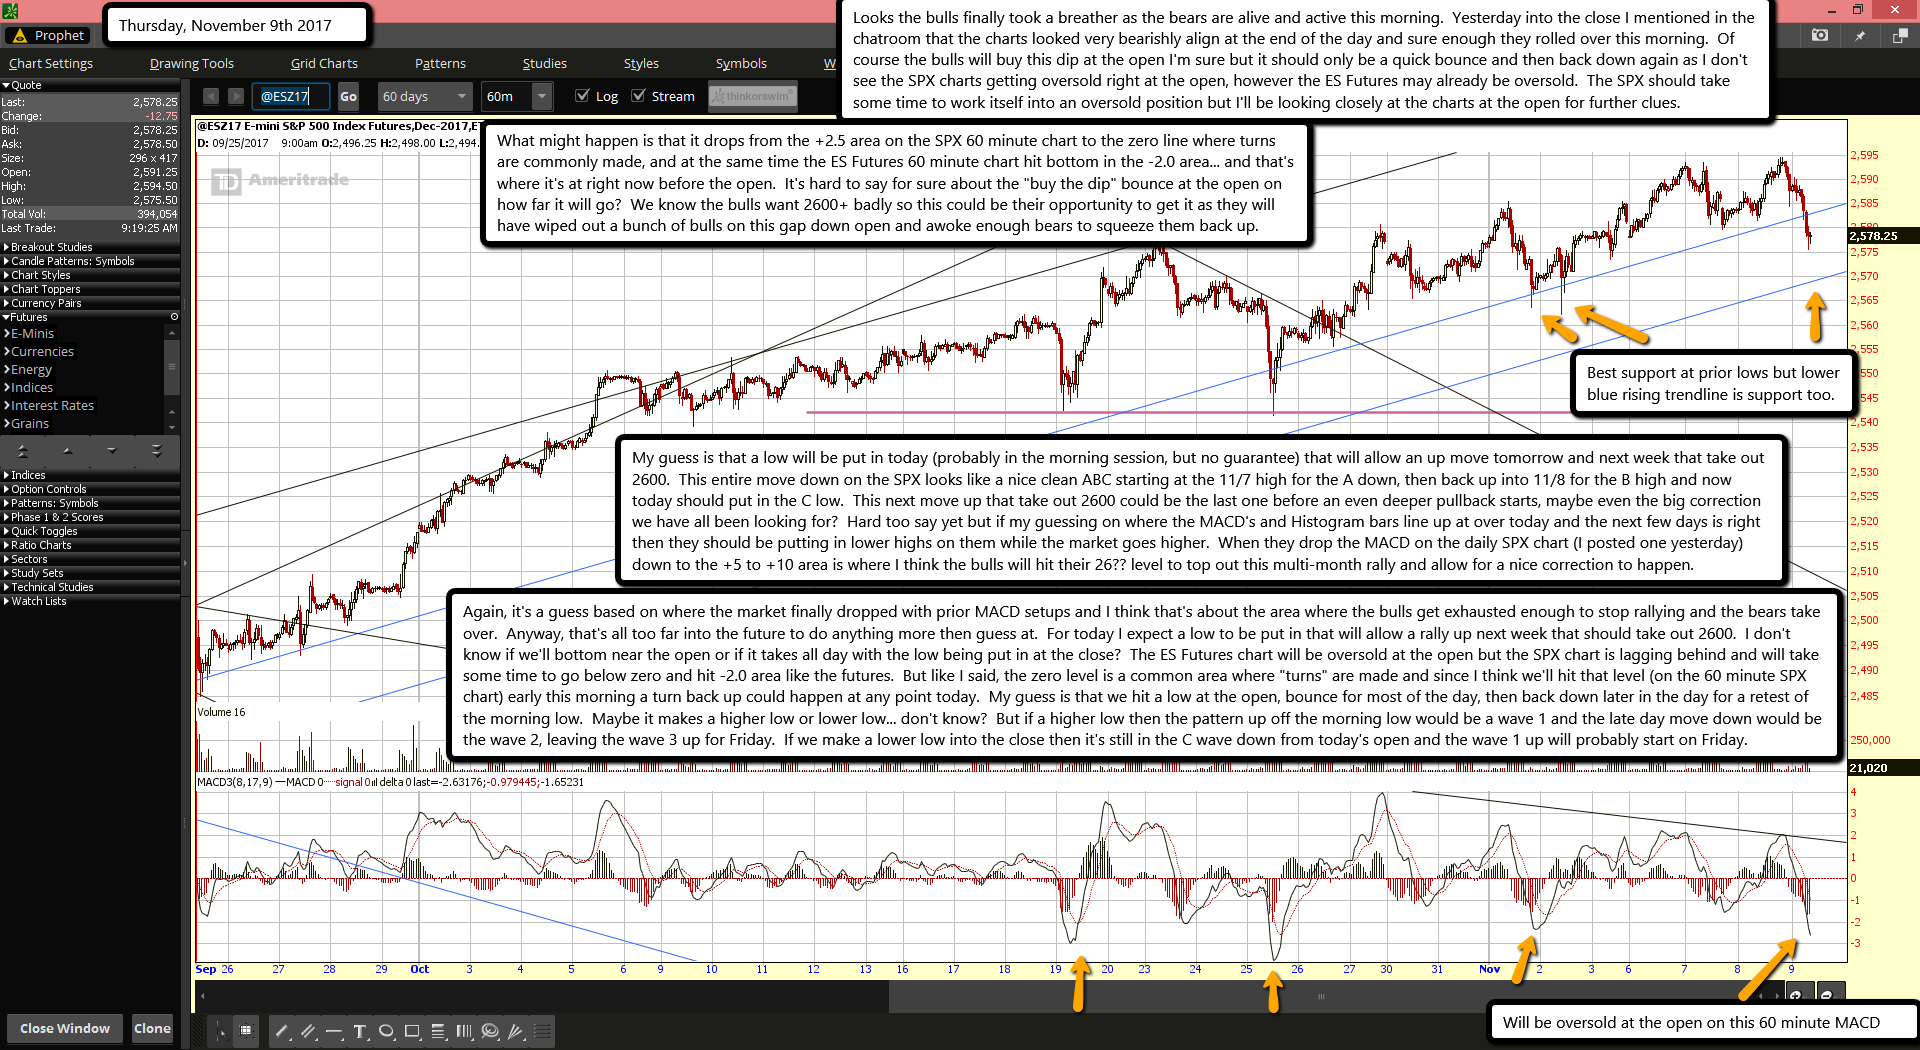
Looks the bulls finally took a breather as the bears are alive and active this morning.  Yesterday into the close I mentioned in the chatroom that the charts looked very bearishly align at the end of the day and sure enough they rolled over this morning.  Of course the bulls will buy this dip at the open I'm sure but it should only be a quick bounce and then back down again as I don't see the SPX charts getting oversold right at the open, however the ES Futures may already be oversold.  The SPX should take some time to work itself into an oversold position but I'll be looking closely at the charts at the open for further clues.

What might happen is that it drops from the +2.5 area on the SPX 60 minute chart to the zero line where turns are commonly made, and at the same time the ES Futures 60 minute chart hit bottom in the -2.0 area... and that's where it's at right now before the open.  It's hard to say for sure about the "buy the dip" bounce at the open on how far it will go?  We know the bulls want 2600+ badly so this could be their opportunity to get it as they will have wiped out a bunch of bulls on this gap down open and awoke enough bears to squeeze them back up.

My guess is that a low will be put in today (probably in the morning session, but no guarantee) that will allow an up move tomorrow and next week that take out 2600.  This entire move down on the SPX looks like a nice clean ABC starting at the 11/7 high for the A down, then back up into 11/8 for the B high and now today should put in the C low.  This next move up that take out 2600 could be the last one before an even deeper pullback starts, maybe even the big correction we have all been looking for?  Hard too say yet but if my guessing on where the MACD's and Histogram bars line up at over today and the next few days is right then they should be putting in lower highs on them while the market goes higher.  When they drop the MACD on the daily SPX chart (I posted one yesterday) down to the +5 to +10 area is where I think the bulls will hit their 26?? level to top out this multi-month rally and allow for a nice correction to happen.

Again, it's a guess based on where the market finally dropped with prior MACD setups and I think that's about the area where the bulls get exhausted enough to stop rallying and the bears take over.  Anyway, that's all too far into the future to do anything more then guess at.  For today I expect a low to be put in that will allow a rally up next week that should take out 2600.  I don't know if we'll bottom near the open or if it takes all day with the low being put in at the close?  The ES Futures chart will be oversold at the open but the SPX chart is lagging behind and will take some time to go below zero and hit -2.0 area like the futures.  But like I said, the zero level is a common area where "turns" are made and since I think we'll hit that level (on the 60 minute SPX chart) early this morning a turn back up could happen at any point today.  My guess is that we hit a low at the open, bounce for most of the day, then back down later in the day for a retest of the morning low.  Maybe it makes a higher low or lower low... don't know?  But if a higher low then the pattern up off the morning low would be a wave 1 and the late day move down would be the wave 2, leaving the wave 3 up for Friday.  If we make a lower low into the close then it's still in the C wave down from today's open and the wave 1 up will probably start on Friday.

ES Morning Update November 8th 2017

0

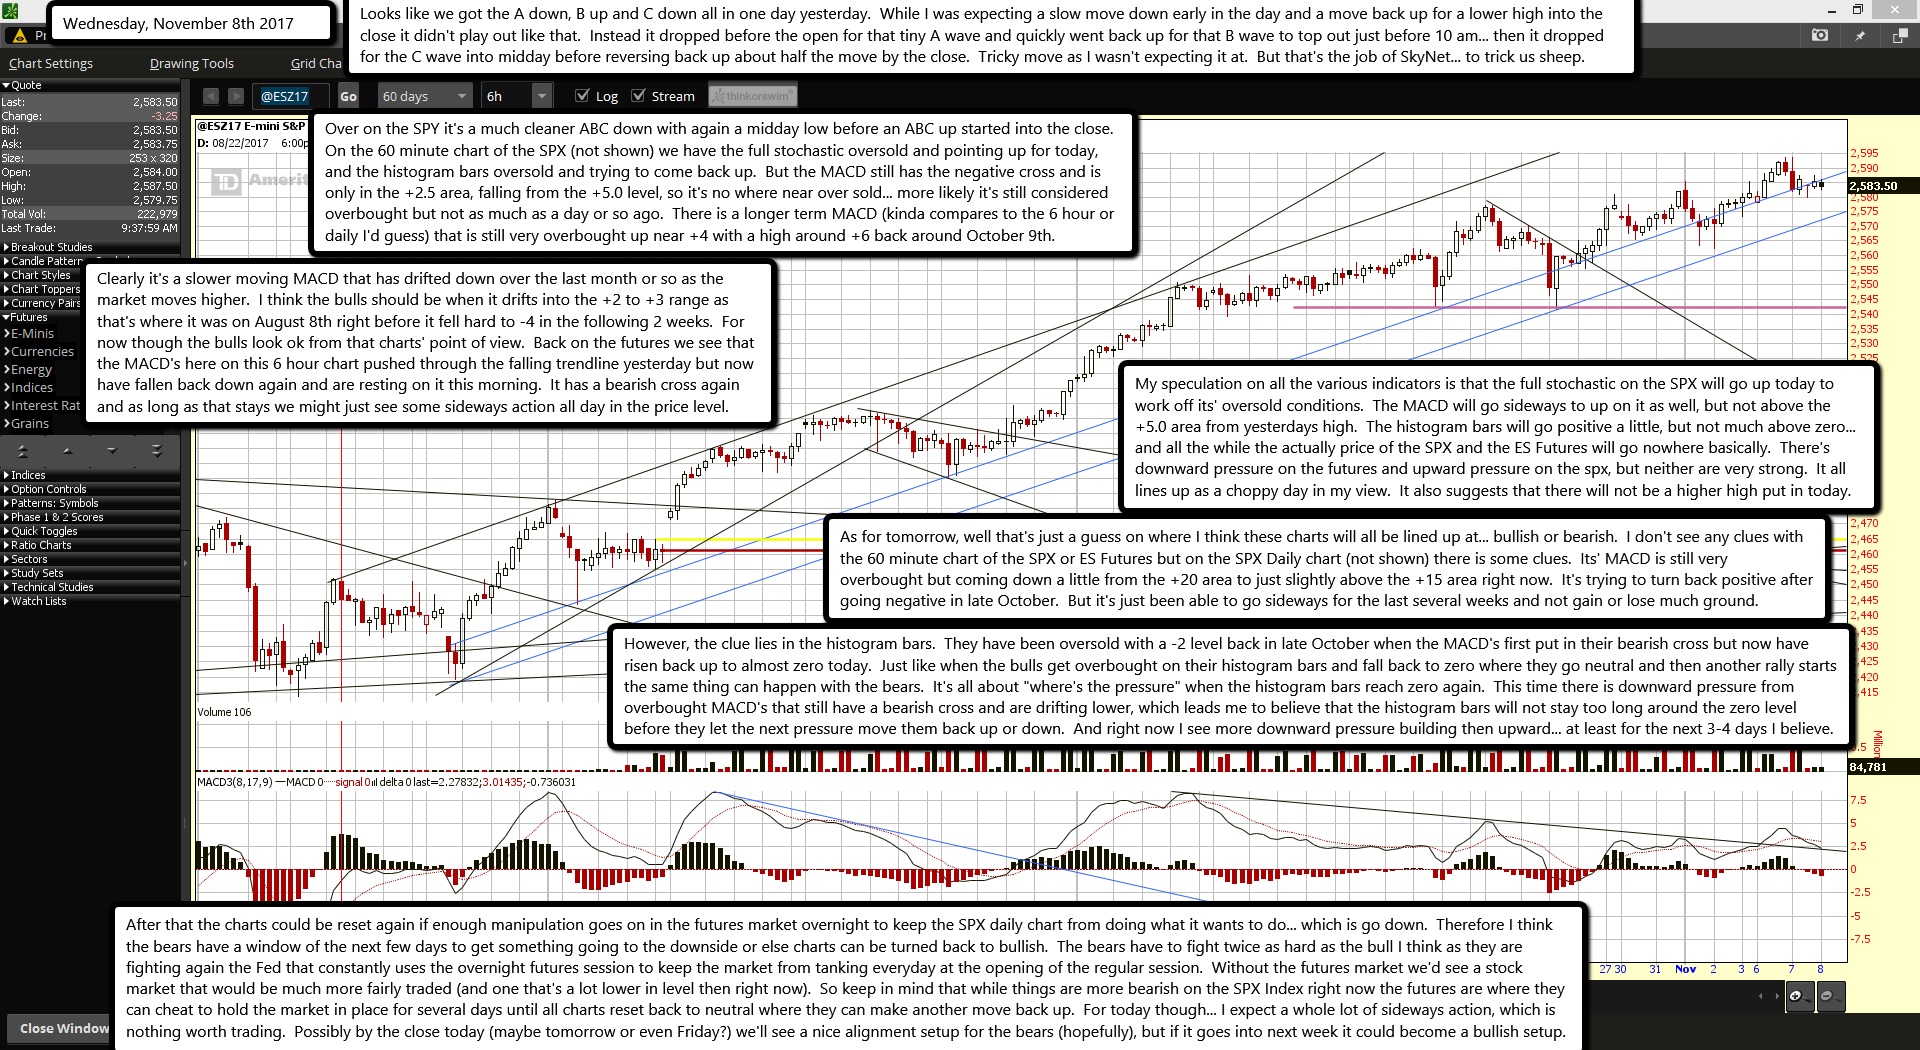
Looks like we got the A down, B up and C down all in one day yesterday.  While I was expecting a slow move down early in the day and a move back up for a lower high into the close it didn't play out like that.  Instead it dropped before the open for that tiny A wave and quickly went back up for that B wave to top out just before 10 am... then it dropped for the C wave into midday before reversing back up about half the move by the close.  Tricky move as I wasn't expecting it at.  But that's the job of SkyNet... to trick us sheep.

Over on the SPY it's a much cleaner ABC down with again a midday low before an ABC up started into the close.  On the 60 minute chart of the SPX (not shown) we have the full stochastic oversold and pointing up for today, and the histogram bars oversold and trying to come back up.  But the MACD still has the negative cross and is only in the +2.5 area, falling from the +5.0 level, so it's no where near over sold... more likely it's still considered overbought but not as much as a day or so ago.  There is a longer term MACD (kinda compares to the 6 hour or daily I'd guess) that is still very overbought up near +4 with a high around +6 back around October 9th.

Clearly it's a slower moving MACD that has drifted down over the last month or so as the market moves higher.  I think the bulls should be when it drifts into the +2 to +3 range as that's where it was on August 8th right before it fell hard to -4 in the following 2 weeks.  For now though the bulls look ok from that charts' point of view.  Back on the futures we see that the MACD's here on this 6 hour chart pushed through the falling trendline yesterday but now have fallen back down again and are resting on it this morning.  It has a bearish cross again and as long as that stays we might just see some sideways action all day in the price level.

My speculation on all the various indicators is that the full stochastic on the SPX will go up today to work off its' oversold conditions.  The MACD will go sideways to up on it as well, but not above the +5.0 area from yesterdays high.  The histogram bars will go positive a little, but not much above zero... and all the while the actually price of the SPX and the ES Futures will go nowhere basically.  There's downward pressure on the futures and upward pressure on the spx, but neither are very strong.  It all lines up as a choppy day in my view.  It also suggests that there will not be a higher high put in today.

As for tomorrow, well that's just a guess on where I think these charts will all be lined up at... bullish or bearish.  I don't see any clues with the 60 minute chart of the SPX or ES Futures but on the SPX Daily chart (not shown) there is some clues.  Its' MACD is still very overbought but coming down a little from the +20 area to just slightly above the +15 area right now.  It's trying to turn back positive after going negative in late October.  But it's just been able to go sideways for the last several weeks and not gain or lose much ground.

However, the clue lies in the histogram bars.  They have been oversold with a -2 level back in late October when the MACD's first put in their bearish cross but now have risen back up to almost zero today.  Just like when the bulls get overbought on their histogram bars and fall back to zero where they go neutral and then another rally starts the same thing can happen with the bears.  It's all about "where's the pressure" when the histogram bars reach zero again.  This time there is downward pressure from overbought MACD's that still have a bearish cross and are drifting lower, which leads me to believe that the histogram bars will not stay too long around the zero level before they let the next pressure move them back up or down.  And right now I see more downward pressure building then upward... at least for the next 3-4 days I believe.

After that the charts could be reset again if enough manipulation goes on in the futures market overnight to keep the SPX daily chart from doing what it wants to do... which is go down.  Therefore I think the bears have a window of the next few days to get something going to the downside or else charts can be turned back to bullish.  The bears have to fight twice as hard as the bull I think as they are fighting again the Fed that constantly uses the overnight futures session to keep the market from tanking everyday at the opening of the regular session.  Without the futures market we'd see a stock market that would be much more fairly traded (and one that's a lot lower in level then right now).  So keep in mind that while things are more bearish on the SPX Index right now the futures are where they can cheat to hold the market in place for several days until all charts reset back to neutral where they can make another move back up.  For today though... I expect a whole lot of sideways action, which is nothing worth trading.  Possibly by the close today (maybe tomorrow or even Friday?) we'll see a nice alignment setup for the bears (hopefully), but if it goes into next week it could become a bullish setup.
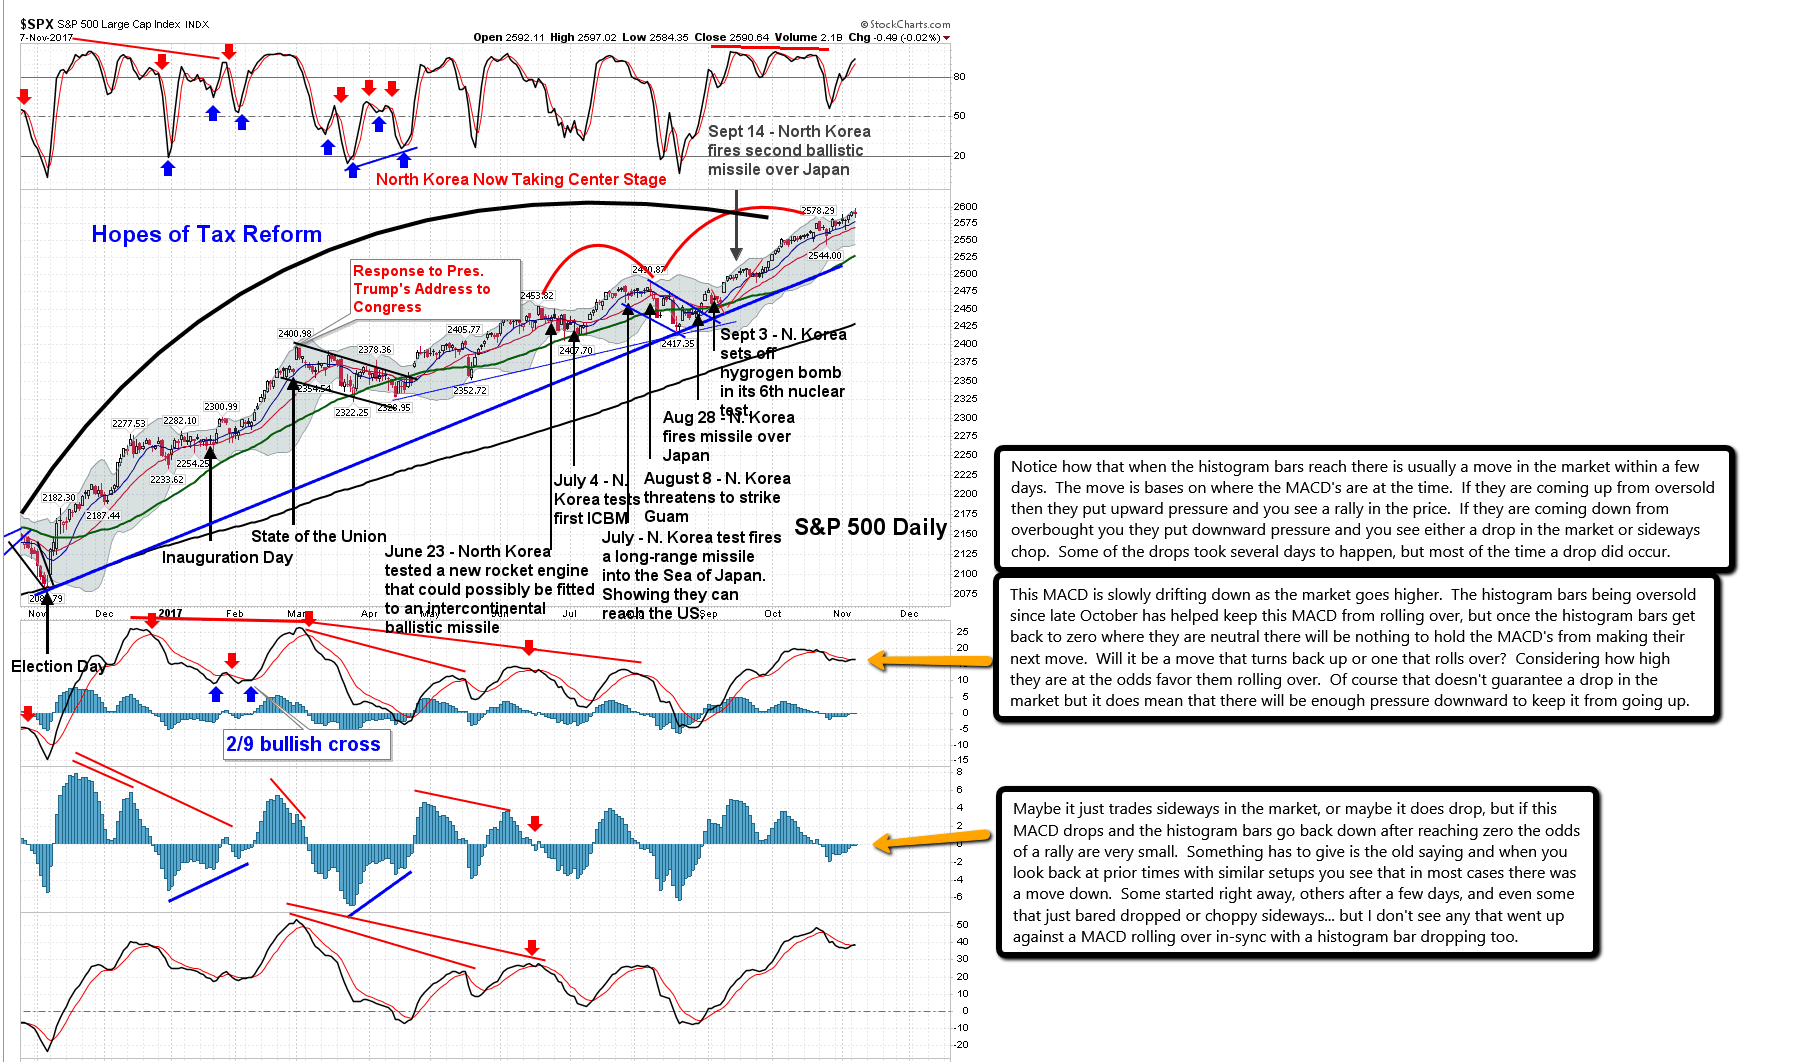
Notice how that when the histogram bars reach there is usually a move in the market within a few days.  The move is bases on where the MACD's are at the time.  If they are coming up from oversold then they put upward pressure and you see a rally in the price.  If they are coming down from overbought you they put downward pressure and you see either a drop in the market or sideways chop.  Some of the drops took several days to happen, but most of the time a drop did occur.

This MACD is slowly drifting down as the market goes higher.  The histogram bars being oversold since late October has helped keep this MACD from rolling over, but once the histogram bars get back to zero where they are neutral there will be nothing to hold the MACD's from making their next move.  Will it be a move that turns back up or one that rolls over?  Considering how high they are at the odds favor them rolling over.  Of course that doesn't guarantee a drop in the market but it does mean that there will be enough pressure downward to keep it from going up.

Maybe it just trades sideways in the market, or maybe it does drop, but if this MACD drops and the histogram bars go back down after reaching zero the odds of a rally are very small.  Something has to give is the old saying and when you look back at prior times with similar setups you see that in most cases there was a move down.  Some started right away, others after a few days, and even some that just bared dropped or choppy sideways... but I don't see any that went up against a MACD rolling over in-sync with a histogram bar dropping too.

ES Morning Update November 7th 2017

0

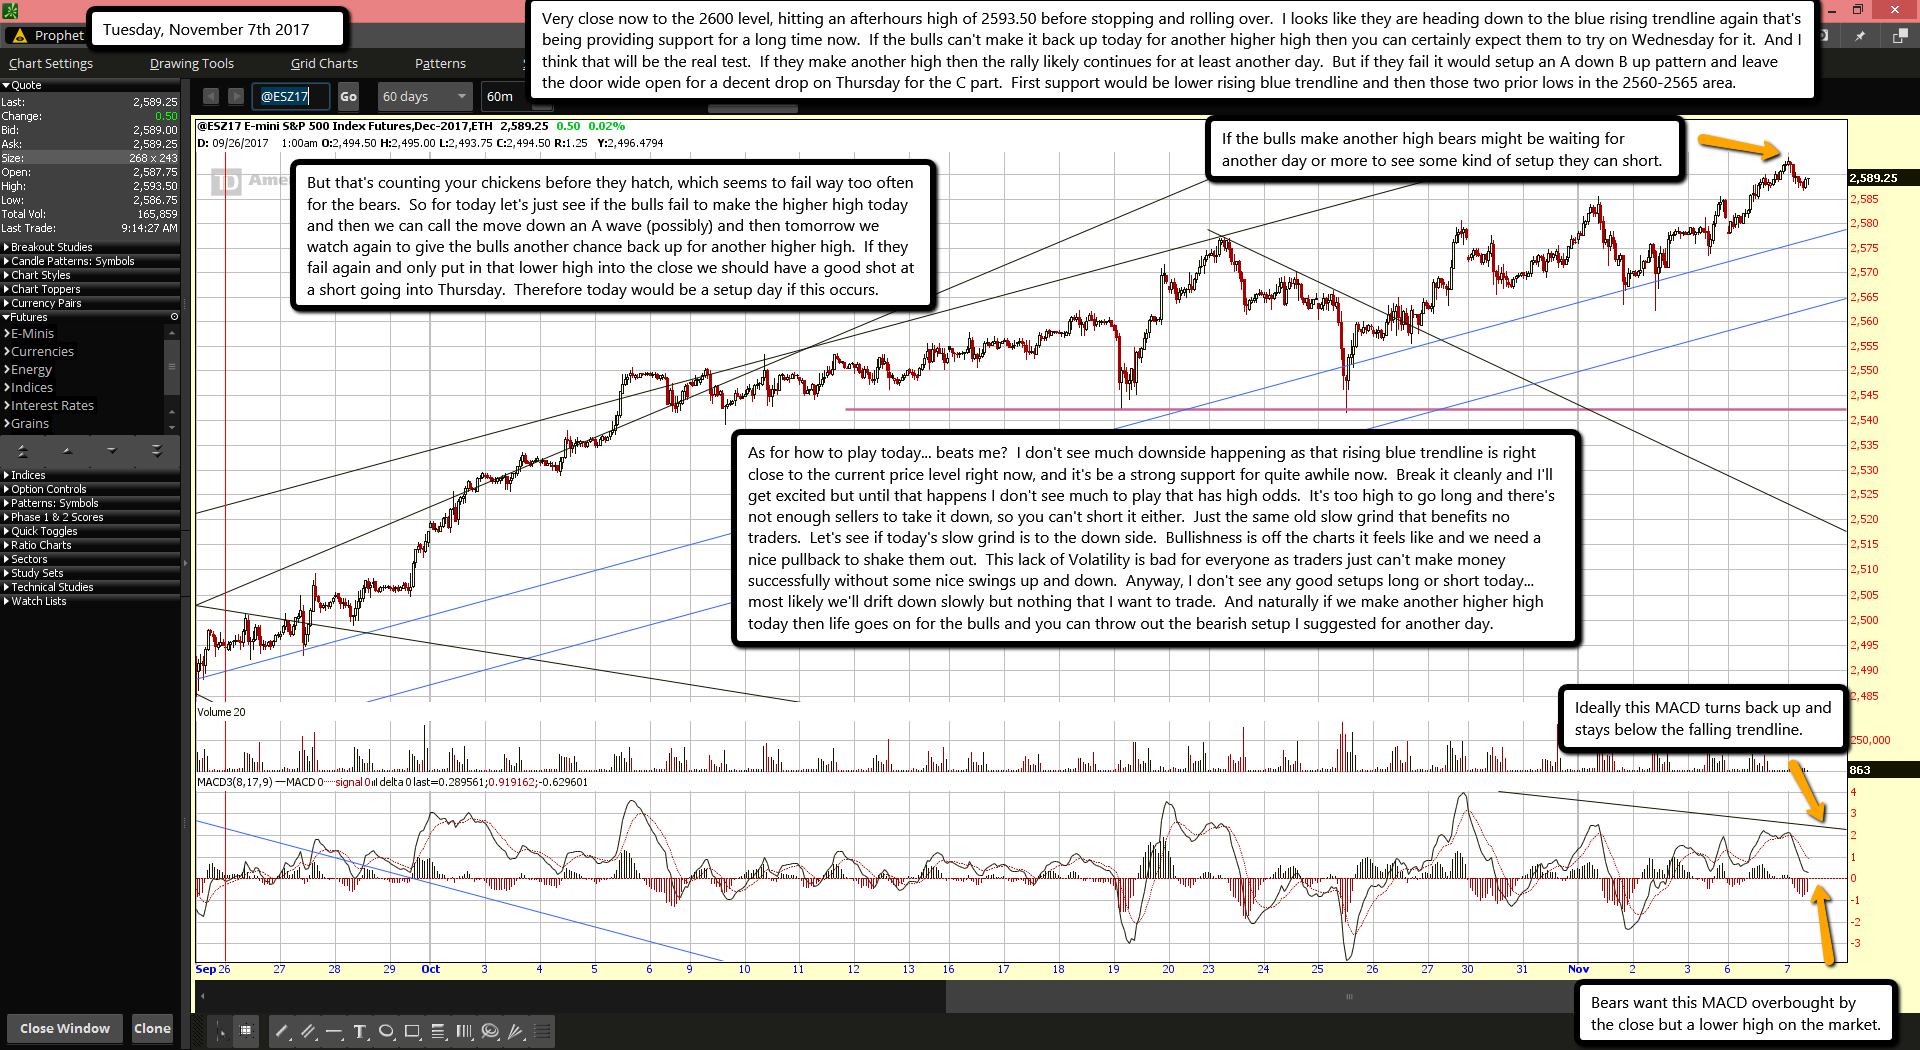
Very close now to the 2600 level, hitting an afterhours high of 2593.50 before stopping and rolling over.  I looks like they are heading down to the blue rising trendline again that's being providing support for a long time now.  If the bulls can't make it back up today for another higher high then you can certainly expect them to try on Wednesday for it.  And I think that will be the real test.  If they make another high then the rally likely continues for at least another day.  But if they fail it would setup an A down B up pattern and leave the door wide open for a decent drop on Thursday for the C part.  First support would be lower rising blue trendline and then those two prior lows in the 2560-2565 area.

But that's counting your chickens before they hatch, which seems to fail way too often for the bears.  So for today let's just see if the bulls fail to make the higher high today and then we can call the move down an A wave (possibly) and then tomorrow we watch again to give the bulls another chance back up for another higher high.  If they fail again and only put in that lower high into the close we should have a good shot at a short going into Thursday.  Therefore today would be a setup day if this occurs.

As for how to play today... beats me?  I don't see much downside happening as that rising blue trendline is right close to the current price level right now, and it's be a strong support for quite awhile now.  Break it cleanly and I'll get excited but until that happens I don't see much to play that has high odds.  It's too high to go long and there's not enough sellers to take it down, so you can't short it either.  Just the same old slow grind that benefits no traders.  Let's see if today's slow grind is to the down side.  Bullishness is off the charts it feels like and we need a nice pullback to shake them out.  This lack of Volatility is bad for everyone as traders just can't make money successfully without some nice swings up and down.  Anyway, I don't see any good setups long or short today... most likely we'll drift down slowly but nothing that I want to trade.  And naturally if we make another higher high today then life goes on for the bulls and you can throw out the bearish setup I suggested for another day.

ES Morning Update November 6th 2017

0

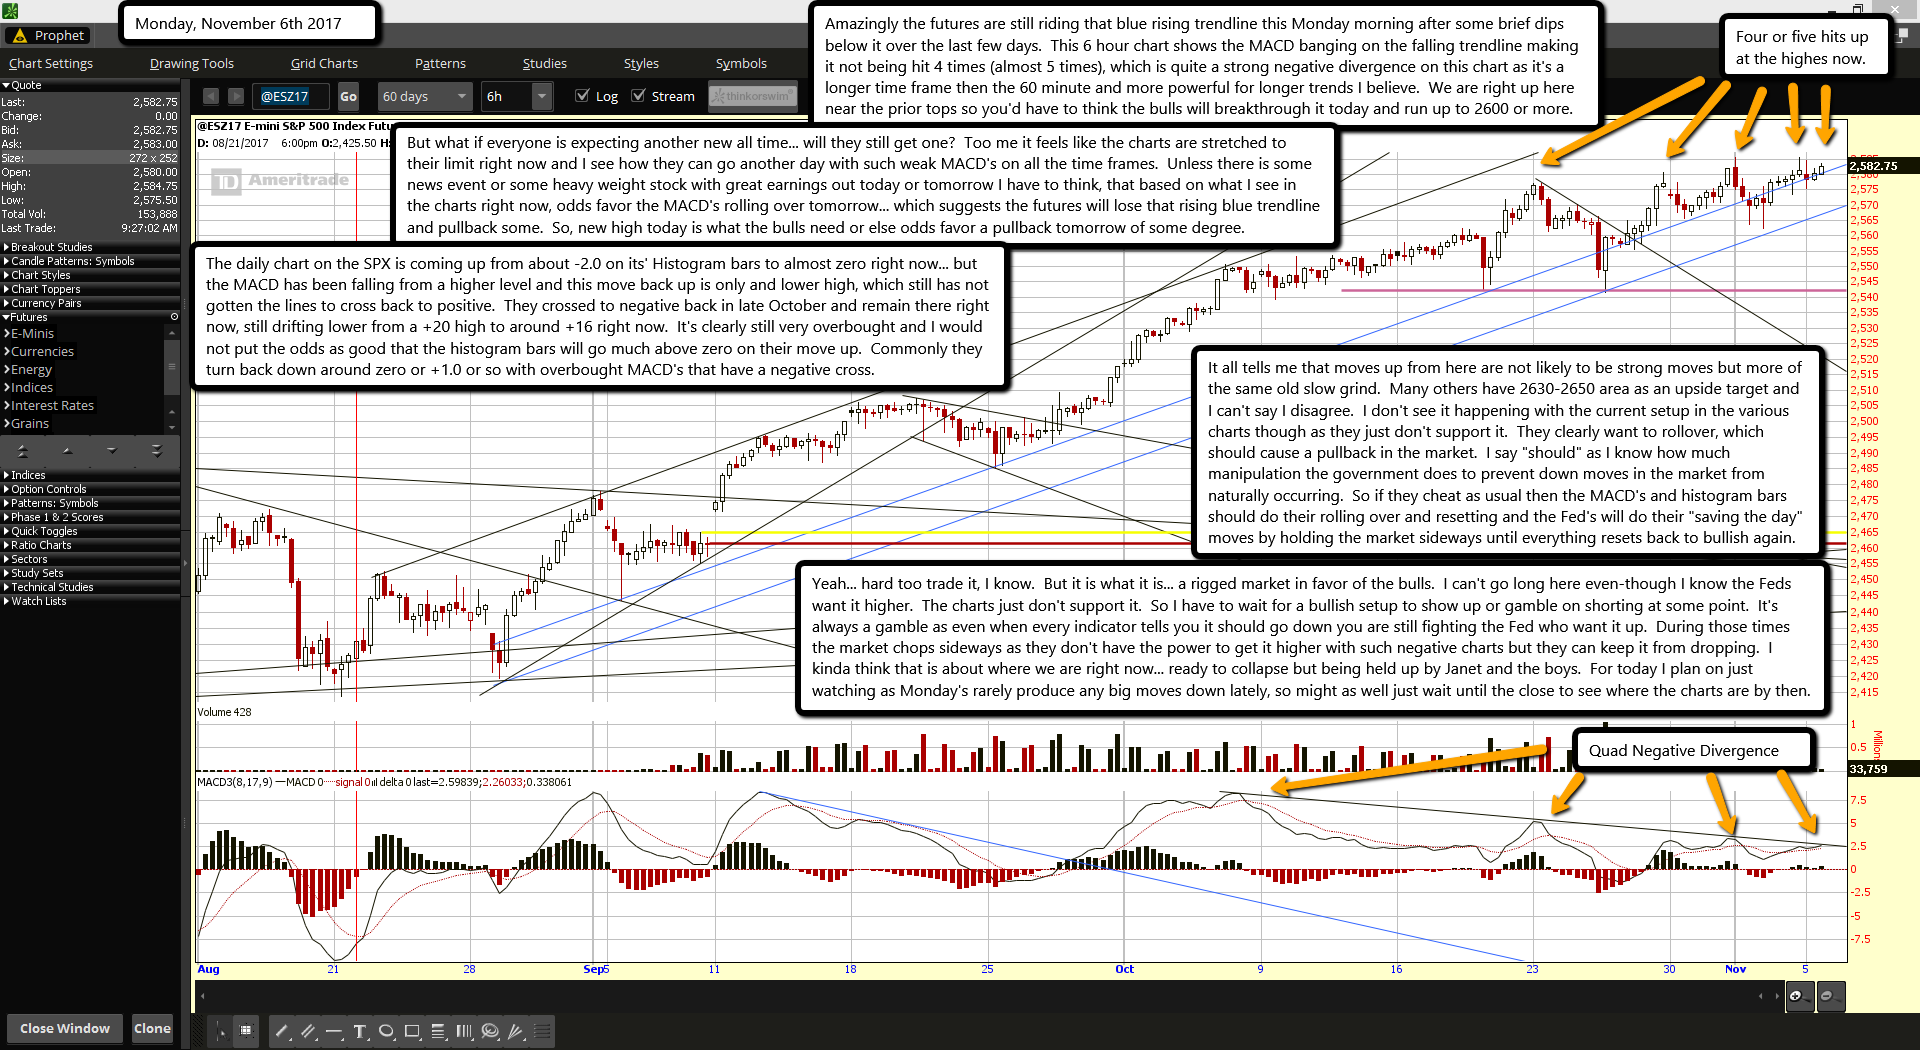
Amazingly the futures are still riding that blue rising trendline this Monday morning after some brief dips below it over the last few days.  This 6 hour chart shows the MACD banging on the falling trendline making it not being hit 4 times (almost 5 times), which is quite a strong negative divergence on this chart as it's a longer time frame then the 60 minute and more powerful for longer trends I believe.  We are right up here near the prior tops so you'd have to think the bulls will breakthrough it today and run up to 2600 or more.

But what if everyone is expecting another new all time... will they still get one?  Too me it feels like the charts are stretched to their limit right now and I see how they can go another day with such weak MACD's on all the time frames.  Unless there is some news event or some heavy weight stock with great earnings out today or tomorrow I have to think, that based on what I see in the charts right now, odds favor the MACD's rolling over tomorrow... which suggests the futures will lose that rising blue trendline and pullback some.  So, new high today is what the bulls need or else odds favor a pullback tomorrow of some degree.

The daily chart on the SPX is coming up from about -2.0 on its' Histogram bars to almost zero right now... but the MACD has been falling from a higher level and this move back up is only and lower high, which still has not gotten the lines to cross back to positive.  They crossed to negative back in late October and remain there right now, still drifting lower from a +20 high to around +16 right now.  It's clearly still very overbought and I would not put the odds as good that the histogram bars will go much above zero on their move up.  Commonly they turn back down around zero or +1.0 or so with overbought MACD's that have a negative cross.

It all tells me that moves up from here are not likely to be strong moves but more of the same old slow grind.  Many others have 2630-2650 area as an upside target and I can't say I disagree.  I don't see it happening with the current setup in the various charts though as they just don't support it.  They clearly want to rollover, which should cause a pullback in the market.  I say "should" as I know how much manipulation the government does to prevent down moves in the market from naturally occurring.  So if they cheat as usual then the MACD's and histogram bars should do their rolling over and resetting and the Fed's will do their "saving the day" moves by holding the market sideways until everything resets back to bullish again.

Yeah... hard too trade it, I know.  But it is what it is... a rigged market in favor of the bulls.  I can't go long here even-though I know the Feds want it higher.  The charts just don't support it.  So I have to wait for a bullish setup to show up or gamble on shorting at some point.  It's always a gamble as even when every indicator tells you it should go down you are still fighting the Fed who want it up.  During those times the market chops sideways as they don't have the power to get it higher with such negative charts but they can keep it from dropping.  I kinda think that is about where we are right now... ready to collapse but being held up by Janet and the boys.  For today I plan on just watching as Monday's rarely produce any big moves down lately, so might as well just wait until the close to see where the charts are by then.

ES Morning Update November 3rd 2017

0

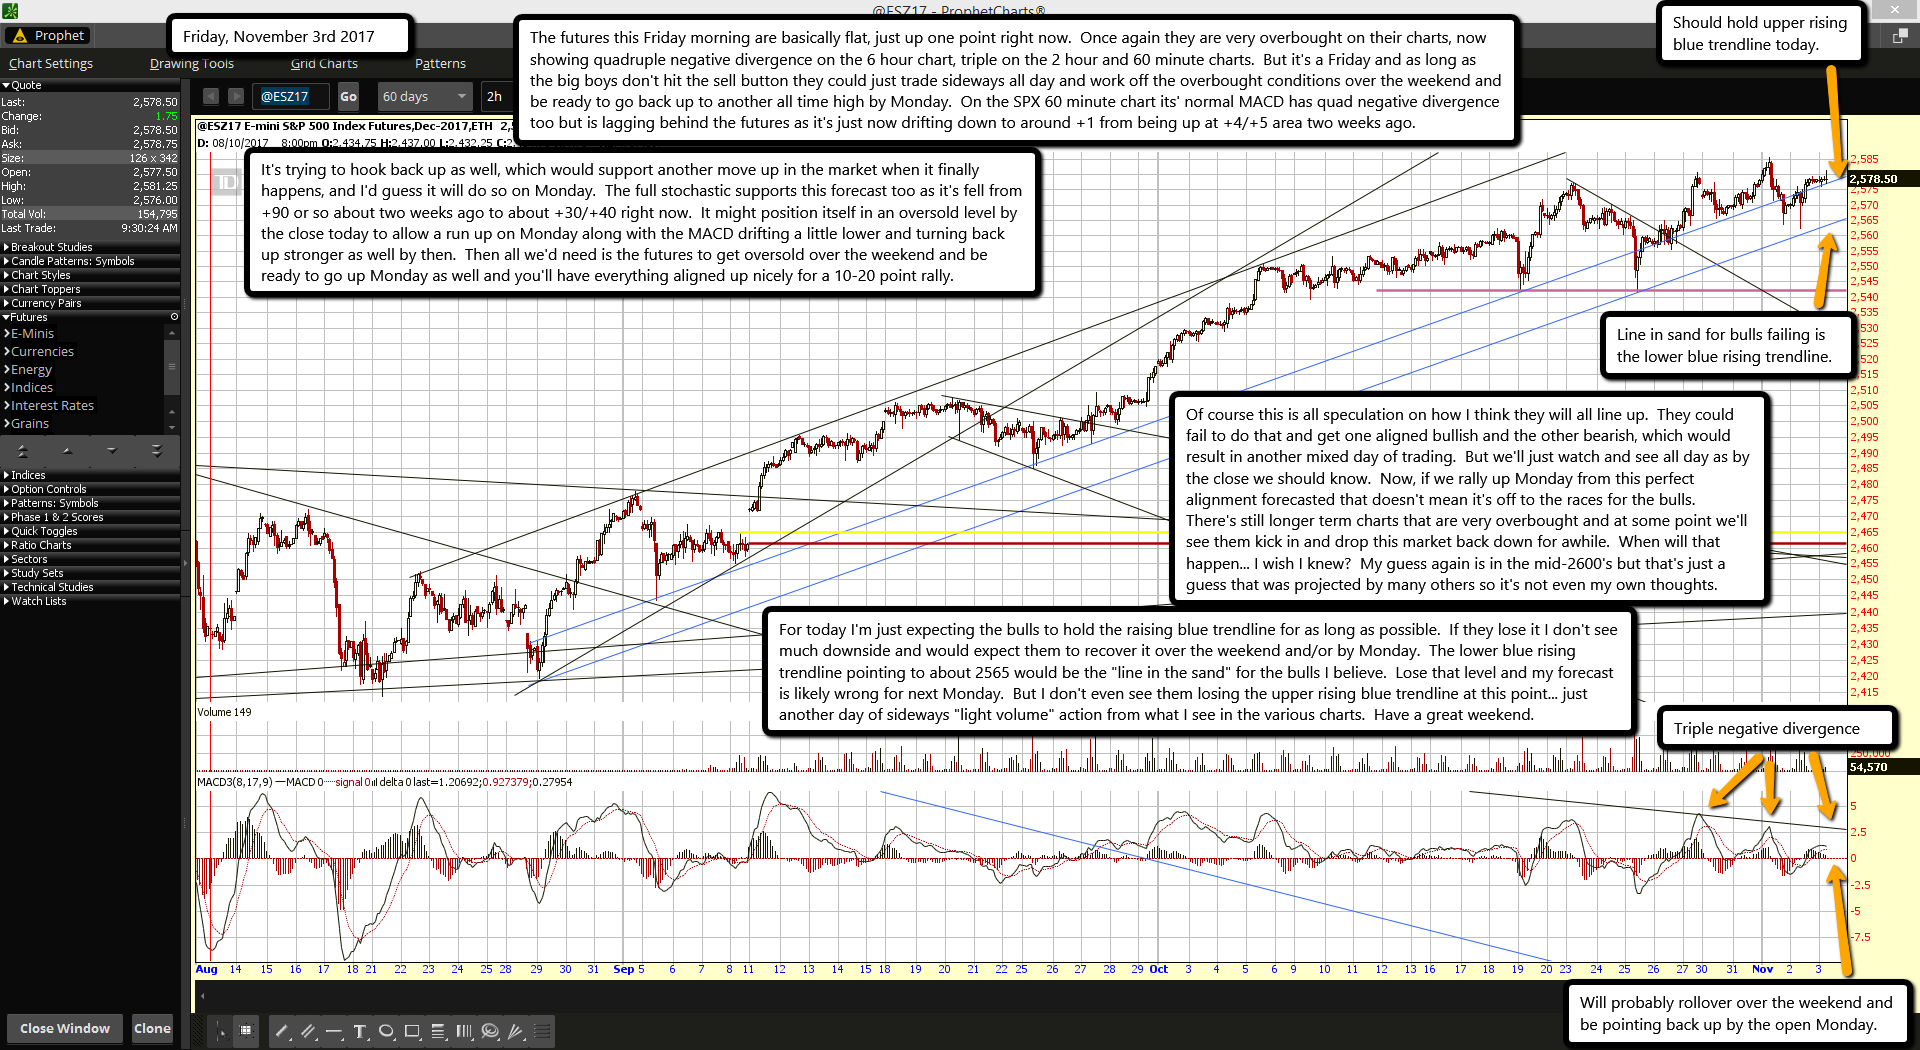
The futures this Friday morning are basically flat, just up one point right now.  Once again they are very overbought on their charts, now showing quadruple negative divergence on the 6 hour chart, triple on the 2 hour and 60 minute charts.  But it's a Friday and as long as the big boys don't hit the sell button they could just trade sideways all day and work off the overbought conditions over the weekend and be ready to go back up to another all time high by Monday.  On the SPX 60 minute chart its' normal MACD has quad negative divergence too but is lagging behind the futures as it's just now drifting down to around +1 from being up at +4/+5 area two weeks ago.

It's trying to hook back up as well, which would support another move up in the market when it finally happens, and I'd guess it will do so on Monday.  The full stochastic supports this forecast too as it's fell from +90 or so about two weeks ago to about +30/+40 right now.  It might position itself in an oversold level by the close today to allow a run up on Monday along with the MACD drifting a little lower and turning back up stronger as well by then.  Then all we'd need is the futures to get oversold over the weekend and be ready to go up Monday as well and you'll have everything aligned up nicely for a 10-20 point rally.

Of course this is all speculation on how I think they will all line up.  They could fail to do that and get one aligned bullish and the other bearish, which would result in another mixed day of trading.  But we'll just watch and see all day as by the close we should know.  Now, if we rally up Monday from this perfect alignment forecasted that doesn't mean it's off to the races for the bulls.  There's still longer term charts that are very overbought and at some point we'll see them kick in and drop this market back down for awhile.  When will that happen... I wish I knew?  My guess again is in the mid-2600's but that's just a guess that was projected by many others so it's not even my own thoughts.

For today I'm just expecting the bulls to hold the raising blue trendline for as long as possible.  If they lose it I don't see much downside and would expect them to recover it over the weekend and/or by Monday.  The lower blue rising trendline pointing to about 2565 would be the "line in the sand" for the bulls I believe.  Lose that level and my forecast is likely wrong for next Monday.  But I don't even see them losing the upper rising blue trendline at this point... just another day of sideways "light volume" action from what I see in the various charts.  Have a great weekend.

ES Morning Update November 2nd 2017

0

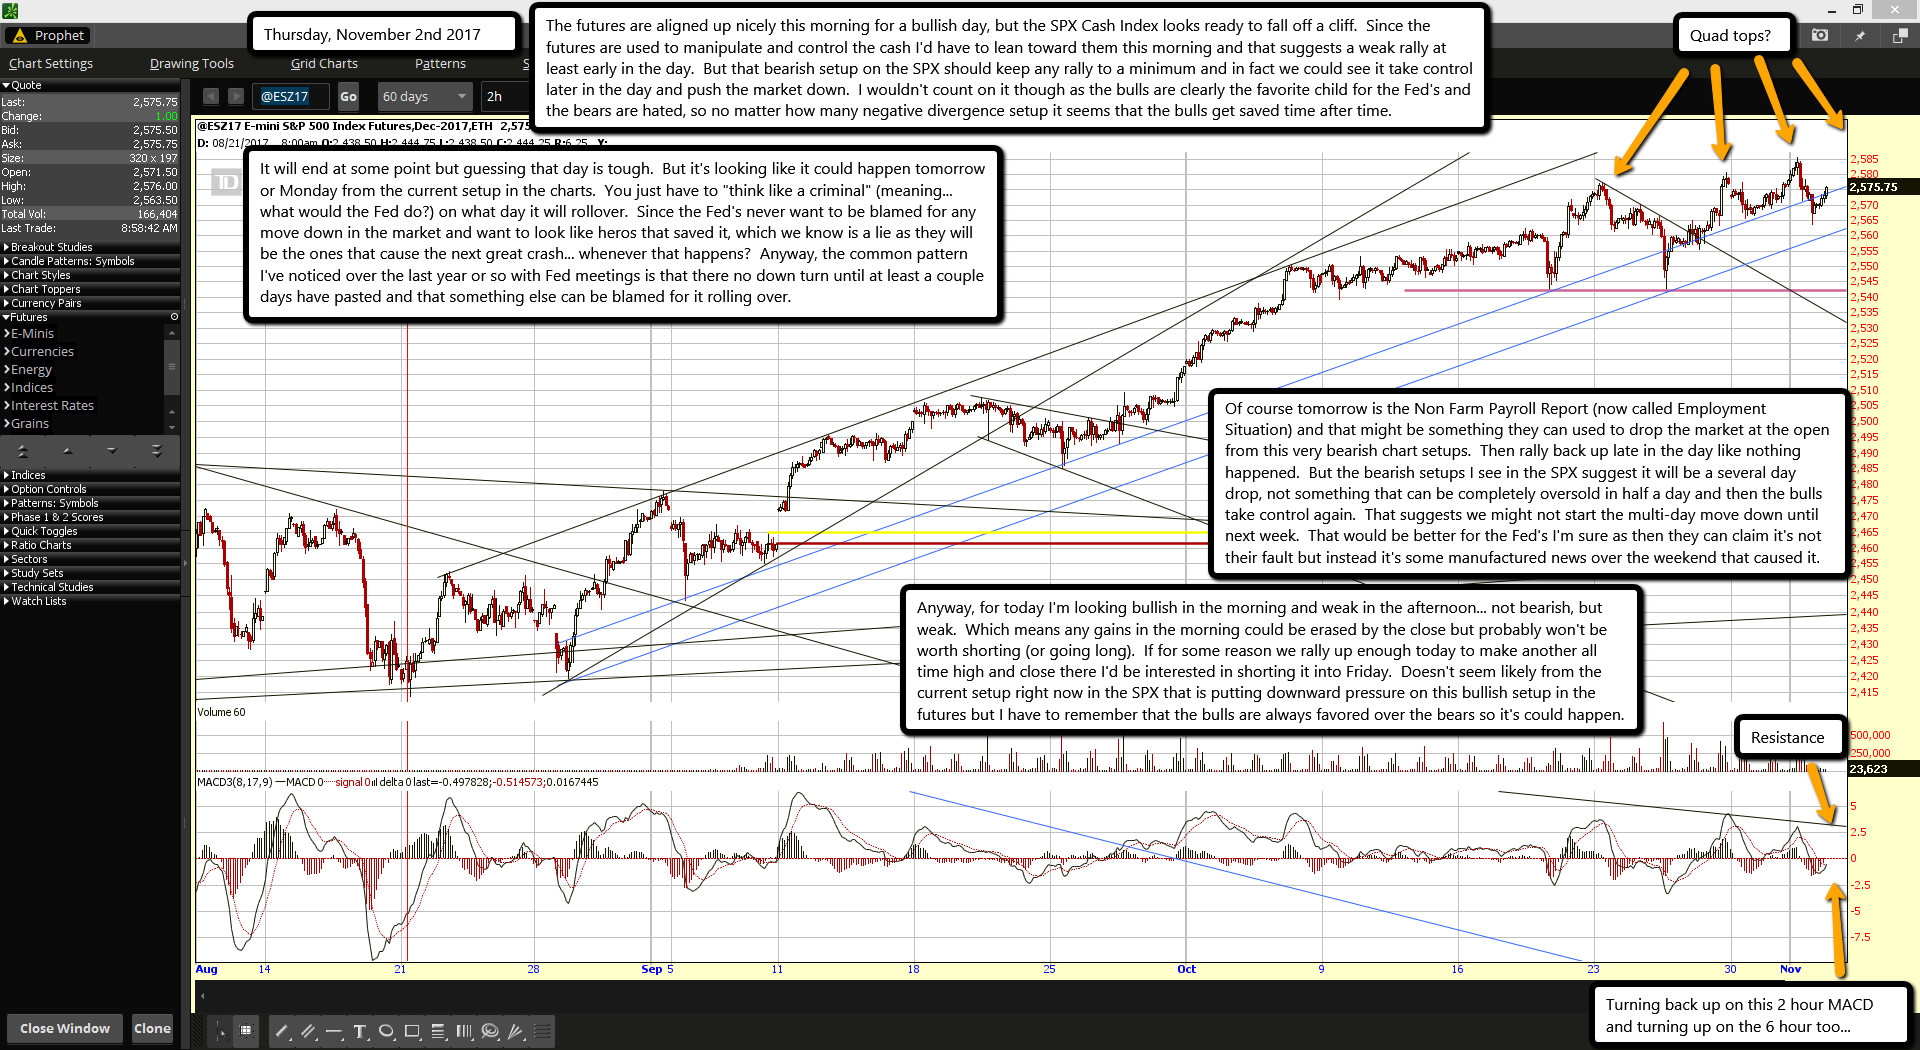
The futures are aligned up nicely this morning for a bullish day, but the SPX Cash Index looks ready to fall off a cliff.  Since the futures are used to manipulate and control the cash I'd have to lean toward them this morning and that suggests a weak rally at least early in the day.  But that bearish setup on the SPX should keep any rally to a minimum and in fact we could see it take control later in the day and push the market down.  I wouldn't count on it though as the bulls are clearly the favorite child for the Fed's and the bears are hated, so no matter how many negative divergence setup it seems that the bulls get saved time after time.

It will end at some point but guessing that day is tough.  But it's looking like it could happen tomorrow or Monday from the current setup in the charts.  You just have to "think like a criminal" (meaning... what would the Fed do?) on what day it will rollover.  Since the Fed's never want to be blamed for any move down in the market and want to look like heros that saved it, which we know is a lie as they will be the ones that cause the next great crash... whenever that happens?  Anyway, the common pattern I've noticed over the last year or so with Fed meetings is that there no down turn until at least a couple days have pasted and that something else can be blamed for it rolling over.

Of course tomorrow is the Non Farm Payroll Report (now called Employment Situation) and that might be something they can used to drop the market at the open from this very bearish chart setups.  Then rally back up late in the day like nothing happened.  But the bearish setups I see in the SPX suggest it will be a several day drop, not something that can be completely oversold in half a day and then the bulls take control again.  That suggests we might not start the multi-day move down until next week.  That would be better for the Fed's I'm sure as then they can claim it's not their fault but instead it's some manufactured news over the weekend that caused it.

Anyway, for today I'm looking bullish in the morning and weak in the afternoon... not bearish, but weak.  Which means any gains in the morning could be erased by the close but probably won't be worth shorting (or going long).  If for some reason we rally up enough today to make another all time high and close there I'd be interested in shorting it into Friday.  Doesn't seem likely from the current setup right now in the SPX that is putting downward pressure on this bullish setup in the futures but I have to remember that the bulls are always favored over the bears so it's could happen.

ES Morning Update November 1st 2017

0

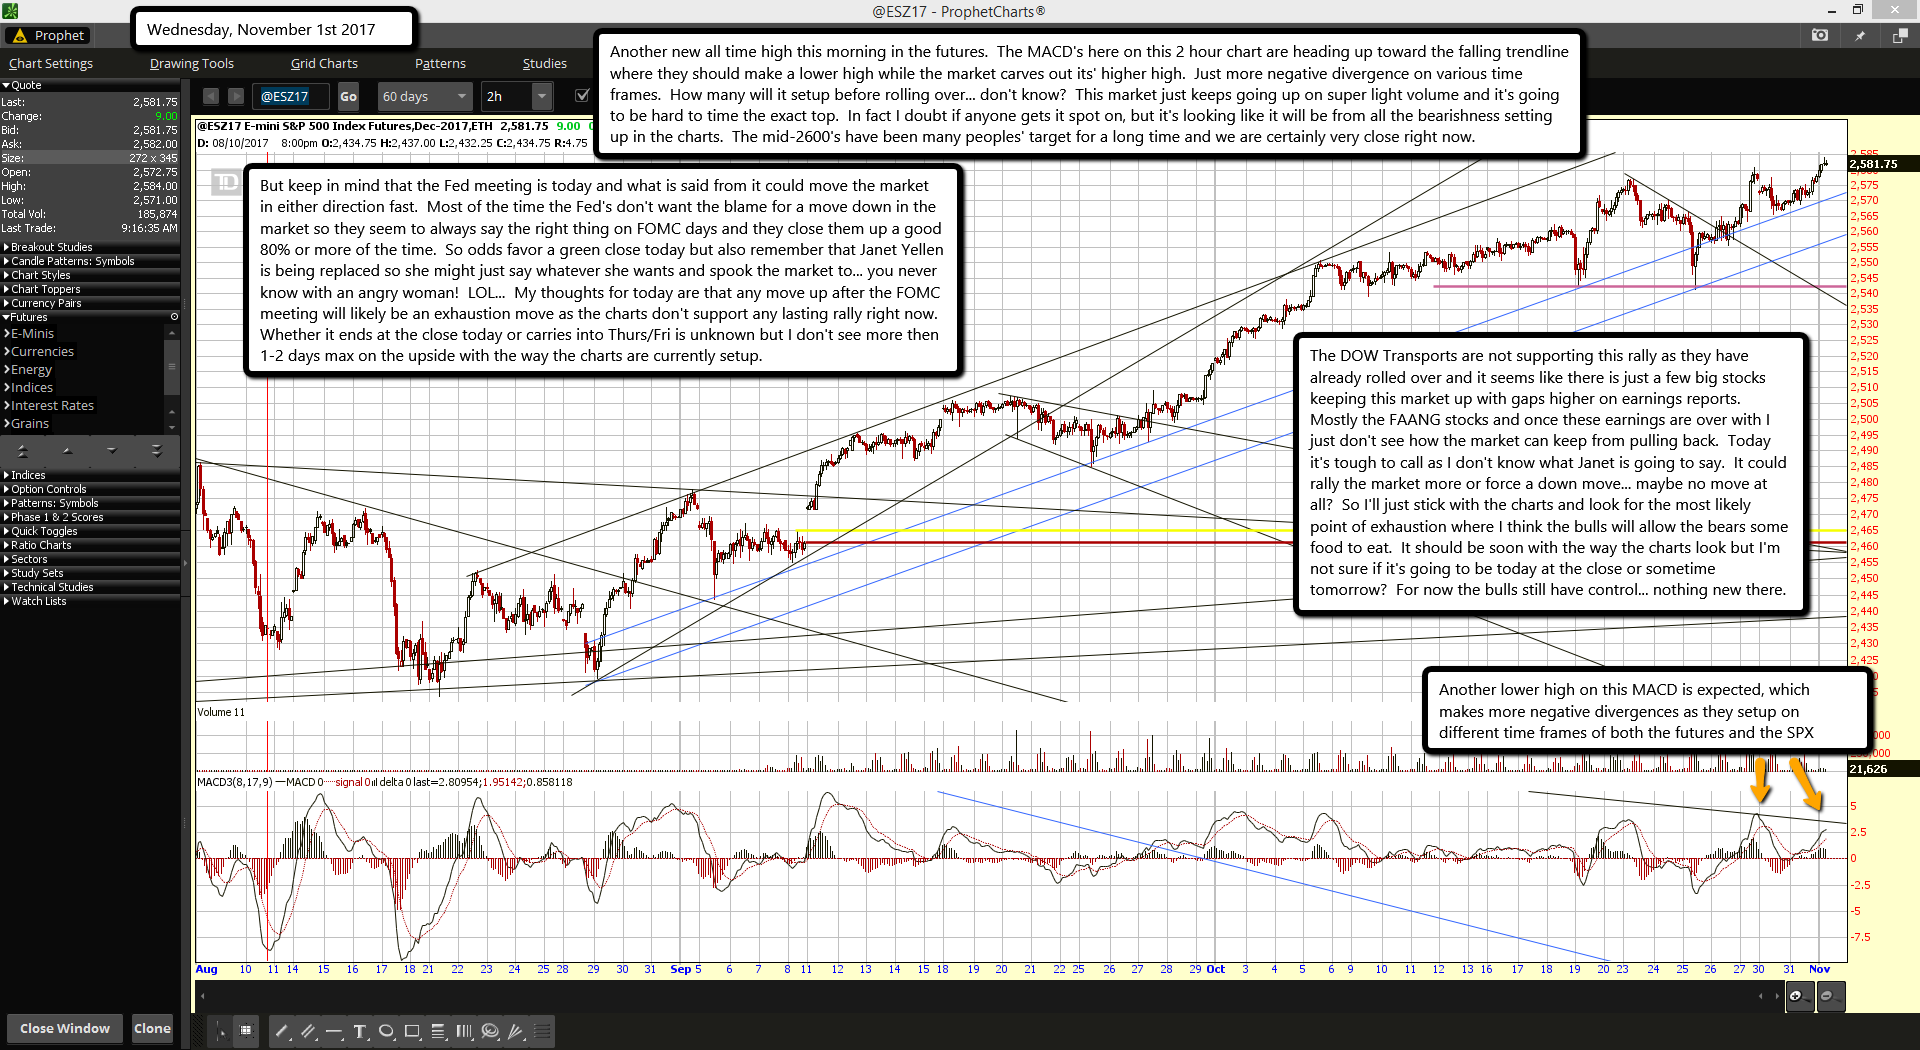
Another new all time high this morning in the futures.  The MACD's here on this 2 hour chart are heading up toward the falling trendline where they should make a lower high while the market carves out its' higher high.  Just more negative divergence on various time frames.  How many will it setup before rolling over... don't know?  This market just keeps going up on super light volume and it's going to be hard to time the exact top.  In fact I doubt if anyone gets it spot on, but it's looking like it will be from all the bearishness setting up in the charts.  The mid-2600's have been many peoples' target for a long time and we are certainly very close right now.

But keep in mind that the Fed meeting is today and what is said from it could move the market in either direction fast.  Most of the time the Fed's don't want the blame for a move down in the market so they seem to always say the right thing on FOMC days and they close them up a good 80% or more of the time.  So odds favor a green close today but also remember that Janet Yellen is being replaced so she might just say whatever she wants and spook the market to... you never know with an angry woman!  LOL...  My thoughts for today are that any move up after the FOMC meeting will likely be an exhaustion move as the charts don't support any lasting rally right now.  Whether it ends at the close today or carries into Thurs/Fri is unknown but I don't see more then 1-2 days max on the upside with the way the charts are currently setup.

The DOW Transports are not supporting this rally as they have already rolled over and it seems like there is just a few big stocks keeping this market up with gaps higher on earnings reports.  Mostly the FAANG stocks and once these earnings are over with I just don't see how the market can keep from pulling back.  Today it's tough to call as I don't know what Janet is going to say.  It could rally the market more or force a down move... maybe no move at all?  So I'll just stick with the charts and look for the most likely point of exhaustion where I think the bulls will allow the bears some food to eat.  It should be soon with the way the charts look but I'm not sure if it's going to be today at the close or sometime tomorrow?  For now the bulls still have control... nothing new there.

US DOD will conduct a “communications interoperability” training exercise November 4-6..simulating a “very bad day” scenario

0

Elements of the US Department of Defense (DOD) will conduct a “communications interoperability” training exercise November 4-6, once again simulating a “very bad day” scenario. Amateur Radio and MARS organizations will take part.

“This exercise will begin with a national massive coronal mass ejection event which will impact the national power grid as well as all forms of traditional communication, including landline telephone, cellphone, satellite, and Internet connectivity,” Army MARS Program Manager Paul English, WD8DBY, explained in an announcement.

During the exercise, a designated DOD Headquarters entity will request county-by-county status reports for the 3,143 US counties and county equivalents, in order to gain situational awareness and to determine the extent of impact of the scenario. Army and Air Force MARS organizations will work in conjunction with the Amateur Radio community, primarily on the 60-meter interoperability channels as well as on HF NVIS frequencies and local VHF and UHF, non-Internet linked Amateur Radio repeaters.

Again this year, a military station on the east coast and the Fort Huachuca, Arizona, HF station will conduct a high-power broadcast on 60-meter channel 1 (5330.5 kHz) on Saturday from 0300 to 0315 UTC. New this year will be an informational broadcast on Sunday, on 13,483.5 kHz USB from 1600 to 1615 UTC. Amateur Radio operators should monitor these broadcasts for more information about the exercise and how they can participate in this communications exercise, English said.

“We want to continue building on the outstanding cooperative working relationship with the ARRL and the Amateur Radio community,” English said. “We want to expand the use of the 60-meter interop channels between the military and amateur community for emergency communications, and we hope the Amateur Radio community will give us some good feedback on the use of both the 5-MHz interop and the new 13-MHz broadcast channels as a means of information dissemination during a very bad day scenario.


Seems too me that ever false flag event we've had (like Las Vegas, Sandy Hook, Boston Bombing, etc...) all had one thing it common... a training exercise before the event.

Is this exercise foretelling of another false flag that's coming?

Was the movie called "The Crash" an actual sign of what is really going to happen?  A power grid going down certainly wouldn't make the stock market very happy.

Red

ES Morning Update October 31st 2017

0

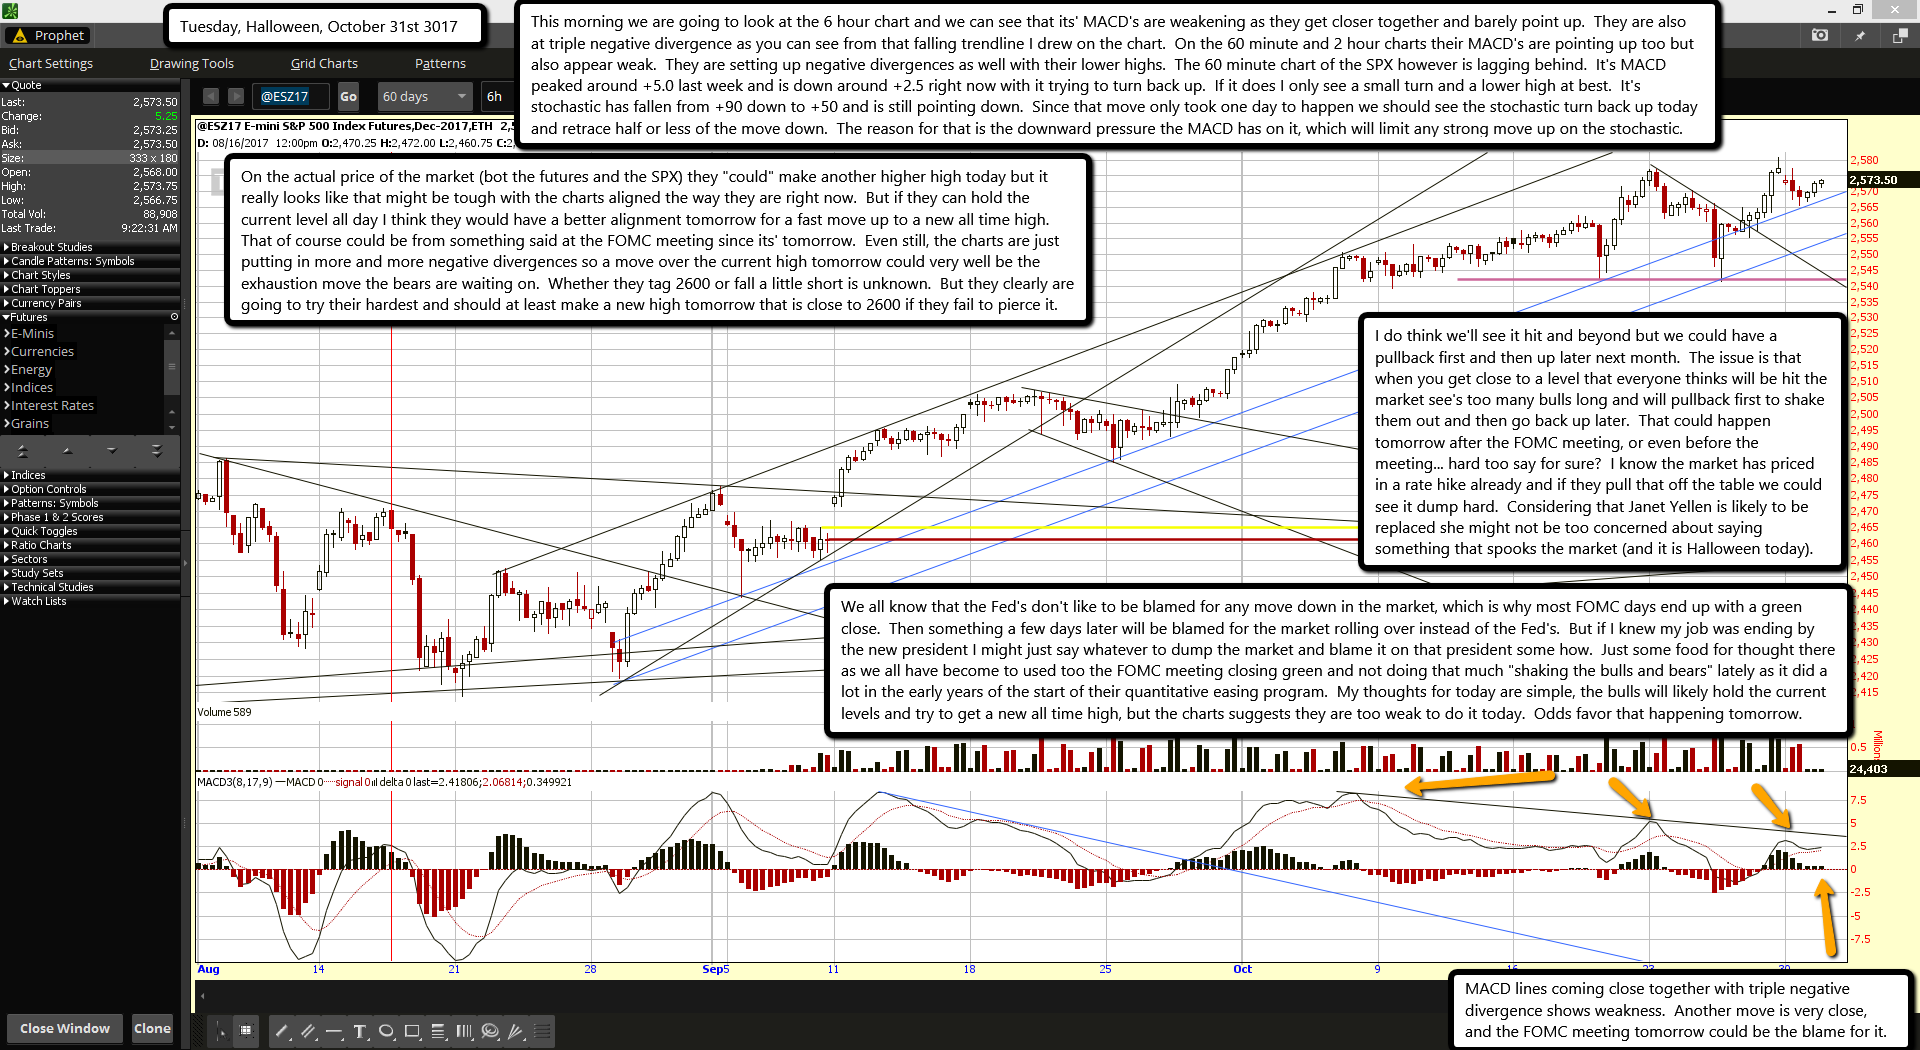
This morning we are going to look at the 6 hour chart and we can see that its' MACD's are weakening as they get closer together and barely point up.  They are also at triple negative divergence as you can see from that falling trendline I drew on the chart.  On the 60 minute and 2 hour charts their MACD's are pointing up too but also appear weak.  They are setting up negative divergences as well with their lower highs.  The 60 minute chart of the SPX however is lagging behind.  It's MACD peaked around +5.0 last week and is down around +2.5 right now with it trying to turn back up.  If it does I only see a small turn and a lower high at best.  It's stochastic has fallen from +90 down to +50 and is still pointing down.  Since that move only took one day to happen we should see the stochastic turn back up today and retrace half or less of the move down.  The reason for that is the downward pressure the MACD has on it, which will limit any strong move up on the stochastic.

On the actual price of the market (bot the futures and the SPX) they "could" make another higher high today but it really looks like that might be tough with the charts aligned the way they are right now.  But if they can hold the current level all day I think they would have a better alignment tomorrow for a fast move up to a new all time high.  That of course could be from something said at the FOMC meeting since its' tomorrow.  Even still, the charts are just putting in more and more negative divergences so a move over the current high tomorrow could very well be the exhaustion move the bears are waiting on.  Whether they tag 2600 or fall a little short is unknown.  But they clearly are going to try their hardest and should at least make a new high tomorrow that is close to 2600 if they fail to pierce it.

I do think we'll see it hit and beyond but we could have a pullback first and then up later next month.  The issue is that when you get close to a level that everyone thinks will be hit the market see's too many bulls long and will pullback first to shake them out and then go back up later.  That could happen tomorrow after the FOMC meeting, or even before the meeting... hard too say for sure?  I know the market has priced in a rate hike already and if they pull that off the table we could see it dump hard.  Considering that Janet Yellen is likely to be replaced she might not be too concerned about saying something that spooks the market (and it is Halloween today).

We all know that the Fed's don't like to be blamed for any move down in the market, which is why most FOMC days end up with a green close.  Then something a few days later will be blamed for the market rolling over instead of the Fed's.  But if I knew my job was ending by the new president I might just say whatever to dump the market and blame it on that president some how.  Just some food for thought there as we all have become to used too the FOMC meeting closing green and not doing that much "shaking the bulls and bears" lately as it did a lot in the early years of the start of their quantitative easing program.  My thoughts for today are simple, the bulls will likely hold the current levels and try to get a new all time high, but the charts suggests they are too weak to do it today.  Odds favor that happening tomorrow.

ES Morning Update October 30th 2017

0

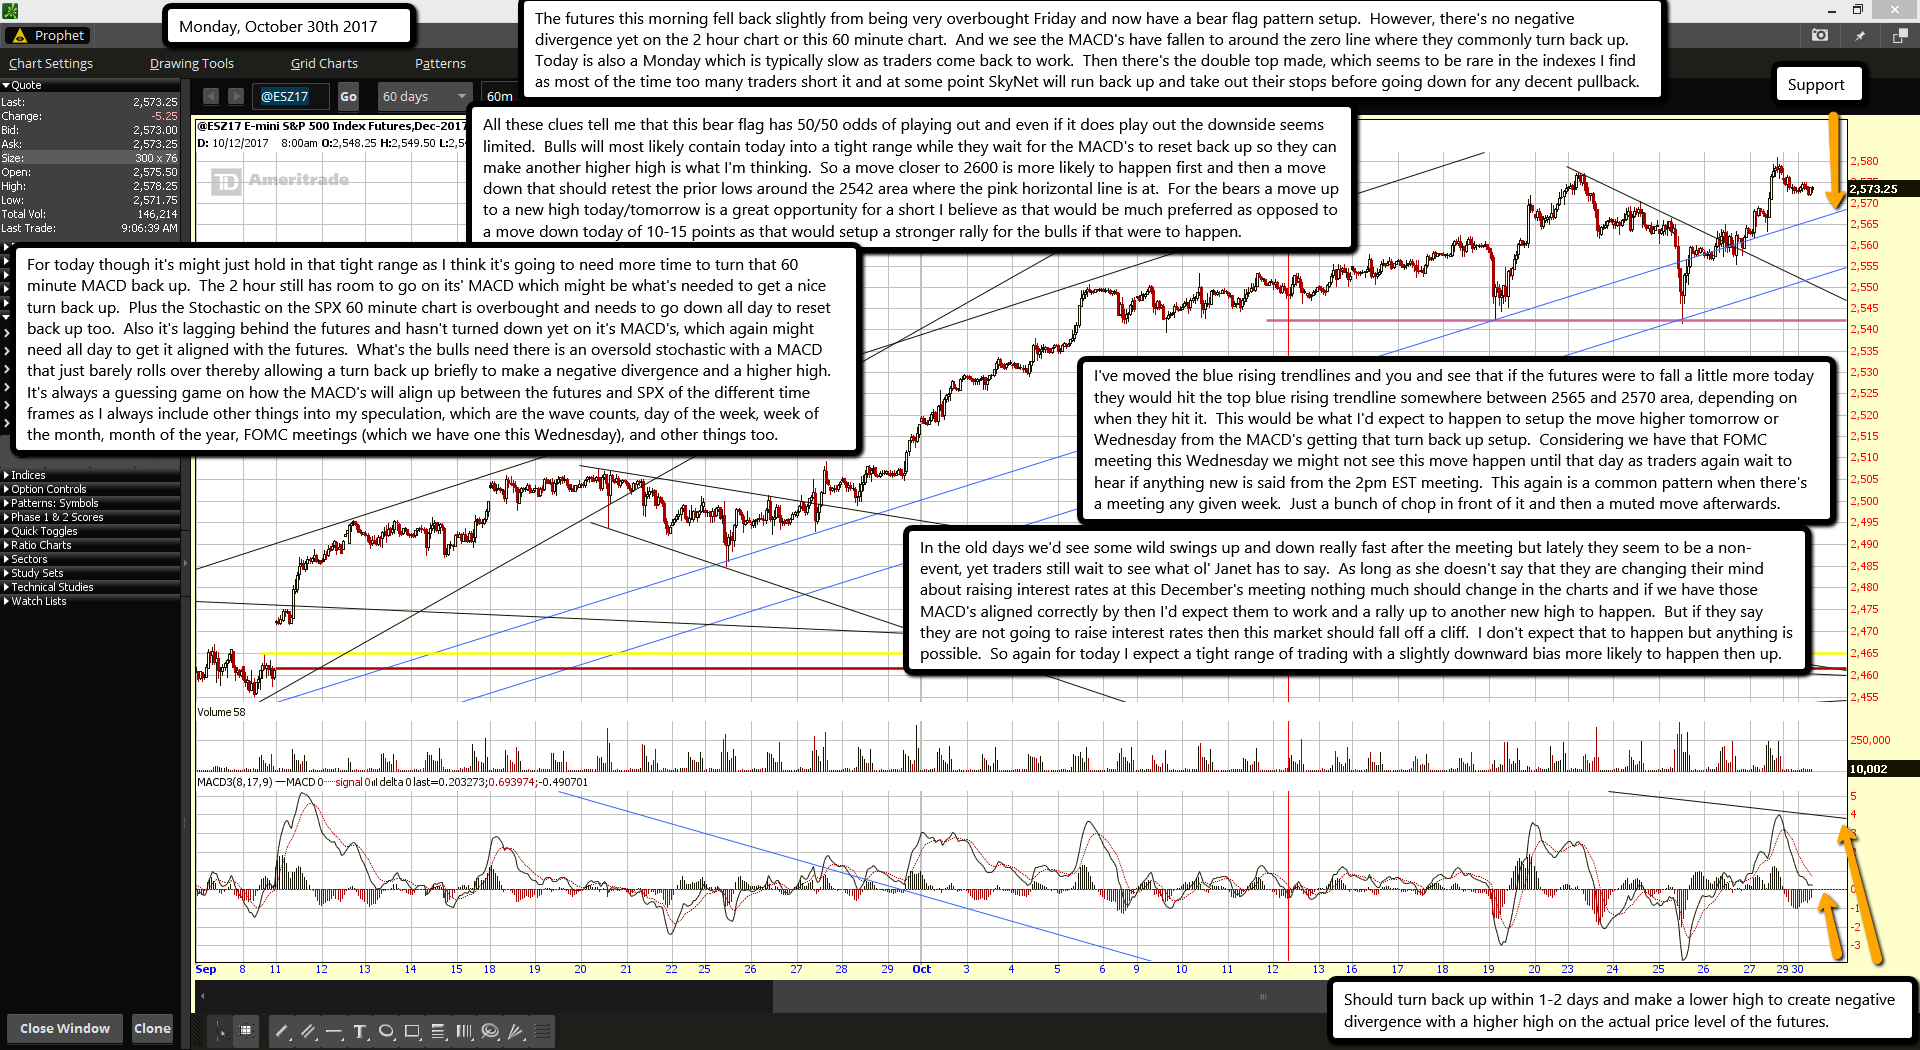
The futures this morning fell back slightly from being very overbought Friday and now have a bear flag pattern setup.  However, there's no negative divergence yet on the 2 hour chart or this 60 minute chart.  And we see the MACD's have fallen to around the zero line where they commonly turn back up.  Today is also a Monday which is typically slow as traders come back to work.  Then there's the double top made, which seems to be rare in the indexes I find as most of the time too many traders short it and at some point SkyNet will run back up and take out their stops before going down for any decent pullback.

All these clues tell me that this bear flag has 50/50 odds of playing out and even if it does play out the downside seems limited.  Bulls will most likely contain today into a tight range while they wait for the MACD's to reset back up so they can make another higher high is what I'm thinking.  So a move closer to 2600 is more likely to happen first and then a move down that should retest the prior lows around the 2542 area where the pink horizontal line is at.  For the bears a move up to a new high today/tomorrow is a great opportunity for a short I believe as that would be much preferred as opposed to a move down today of 10-15 points as that would setup a stronger rally for the bulls if that were to happen.

For today though it's might just hold in that tight range as I think it's going to need more time to turn that 60 minute MACD back up.  The 2 hour still has room to go on its' MACD which might be what's needed to get a nice turn back up.  Plus the Stochastic on the SPX 60 minute chart is overbought and needs to go down all day to reset back up too.  Also it's lagging behind the futures and hasn't turned down yet on it's MACD's, which again might need all day to get it aligned with the futures.  What's the bulls need there is an oversold stochastic with a MACD that just barely rolls over thereby allowing a turn back up briefly to make a negative divergence and a higher high.  It's always a guessing game on how the MACD's will align up between the futures and SPX of the different time frames as I always include other things into my speculation, which are the wave counts, day of the week, week of the month, month of the year, FOMC meetings (which we have one this Wednesday), and other things too.

I've moved the blue rising trendlines and you and see that if the futures were to fall a little more today they would hit the top blue rising trendline somewhere between 2565 and 2570 area, depending on when they hit it.  This would be what I'd expect to happen to setup the move higher tomorrow or Wednesday from the MACD's getting that turn back up setup.  Considering we have that FOMC meeting this Wednesday we might not see this move happen until that day as traders again wait to hear if anything new is said from the 2pm EST meeting.  This again is a common pattern when there's a meeting any given week.  Just a bunch of chop in front of it and then a muted move afterwards.

In the old days we'd see some wild swings up and down really fast after the meeting but lately they seem to be a non-event, yet traders still wait to see what ol' Janet has to say.  As long as she doesn't say that they are changing their mind about raising interest rates at this December's meeting nothing much should change in the charts and if we have those MACD's aligned correctly by then I'd expect them to work and a rally up to another new high to happen.  But if they say they are not going to raise interest rates then this market should fall off a cliff.  I don't expect that to happen but anything is possible.  So again for today I expect a tight range of trading with a slightly downward bias more likely to happen then up.

s2Member®