Saturday, December 20, 2025
Home Blog Page 126

Bull Fever…

282

bull-market

Looks like the Bulls blew past the Bears like they were standing still today!  A bomb was set off outside of a JP Morgan office in Greece.  No one was hurt, but I'm sure some important records about anything to do with Greece, were burnt up in the explosion.  After all, how else can you cover up all the illegal deals you did with Greece?  It's the America way of course.  I guess the market seen the news as positive, so the rally continued.

Unless some major news event happens, I'd expect tomorrow to be a pause day before moving higher to the 110.34 spy level.  The 108.00 level is the current pain for this Friday, so it could slowly drift on back down to that level by then.  That's the best way too screw the bulls and bears both, so that would be my best guess as to what should happen the rest of the week.

I have too admit, this has been a big disappoint for me, as I totally missed this move up, and got caught short as well.  The daily charts are looking bullish now, and the 60 minute chart is a little overbought, but it still could run a little higher.  The bulls are back in control of the tape now, as the light volume clearly dictates that.

During the large down move, volume was well over 200 million, and even over 400 million on day.  Today was only about 150 million, which is the same as it's always been during this bear market rally from the March 2009 low.  Light volume usually means an up market, as the big institutions are waiting for higher levels to start selling again.  Where, and when is the question I can't answer.

Not much else to add.

Red

Weekend Update…

623

greece-is-the-wild-card

This has been a really tough week for me, as the expected next leg down didn't happen.  I'm now underwater pretty bad in my put spread that I purchased back on Friday the 5th.  I completely forgot a post I did a month ago, showing a fake print of 1047 on the spx, or I would have known we weren't going any lower yet.  Isn't it's funny how we pierced that level (1044) a little, and immediately bounced back up.  If that doesn't show you that the market is controlled and manipulated... I don't know what will.

Sundancer also caught that fake print and seems to agree with me that this is clearly the way wall street informs their buddies as to where they plan on taking the market to.  By the way, thanks a lot for all the great comments you post Sundancer.  I'm sure everyone will agree that you are very knowledgeable about the market, and have helped myself and many others that read this blog.  So, keep up the good work...

As for next week... it could go either way?  I really just don't know at this point.  I do agree with Sundancer that a gap up Tuesday is very likely... but where we go after that will probably depend on if they can hold that gap or not.  How many shorts are left in the market to squeeze?  I don't know?  If there is enough of them left, then it's very possible that they run the market to 110.34 spy before selling off again.

The news on Tuesday about the Greece bailout problem could be the reason to push it up or sell it?  It's seems that there aren't any bears willing to go short right now, for fear of being squeezed, and there also isn't any bulls willing to go heavily long either.  In fact, I suspect that most bulls are waiting for 110.34 to sell their long positions.  We are truly stuck in this rising wedge or channel, and no one is taking on any large risk right now.

That's why everyone is day trading, which produced the wild intraday swings that we had last week.  Neither side knows which direction this tape is going to go in.  It's great for day traders, but murder for swing traders.  I'm not going to post any charts this time as not much as changed from Thursday post, so you can look at those for reference.  I will tell you that The Chart Pattern Trader has 2 video's up, and should be watched to understand where we are, and what could happen next week.

Cobra's Blog is also excellent, and has some interesting statistics on his weekend post.  I'm certainly not too proud or self centered to try and keep you here on my blog only, and not tell you about other great chartists and blog writers.  I want everyone to succeed, and if I can't provide you with that information, I'll do my best to guide you to sites that I think are important to read.  I didn't create this blog to get a huge following, or generate traffic.  I only put it up to help others and for me to keep a record of my success, and failures.

I would be doing everyone a disservice by not informing you of others that I respect, and I won't do that too you as I wouldn't want it done too me.  I was clearly wrong on my call last week for the sell off, as it didn't happen.  Will it happen this week, and make my calls just too early?  Possible?  I don't know?  I do know that the news coming out about Greece this Tuesday will make a big impact on whether we continue higher to 110.34, or sell off one more time before a nice relief rally occurs.

I will definitely be on the lookout for another fake print as to see where they want to take the market next.  (Sundancer, please keep your eye's glued to your monitor too... just in case I miss it).  I do see us going down more in March, as I believe we will go down to that 900 area.  But, that's too far out now to worry about, as there will be many bounces along the way.

So, for Tuesday I'm expecting a gap up.  After that, it's up to the Greece news to determine the next move.  If it's not what wall street wants to hear, we could see some big selling.  Remember, that would put us in a wave 3 of wave 3 down, and it could fall pretty fast.  This is assuming that the wave count I posted on Thursday is accurate.  If it's not, then any move down would just be a wave 2, with and expected wave 3 back up to occur.

By the way, the current pain on the SPY is at 108.00, but that doesn't mean that's where they will close the tape on Friday (OPX).  It's been wrong many times in the past, so I don't hold to much weight to it anymore.

Best of luck to all of us, and keep up the great comments gang...

Red

Bear Squeeze…

131

NO Post for Friday, I'll have my weekend post up by Sunday night...


Man that hurt today!  I am so ready to bail on my position... that is now largely underwater, but just when I do... this market will tank!  So, I really had to bite my tongue and hold my fingers away from the panic button today, as I was very close to bailing out.  But, this stopped me...

 The-Chart-Pattern-Trader-spy-weekly-chart-02-11-2010

As you can see, the moving averages have rolled over and are still pointing down.  This is totally different then the last 10 months or so, as they were pointing up then.  This is the real deal!  This market has HUGE overhead resistance pointing down on top of it.  It's simply can't run up too much further.  The question is... will it sell off before this option expiration?  I believe it will.  How far down?  At this point, I think 1044 is definitely likely.  The next level at 1020 will be hard to break before opx.  It could happen, but I just don't know right now.  That means that the 980 level has a low chance of hitting.  It's possible, but odds are against it now.  Panic would have to set in probably, so I won't rule it out.  Remember, the market falls a lot faster going down then up.

I have now changed the Elloittwave count, as to the market still being in Mini Wave 2 up, of larger Intermediate Wave 3 down, inside larger Minor Wave 1 down.  This is one of the things I don't like about EW, as you always have to change your count.  Just when you think you have it figured out... Bam, it expands out to a longer wave, or changes direction.

That's why I look at the Technical Analysis first, and then try to forecast the waves that we are in.  I think EW is pretty good on a larger scale, but the smaller one's are hard too determine.  Ignoring EW on this chart, and just focusing in on the TA's, I see a Bear Flag from the sharp sell off on last Thursday to the 5 days of sideways to up consolidation that is currently underway.

You can also see that the UP Volume today was only 221.4 Million.  Where are the Big Institutions?  They didn't do any buying today... did they?  It looks like they did do a Lot of Selling last Thursday... look at that DOWN Volume... HUGE!   Notice that every time we had a big down day, there was also big volume.  Now I know that the entire rally up from the March, 2009 low was on light volume.... but, the Monthly and Weekly charts were supporting the move, as they were both point UP!  Where are they pointing now?  You guessed it... DOWN!

cobra's-daily-spy-chart

That's the BIGGEST reason that I didn't bailout on my short positions today.  Yes, I'm underwater badly on them, but the chart still tell me that a big sell off is coming... and before OPX!  Notice the downward trend line that Cobra drew on his chart.  As you can see, the Bulls could break through it.  By the way, Cobra's link is on my blogroll, and you should visit his site, as he is excellent with his TA work.

Next up is the 60 minute chart from the chart pattern trader.  Of course I've added my notes on it, (his link is also on my blogroll).  You can see that the MACD still hasn't rolled over.  It almost did yesterday, but it turned back up and is still going up.  The Full STO is above the 80 level and looking like it wants to turn down.  These indicators can sometimes remain in overbought or oversold territory for longer then you want them too... eating away at your options.

The-Chart-Pattern-Trader-spy-60-minute-02-11-2010

The downward channels line were broken today and that is also of big concern.  Will they fall back into the channel, or is this a real breakout?  I have to focus on the volume behind it, and I don't see it going up too much further.  There just isn't any good news left to move it up.  Low volume up moves worked well when the Monthly and Weekly charts were supporting the move, but they are now pointing down.

It's like the monthly chart is your Dad, and the weekly chart is your older brother.  You are the young boy at school, and you can get away with running you mouth a little, as you have your older brother and your Dad backing you up.  What happens when your Dad and older Brother are gone?  Or worst, they are against you...

That's my primary reason for hanging on in this Bear Squeeze.  Good ol' Dad and the older brother aren't around anymore.  My only fear right now is the Daily chart below.  It looks like the MACD is rolling back up.  Now again... it's just like the 60 minute chart, as it too... could turn back down just like the 60 turned back up.  Remember, it looked like it was going to rollover, but hooked back up today.  The same thing can happen to the Daily chart.  It could turn back down just as easy.

The-Chart-Pattern-Trader-spy-daily-02-11-2010

The good news is that it hit the lower channel trendline and couldn't get through it.  That's called a backtest, and as you can see, this is the second attempt at trendline... with it failing both times.  I'll admit that the market could continue a slow grind up... walking the trendline, and not go down until after opx.  But, I really think it's running out of time, and energy.  Too many resistance levels overhead, and too many trendlines from different sloping channels.  This market is dying, and it just hasn't proven to me that it can stay up here very much long.

I'm not just being stubborn here folks, the charts just don't support the up move.  If they did, I'd be bullish, and go long.  Now yes... I'm a bear at heart, but I will trade the long side if the charts support it.  They don't... at least what I'm see doesn't.  The daily chart is the only chart that is still neutral, and looking bullish.  But, until those MACD lines cross, I'm unconvinced.  The larger weekly and monthly charts tell me that the MACD line will roll back down and allow the chart to put in 3-4 lower histogram hills, with each hill getting smaller until they crossover into positive territory.

Best of luck to all of us...

Red

The Power Of Wave 3’s…

1,151

311333

The market is certainly not giving up easily... but neither am I!  It's "do or die" time now, as every chart I can find, on all the different time frames, is now set up for a Wave 3 Down.  From the smaller time frames to the larger time frames... we have a whole lot of wave 3's coming up next.  That's what I see in Elliottwave term, but I also see the same charts forming Bear Flags from a Technical Analysis standpoint.  Let's go over the Technical Analysis first...

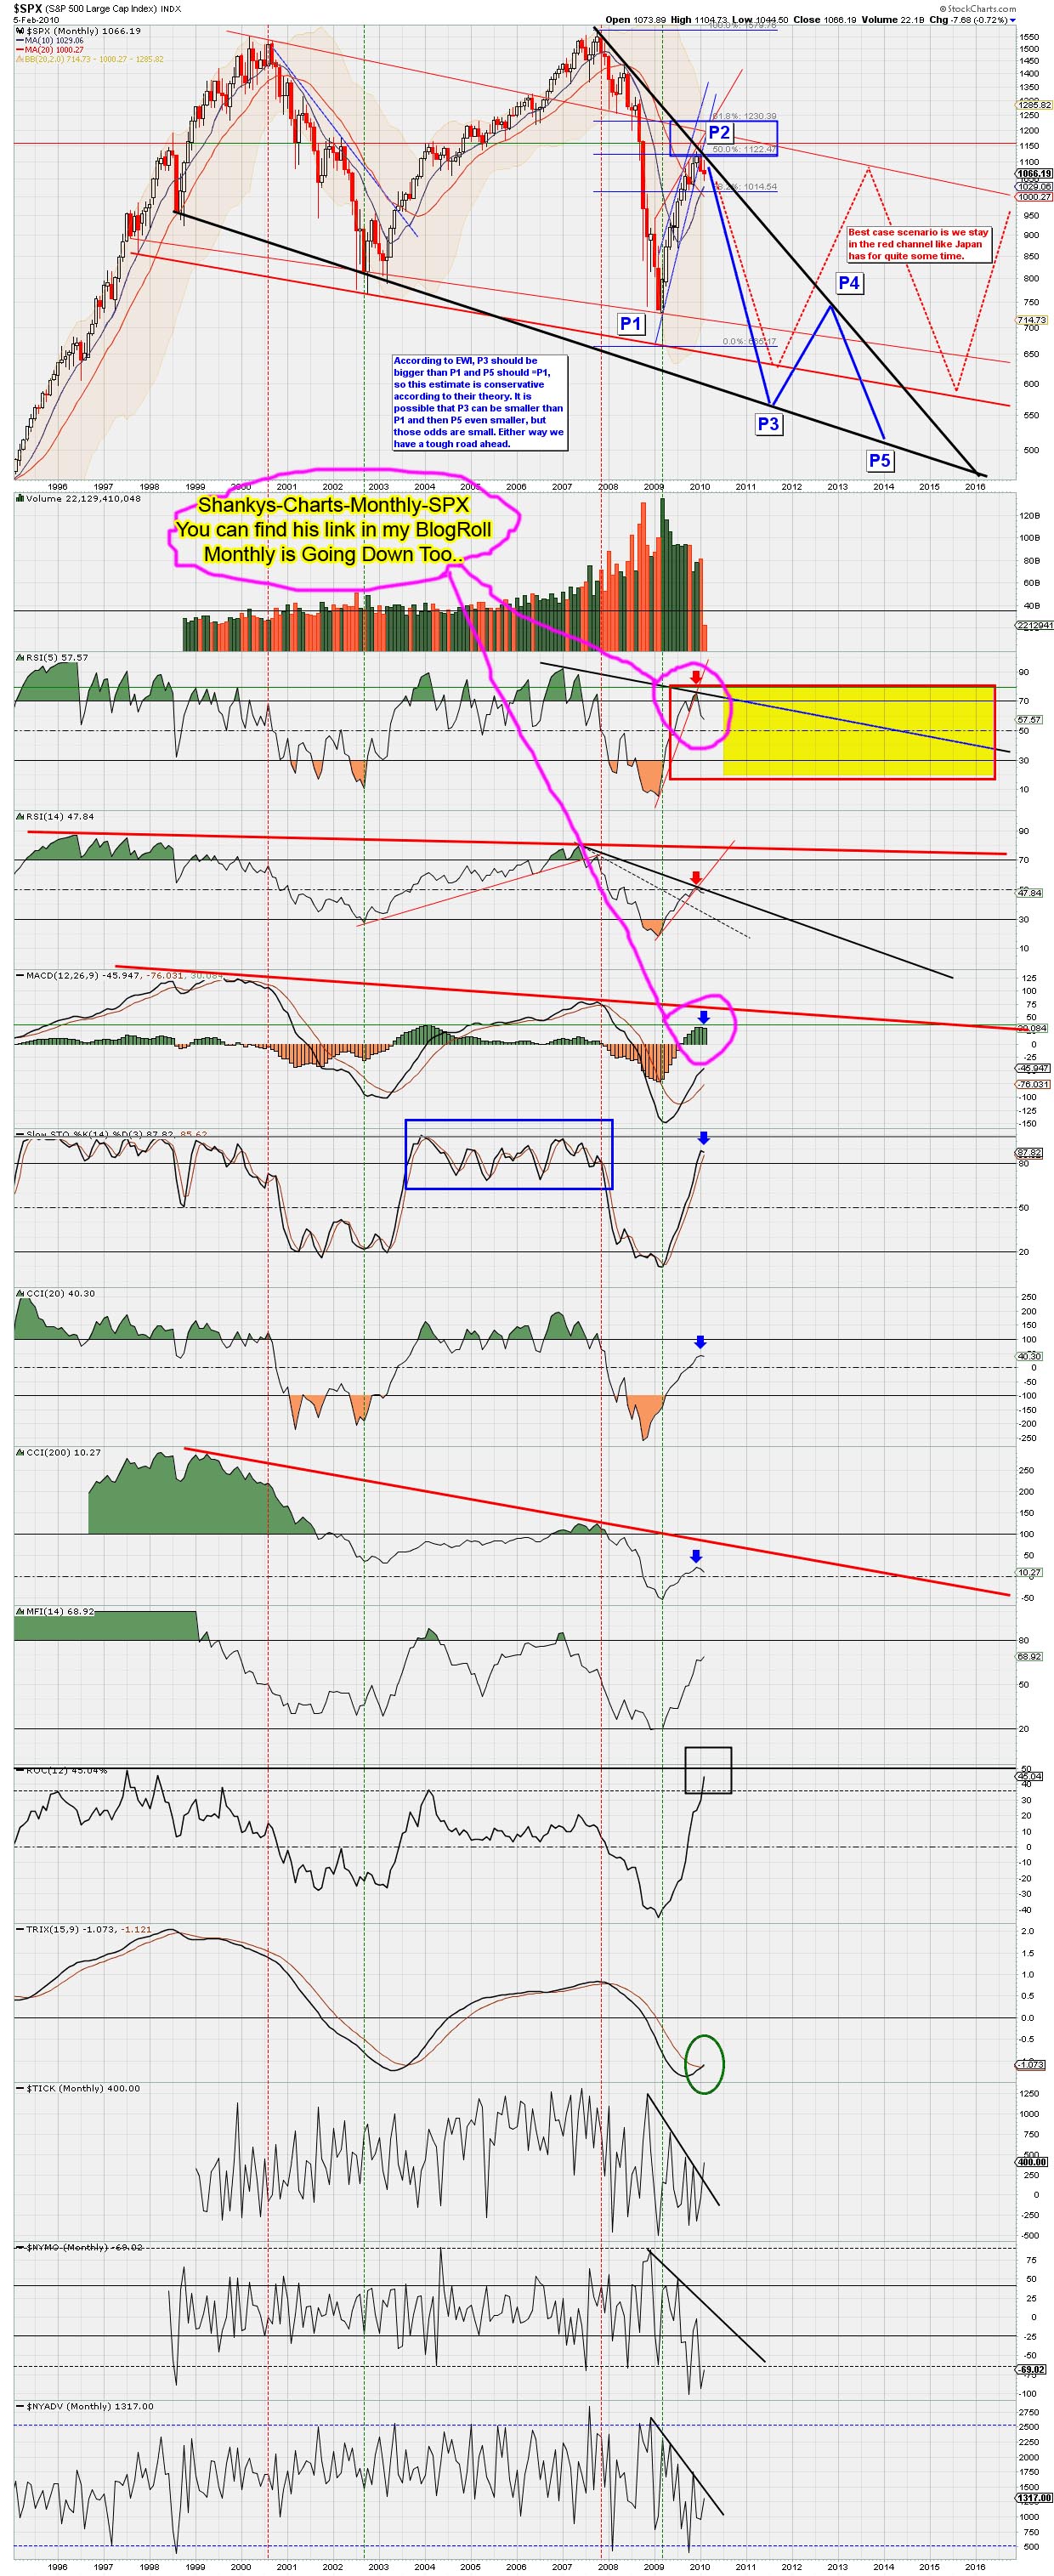
Technical Analysis point of view... first up, the Monthly Chart

Shankys-Charts-Monthly-SPX

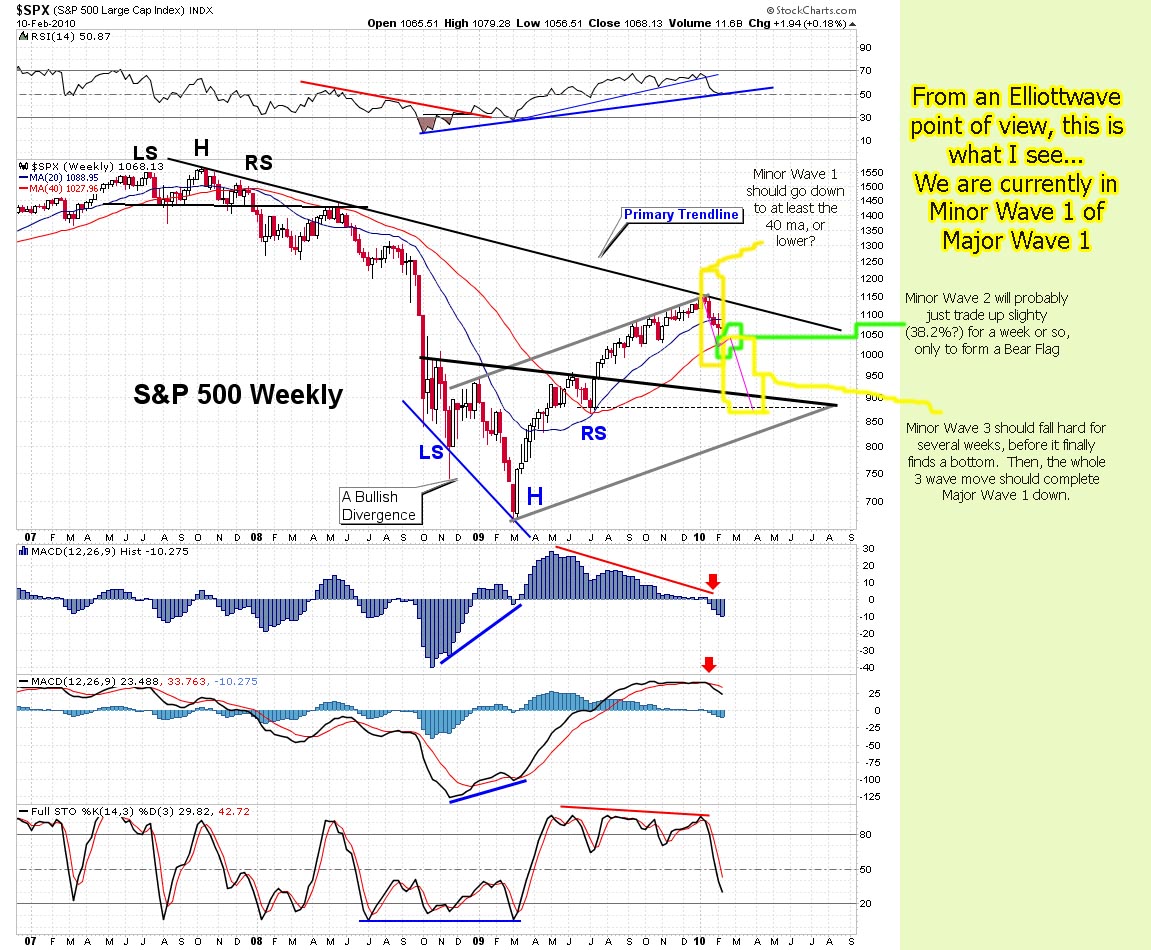
Technical Analysis point of view... second up, the Weekly Chart

The-Chart-Pattern-Trader-spy-weekly-chart-TA-02-10-2010

Technical Analysis point of view... third up, the Daily Chart

The-Chart-Pattern-Trader-spy-daily-TA-02-10-2010

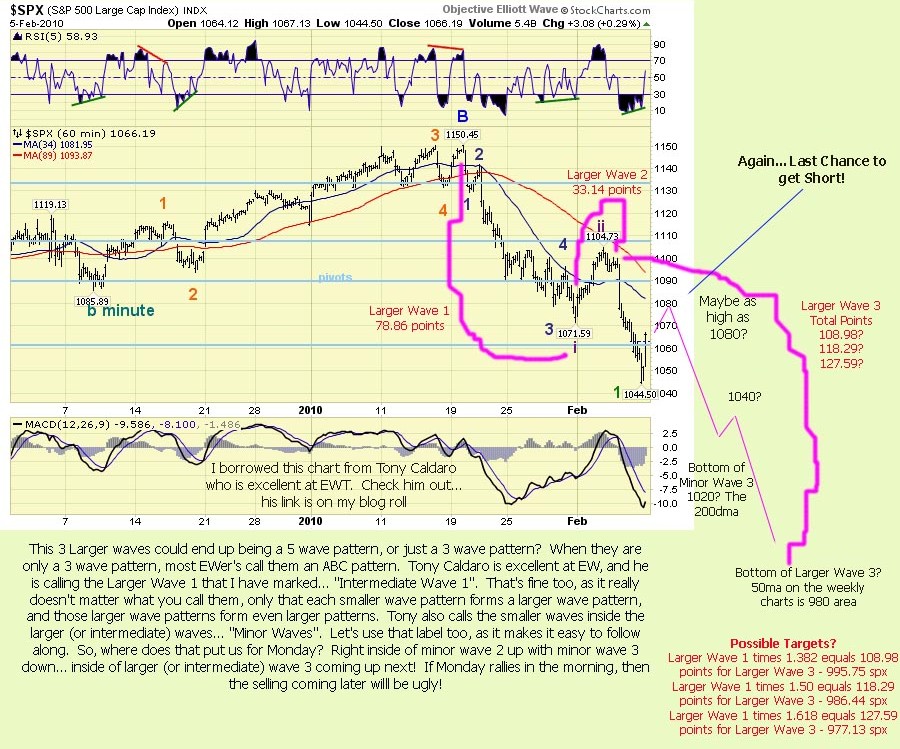
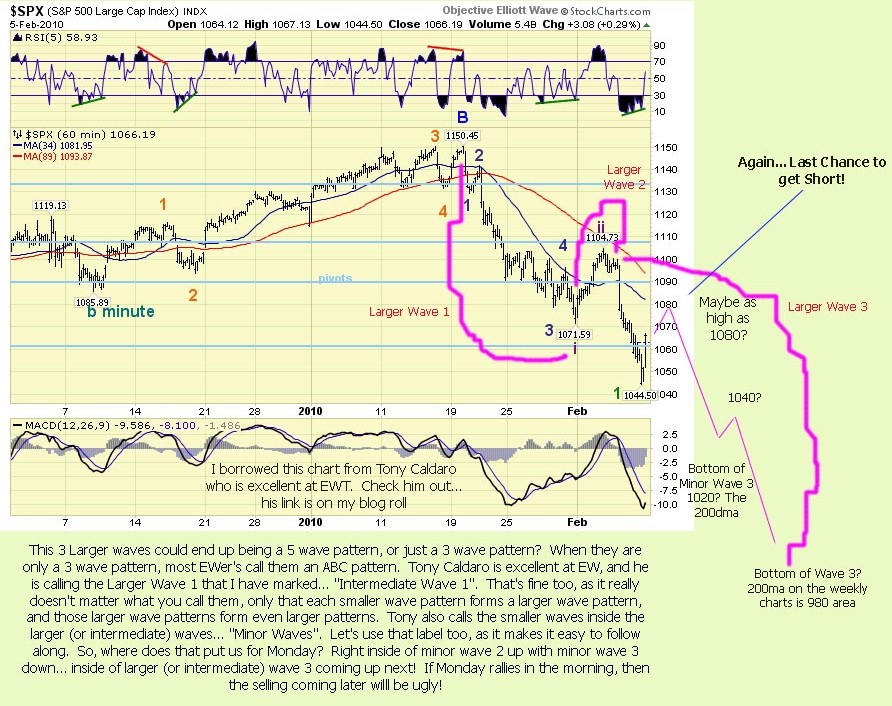
Technical Analysis point of view... fourth up, the 60 Minute Chart

The-Chart-Pattern-Trader-spy-60-minute-TA-02-10-2010

Technical Analysis point of view... last up, the 15 Minute Chart

The-Chart-Pattern-Trader-spy-15-minute-TA-02-10-2010

Now, let's tie all the Technical Analysis charts into Elliottwave, and try to figure out the next move, as well as what wave we are now in?

Elliottwave point of view

The Monthly Chart has us in Primary Wave 3

Daneric-Charts-Big-Picture-SPX

Elliottwave point of view

The First Weekly Chart has us in Major Wave 1

The-Chart-Pattern-Trader-spy-weekly-chart-02-10-2010

Elliottwave point of view

The Second Weekly Chart has us in Minor Wave 1

Shankys-Charts-Weekly-SPX-Short-02-10-2010

Elliottwave point of view

The Daily Chart has us in Intermediate Wave 3

The-Chart-Pattern-Trader-spy-daily-02-10-2010

Elliottwave point of view

The 60 Minute Chart has us in Mini Wave 3

The-Chart-Pattern-Trader-spy-60-minute-02-10-2010

Elliottwave point of view

 The 15 Minute Chart has us in Micro Wave 3

 The-Chart-Pattern-Trader-spy-15-minute-02-10-2010

So, that means we now are starting down into (from the larger wave to the smaller wave) Wave 3,1,1,3,3,3... Whew!  That's a lot of 3's!  If you don't know how powerful wave 3's are, go do some research on it and you'll get the big picture.   I'll really be excited when they all turn into Wave 3's!  That should start this late September, and will truly be a "Once in a Lifetime" experience.

So what's up for tomorrow you ask, and why am I still holding my put spread?  Because I'm expecting a move down to at least 1020 to start as early as tomorrow.  I must admit that this has been a learning experience for me, as I'm only now starting to see how all this all ties together.  I didn't see that last week, and missed several important pieces to the puzzle.

That doesn't mean I'm going to get every call right... of course I can't do that.  But, as I learn more and more about how TA's, EW's, and news events... all tie together, I'll start getting much better entry points.  I wasn't able to see that last week, and missed out on all these smaller wave patterns developing.  I could have waited until today to go short, and would have been in a lot better position.

Now, my current position is underwater due to the time decay, and the small move up.  I purchased a 106/101 vertical put spread on Friday when the market was around 106 (spy), and now we've moved up a point, and lost 4 days of time.  I would have caved in and sold them for a lost a month ago, when I didn't understand the charts as well as I do today.  But not now, as the more I learn, the more patience I become.

Since I'm learning how to read these charts much better, I hope to get a whole lot better entry point in a couple of weeks, when Minor Wave 3 starts down.  Timing in this game is everything.  The TA's tell me which direction, and then I try to match the EW patterns up to match with that.  I believe it's easier now, as we have started a new trend down.  During the sideways market time periods, you had might as well throw EW out the window, and use only TA's.  But, for now, they are both lining up perfectly.

It's up to you to make your own decision as to "how to trade" this market of course, and I'm only showing you what I see.  I was wrong on calling Monday a big down day, and wrong again on Tuesday and Today.  This isn't easy you know... if it was, everyone would be rich.  I putting more and more pieces of the puzzle together, which should allow me to narrow down the exact time to get in short... at least for the next time I hope.

I do appreciate all you who visit, and I'm glad you have patience with me while I learn.  Study the charts above and come to your own conclusion.  Let me know what you see... as I see a big down move coming, starting tomorrow most likely.

If I didn't believe in what the charts tell me, I'd have already bailed on my position now.  In fact, a week ago I would have!  Why?  Because I've been studying my ass every day now for the last week, and I've learned a lot more about the market in that short time period then I learned in the last 6 months.  Whether I'm right or not, I don't know?  But, I feel like I'm able to assemble this puzzle much better today, as everything was scattered out in pieces months ago.

Anyway, I'm just rambling now.  Best of luck to all of us tomorrow... and a big thanks goes out from me to all the great chartists that I read regularly (and borrow their charts from them... hope they don't mind?)

Red

Got Fooled On That One…

235

I was really looking for the market to roll over hard today, and it looked like it was going too... until some news rumor was released that said they were going to bailout Greece.  That news was all the excuse the market needed to rally up to that 1080 level that I thought it could go too, but was highly unlikely.  The news said that Germany was going to bail them out, and then it was later reported as false.  Coincidence?  Maybe?  Or, maybe it was designed to shake out all the bears?

I really didn't think it had the energy left to rally up that high, but the market will fool you when you least expect it too.  This doesn't change my belief that we are going down... it only delays it for another day.  Looking at the chart below, you can see that we tagged the upper trendline around 1080, and we are now getting ready to start minor wave 3 down, inside larger/intermediate wave 3 down.

Tony-Caldaro-60-minute-SPY-chart-02-09-2010

Once it starts, it should fall quite fast, and not allow any bears to get short.  That's probably why they ran the tape up today too... to squeeze out all the bears, and suck in some more bulls.  I didn't see this move coming, or I would have waited for it.  Of course if I had seen it, they wouldn't have done it.  Just the way they like it... trick everyone.

From looking at the charts, it appears that they must start minor wave 3 down, (inside larger/intermediate wave 3) tomorrow, as they've hit their upper target zone now, and must either bust threw it, or fall hard.  There is no doubt that we are at a crossroads here, and either fall hard or rally hard.  I have too trust the charts, and they still point down.

That's why I remained short today, even though that ramp up put my positions underwater a little.  These wave 2 up's are always violent and are designed to shake out the bears.  I remain short, and un-shaken.  I still see this week as down, with a fore-casted low of 1020.  No one said trading was easy, and no one is always right.  I was wrong on Monday being a huge down day, and wrong again on today selling off.

Could I just be off a day or two?  I believe so, and hope so... Even though "hope" is a useless emotion, and shouldn't be brought into trading... I'm crossing my fingers on this one.  The thing that keeps me confident is the Technical Analysis.  It still is extremely bearish on many, many charts.

The fact that the market couldn't break through 1080 was huge, as that resistance held firm.  There are 3 different trend lines intersecting at that level.  It's going to have too gap above it to break through it.  That means some commitment on the bulls, and I just don't see it.  The volume going up was so low, it wasn't hardly reading on my charts, yet the sell off volume was huge.

That tells me that retail traders bought the Greece rumor and drove up the market, and big intitutions sold it.  I'm not buying into this rally.  It may seem like I'm being stubborn, but I'm not.  I'm just sticking to my belief in what I see in the charts... which is bearish still.

As you may know, I use a lot of different ways to see where the market is going.  I use Technical Analysis, Elliottwave, Support and Resistance Levels, and tie all those together with news events.  They all still tell me we are going down.  Right or wrong, I stick with my forecast.  I remain short.

Red

Could War In Yeman Crash The Stock Market?

1,725

On Friday I overlooked the 60 minute chart, which threw the Black Monday off by a day (that's assuming it falls hard tomorrow, as I'm expecting it too?).  Yes, it did go down today, but the larger down day should be tomorrow.  It took most of the morning for the 60 minute chart to rise back up and then start to roll back over to the down side.

This formed our minor wave 2 up, inside larger/intermediate wave 3 down.  For tomorrow we have the Monthly, Weekly, Daily, 60 Minute, and 15 Minute charts ALL Point Down!  If this market doesn't sell off at least 200 points on the Dow... I'd be shocked!  I'm really expecting a 300-400 point sell off... a Black Tuesday instead!  I should have seen that on Friday, but I review so much material that I just missed it.  Arrrggh!

So, I got in a little early, but I'll still profit handsomely as the next move down occurs.   Here's a chart of where we are now, and what I'm expecting...

Tony-Caldaro-60-minute-SPY-chart-02-08-2010

It looks like we just completed minor wave 2 up, inside larger/intermediate wave 3, and are ready to start going down hard tomorrow.  While it is possible that minor wave 2 up isn't done yet, as it could make an ABC move up to 1080 or so, I don't believe it will.

The only thing that could delay the move down is that the market could be waiting for the job's number on Thursday.  But, I really doubt that they are going to rally up into Thursday number's.  Instead, they fear bad numbers, so they would sell off before hand.

The charts are saying that we have a 300-400 point drop tomorrow, but I don't like to call out number's... only that the odds of a big down day is quite high.  Doing the charts, and looking at the wave count, it goes like this...

  • We are most likely in Primary Wave 3 down with 1150 being the final high from the March, 2009 low of 666.
  • We are also in Major Wave 1 down from the 1150 high, and it should end at the fore-casted low around 980 this week.  (This assumes that Major Wave 1 will only have 3 intermediate wave in it, not 5 waves... which it could have?).
  • We are still in intermediate wave 3 that started at 1105 and should again complete around 980 (that's a forecast-ed projection level, and it could be wrong?)
  • Finally, we just completed Minor Wave 2 up, inside intermediate wave 3 down... or we are still in Minor Wave 2 up, and it's going to make an ABC move up to 1080.  NOT Likely, but possible.  If so, then we will have to defy gravity and roll the 60 minute, and 15 minutes charts back up quickly tomorrow morning.  I don't see it happening.

So, from looking at the charts, counting EW's, finding support and resistance levels, and tracking the MACD's on all the charts... they all point to a large down day tomorrow!  Could it be "Black Tuesday", instead of Monday?  Possible I guess?

Let's look for news that can cause the event to happen.  MobyDoc just posted this link on my weekend post.  It's talks of another terrorist attack on the 11th, or something bad?  When the market reads this news, are they going to rally until Thursday to see if it happens, or sell like a bat outta hell before they get caught long?  I think you know the answer to that...

http://www.foxnews.com/story/0,2933,585143,00.html?test=latestnews

http://english.aljazeera.net/news/middleeast/2010/02/20102905431956447.html

I've spoken about the "False Flag" events on my weekend post.... in the comment sections.  I'm going to post a video here for you to watch.  It's a long video, but well worth your time.... as we don't have a lot left.  I know that some of you might find it hard to believe in Aliens and stuff... but it's all real, and what happens affect the stock market.

There is now hundred of ships off the coast of Yeman.  They are from every nation in the world that has a Navy.  What are they doing there you ask?  There is a Huge Stargate (yes, like on the TV show) under the sea that is opening and the world elite is worried about it, and are most likely trying to stop it.  Supposedly it is going to render all the world's weapons worthless, and not able to work anymore.

Of course the world elite don't want that to happen as that would make everyone in the world equal, and they couldn't use us as their personal slaves anymore.  No more money needed, as the world goes through a positive transformation.  This is a good thing... for everyone who is honest and good, but a bad thing for the evil people who run the planet.

We are about to go through a wonderful transformation on, or around December 21st, 2012.  Call it Heaven for us good people, and Hell for those bad people.  Your religion isn't important, only what kind of person you really are "on the inside" is what's really important.

So, how do you keep the people away from the Gulf of Aden, (which is right off the coast of Yeman)... you stage another terrorist attack, which are better known as "False Flags". Read this...

http://www.reuters.com/article/idUSTRE6173II20100208

It keeps every one away while you all work to stop the Stargate from opening, or try to control it some how?  What they don't understand, is that the ending story was already written in the Bible... and the good guys win, the crooked banksters, gangsters, thugs, Illuminati, or whatever you what to call them... LOSE!

Of course they need to pay for the next staged war that we are going into, and how do you do that?  Crash the stock market of course.  Still think I'm nuts?  Again, when is a conspiracy NOT a conspiracy?  When it's true of course...

Here's on more interesting video for you... (by the way Goldman Sachs and the Carlyle group are co-owners of Kinder Morgan)

Are you starting to put the pieces together yet?

Red

Weekend Update…

81

 wallsteet-attacked-by-godzilla

Wall Street is Coming under attack!  Job losses, fake earnings, corporations defaulting on debt, bailout's for the rich, housing markets underwater... all spell a CRASH Coming!  After all, how else can you paid off your debt... just wipe them out instead..."That's How"!

If you think that this is just another 10% correction, and that it's now over... you're dead wrong!  It hasn't even started yet!  Want the evidence?  I'll direct you to the 3 charts below (found on Shanky's Charts... link on my Blogroll)...

Daily Chart

Shankys-Charts-Daily-SPX -02-07-2010

Weekly Chart

Shankys-Charts-Weekly-SPX-02-07-2010

Monthly Chart

Shankys-Charts-Monthly-SPX-02-07-2010

So, could Monday be a "Black Monday"?  I don't know?  But the rest of the week isn't looking good.  Wherever we peak on Monday (1070-1080... or maybe we already completed minor wave 2 up?), the selling to come after that will be huge.  It will be a minor wave 3 inside a larger wave 3... both inside Primary wave 3 (or C).  It's going to be scary from here on out.  At some point there will be "Panic Selling"... and I might not even want to make a daily post during those times?

Although I didn't create this bubble, I really don't want to be the center of an attention.  As a matter of fact, I never created this blog to gain a following... only to post my thoughts.  I don't use any type of marketing or even any other type of blog optimization technique's.  I really don't want any traffic to the site.  But apparently I have quite a few people reading it daily... that don't comment (which is fine).

I'm just looking to make enough money to retire on, and then relax and enjoy life a little.  So, if my daily posts become weekly posts... you'll know why.  (Not saying that I'll stop posting... only that I might take some time off at some point).

Moving on...

Tony-Caldaro-60-minute-SPY-chart-02-07-2010

Here's what I see for next week... Monday should have the continuation of minor wave 2 up, inside of larger wave 3 down.  When that ends, probably by midday Monday (but it could go into Tuesday?), the minor wave 3 down inside of larger wave 3 down will start.  I think we will bounce on the 200dma (daily chart) around 1020, and come back up for minor wave 4 (still inside larger wave 3 down), and have another push down later in the week for minor wave 5 down (possible target... the 50ma on the weekly charts, about 980).

Remember, the 1000 level is important to the bulls, and a break of it would have the bears jumping on the short side faster then you can blink an eye!  Then once all the bulls have sold out and the bears are on the short side... Bam!  ...here come the buy programs to rally us back up for Larger Wave 4!  How high?  I don't know?  But, it will probably be in line with option expiration on the 19th.

That's what I'd do if I were them

Red

P.S.  Keep in mind folks... nothing is written in stone.  This is only a forecast of the possible moves coming.  If the government comes into the market again, with a "Stimulus Package Number Two"... it all changes.  But for now, I believe they won't do that.  Not until the banks get done unloading their shares (a few months?).  Then they will come to the rescue again.

"Lather, Rinse... and Repeat"

Black Monday?

227

black-monday

Look out for next week... we're about to start a large wave 3 move down!  Destination... Unknown?  Monday is an "iffy" day, as we are now in a smaller wave 2 up inside of a larger wave 3 down.  So, it might not rollover until Tuesday, (but I created the image above just in case it does... as I thought it was cool looking).  I'll have more on my weekend update, but for now we bears might have to endure a small amount of pain while the tape pushes up to 1080 or so Monday morning.

That's about as high as I can possibly see it getting.  Honestly though... I don't think it will even come close.  We very well could drop Monday afternoon and not stop until we hit 1020 or so.  I waited all day for a chance to get in short and the tape looked so weak that I didn't think I'd have a chance to.  So, I got in around 1pm and the rally in the afternoon (unexpected... of course) put me a little in the negative on the position.

But, I'd already planned to hold it until OPX if necessary.  It's a 106/101 SPY put spread.  That means I bought the 106 and sold the 101.  When we hit the 102 area (not "IF", but "WHEN"), I'll get out and wait for a bounce to occur.  About 102.50 is where the 200dma is on the daily charts.  That should give the market a couple of days of a bounce, before more selling happens.  We could hit that level Monday if people start to panic in the afternoon?  Who knows?  It should be there before the week ends though... so don't panic!  Stay short!  We have lots more downside to come.

As for the bounce from the 102 area, I don't know yet if I'll play it back up or not, as it's too dangerous to go long right now.  I might take a small position, or just wait for it to peak and go short again.  We'll see when will cross that road.

Red

P.S. I know that it might seem like you have missed the big move and it's going to rally back on you... well stop thinking like that and relax!  The Monthly, Weekly, and Daily chart's are all rolling over.  Were going down to the low 900's... before the March expiration most likely.  Hang tight, the drop hasn't started yet!

Did Someone Press The Panic Button?

147

panicbutton

Holy Cow!  Did Wall Street hit the panic button today?  They sure fooled me on this one, as I didn't see such a huge sell off coming so soon.  I was stuck sitting in cash on this move.  Bummer!  This changes the game plan completely of course.  Yes, the turn date for Monday or Tuesday is still valid, but it looks like it started early.

If you are all ready short... stay!  If this caught you by surprise like it did me... pray for a bounce!  I was looking for a little bit of selling today, but mainly a flat day before one final move higher.  But, at least I wasn't long the market... man that would be painful.

Ok, moving on...

I see 2 different possibilities for tomorrow.  One is... A little more selling in the morning as the late-comers' sell on the news.  Then the big boys should step up and rally the rest of the day.  I don't mean a big rally by any means... only a small up to close the day positive.Two is... The numbers tomorrow isn't as bad as the market thought (government gets out their erasers), and we gap up a little and rally early on, and sell off into the afternoon.  Either way, I'm looking to get short.  The consolidation area that formed today was in the 107.25-107.50 spy level.  That will be hard to go through, and I might go short there?  The next level of resistance is around 108.30-108.35, as should be about as high as I can see the market getting.  I'll definitely be going short there.

Tony-Caldaro-60-minute-SPY-chart-02-04-2010

Either way it plays out, this would produce a smaller wave 2 up inside a larger wave 3 down.  That means that Monday (or possibly Tuesday) would have a smaller wave 3 inside a larger wave 3 coming!

If that happens... look out below!  We are going down hard and fast!  Wave 3's are the most powerful waves and when you have one wave 3 inside another wave 3... you've got a hurricane coming!  Now understand that we might not get a bounce tomorrow?  You know how they kept all the bears (and late bulls) from going long during the rally from last March.  It was almost straight up with no pullbacks to go long on.

Well, don't you think they will do the same thing on the way down?  Of course they will!  Any bounces are going to be small and won't last long.  I'd be shocked to see a 38.2% retrace from today's sell off.  I think we'll be lucky to get 23.2%.

Regardless of how high the bounce is (if there is one?) I'll go short tomorrow into next week.  I really expect it to be ugly.  All of next week should be down, with very little chances of getting short again.  We are rolling down on the daily charts now, the weekly charts, and the monthly charts.  It's not looking good for the bulls.  We will have some bounces along the way, but I'm expecting selling into March.

What I'm doing is simple... I getting short tomorrow on any bounce higher (with those targets mentioned above in mind).  Whether it coming in the morning, (which is possible), or in the evening, I'll be getting short and holding through all of next week, and maybe into option expiration?  It depends on how fast it falls and the key support levels it hits.  When it hits heavy support, I'll go to cash, wait for the bounce, and re-enter short for a continued fall into March.

Some of you might want to ride it out, but I swing trade and will be getting in and out when support levels are tagged.  This huge down day certainly has come as a big surprise to me, and to many others too.  That's exactly how they like to play it... catch everyone off guard!

Good Luck Everyone...

Red

Waiting For The Jobs Numbers…

206

The market went basically flat today, closing slightly lower.  This was the consolidation day that I was looking for yesterday.  So, I was off a day... nobody's perfect I guess.  Regardless, I'm looking for the swing trade play, and I'm just sitting in cash for now.

I think tomorrow could be another consolidation day, just like today.  Slightly up or down, but no big move yet.  Everyone seems to be waiting on the jobs numbers on Friday.  I think it will fool everyone and be viewed as positive... which will push the market higher again.

I'm really looking for a move to 112.00 spy or better.  I'd love for it to reach 113.00, which was the major lower level of support during the 2 week battle between the bulls and bears, while inside a sideways channel.  The 115.14 was the high, and the low was just a hair above 113.00 (spy).

The ideal plan to happen is for the market to pullback a little tomorrow and then rally one more time on the fake jobs numbers Friday, as you know the government is going to lie again.  Let's just hope they do a good job of it this time.

Here a chart of what I'm looking for...

The-Chart-Pattern-Trader-spy-daily-02-03-2010

The trades you decide to take shouldn't be based on what I'm taking.  I'm very confident of this wave 3 down coming, and that's why my risk tolerance is high.  Buying short term February puts could make you a ton of money or you could lose it all too?  My indicators tell me it's going to fall, so I'll be taking higher risks.  Choose wisely....

Red

The Bulls Are Running Again…

144

bull-run

Look out bears, the bulls are back!  NOT!  I don't believe that for one minute.  This is simply the larger wave 2 up that follows the wave 1.  We are still on track for larger wave 3 to start down next Monday or Tuesday.  I was wrong about today being a flat consolidation day, as the bulls just kept on charging.  That's fine with me as I'm not short anything right now.  (Still in my USO long though).

I can't really see tomorrow continuing to rally without a pause day, but it could.  A slight pullback, and then another move higher on Thursday or Friday is the logical thing to do... but who's says the market is logical?  Regardless, I swing trade, so I'm just waiting for the short term indicators to start too rollover again.

I'm still thinking that they will surprise everyone on the job's numbers Friday.  Of course I could be wrong, and they start to sell off after they are released, but my gut tells me that every trader already knows that the numbers are horrible.  With low expectations like that, it wouldn't be too hard to beat them.  Plus, they have a habit of tricking the bears a lot too.  Never under estimate the government.  They will fool you every time.

So hang tight everyone... our time is close now!

Red

P.S. I'll be buying straight puts on the SPY on Friday or Monday.  It depends on how high we go, as to which strike price I'm going to buy.  I'll be looking to buy February puts, as the move down should fall into this coming expiration on the 19th.  Everyones' risk tolerance is different (mine is quite high), but I'm looking for a strike price that is "out of the money" by about 2 points from the high.

So, for example... if we hit 112.00 on the spy by Friday, then I'll be buying the 110.00 strike price.  If we are lucky enough to hit 114.00, then I'll be buying the 112.00 strike price.  Remember, I'm looking for about a 100 point move down before option expiration.  That's a 10 point move on the SPY.  That's a HUGE move folks!  You could make 5 times your money in a 2 week period... or you could lose it all?  It all depends on what the market does, and I believe it's going to crash.  What do you believe?

Up As Expected…

613

Sorry for the late post today folks.  The market went up as expected, and should continue throughout the week.  Tomorrow should be a consolation day, before another move higher.  Again, I'm staying long my USO calls until Friday or the 38 level.

I don't know how high the market will reach by Friday, but the 1120 area isn't out of of the question.  Regardless of where it is, I'll be going short on Friday, as it could start the larger wave 3 down on the following Monday.  Now keep in mind that Monday could go up a little and the down move wouldn't come until Tuesday the 9th.  That's my actual projected turn date... but, it might come early, and I don't want to miss it.

I would rather ride out a little pain to the upside on Monday, then to see Monday crash and I'm not short yet.  Anyway, I'm tired, and haven't had a chance to do anything today.  I got home really late and now I'm posting late.  So, I'll end here.  Just stay patient, as the big one is coming soon!

Red

Weekend Update…

582

What a wonderful time it is to be a bear!  The market just keep on selling into Friday, closing around 1071, surprising even me.  I said in last weeks post that I believed we would pierce the 1080 level intraday to trick the bears into believing the level has broken, and pierce did we ever!  We went straight through it, and continued on down to a low of 1071.59, which probably had the bears jumping up and down thinking the next level is 1030-1040 area.

Not so fast Mr. Bear (I am one... by the way).  Every down move will have a bounce back up from time to time... and that's exactly what I'm looking for next week.  A rally back up to at least 1100, or maybe as high as 1120 is overdue, and should occur next week.

Looking back at the chart I posted on last weeks "Weekend Update", I see that it played out fairly well.  I was off on the 1080 level holding, but other then that... it's pretty accurate.  I believe the breaking of 1080 is a bear trap, as it requires 2 days below the level to confirm the break, which would allow the market to fall to the next level around 1030-1040 (I don't see that happening).

Last Weeks' Chart....

Tony-Caldaro-60-minute-SPY-chart-01-24-2010

So, looking ahead to Monday, I believe we might have a gap down in the morning, followed by a rally up to close the day positive.  If the gap down doesn't occur, then it might just rally up and sell off a little in the evening... but I still expect a positive (or flat) close on Monday.  I don't think it will close down big again, like Friday.  It should be a flat to up day, for the market to consolidate before a move higher to 1100-1120 by Friday the 5th, (or Monday the 8th at the latest), as the finally high before wave 3 down starts.

To be on the safe side, I will most likely be going short on Friday the 5th, not Monday, as I don't want to miss out if it crashes Monday instead of Tuesday.  Since the first larger wave 1 down from 1150 to 1071 is 79 points, wave 3 down should be well over a 100 points before it's finished.  Whatever you do... don't go long on anything!  No dip buying, only "sell the rips"!  You will get killed if you go long in this market once larger wave 3 starts!

This Weeks' Updated Chart...

Tony-Caldaro-60-minute-SPY-chart-01-31-2010

Once the larger wave 2 up is finished by next Friday (or Monday), you should get short and stay short until options expiration on Friday the 19th.  This larger wave 3 is probably going to last until then (or longer).  This second cut through of 1080, on the down move from whatever high we reach this Friday, should pierce it quickly and not look back.  The first decent bounce level is at 1030, and should cause a pause day to occur, before the selling continues.

Once it breaks... hold on to your hat Nellie, as this is going to be one hell'uva ride down!  The 1000 level should also be heavily protected by the bulls, but when it breaks... look out!  We're going to 910-920!  This is a rare opportunity to make a ton of cash as this thing falls.  I will be holding on for dear life, as it's going to be scary as hell!

Best of luck to all of you...

Red

Are They Walking Off A Cliff?

383

walkin-off-cliff

Is the selling every going to stop?  Yes... at least for a short while I believe.  I'll make this brief, as I'll do more research and post it on my weekend update.  I believe that we may gap down on Monday and rally back to close positive, or simply open up positive, sell off a little and rally back to close positive.

Either way, I think Monday will close positive or flat.  I think this move below the major support level at 1080 is to trap shorts.  I still see next week as a positive week, most likely creating our larger wave 2 as I posted on last weeks' Weekend Post.

I've said throughout the week on different blogs with my comments that it should go back up to 112.00 area.  Since the sell off went so low, I'm not sure if it will make it that high?  Maybe, but 110 is more likely now.  We'll see.  But for now, I'm still long on the USO, and don't have any shorts right now.  I'll reload next Friday most likely in anticipation of wave 3 down coming the following week.

Red

Another Volatile Day…

7

ben-bernanke-re-elected

Gap UP, then Sell off hard... back up, down, up, and down!  Whew... what a day!  We did go lower intra-day to tag the 107.91 spy level, which should complete the 5 wave move down, of the larger wave 1 down.  It was possible that yesterday's 1083 was the end, but it turned out to go lower today to 1079... which hit the lower channel perfectly.

Are we finished with the larger wave 1 now?  I'm not sure yet... but we're close.  I could see another little push down tomorrow morning, and then a move back up to close around flat.  Then a move up all next week, just as forecasted on my weekend update.  I think that the support will hold this week around 1080, and the traders will calm down over the weekend and start buying again next week.

How high we go is unknown, but the ideal place would be 112.00 spy by the end of next week.  I did not go long on the SPY as I don't trust the up move next week.  We could just go sideways next week, and either end the week flat or only up a couple of points.  It not worth the risk for only 1-2 points on the SPY.  So, I decided to go long on the USO, buying the 35 call for $1.60 today.  I'm looking for a move to around 38 by the end of next week.

So, for tomorrow... I don't expect much more selling.  A flat day is my forecast.  Then a small retracement rally all next week.  It's risky right now to go long on anything... but I think I'll be fine with the oil trade.  I just wouldn't touch the spy right now, as it's in good support now which could break or bounce?  It's safer to sit and wait for now.

Red

We May Be Done With The Selling For Now?

17

george-w-bush-whisper-in-obama-ear

The market looks like it completed 5 waves down in this larger wave 1 from 1150.45 to 1083.11 today.  I was looking for a wave 4 up and 5 down, as I posted on my weekend post, and I think we may have gotten it?  If Obama doesn't mention anything about Wall Street (as I suspect he doesn't have George W. telling him what to say... if so, look out! A crash is coming!  LOL!)... then the market will probably start a "week long"... larger wave 2 move that I'm expecting.

I think that elliottwave, fib's, ta's, and support and resistance levels... work really well when the market is in a trend.  I think we are now in a new trend... down of course!  That's why I think the forecast I put up last Sunday is tracking as well as it is.

During the last several months, when the market wasn't trending, but instead... stuck in a channel, forecasting was very tough.  I don't think I got half of the moves right back then?  Maybe it's just blind luck this time?  Either way, I'm happy that it's working this time.

So, if all continues as planned, then a slow grind back up to about 112.00 is expected over the next week or so.  Of course it will be choppy and great for day traders.  But, I like to trade trends, and I think the next one is up for a little while.

If you're playing options, then I wouldn't go straight long as the IV will kill your option price because the VIX is going to drop while the market goes up.  The only way to win is to do a spread or buy deep in the money calls.  It's still risky of course, but that's what trading is all about.

Red

Waiting On Obama…

620

obama-salutes-with-left-hand

The market is looking pretty scared right now.  It rallied a little, and then sold back off into the close.  Tomorrow night is what the market is waiting on.  Although I think we will go up into the events, it is possible that we sell off tomorrow in anticipation of bad news from Obama... (which never happens as he's a great liar) and then start the 2-5 day rally from the low tomorrow.

It's hard to guess at this point?  I'd only recommend that if you are already short... stay short.  We are either going down into the events (FOMC meeting at 2:15 and State of the Union after-hours) or down after them.  Either way, I expect 108.00 to be hit.  I will look to close my shorts there... assuming that it doesn't pierce the level with huge volume!

That's one of those "iffy's" as I'm only assuming that it will hold on the first hit.  Now that's on a "closing bias", not intra-day.  I do believe we could pierce it intra-day to suck in more bears, and then close right at the support level... which could setup a good place for a bounce... with "could" emphasized!

This is a tough place to be if you aren't already short.  You Damn sure don't want to go long when it hits 1080, as it's way too risky!  So, you hope for a rally into the FOMC meeting, or a rally on Thursday (after Obama yaps his jaws late Wednesday night).

I'm sure our smart President will save us from this mess we're in... right?  After all, I know how Patriotic he and his wife are... just look closely at how well they honor the Pledge of Allegiance by holding their right hand over their heart (ops... that's their left hand!  Must be a new trend to use your hand with your wedding ring on it?)

Red

So Far So Good…

170

So-Far-So-Good-by-Bryan-Adams

Looks like the market rallied a little today as expected.  I don't have anything to add today, as I explained it all in my weekend post.  I'm looking for another flat to slightly up day tomorrow, and Wednesday.  I'm still looking for a fall to 108.00 SPY by Friday (or Monday).

I expect the market to sell off either Wednesday afternoon, or Thursday.  It should hit the 108.00 level by Friday or Monday, and then I expect a 2-5 day rally.  Nothing much has changed from my weekend post.  So far everything is following the plan.  Of course life is never that easy, and it wouldn't surprise me if something happened too throw the plan off.

Hmmm... what could it be?  At break of the 108.00 SPY level would cause a huge sell off to occur!  Let's hope it holds on the first hit, and rallys back up.  I'd like another opportunity to get short again from a higher level.  So for now, I expect the level to hold and produce a bounce.

Red

Weekend Update…

39

It looks like the tide has finally changed!  There is no doubt now that this market has officially rolled over, and is heading down!  I have to say that this took me by surprise.  I really expected them to pull it back to 1115 spx and then rally one more time into 1160-1180 area. But,  I don't see that as possible now.

Why?  Because the tables turned on them when Scott Brown won the Senate race in Massachusetts.  That state has been a Democratic state since 1972, withTed Kennedy leading it.  He has been a very powerful voice in the Senate all those years for the Democrats, and now he's replaced by a Republican.

I now see how important that is, as I didn't put the pieces together last weekend when I charted out my forecast.  I never realised how critial that seat was.  Obama's Democrats aren't in control of the Senate anymore, and this puts his health bill at risk, as well as any other agenda that he wants passed.

This has changed the "Grand Plan" that the "power's that be" wanted.  They... I believe at least, wanted to take this market higher into the February 9th-10th time frame.  Why?  Well, not too sound like anymore of a conspiracy theorist then I already am, but I'll go ahead and spill the beans now.

Ok...

What happens with these crooks is that they decide well in advance... which direction to take the market, and for how long (you should already know that... if you've been reading this blog for awhile).  They can do this because they manage to get key positions filled in politics, with one of their buddies (aka Ben Bernanke and Tim Geithner... both former Goldman Sachs boys).  This allows them to get free money (aka the TARP funds), and to get policies and laws changed to allow them to profit more.

This isn't only about "buying up their own stock" with the TARP funds, and then issuing new shares to the retail public at the high in the market, and then taking the money and paying back the TARP (aka... our taxpayer money).  Oh NO, that's not good enough for them.  They profit from it in both directions!  Yes, the decide when to "Tank" the market too, and steal the money from the average retail investor's 401k or pension fund money too.  Lot's of "Insider Trading" and secret payoff bonus checks for "service's rendered"... whatever that is?

They are well organized and plan everything in detail.  They set up these Annual Summits where they all meet and "cash their checks"... so to speak.  Basically, they funnel all the profits they've stole from the un-suspecting public through the Vatican and into "out the country" bank accounts.  The next annual summit is being held on February 4th-6th, 2010.  In the past, after every summit (within a few days), the market has started a huge sell off.  I know this all sounds kind of "Cloak and Dagger" stuff, but the fact it continues to happen should tell you that it's real.

Essentially, the checks all clear on the following couple of days, and then the market tanks.  They release some kind of news event to cause it to sell off.  It could be anything?  I think that they had planned for Obama to release his "We're going to get tough on the banks" speech on either the 9th, or 10th?  But, losing the senate seat to a Republican forced him to move up the time line.

The one thing I didn't see when I made my forecast last week was how serious it was when Scott Brown won.  I'm sure the death of Ted Kennedy wasn't planned, but it did happen... and that changed the plan.  So, does that mean that I don't see the market crashing on February 9th-10th?  Not at all!  In fact, it sets up the perfect "Wave 3" down after a nice corrective wave 2 back up to occur over the next 2 weeks.

Tony-Caldaro-60-minute-SPY-chart-01-24-2010

Looking at this 60 minute chart of the SPY, I think we just finished a wave 3 down inside a larger wave 1.  That means that Monday and maybe Tuesday should produce a wave 4 up, and then one final wave 5 push down into the end of next week.  The target is 1080 SPX.  After that, we should have a larger wave 2 up... hopefully into the time frame window of February 9th-10th.  That allows the crooks to get their checks cleared on Monday the 8th.

I expect some bad news to be released or some bad event to occur that will trigger the larger wave 3 down.  This is the one that could go down 97 points on SPX, as I talked about a week or so back.  I don't know if that is going to be accurate, but it wouldn't surprise me if it was.

That larger wave 3 down should take us into the options expiration date for February.  At that point, I'll have to look at where we finally stop at and see if that whole move down from 1150 spx is more likely a ABC, which would end it there, or a 5 wave move, which would mean that it will fall further.

If it's a 5 wave move, then we should go up into a larger wave 4 starting the week after opx.  That might take until the end of February or so, and then finally a larger wave 5 down into early March.  But that is all just guessing at this time.  We'll have to cross that road once we get there.  For now, let's focus only on the 2-5 day corrective larger wave 2 from the expected 1080 low coming.

I do think that it will be higher then we might expect, as the bulls aren't quite dead yet.  Some news event to spark a rally is all that it will take.  Maybe they will re-elect Ben Bernanke, and the market will use that excuse to start the rally.  Of course it will also start big bear squeeze on all those caught short at 1080, which could push it higher then I expected?

Again... I will still be looking for the major turn date about February 9th-10th.  That's one of the best opportunities of a lifetime... the absolute best one will come in about a year or so.  But for now, catching a larger wave 3 inside of a Primary wave 3 inside of a Major wave 1 (the entire 5 larger wave move from 1150... to maybe 920 area?)  is still extremely powerful, and profitable... if you're on the right side?

Of course after this big move is over in late February or early March, you should expect a long drawn out choppy Major Wave 2 to take us though the summer months.  Look out for September though... (keep all windows in high story buildings locked, or you might have someone jumping out one?)

Red

It’s A Great Day To Be A Bear…

344

bears-standing-up

Another huge sell off... unbelievable!  I was wrong again, as support at 1115 broke and down we went!  I hope all of you that were short... stayed short, and didn't get out as I posted yesterday.  I guess I've been so conditioned to expect a rally to occur after any big down, that I simply couldn't believe that it would continue selling again today.

It's taken the PPT almost a year now to condition all the bears to close out their short positions after only one day of selling, as we have always had them come back in and squeeze the bears... killing any serious sell off from starting.  I have to change my thinking now, and expect any rally to be short lived, and the selling to continue down.

OK, of course this changes my forecast, and I'll go into detail on the weekend post.  But for now, I'd expect an 60-70% chance of a bounce on Monday and maybe Tuesday, and then more selling until we hit the master level at 1080 spx.  At that point, I'd say will have a 90% chance of a 2-5 day bounce.  It could just go down Monday and tag the level, and then reverse to start the 2-5 day bounce?  But, I think it will wait until Tuesday or Wednesday... then dump to 1080.

I just think that people will calm down over the weekend and allow the market to float higher on Monday, and maybe Tuesday.  Then more selling to 1080, at which point I will probably go long for the bounce.  I expect that it might pierce the 1080 level intraday and trap a lot of bears short... thinking that it broke the major support level, only for it to be rallied back up the next day (or later that day) in a big short squeeze.

But, after the rally is over... more selling is coming!  It will be a Wave 3 Down... and you know what that means!  Panic Selling!  I held my short over the weekend and will wait for the 1080 level to be hit before I get out.  I'll probably go long, but I'm not sure?  Yes, there is a 90% chance of a 2-5 day bounce... but too be quite frank with you, I might be too scared to chance it?  We'll see...

Red

s2Member®